Corrigendum: Comprehensive Analysis of N6-Methylandenosine-Related Long Non-Coding RNAs Signature in Prognosis and Tumor Microenvironment of Bladder Cancer
 Kang Chen
 Shaoming Zhu1†
- 1Department of Urology, Renmin Hospital of Wuhan University, Wuhan, China
- 2Department of Urology, Suizhou Hospital, Hubei University of Medicine, Suizhou, China
To investigate the role of N6-methyladenosine (m6A)- related long non-coding RNAs (lncRNAs) in bladder cancer (BC). 50 m6A-related lncRNAs were screened out and were correlated with prognosis from BC samples in The Cancer Genome Atlas (TCGA). The lncRNAs were subdivided into cluster 1 and cluster 2 with consensus cluster analysis, and it was found that lncRNAs in cluster 2 were associated with poor prognosis and increased PD-L1 expression. Gene set enrichment analysis (GSEA) revealed tumor-related pathways in cluster 2. Through least absolute shrinkage and selection operator (LASSO) Cox regression analysis, univariate and multivariate Cox regression, and ROC analyses, 14 prognostic lncRNAs were selected and used to construct the m6A-related lncRNA prognostic signature (m6A-LPS), furthermore, that m6A-LPS was as a valuable independent prognostic factor. Interestingly, the m6A-LPS risk score was positively correlated with the immune score, PD-L1 expression, and the infiltration of immune cell subtypes in BC. SNHG16, a member of the high-risk group based on m6A-LPS, was highly expressed in BC tissues and cell lines and interfered with siRNA resulted in suppressed proliferation, migration, and invasion in vitro. Our study illustrates the role of m6A-related lncRNAs in BC. The m6A-LPS may be an important regulatory target of the tumor microenvironment (TME) in BC.
Introduction
Bladder cancer (BC) is the 10th most common cancer globally (1) and is characterized by high morbidity and mortality rates (2). Most BCs are urothelial carcinomas, of which approximately 75% are non-muscle-invasive and 25% are muscle-invasive or metastatic cancers (3). Non-muscle-invasive bladder cancer (NMIBC) has a high recurrence rate after resection and can develop into muscle-invasive bladder cancer (MIBC). MIBC has a poor prognosis and often recurs after the first resection (4). Although some advanced urinary assays could detect the early-stage bladder cancer leading to early treatment, the approach to predict the prognosis of bladder cancer and help clinical decision making is lacking and unsatisfied (5, 6). Despite the application of targeted therapy, immunotherapy, and antibody-drug conjugates for the treatment of advanced BC, the objective response rate (ORR) is still low (7). The immune checkpoint inhibitors (ICIs) treatments are currently applied during or flowing platinum-based chemotherapy, and also as the first-line therapy for the platinum ineligible metastatic bladder cancer (mBC). About 15-30% mBC is the response to ICIs treatment (8), indicating that the majority of patients do not benefit from ICIs. It is still a challenge to identify patients who will benefit from ICIs treatment and to improve the ORR. In addition, it is of great significance to predict and differentiate tumors of different subtypes based on tumor heterogeneity to individualize treatment approaches and improve the therapeutic effect while reducing the application of unnecessary treatment. However, the existing pathology-based diagnosis strategy does not reflect the intrinsic characteristics of the tumor. For example, even in the same pathological stage and grade of BC, the biological behavior of the tumor may be completely different (9). Although the molecular typing system can better reflect the intrinsic characteristics of BC than traditional pathological typing, it is not viable for clinical application because of its high cost and complexity. Therefore, the search for new economically viable and effective prediction methods is of great significance for improving the prognosis of BC and realizing individualized treatment.
N6-methyladenosine (m6A) is one of the most important modifications of RNA and mediates more than 60% of RNA methylation events (10). In general, m6A methylation plays an important role in the regulation of gene expression by modulating RNA splicing, translation efficiency, and mRNA stability (11). m6A modification is dynamic and reversible and consists of methyltransferase complexes (m6A “writers”), demethylases (m6A “erasers”), and m6A-binding proteins (m6A “readers”) (12, 13). In recent years, scientists have reported that m6A modification can affect tumor initiation and progression in various cancers, including BC (14). For example, METTL3 accelerates the maturation of pri-miR-221/222 in an m6A-dependent manner and promotes the proliferation of BC cells (14).
Long non-coding RNAs (lncRNAs) are non-protein-coding RNA molecules more than 200 nucleotides in length (15). In patient tumors, the abnormal expression of lncRNAs is a common biological phenomenon that is closely related to patient prognosis. For instance, the lncRNA metastasis-associated lung adenocarcinoma transcript 1 (MALAT1) was initially discovered in lung cancer, and the overexpression of MALAT1 is associated with a poor prognosis among patients with lung cancer (16). LncRNA LBCS inhibited the SOX2, stem cell factor, to suppress the self-renewal and enhance chemosensitivity in bladder cancer. In addition, lncRNA DANCR, BLACAT2, and LNMAT2 promote the lymphatic metastasis of bladder cancer (17–20). However, little research has been conducted on whether the expression of lncRNAs through m6A modifications affects the occurrence and development of BC. Therefore, understanding the role of lncRNAs modulated by m6A in BC helps identify biomarkers that can be used as meaningful therapeutic targets. However, the relationship between m6A-related lncRNAs and the response of BC to ICIs is still not fully understood, and the interaction between these lncRNAs and the tumor microenvironment (TME) needs to be further explored.
This study aimed to evaluate the correlation between m6A-related lncRNAs and the prognosis of BC. We identified 50 m6A-related lncRNAs related to the prognosis of BC and constructed a prognostic model for BC using bioinformatics methods in The Cancer Genome Atlas (TCGA) dataset. Furthermore, we investigated the possible roles of the selected m6A-related lncRNAs in the progression of BC by gene set enrichment analysis (GSEA) and single-sample gene set enrichment analysis (ssGSEA). In addition, we studied the relationships among these lncRNAs, programmed death-ligand 1 (PD-L1) expression, and the TME to determine whether the signature could be used to predict the response of BC patients to ICIs and immunotherapy.
Materials and Methods
Raw Data and m6A Gene Acquisition
We acquired BC transcriptome data and clinical data from TCGA (https://portal.gdc.cancer.gov/). The data for 434 BC samples, including 414 tumor samples and 19 normal samples, were downloaded. Nineteen normal samples were the paracancerous tissues of 19 of the 414 BC patients in the TCGA dataset. After excluding 6 duplicate samples and 2 samples without complete survival time and status, 406 of 414 tumor samples had complete clinical information and were included for further study. The clinical characteristics of these 406 patients with BC are shown in Table 1. According to previously published literature, we identified 23 m6A RNA methylation regulators based on TCGA BC dataset gene expression information. These 23 m6A regulators comprised 8 writers (METTL3, METTL14, METTL16, KIA1499, WTAP, RBM15, RBM15B, and ZC3H13), 2 erasers (ALKBH5 and FTO), and 13 readers (YTHDF1, YTHDF2, YTHDF3, YTHDC1, YTHDC2, HNRNPA2B1, HNRNPC, IGFBP1, IGFBP2, IGFBP3, FMR1, LRPPRC, and RBMX) (21).
TABLE 1
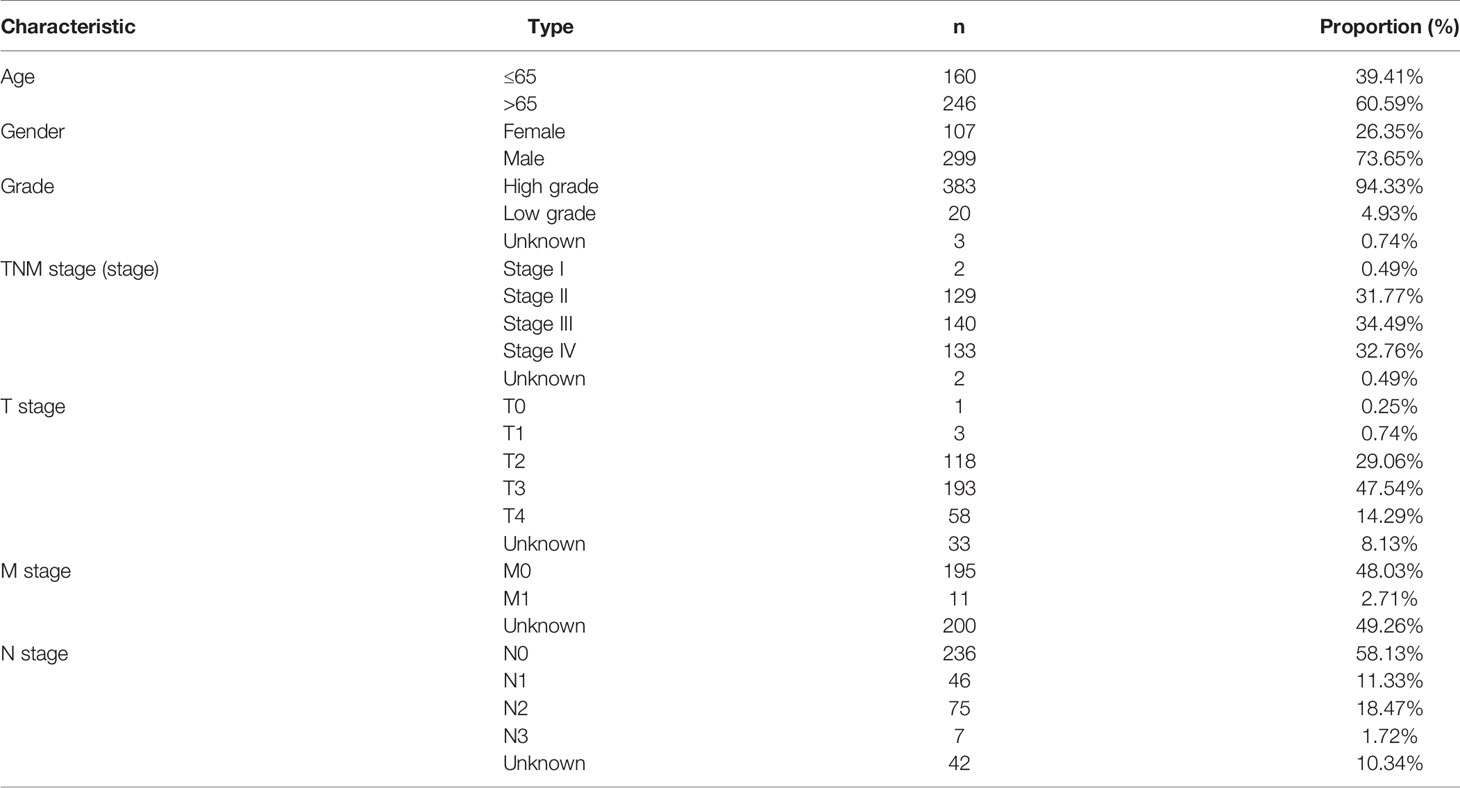
Table 1 The clinical characteristics of BC patients in the TCGA datasets.
Bioinformatic Analysis
Pearson correlation (|Pearson R| > 0.4 and P < 0.01) was implemented to identify lncRNAs correlated with m6A genes to identify m6A-related lncRNAs. Based on clinical survival data from TCGA datasets, we further identified m6A-related lncRNAs related to prognosis (p<0.01).
Patients with BC were divided into different subgroups by the ConsensusClusterPlus package (22) according to the expression of m6A-related lncRNAs related to prognosis. GSEA was performed, and hallmark gene sets were downloaded from the Molecular Signatures Database (MSigDB) (23); next, the enrichment results were selected based on the normalized enrichment score (NES) and a false discovery rate (FDR) value <0.05 to explain the survival differences between the different BC subtypes.
Next, the least absolute shrinkage and selection operator (LASSO) Cox regression was performed with the R package “glmnet” to construct the m6A-related lncRNA prognostic signature (m6A-LPS) (24). The risk score was calculated with the following equation: Risk score = (Coefi represents the coefficients, and xi represents the fragments per kilobase of transcript per million mapped reads (FPKM) value of 50 m6A-related lncRNAs related to prognosis). According to this equation, we calculated the risk score for each BC patient. Then, taking the median risk score as the cutoff point, the patients were divided into a high-risk group and a low-risk group.
To estimate the prognostic capability of the risk score for 1-, 3-, and 5-year overall survival (OS), receiver operating characteristic (ROC) curves were carried out to assess the area under the curve (AUC) values (25). To determine the independent prognostic factors in BC, we analyzed the prognostic relationships between the risk score and gender, age, WHO grade, and stage based on univariate and multivariate Cox regression analyses. We then constructed a nomogram with integrated prognostic features to predict the 1-, 3-, and 5-year survival rates of patients with BC.
The immune score and stromal score of each sample were calculated in TCGA datasets using Estimation of Stromal and Immune cells in Malignant Tumor tissues using Expression data (ESTIMATE) algorithm via the “estimate” R package (26). For each sample, we quantified 22 types of infiltrating immune cells with cell type identification by estimating relative subsets of RNA transcripts (CIBERSORT) (27) and then selected samples with a CIBERSORT P-value <0.05 for subsequent analysis to compare differences in immune infiltration levels between the subgroups grouped by cluster subtype and risk score. In addition, we used ssGSEA to investigate the differences in immune cell infiltration and immune function between the high-risk and low-risk groups (28).
Samples and Quantitative Real-Time Polymerase Chain Reaction
Thirteen nonneoplastic and neoplastic samples from patients who underwent surgical treatments were obtained from the Renmin Hospital of Wuhan University in 2019. To evaluate SNHG16 expression, we extracted total RNA from clinical BC samples using RNA TRIzol reagent (Invitrogen, Carlsbad, CA, USA). Reverse transcription was carried out using the iScript cDNA Synthesis Kit from Bio-Rad. qRT-PCR was conducted on a LightCycler® 480 Real-Time PCR System (Roche, Germany). The relative lncRNA expression levels were calculated using the 2^-ΔΔCt method with GAPDH as an endogenous control. The primer sequences used were as follows: SNHG16 forward 5’- CCTCGTGCCAGTAACTCTGAAATC-3’ and reverse 5’- CTCAGTCACCAGAAACGAAACAC-3’; GAPDH forward 5’- GGAAGCTTGTCATCAATGGAAATC-3’ and reverse 5’- TGATGACCCTTTTGGCTCCC-3’.
Cell Culture
The human BC cell lines 5637 and T24 and the immortalized human bladder epithelial cell line SV-HUC-1 were purchased from the Cell Bank of the Type Culture Collection of the Chinese Academy of Sciences, Shanghai Institute of Biochemistry and Cell Biology. 5637 and T24 cells were cultured in RPMI 1640, and SV-HUC-1 cells were cultured in F12K medium with 10% (Gibco, Grand Island, NY, USA) and penicillin-streptomycin (100 U/mL) at 37°C with 5% CO2.
siRNA Transfection of Cell Line
5637 cells were transfected with small-interfering RNA (siRNA), and a negative control siRNA (Sangon Biotech, Shanghai, China) using 5637 was transfected with siRNA (Sangon Biotech, Shanghai, China) using Lipofectamine 2000 transfection reagent (Invitrogen). The siRNA sequences were 5’-UGGAAGAGCCUAAGAGGAATT-3’ (sense) and 5’-UUCCUCUUAGGGCUCUUCCATT-3’ (antisense). A negative control (NC) was transfected simultaneously with the siRNA. The NC sequences were 5’-UUCUCCGAACGUGUCACGUTT-3’ (sense) and 5’-ACGUGCCACGUUCGGAGAATT -3’ (antisense). The knockdown of SNHG16 expression following siRNA transfection was verified by qRT-PCR.
CCK-8 Cell Viability, Scratch Wound Healing, and Transwell Invasion Assays
A total of 5637 cells were seeded into 96-well and 6-well plates. When the cells reached 30–50% confluence, they were transfected with either SNHG16 siRNA or the NC. At 0, 1, 2, 3, and 4 days after transfection, CCK-8 solution was added at a ratio of 1:9 to the 96-well plates, and optical density (OD) values at a wavelength of 450 nm were measured by a microplate reader. Transwell invasion assays were performed to detect the invasive ability of the cells. The upper layer of the transwell chamber was coated with Matrigel (BD Biosciences, USA); the cells were seeded into the upper chamber with medium without FBS, and the lower chamber was filled with complete culture medium. The cells were cultured in a humidified 5% CO2 incubator at 37°C for 24 hours. The invaded cells were fixed in 4% paraformaldehyde for 5 minutes and then stained with 0.3% crystal violet (Solarbio, China). The invading cells or migrating cells were counted under a light microscope.
Statistical Analysis
Data were analyzed using R software version 4.0.2. Correlations between m6A genes and lncRNAs were analyzed by Pearson’s test, and a P-value <0.01 was considered significant. The log-rank test was used to compare Kaplan-Meier survival curves between various subgroups, including cluster subtypes and low- and high-risk subgroups. Group comparisons for continuous data were accomplished by Student’s t-test and one-way ANOVA. Categorical variables were compared using chi‐square tests. Univariate and multivariate Cox regression analyses were used to validate the independent prognostic factors for BC. A P <0.05 was considered significant.
Results
Acquisition of m6A-Related LncRNAs in BC
We identified 14,086 lncRNAs in the TCGA datasets by analyzing the annotated files downloaded from the GENCODE website. Then, 23 m6A gene expression matrices were extracted from the TCGA datasets. LncRNAs associated with one or more m6A genes (|Pearson R| > 0.4 and P < 0.01) were defined as m6A-related lncRNAs. Through Pearson’s correlation analysis, 414 lncRNAs were found to be significantly related to the m6A genes in the TCGA datasets. The specific process of this study is shown in Figure 1A. We obtained the coexpression network of m6A genes and m6A-related genes, as shown in Figure 1B. Next, according to the clinical survival information from the TCGA datasets, we screened 50 m6A-related lncRNAs with a significant prognostic value from the 411 m6A-related lncRNAs (P < 0.01). The risk ratio forest plot revealed that there were 40 low-risk and 10 high-risk m6A-related lncRNAs (Figure 2A and Supplementary Table S1). Figures 2B, C show the differences in the expression of m6A-related lncRNAs between 406 tumor tissues and 19 tumor-adjacent normal pairs from the TCGA dataset. Except for RAP2C-AS1, AC025280.1, ATP1B3-AS1, AC087286.2, AC012568.1, AC007686.3 and BDNF-AS, the other m6A-related lncRNAs were highly expressed in BC tissues (P < 0.05). These results suggested that these 50 m6A-related lncRNAs possess essential biological roles in BC development.
FIGURE 1
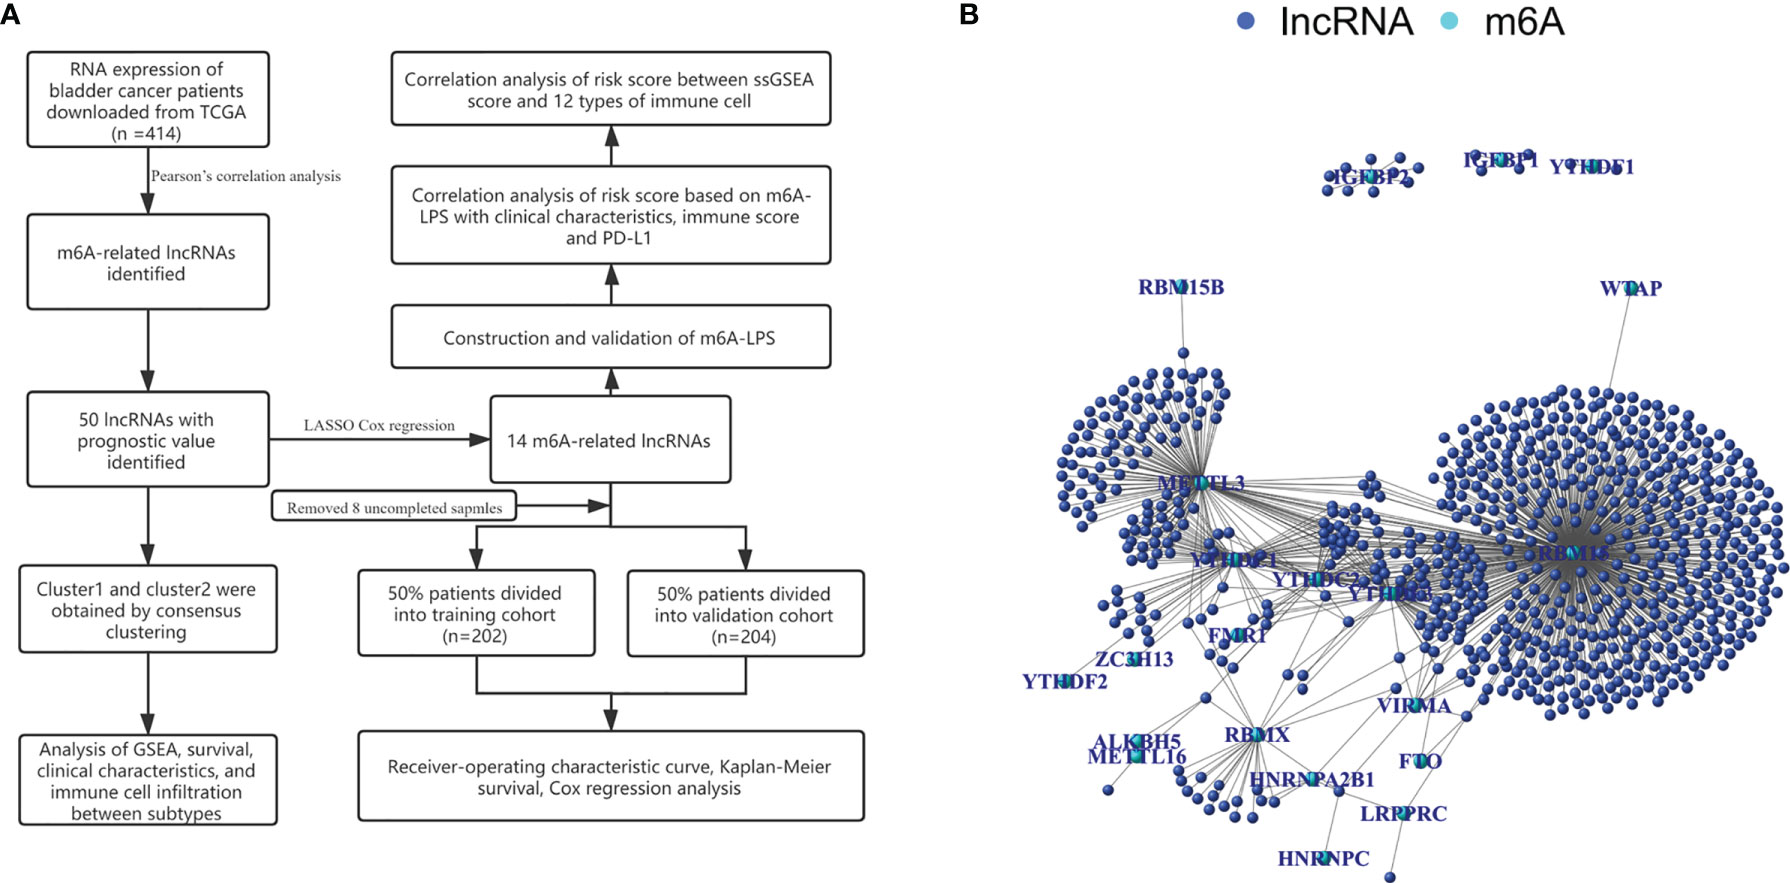
Figure 1 (A) Research flow chart. (B) The coexpression network of m6A-related genes and m6A-related lncRNAs.
FIGURE 2
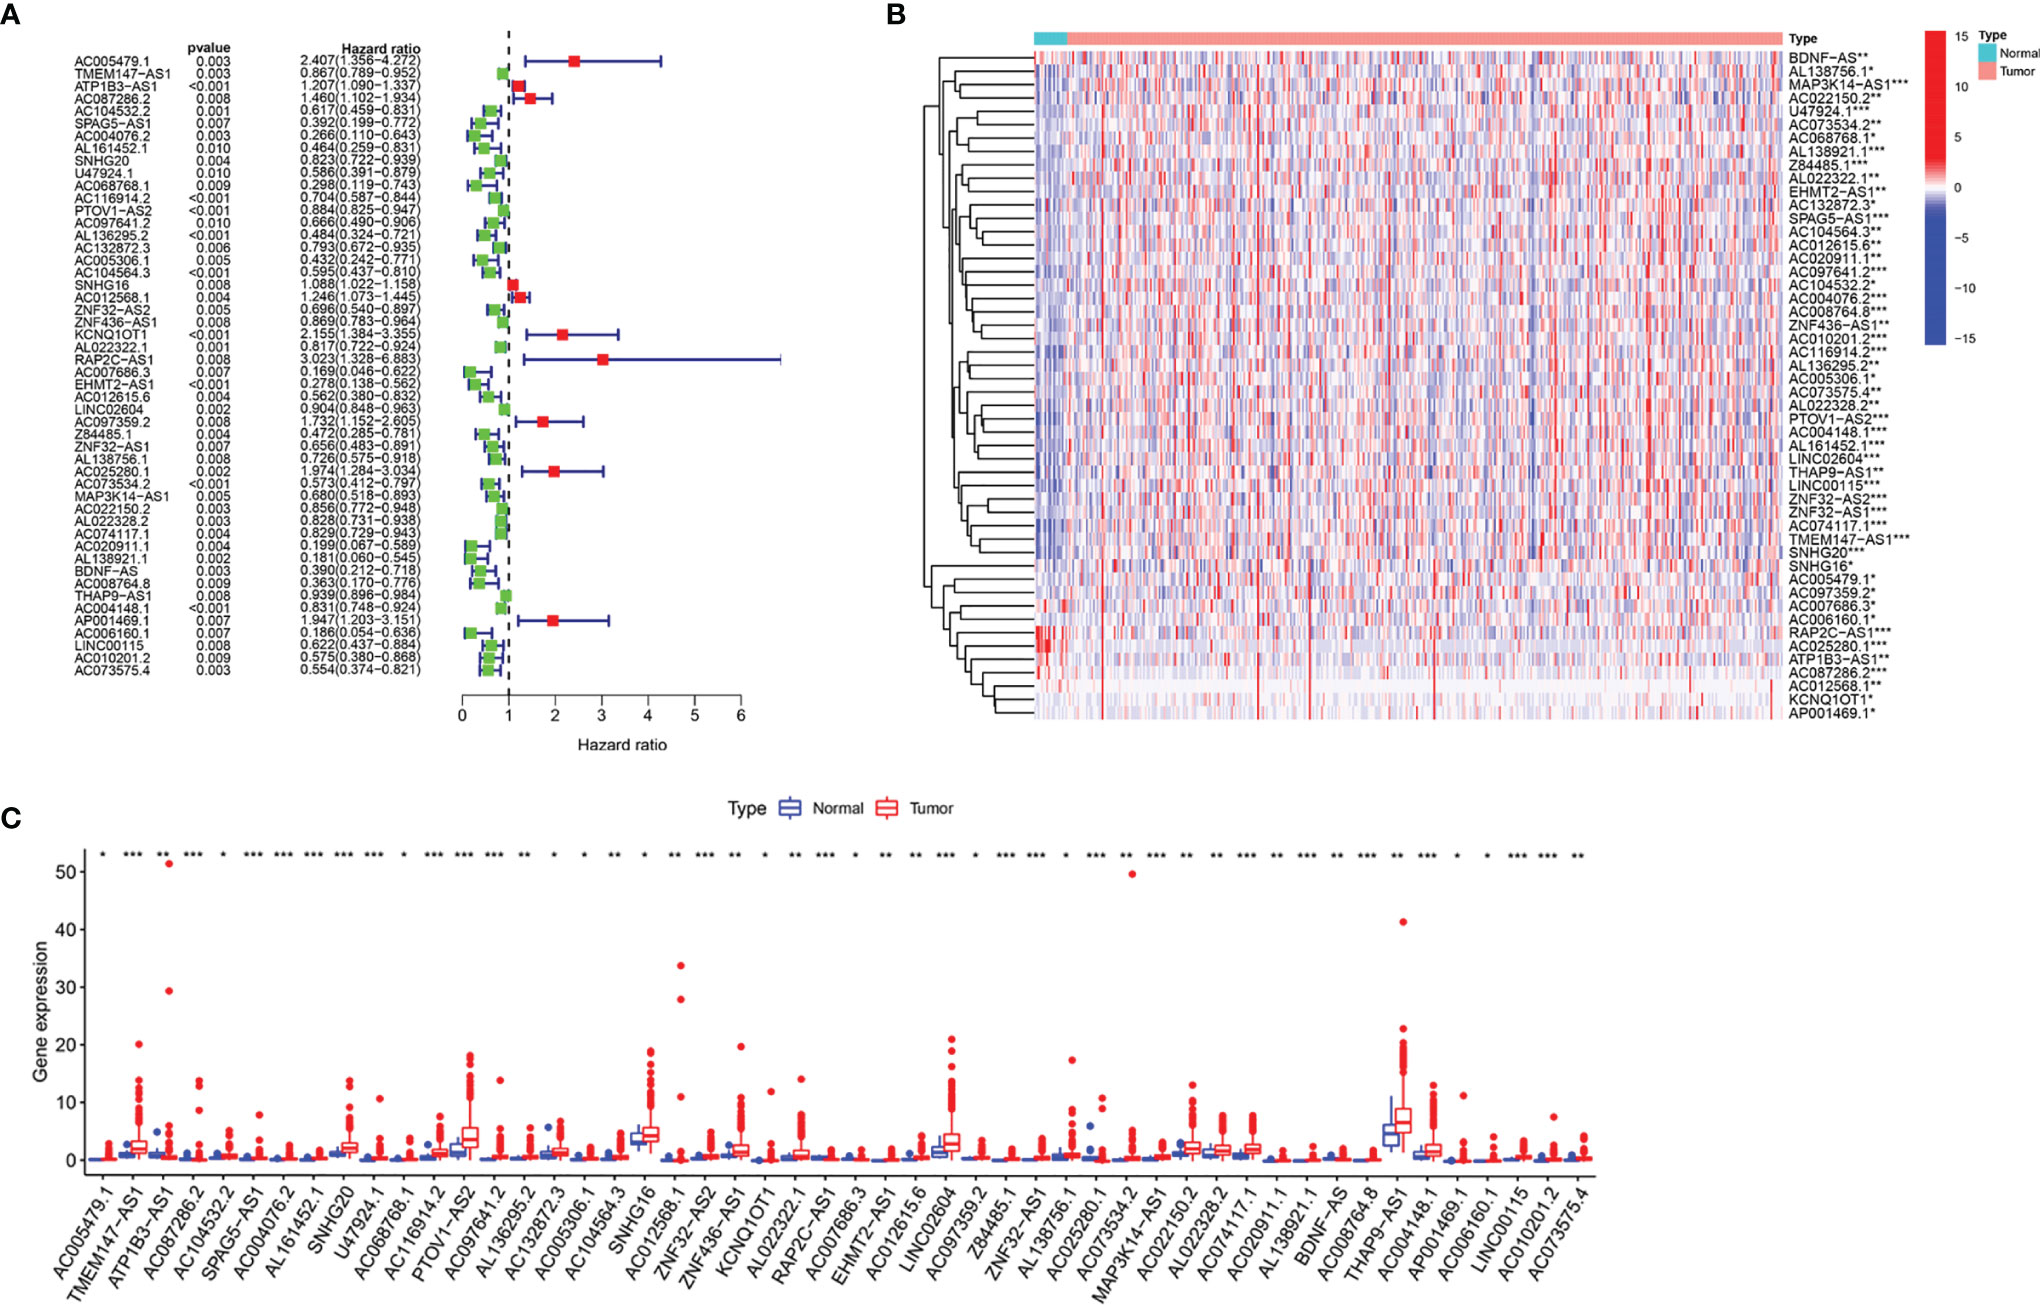
Figure 2 The differences in the expression of m6A-related lncRNAs in the TCGA datasets. (A) Forest plot of the hazard ratio for m6A-related lncRNAs. (B, C) Heatmap (B) and expression levels (C) of 50 m6A-related lncRNAs in tumor and adjacent normal tissues. *P < 0.05, **P < 0.01, and ***P < 0.001.
Consensus Clustering Showed That m6A-Related LncRNAs Were Closely Associated With the Clinical Characteristics and Survival Rates of Patients With BC
To verify the prognostic value of m6A-related lncRNAs, we conducted consensus clustering analysis on 406 BC samples using 50 m6A-related lncRNAs. Based on the similarity of the expression of m6A-related lncRNAs, we determined that K = 2 had the best clustering stability (K = 2 to 9). Then, we divided 406 BC samples into two subgroups, cluster 1 and cluster 2, for further analysis (Figure 3A). Figure 3B shows that most of the 50 m6A-related lncRNAs were highly expressed in cluster 2. The clinicopathological features between the two subtypes were then compared (Figure 3B). Cluster 2 mainly contained BC patients aged over 65 years (P < 0.05) and was preferentially associated with stage III–IV (P < 0.01). As shown in Figure 3C, the OS of cluster 2 was shorter than that of cluster 1 (P = 0.008), which indicated that the prognosis of the cluster 2 subgroup was poor compared with that of the cluster 1 subgroup. The similarity of the expression levels of 50 m6A-related lncRNAs in cluster 1 and cluster 2 samples showed that the expression level of these lncRNAs was closely related to the heterogeneity of the 406 BC patients in the TCGA dataset. Our results also confirmed the prognostic value of 50 m6A-related lncRNAs.
FIGURE 3
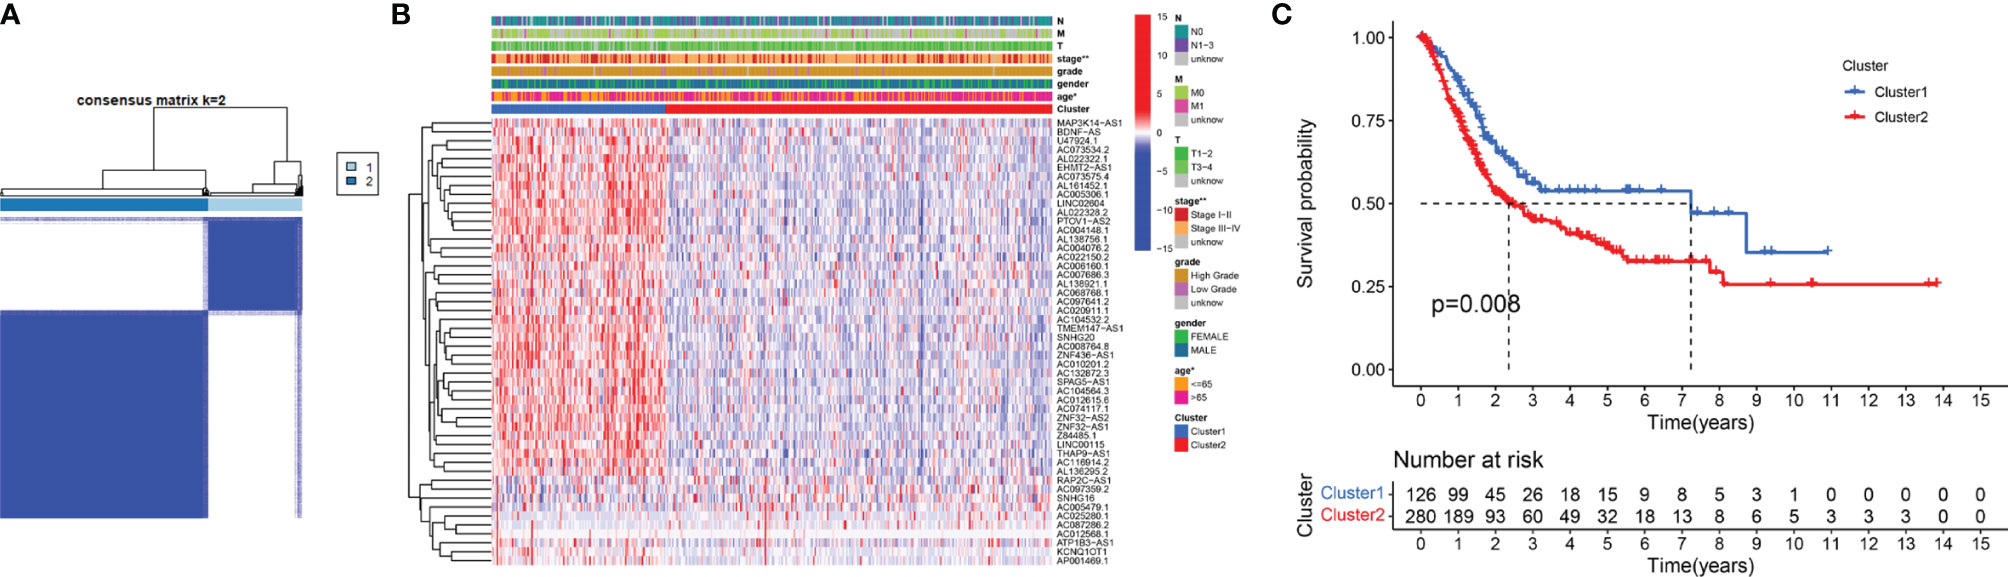
Figure 3 Differential clinicopathological features and survival rates of BC patients in cluster 1 and cluster 2. (A) Consensus clustering matrix for k = 2. (B) The heatmap of cluster 1 and cluster 2 along with clinicopathological features that included gender, age, grade, T stage, N stage, M stage, and stage. (C) Kaplan-Meier curves of OS. *P < 0.05 and **P < 0.01.
GSEA of Cluster Subtypes and the Association Between PD-L1 and m6A-Related LncRNAs
GSEA was performed to explore the potential regulatory mechanisms that led to the differences in survival rates between the cluster 1 and cluster 2 subgroups. The FDR of the enrichment analysis of cluster 1 was not <0.05. The enrichment analysis results of the cluster 2 subgroup revealed that allograft rejection, apical junctions, apoptosis, coagulation, complement, epithelial-mesenchymal transformation, delayed estrogen response, hypoxia, IL2-STAT5 signaling, IL6-JAK-STAT3 signaling, the inflammatory response, the interferon γ response, KRAS signaling, mTORC1 signaling, the P53 pathway and TNFA signaling through NFkB (FDR <0.05; Figure 4A) were enriched. Based on the correlation between the IL6/JAK/STAT3 signaling pathway and PD-L1 (29, 30), we analyzed the differential expression of PD-L1 between cluster 1 and cluster 2. Compared with that in cluster 1, PD-L1 expression in cluster 2 was significantly higher (p <0.001; Figure 4B). To explore the potential relationship between PD-L1 and m6A-related lncRNAs, we further studied the expression correlation between PD-L1 and m6A-related lncRNAs. The results showed that PD-L1 expression was correlated with that of most of the m6A-related lncRNAs, while the m6A-related lncRNAs showed a significant positive correlation with each other (Figure 4C). To analyze the potential relationship between m6A-related lncRNAs and the TME of BC, the level of immunocyte infiltration in cluster 1 and cluster 2 was evaluated, and we found that the infiltration level of naïve CD4 T cells, regulatory T cells (Tregs), memory B cells and plasma cells was relatively high in cluster 1, and that of neutrophils and activated memory CD4 T cells was relatively high in cluster 2 (Figure 4D). Hence, the IL6/JAK/STAT3 signaling pathway might be implicated in the distinct TME of cluster 1/2.
FIGURE 4
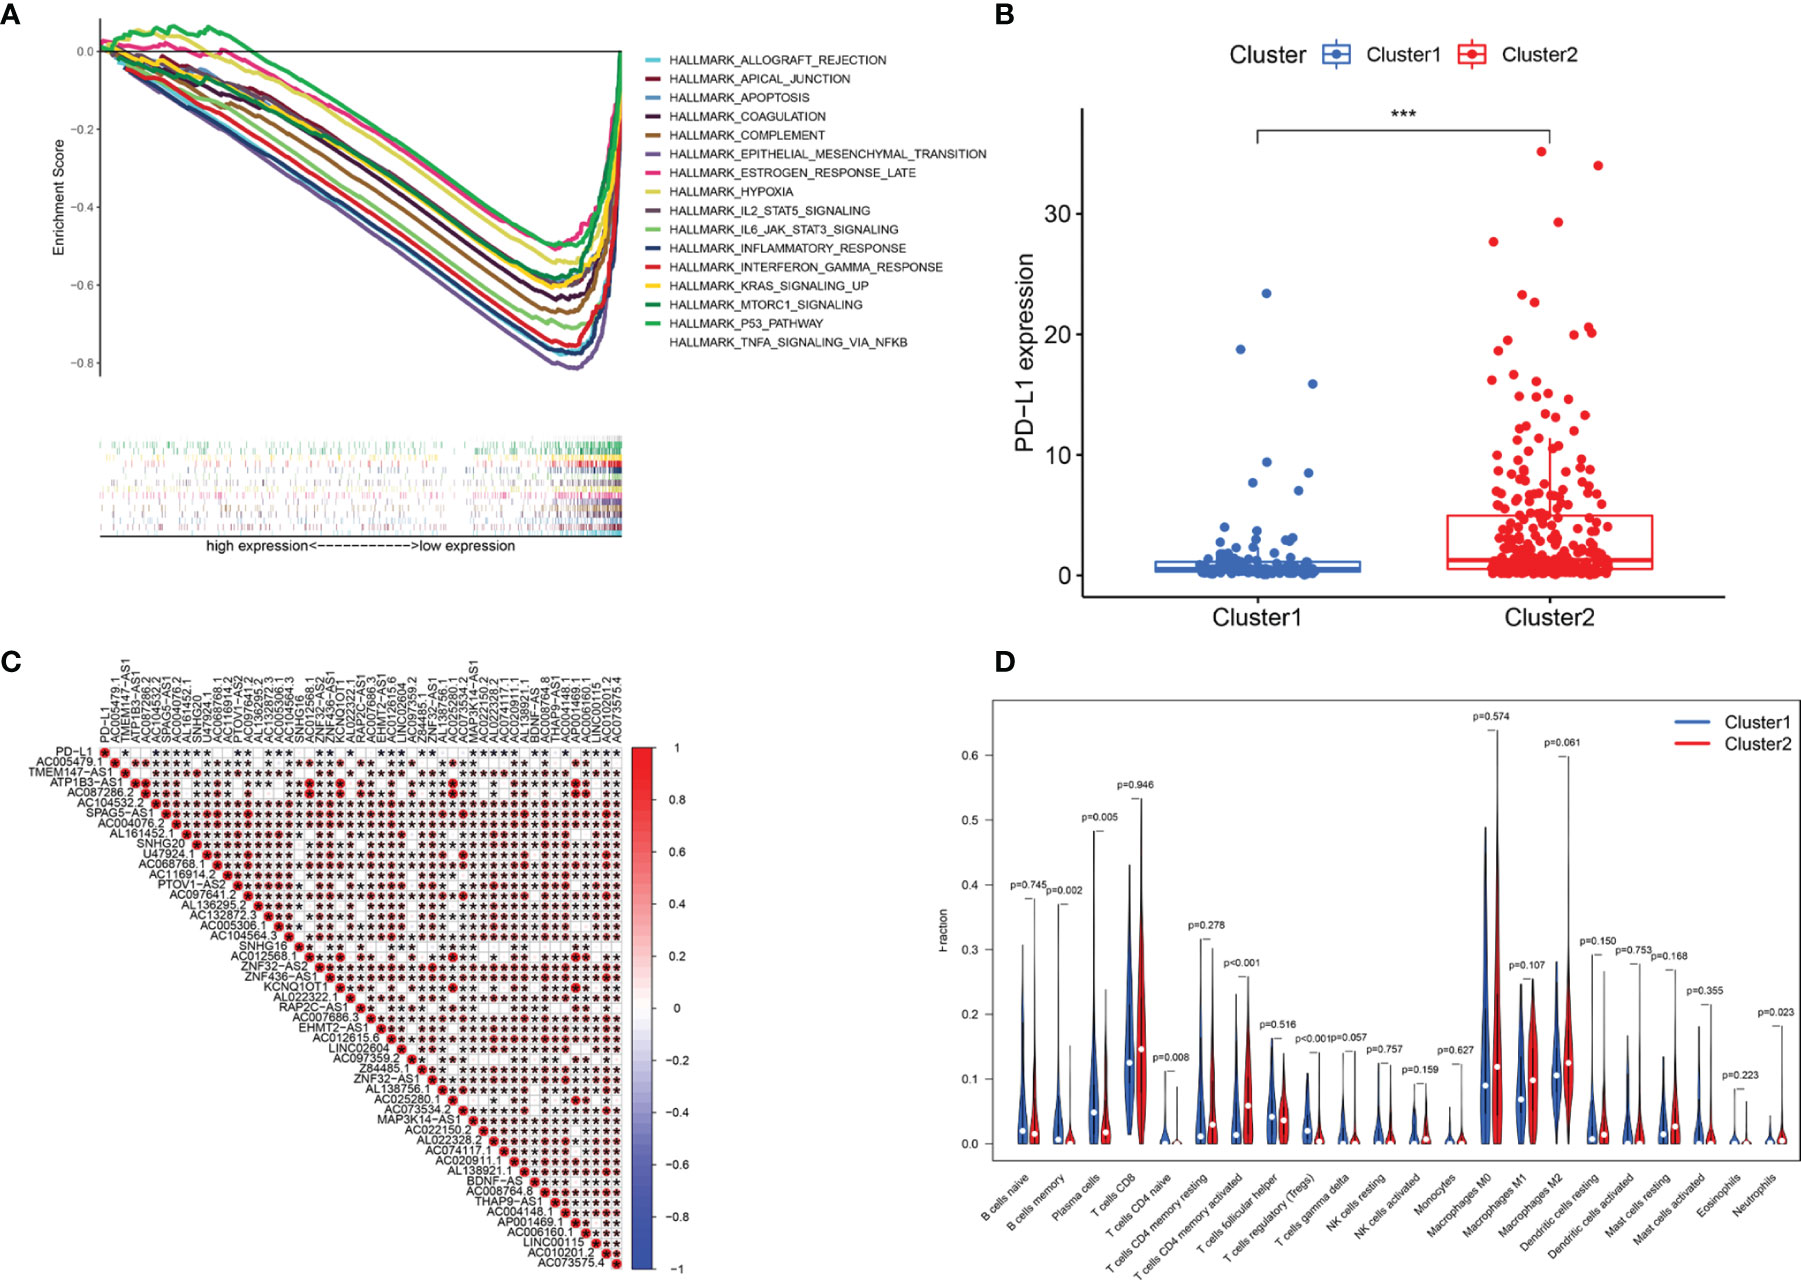
Figure 4 Association of PD-L1 with m6A-related lncRNAs and the landscape of immune cell infiltration in BC cluster 1 and cluster 2. (A) GSEA indicating that tumor hallmarks were enriched in cluster 2. (B) PD-L1 expression in BC cluster 1 and cluster 2. (C) The correlation of PD-L1 with m6A-related lncRNAs. (D) The infiltration levels of 22 immune cell types in BC cluster 1 and cluster 2. *P < 0.05; ***P < 0.001.
Construction and Validation of the m6A-LPS
To accurately predict the clinical prognosis of m6A-related lncRNAs in BC patients, the 50 lncRNAs related to m6A genes were analyzed by LASSO Cox regression. We identified the m6A-LPS, which accounted for the expression levels of the 14 m6A-related lncRNAs and their respective coefficients (Figures 5A–C). Then, based on the expression of the 14 lncRNAs and their risk coefficients, we calculated the risk score for each patient in the TCGA training cohort and the validation cohort. We divided patients in the TCGA training and validation cohorts into high-risk and low-risk groups based on the median risk score. Figures 5D, E show the risk scores, OS rates, vital statuses, and expression profiles of m6A-LPS components in the TCGA training and validation cohorts. The heatmap indicated that AC005479.1, ATP1B3-AS1, SNHG16, AC025280.1, and AP001469.1 were highly expressed in the high-risk group. In the TCGA training and validation cohorts, there was a significant difference in OS rates between the low-risk and high-risk groups (p < 0.0001, Figures 5F, G).
FIGURE 5
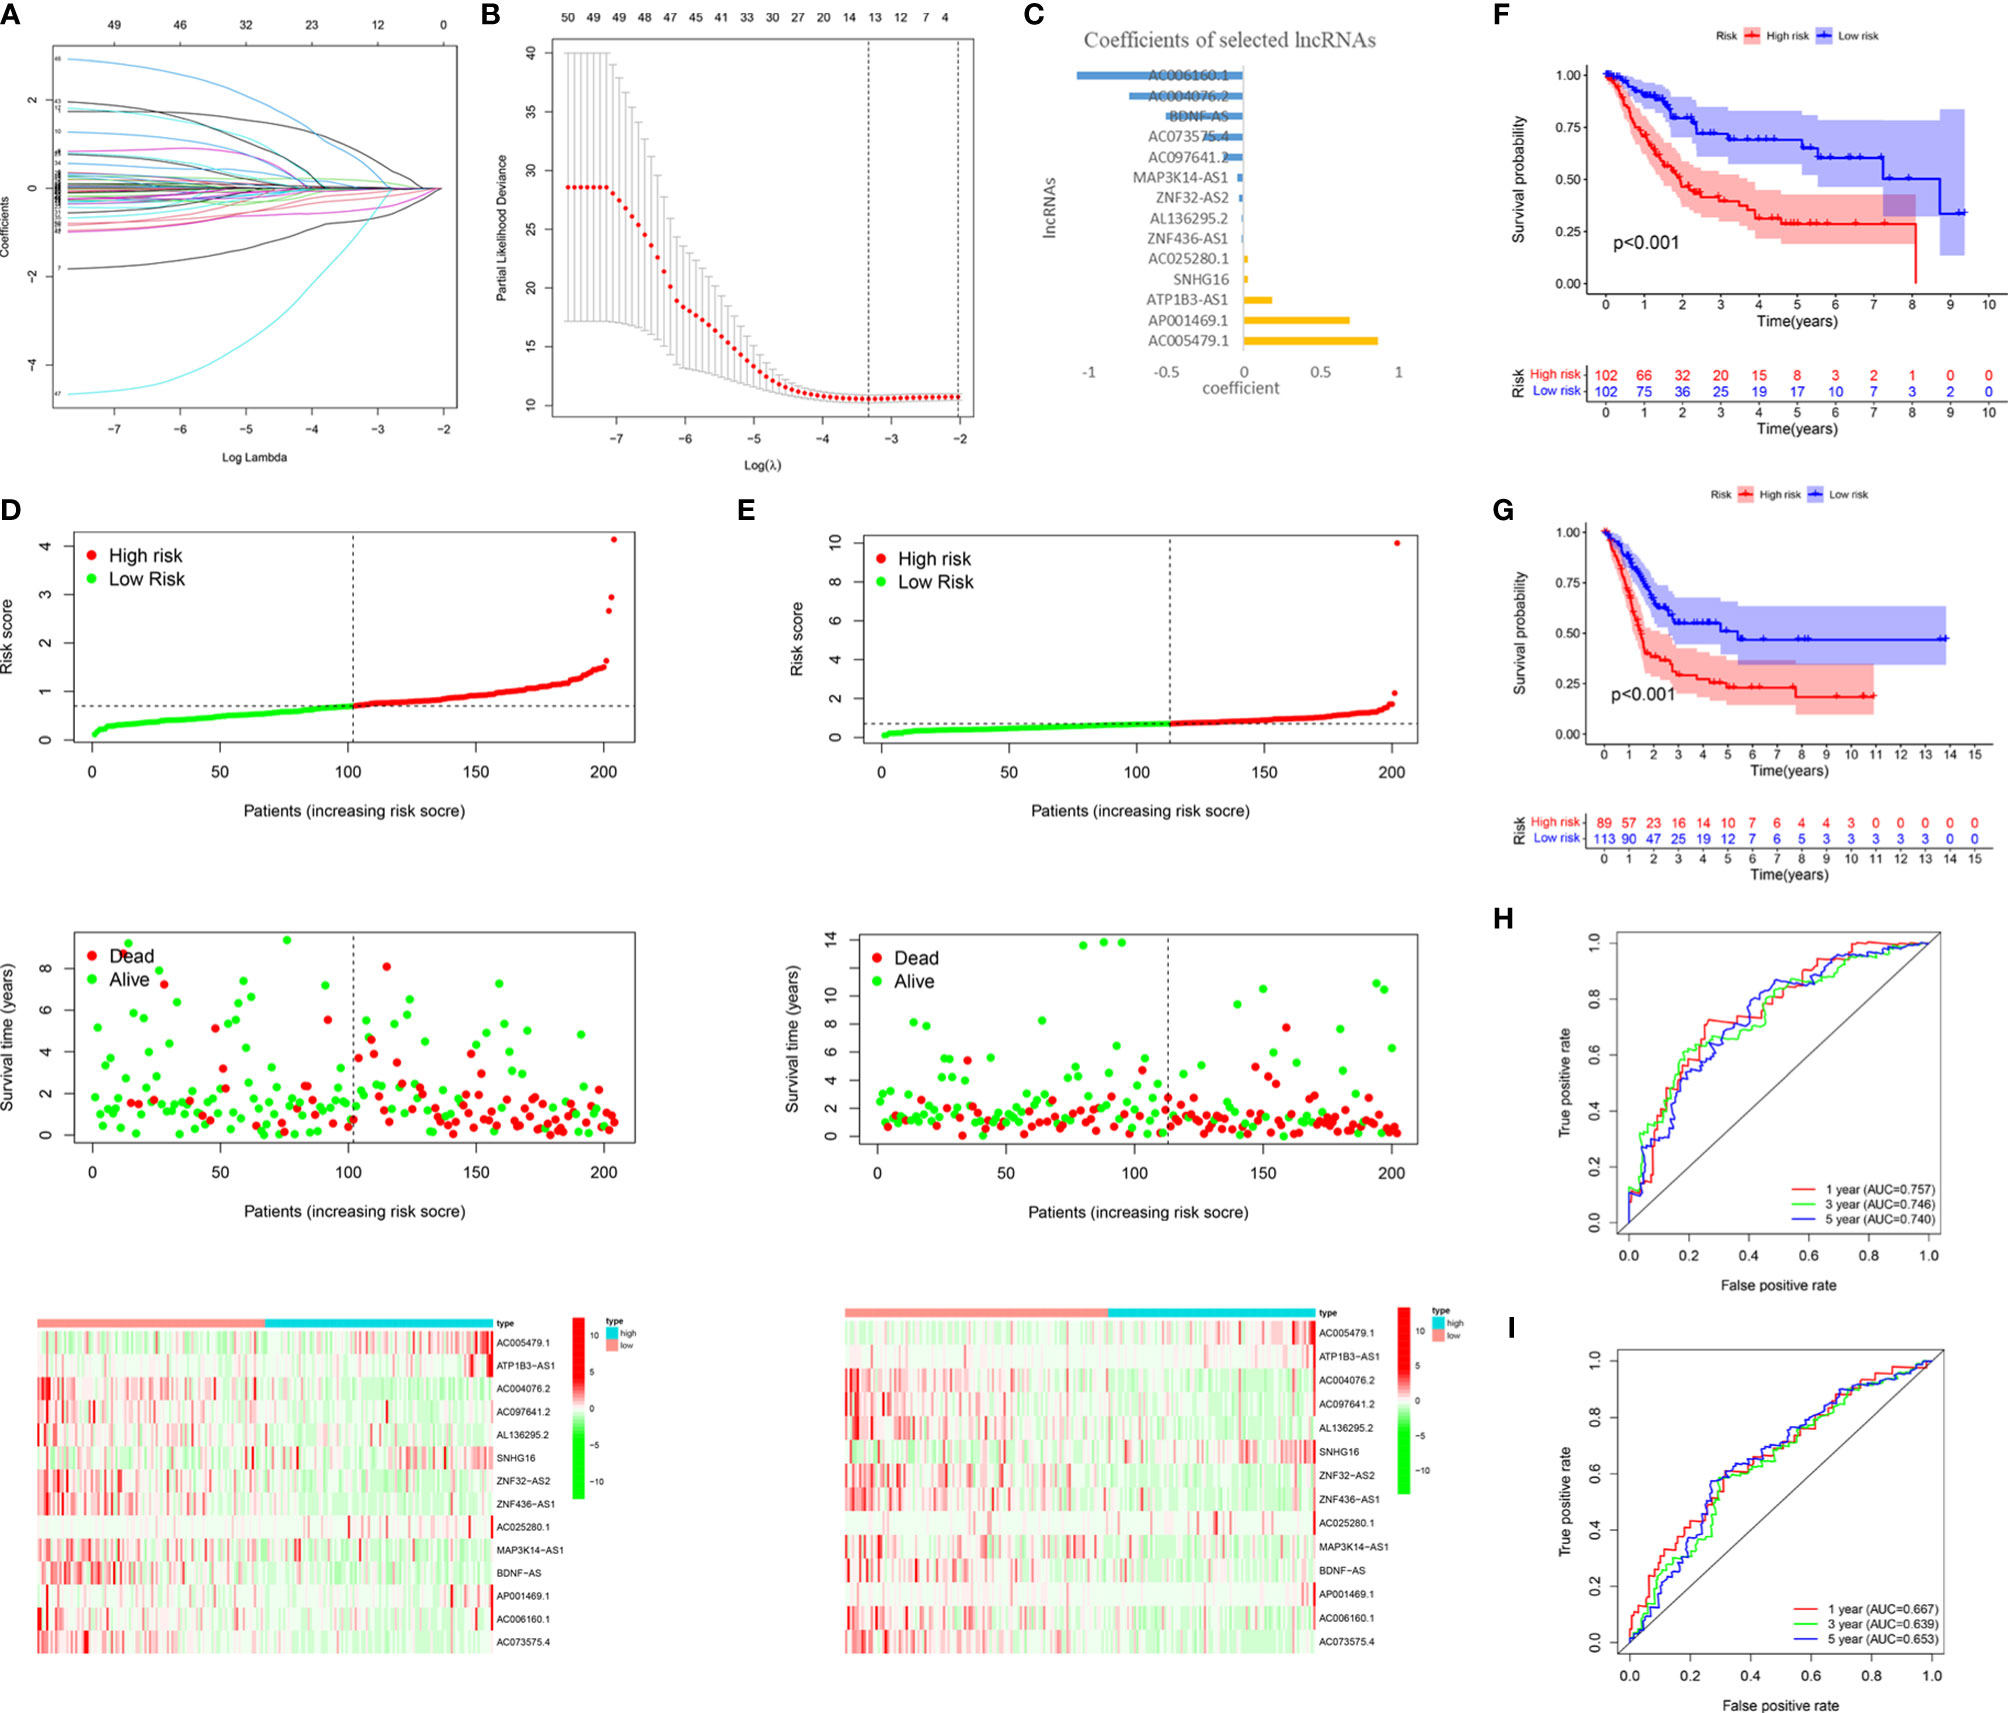
Figure 5 Construction and validation of the m6A-LPS in the TCGA cohort. (A–C) LASSO regression analysis was performed, and the minimum criteria (A, B) and coefficients (C) were calculated. (D, E) Distribution of risk scores, OS rates, and OS statuses and the heatmap of the 14 prognostic m6A-related lncRNAs in the TCGA training cohort (D) and the TCGA validation cohort (E). (F, G) Kaplan-Meier curves of OS rates for bladder cancer patients based on the risk scores in the TCGA training cohort (F) and the TCGA validation cohort (G). (H, I) Time-dependent ROC curves for the TCGA training cohort (H) and the TCGA validation cohort (I).
We analyzed the ROC curves for 1-year, 3-year, and 5-year survival by comparing AUC values to evaluate the prognostic accuracy of the 14 risk lncRNAs. We found that the 1-, 3- and 5-year AUC values of the 14-lncRNA signature were 0.757, 0.746, and 0.740, respectively, in the training cohort (Figure 5H) and 0.667, 0.639, and 0.653, respectively, in the validation cohort (Figure 5I). The AUC values indicated that the 14-lncRNA signature has a good ability to differentiate prognosis in BC patients.
m6A-LPS Was an Independent Prognostic Factor in Patients With BC
To confirm whether the risk score based on m6A-LPS can be used as an independent prognostic factor for patients with BC, we performed univariate and multivariate Cox regression analyses on the TCGA training and validation cohorts. Univariate analysis showed that in the TCGA training cohort, age (P =0.10), stage (P <0.001), and risk score (P <0.001) correlated with the OS rate. The multivariate Cox regression analysis of the training cohort showed that age (P = 0.005), staging (P < 0.001), and risk score (P < 0.001) were still closely related to the OS rate (Figures 6A, B). Similarly, we conducted the same analysis for the TCGA validation cohort, and the results showed that age, stage, and risk score were independent prognostic factors (Figures 6C, D). We found that the risk score based on the m6A-LPS could be used as an independent prognostic factor for the TCGA training and validation cohorts, indicating that the m6A-LPS may have potential value in the process of assessing clinical prognosis.
FIGURE 6
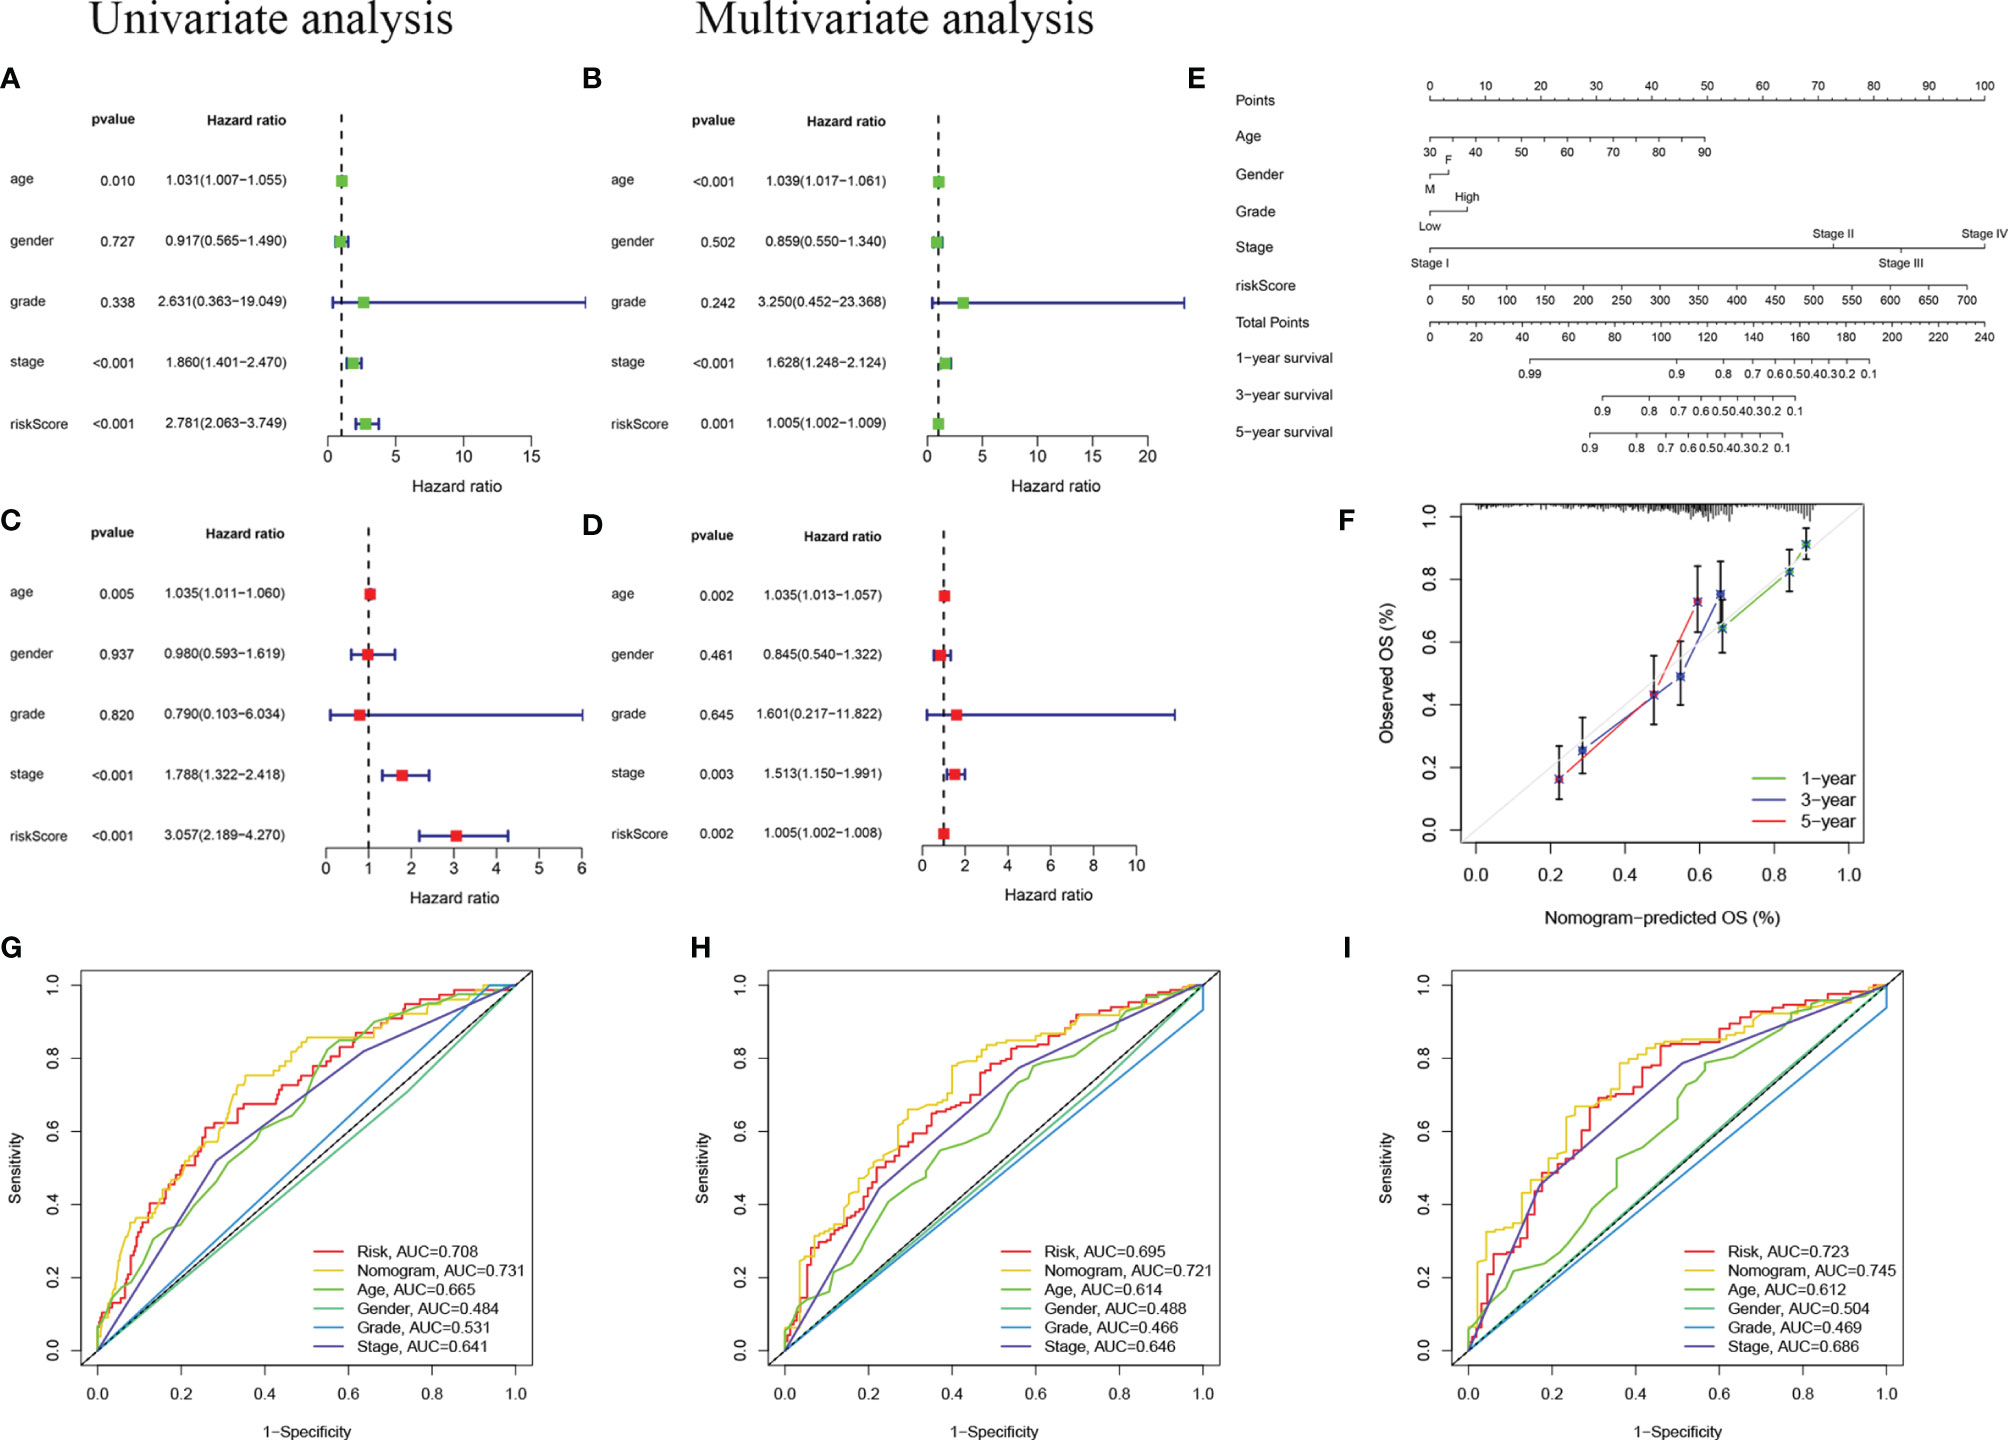
Figure 6 Independent prognostic analysis. (A, B) Univariate (A) and multivariate (B) Cox regression analyses in the TCGA training cohort. (C, D) Univariate (C) and multivariate (D) Cox regression analyses in the TCGA validation cohort. (E) Nomogram based on age, gender, grade, stage, and risk score. (F) Calibration plot of a nomogram to predict 1-,3- and 5-year OS in the TCGA cohort. The x-axis represents the nomogram-estimated probabilities and the y-axis represents the observed probabilities. (G–I) Discriminatory accuracy for predicting OS assessed by receiver operator characteristics (ROC) analysis calculating the time-independent area under the curves (AUCs).1- (G), 3- (H), and 5-year (I) in the TCGA cohort.
In addition, we assembled a nomogram based on risk score, age, sex, grade, and stage to predict the prognosis of BC (Figure 6E). In our nomogram, the calibration curve has a good ability to predict the prognosis of 1-year, 3-year, and 5-year OS rates (Figure 6F). The AUC of the nomogram in the ROC curve is 0.731, 0.721, and 0.745 at 1-, 3-, and 5-year, respectively, which is more accurate than risk score, age, sex, grade, and stage (Figures 6G–I). In general, the risk score signature we established can provide the most useful and accurate guidance for predicting the survival of these prognostic indicators.
Analysis of the Correlation Between the Risk Score and Clinical Characteristics of BC Patients
We further estimated the relationship between the risk score and clinical characteristics in TCGA datasets. The heatmap in Figure 7A shows the differences in the expression levels of 14 m6A-related lncRNAs in the TCGA datasets in the low-risk and high-risk groups. There were significant differences in T stage (P < 0.01), stage (P < 0.001), cluster subtype (P < 0.001), grade (P < 0.01) and immune score (P < 0.001) between the low-risk group and the high-risk group. The risk scores of the T3-4, late-stage, cluster 2, high grade, and high immune score groups were significantly higher than those of the T1-2, early-stage, cluster 1, low grade, and low immune score groups (Figures 7B–F). In addition, we found that PD-L1 expression in patients with high-risk scores was significantly higher than that in patients with low-risk scores (P < 0.001; Figure 7G). These findings revealed that the risk score based on m6A-LPS was significantly associated with subtype, grade, T stage, stage, immune score, and PD-L1 expression in BC patients, also suggesting a potential correlation between the risk score and the TME of BC.
FIGURE 7
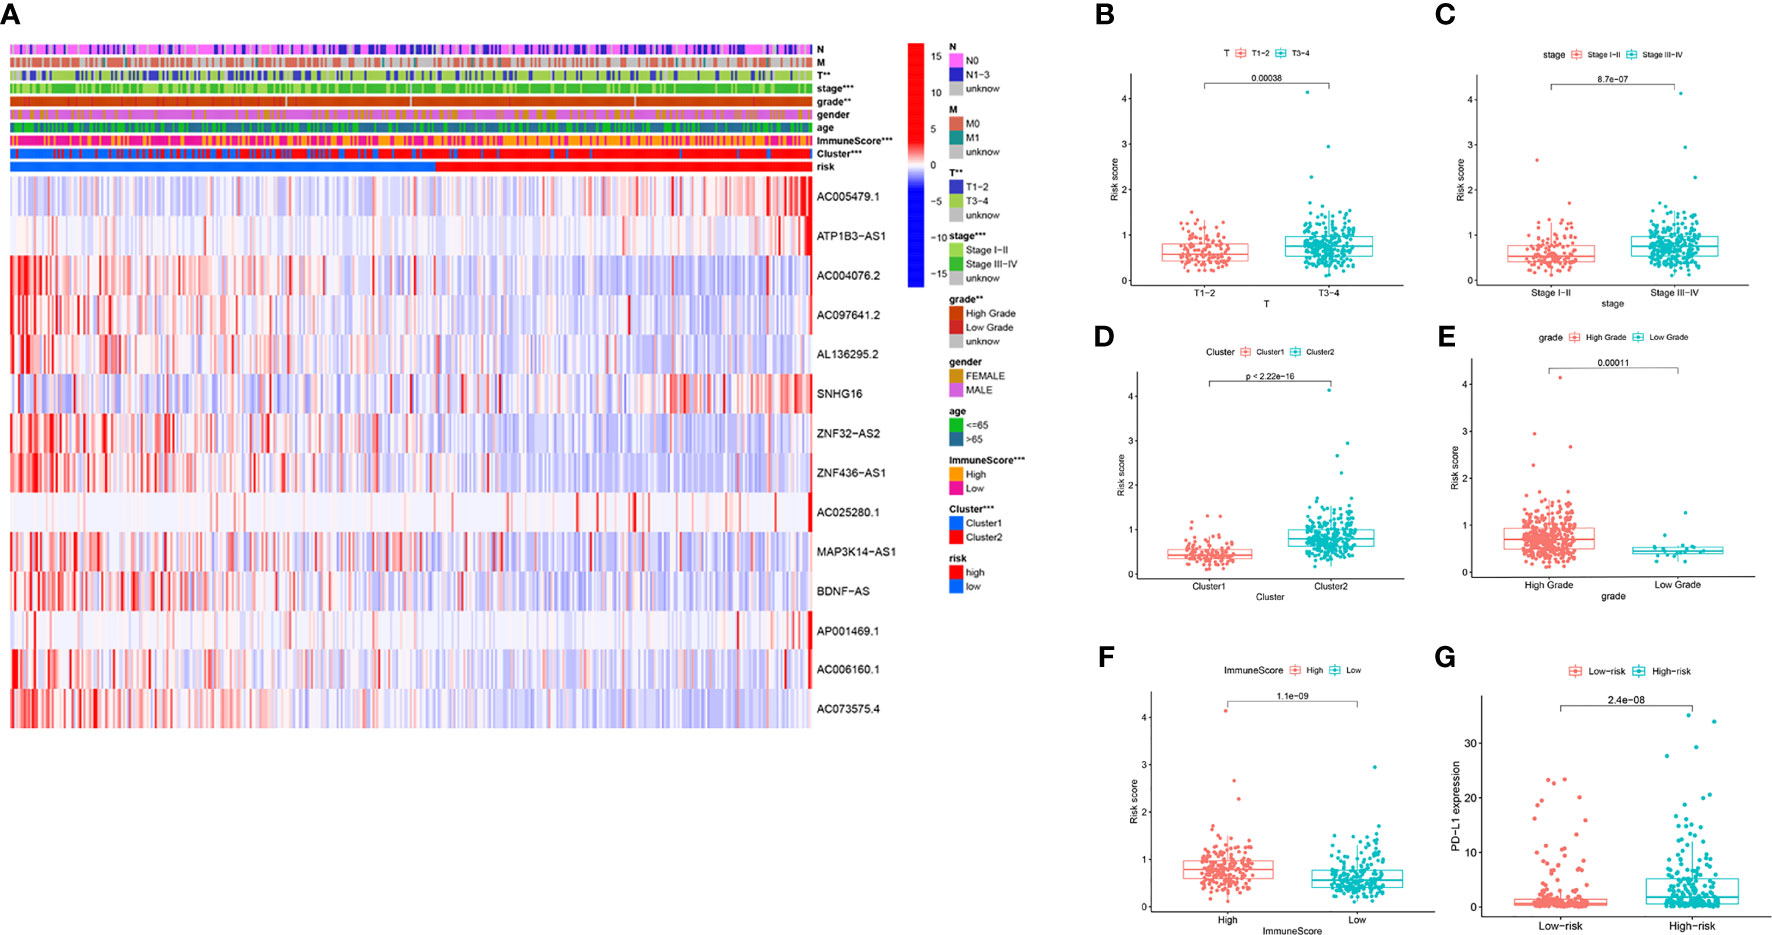
Figure 7 The prognostic risk score was correlated with clinicopathological features and immune score in the TCGA datasets. (A) Heatmap and clinicopathologic features for the high- and low-risk groups. (B–F) Distribution of risk scores stratified by T stage (B), stage (C), cluster (D), grade (E) and, immune score (F). (G) PD-L1 expression by risk score group in the TCGA datasets. **P < 0.01; ***P < 0.001.
Immune Cell Enrichment Analysis
To explore the potential correlation between the risk score and the TME of BC, we further studied the correlation between the risk score and immune infiltrating cells and immune functions by ssGSEA in TCGA datasets. We found significant differences in 16 types of immune cells between the high- and low-risk groups (Figure 8A): activated dendritic cells (aDCs); macrophages; neutrophils; NK cells; immature dendritic cells (iDCs); dendritic cells (DCs); mast cells; B cells; CD8+ T cells; plasmacytoid dendritic cells (pDCs); T helper cells; T helper 2 (Th2) cells; tumor-infiltrating lymphocytes (TILs); Tregs; T helper 1 (Th1) cells; and follicular T helper (Tfh) cells. In addition, the scores of immune functions, such as cytolytic activity, HLA, cytokine, and cytokine receptor (CCR), T cell coinhibition, T cell costimulation, APC inhibition, APC stimulation, the type I IFN response, and checkpoints, were significantly higher in the high-risk group, implying that these immune functions are more active in patients in the high-risk group (Figure 8B). These results indicated that the risk score based on m6A-LPS was closely related to immune infiltrating cells and immune functions in BC, which further suggested that m6A-LPS had a potential influence on the TME of BC.
FIGURE 8
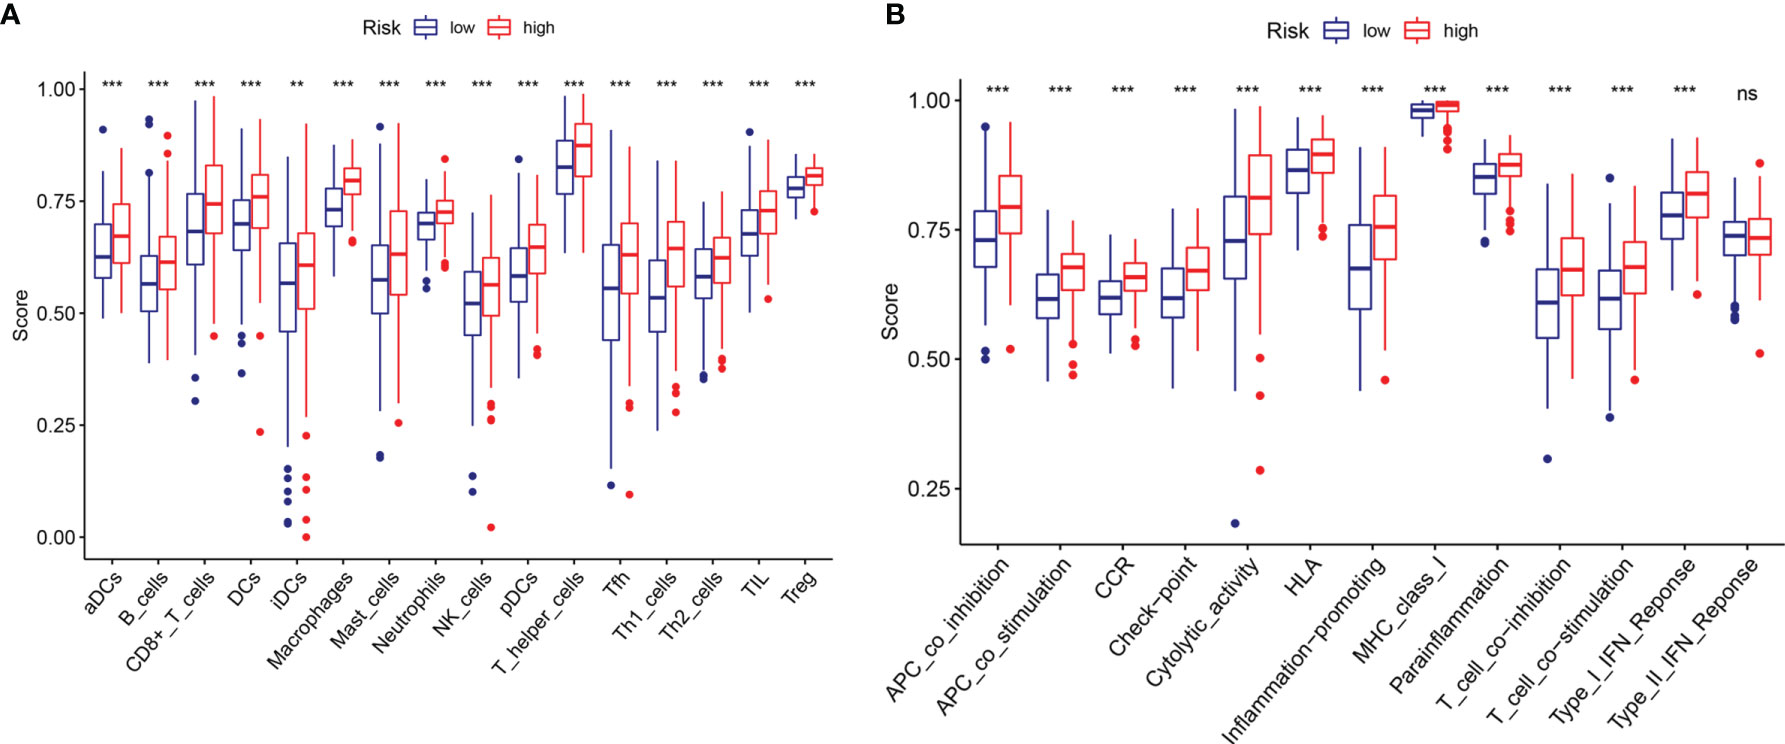
Figure 8 Comparison of the ssGSEA scores between the high- and low-risk groups. The scores for 16 immune cells (A) and 13 immune-related functions (B) are displayed in boxplots. ns, not significant. **P < 0.01; ***P < 0.001.
Effect of m6A-LPS on Immune Cell Infiltration
To investigate whether m6A-LPS can regulate the TME of BC, we analyzed the correlation between the risk score and the infiltration of 12 types of immune cells in the TCGA datasets. We found that the infiltration levels of memory B cells, activated dendritic cells, plasma cells, follicular helper T cells, and gamma delta Tregs were negatively correlated with the risk score (P < 0.05, Figures 9A–G). Moreover, the infiltration levels of eosinophils, resting memory CD4 T cells, M0 macrophages, M1 macrophages, and activated mast cells were positively correlated with the risk score (P < 0.05, Figures 9H–L). Our results indicate that m6A-LPS has pivotal regulatory effects on the TME in BC patients.
FIGURE 9
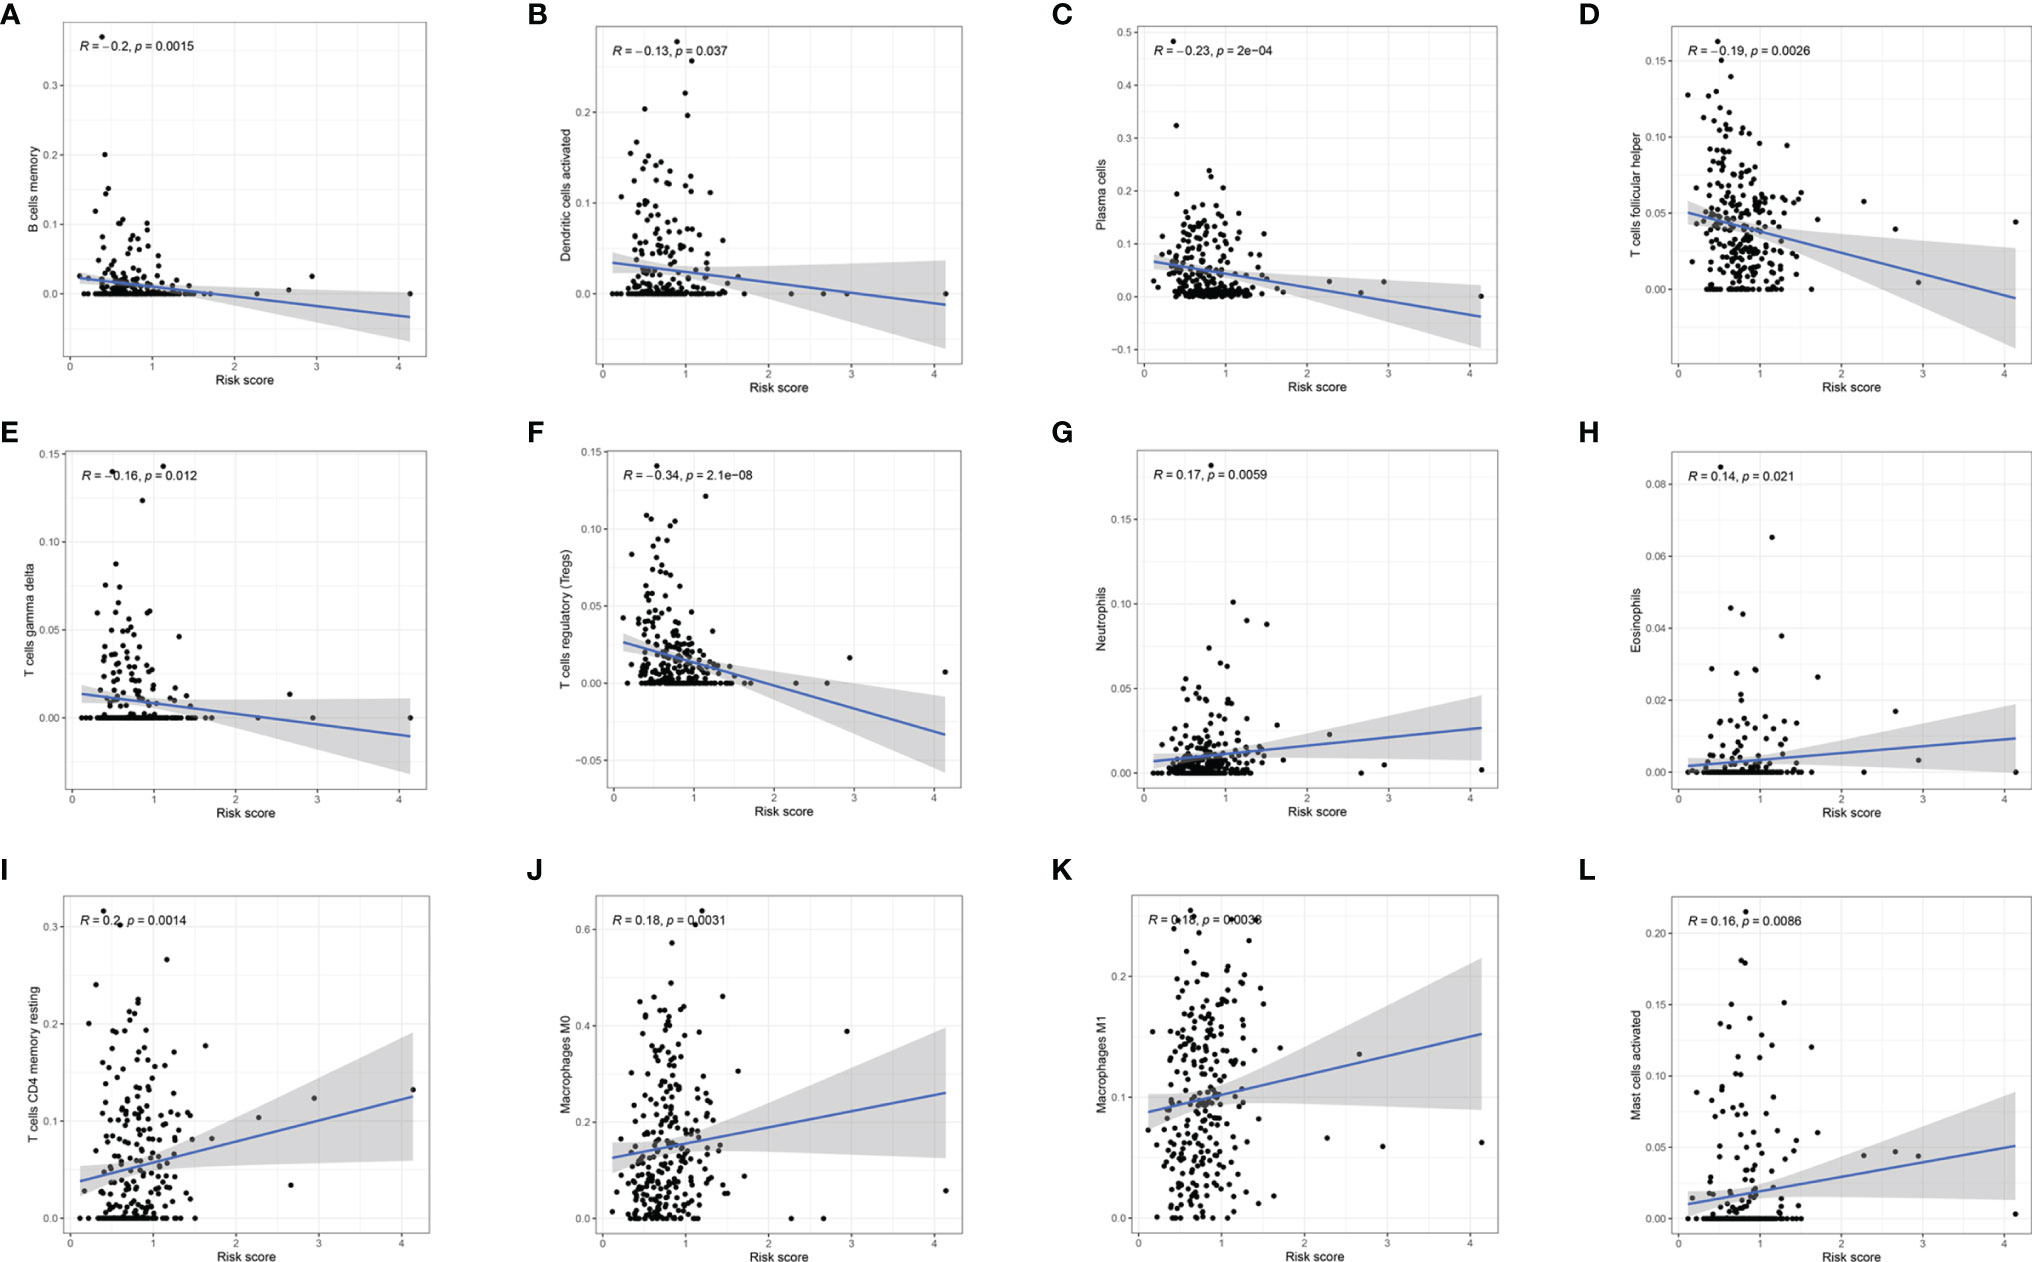
Figure 9 Relationships between the risk score and the infiltration levels of 12 immune cell types. (A–F) The infiltration levels of memory B cells (A), aDCs (B), plasma cells (C), Tfh cells (D), gamma delta T cells (E), and Tregs (F) were negatively correlated with risk score. (G–L) The infiltration levels of neutrophils (G), eosinophils (H), resting memory CD4 T cells (I), M0 macrophages (J), M1 macrophages (K), and activated mast cells (L) were positively correlated with the risk score.
SNHG16 Was Highly Expressed in BC Samples and Affected BC Cell Proliferation, Migration, and Invasion
For verification, we detected SNHG16 expression in 13 samples of BC patient tissues, including 8 BC tissues and 5 paracancerous tissues, by RT-qPCR assay. Our results showed that SNHG16 was upregulated in BC tissues compared with normal tissues (P <0.05, Figure 10A). The result was consistent with those in Figure 2B. In addition, we detected SNHG16 expression in the immortalized human bladder epithelial cell line SV-HUC-1 and the BC cell lines 5637 and T24 by qPCR. SNHG16 expression was higher in 5637 and T24 cells than in SV-HUC-1 cells, and its expression level in 5637 cells was higher than that in T24 cells (P <0.05, Figure 10B). As shown in Figure 7A, SNHG16 was highly expressed in the high-risk group, which suggested that SNHG16 promotes the development of BC. Therefore, the role of SNHG16 in BC was further explored. We then selected 5637 cells with higher SNHG16 expression levels for further study. After knocking down SNHG16 by siRNA (Figure 10C), our study showed that the proliferation, migration, and invasion ability of BC cell lines with low SNHG16 expression were decreased compared with that in cells with high SNHG16 expression (P <0.05, Figures 10D–F); however, the proliferation ability of 5637 cells with SNHG16 knockdown was still higher than that of SV-HUC-1 cells (P <0.05, Figure 10D). Our results showed that SNGH16, which is relatively highly expressed in the high-risk group, is highly expressed in BC tissues and can promote BC cell proliferation, migration, and invasion.
FIGURE 10
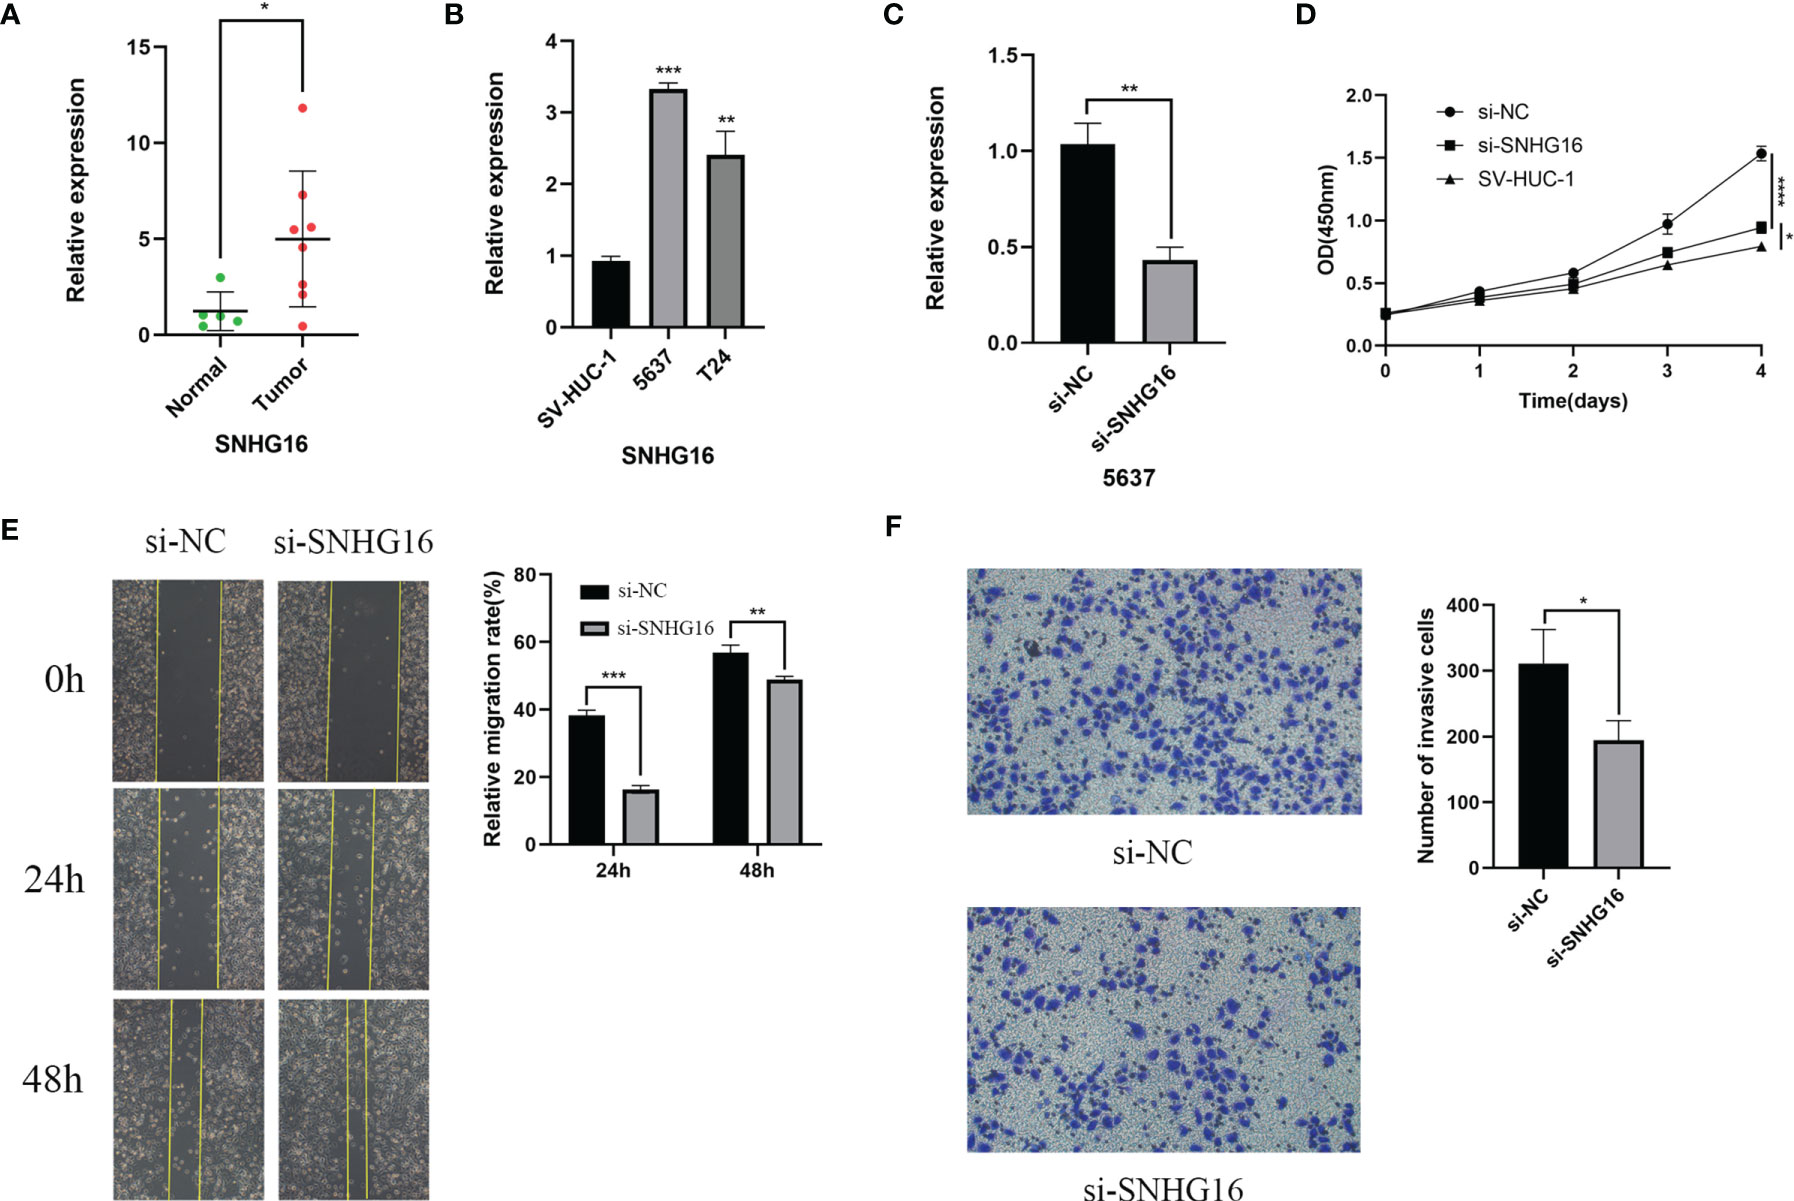
Figure 10 SNHG16 was highly expressed in BC tissues and cell lines and interfered with siRNA resulted in suppressed proliferation, migration, and invasion in vitro. (A)The SNHG16 expression in BC tissues and paracancerous tissues. (B) SNHG16 expression level was assessed in the immortalized human bladder epithelial cell line SV-HUC-1 and the BC cell lines 5637 and T24 by qPCR. (C) The efficiency of siRNA knockdown of SNHG16 was assessed in the BC cell line 5637 by qPCR. (D) Cell proliferation was determined in SV-HUC-1 cells and 5637 cells transfected with si-SNHG16 or si-NC by CCK-8 assay on days 0, 1, 2, 3, and 4. (E) Scratch wound assay: The scratch was imaged after transfection, and cell mobility was measured by determining the extent of wound closure at 24 and 48 h (× 100). (F) The invasion of 5637 cells transfected with si-SNHG16 or si-NC was evaluated by transwell assay with Matrigel (× 200). *P<0.05, **P<0.01, ***P<0.001, and ****P<0.0001.
Discussion
Because of its poor prognosis and high recurrence rate, BC is considered a serious threat to health (31). It is critical to identify specific and sensitive biomarkers to improve the prognosis of patients with BC. Recently, the expression levels and mechanisms of mRNAs and miRNAs have been extensively studied in BC, and many of these factors have been identified as prognostic markers in BC patients (32–36). With further research on BC, the role of lncRNAs has been gradually uncovered and is helpful for comprehensively understanding the characteristics of the occurrence and development of BC (37–39). Many studies have confirmed that m6A methylation may play regulatory roles in the tumorigenesis, development, and progression of BC (40, 41); however, it is not clear how m6A modification plays a role in BC progression in a lncRNA-dependent manner.
We first identified 50 m6A-related lncRNAs with prognostic value in TCGA datasets and then performed consensus clustering on these m6A-related lncRNAs to identify two BC subtypes, namely, cluster 1 and cluster 2. Compared with the cluster 1 subgroup, the prognosis of the cluster 2 subgroup was worse (p = 0.008). Next, we performed GSEA on cluster 1 and cluster 2 to identify the possible major functional pathways. GSEA results showed that hallmarks of malignant tumors (including allograft rejection, apical junction, apoptosis, coagulation, complement, epithelial-mesenchymal transition, late estrogen response, hypoxia, IL2/STAT5 signaling, IL6/JAK/STAT3 signaling, inflammatory response, interferon gamma response, KRAS signaling, mTORC1 signaling, P53 pathway and TNFA signaling via NFKB) were significantly enriched in cluster 2, in which the IL6/JAK/STAT3 signaling pathway was shown to induce the expression of PD-1 and/or PD-L1 (29, 30). There are more and more studies on the regulation of PD-L1 in BC. For example, recent studies have shown that WDR5 activates PD-L1 expression through H3K4me3 modification, and OICR-9429 targets WDR5 to inhibit immune escape by blocking PD-L1 (42). PD-L1 has been shown to weaken the antitumor immune response and plays an important role in a variety of tumors (43). Then, we analyzed PD-L1 expression in cluster 1 and cluster 2 and found that PD-L1 was significantly more highly expressed in cluster 2 (p < 0.001), which indicates a correlation between PD-L1 and the IL6/JAK/STAT3 signaling pathway. The analysis revealed an unexpected correlation between PD-L1 expression and m6A-related lncRNAs, suggesting that these specific m6A-related lncRNAs are involved in the development of BC and the expression of PD-L1 in BC through the IL6/JAK/STAT3 signaling pathway. In our study, different subtypes were related to the prognosis and some clinicopathological characteristics of BC and were tightly associated with the expression of PD-L1 and the degree of immune cell infiltration.
Through subtype cluster analysis, we found that the 50 m6A-related lncRNAs we selected were indeed closely related to the prognosis of patients with BC, and this result may provide useful information for predicting the prognosis of BC patients in the clinic. However, more convenient and effective predictors are required; thus, we constructed m6A-LPS. Fourteen prognostic risk factors were obtained by LASSO Cox regression analysis. After correlation calculation, the risk score of each patient was obtained. Among these risk factors, lncRNA SNHG16 showed significantly upregulated expression in hepatocellular carcinoma, lung cancer, colorectal cancer, glioma, and other tumor tissues and cell lines, and the overexpression of SNHG16 often indicates a poor prognosis (44–47). Subsequently, we proved that SNHG16 expression in BC tissues was higher than that in adjacent tissues, and high SNHG16 expression could promote BC cell proliferation and migration, which is consistent with the results of a previous study (48). Our results showed that SNHG16 was highly expressed in the high-risk group, which was consistent with the above analysis.
Then, the patients were subdivided into high- and low-risk groups according to the median value in the training and validation TCGA cohorts. We found that patients in the high-risk group had a poorer prognosis in both cohorts. Based on univariate and multivariate Cox regression analyses, we confirmed that the risk score was an independent prognostic factor for patients with BC. Within the nomogram integrating independent prognostic factors, the risk score made a significant contribution and performed better than other factors in survival prediction. The risk score was also related to the T stage, different cluster subtypes, grade, immune score, and PD-L1 expression level. We also observed that cluster 2 had a higher risk score and that PD-L1 expression was higher in the high-risk group, which was consistent with the findings of previous studies. Moreover, the immune score of the high-risk group was higher than that of the low-risk group. We further explored the relationship between the risk score and immune cells and immune functions by ssGSEA. The results showed that the expression levels of 16 types of immune cells in the high-risk group were significantly higher than those in the low-risk group. Rosenberg et al. (49) found that the expression of PD-L1 in BC was more closely associated with immune infiltrating cells than with tumor cells. In addition, some studies have shown that responses to ICIs are often associated with high tumor mutation loads, resulting in the production of a large number of mutated neoantigens that support extensive immune cell infiltration and render tumors sensitive to ICIs (50, 51). The results of the above analysis may explain the correlation between the high expression of PD-L1 and the high immune cell infiltration in the high-risk group in BC and indicate that ICIs are more effective for patients in the high-risk group.
Immune cell infiltration in the TME may affect the survival, metastasis, and therapeutic resistance of tumor patients (52–54). Previous studies have shown that neutrophils in tumor immune cell infiltration are associated with a poor prognosis (50, 55), while BC patients with high levels of Treg infiltration have a better prognosis (56). In this study, the risk score was negatively correlated with activated dendritic cells, plasma cells, memory B cells, Tfh cells, gamma delta T cells, and Tregs and positively correlated with neutrophils, eosinophils, resting memory CD4 T cells, M0 macrophages, M1 macrophages, and activated mast cells. Taken together, these results suggest that the 14 risk m6A-related lncRNAs in BC were associated with the infiltration of these immune cell subtypes. Our results were consistent with previous results.
However, our results need to be further verified before they can be used to assist the clinical treatment of patients with BC, such as determining whether it is appropriate to apply PD-L1 blockade therapy and to finally achieve the purpose of predicting and improving the prognosis of patients with BC. Moreover, the different immune characteristics of the subtypes established by the m6A-LPS classification system indicate that patients from different subgroups may have different responses to immunotherapy. More studies are needed to confirm the accuracy of the prediction system and whether personalized treatment for these subtypes can improve patient prognosis.
Conclusions
In summary, this study methodically assessed the prognostic value of m6A-related lncRNAs in BC from TCGA datasets and studied the correlation between these lncRNAs and PD-L1 expression and the TME. m6A-related lncRNAs might be involved in the regulation of PD-L1 expression and the TME of BC in synergy with the IL6/JAK/STAT3 signaling pathway. The risk score based on the m6A-LPS was shown to be an independent prognostic indicator and could effectively predict the prognosis of patients with BC. Therefore, identifying m6A-related lncRNAs related to the signaling pathway affecting the TME and further studying their regulatory mechanism may provide a promising target for improving the responsiveness of BC to immunotherapy.
Data Availability Statement
The original contributions presented in the study are included in the article/Supplementary Material. Further inquiries can be directed to the corresponding authors.
Ethics Statement
The studies involving human participants were reviewed and approved by the Medical Ethics Committee of Renmin Hospital of Wuhan University. The patients/participants provided their written informed consent to participate in this study.
Author Contributions
KC designed this study. KC, SZ, WY, and YX performed the data analysis, plotted the figures, and wrote the manuscript. JX revised the content. JG and FC were responsible for confirming the authenticity of the data. All the authors read and approved the final manuscript.
Funding
The current study was funded by the Algorithm and Application of Intelligent Medical Service based on health-related big data (Grant No. 2019AEA170).
Conflict of Interest
The authors declare that the research was conducted in the absence of any commercial or financial relationships that could be construed as a potential conflict of interest.
Publisher’s Note
All claims expressed in this article are solely those of the authors and do not necessarily represent those of their affiliated organizations, or those of the publisher, the editors and the reviewers. Any product that may be evaluated in this article, or claim that may be made by its manufacturer, is not guaranteed or endorsed by the publisher.
Acknowledgments
We sincerely acknowledge the contributions from the TCGA project.
Supplementary Material
The Supplementary Material for this article can be found online at: https://www.frontiersin.org/articles/10.3389/fonc.2022.774307/full#supplementary-material
References
1. Bray F, Ferlay J, Soerjomataram I, Siegel RL, Torre LA, Jemal A. Global Cancer Statistics 2018: GLOBOCAN Estimates of Incidence and Mortality Worldwide for 36 Cancers in 185 Countries. CA Cancer J Clin (2018) 68(6):394–424. doi: 10.3322/caac.21492
2. Antoni S, Ferlay J, Soerjomataram I, Znaor A, Jemal A, Bray F. Bladder Cancer Incidence and Mortality: A Global Overview and Recent Trends. Eur Urol (2017) 71(1):96–108. doi: 10.1016/j.eururo.2016.06.010
3. Kamat AM, Hahn NM, Efstathiou JA, Lerner SP, Malmström PU, Choi W, et al. Bladder Cancer. Lancet (2016) 388(10061):2796–810. doi: 10.1016/s0140-6736(16)30512-8
4. Shelley MD, Jones G, Cleves A, Wilt TJ, Mason MD, Kynaston HG. Intravesical Gemcitabine Therapy for Non-Muscle Invasive Bladder Cancer (NMIBC): A Systematic Review. BJU Int (2012) 109(4):496–505. doi: 10.1111/j.1464-410X.2011.10880.x
5. Chen X, Zhang J, Ruan W, Huang M, Wang C, Wang H, et al. Urine DNA Methylation Assay Enables Early Detection and Recurrence Monitoring for Bladder Cancer. J Clin Invest (2020) 130(12):6278–89. doi: 10.1172/jci139597
6. Ruan W, Chen X, Huang M, Wang H, Chen J, Liang Z, et al. A Urine-Based DNA Methylation Assay to Facilitate Early Detection and Risk Stratification of Bladder Cancer. Clin Epigenet (2021) 13(1):91. doi: 10.1186/s13148-021-01073-x
7. Peng M, Xiao D, Bu Y, Long J, Yang X, Lv S, et al. Novel Combination Therapies for the Treatment of Bladder Cancer. Front Oncol (2020) 10:539527. doi: 10.3389/fonc.2020.539527
8. Lopez-Beltran A, Cimadamore A, Blanca A, Massari F, Vau N, Scarpelli M, et al. Immune Checkpoint Inhibitors for the Treatment of Bladder Cancer. Cancers (Basel) (2021) 13(1):131. doi: 10.3390/cancers13010131
9. Zhu S, Yu W, Yang X, Wu C, Cheng F. Traditional Classification and Novel Subtyping Systems for Bladder Cancer. Front Oncol (2020) 10:102. doi: 10.3389/fonc.2020.00102
10. Wang S, Sun C, Li J, Zhang E, Ma Z, Xu W, et al. Roles of RNA Methylation by Means of N(6)-Methyladenosine (M(6)a) in Human Cancers. Cancer Lett (2017) 408:112–20. doi: 10.1016/j.canlet.2017.08.030
11. Meyer KD, Patil DP, Zhou J, Zinoviev A, Skabkin MA, Elemento O, et al. 5’ UTR M(6)a Promotes Cap-Independent Translation. Cell (2015) 163(4):999–1010. doi: 10.1016/j.cell.2015.10.012
12. Yang Y, Hsu PJ, Chen YS, Yang YG. Dynamic Transcriptomic M(6)a Decoration: Writers, Erasers, Readers and Functions in RNA Metabolism. Cell Res (2018) 28(6):616–24. doi: 10.1038/s41422-018-0040-8
13. Frye M, Harada BT, Behm M, He C. RNA Modifications Modulate Gene Expression During Development. Science (2018) 361(6409):1346–9. doi: 10.1126/science.aau1646
14. Han J, Wang JZ, Yang X, Yu H, Zhou R, Lu HC, et al. METTL3 Promote Tumor Proliferation of Bladder Cancer by Accelerating Pri-Mir221/222 Maturation in M6a-Dependent Manner. Mol Cancer (2019) 18(1):110. doi: 10.1186/s12943-019-1036-9
15. Romero-Barrios N, Legascue MF, Benhamed M, Ariel F, Crespi M. Splicing Regulation by Long Noncoding Rnas. Nucleic Acids Res (2018) 46(5):2169–84. doi: 10.1093/nar/gky095
16. Ji P, Diederichs S, Wang W, Böing S, Metzger R, Schneider PM, et al. MALAT-1, a Novel Noncoding RNA, and Thymosin Beta4 Predict Metastasis and Survival in Early-Stage non-Small Cell Lung Cancer. Oncogene (2003) 22(39):8031–41. doi: 10.1038/sj.onc.1206928
17. Chen Z, Chen X, Xie R, Huang M, Dong W, Han J, et al. DANCR Promotes Metastasis and Proliferation in Bladder Cancer Cells by Enhancing IL-11-STAT3 Signaling and CCND1 Expression. Mol Ther (2019) 27(2):326–41. doi: 10.1016/j.ymthe.2018.12.015
18. Chen X, Xie R, Gu P, Huang M, Han J, Dong W, et al. Long Noncoding RNA LBCS Inhibits Self-Renewal and Chemoresistance of Bladder Cancer Stem Cells Through Epigenetic Silencing of SOX2. Clin Cancer Res (2019) 25(4):1389–403. doi: 10.1158/1078-0432.Ccr-18-1656
19. He W, Zhong G, Jiang N, Wang B, Fan X, Chen C, et al. Long Noncoding RNA BLACAT2 Promotes Bladder Cancer-Associated Lymphangiogenesis and Lymphatic Metastasis. J Clin Invest (2018) 128(2):861–75. doi: 10.1172/jci96218
20. Chen C, Luo Y, He W, Zhao Y, Kong Y, Liu H, et al. Exosomal Long Noncoding RNA LNMAT2 Promotes Lymphatic Metastasis in Bladder Cancer. J Clin Invest (2020) 130(1):404–21. doi: 10.1172/jci130892
21. Jin Y, Wang Z, He D, Zhu Y, Hu X, Gong L, et al. Analysis of M6a-Related Signatures in the Tumor Immune Microenvironment and Identification of Clinical Prognostic Regulators in Adrenocortical Carcinoma. Front Immunol (2021) 12:637933. doi: 10.3389/fimmu.2021.637933
22. Wilkerson MD, Hayes DN. Consensusclusterplus: A Class Discovery Tool With Confidence Assessments and Item Tracking. Bioinformatics (2010) 26(12):1572–3. doi: 10.1093/bioinformatics/btq170
23. Liberzon A, Subramanian A, Pinchback R, Thorvaldsdóttir H, Tamayo P, Mesirov JP. Molecular Signatures Database (Msigdb) 3.0. Bioinformatics (2011) 27(12):1739–40. doi: 10.1093/bioinformatics/btr260
24. Friedman J, Hastie T, Tibshirani R. Regularization Paths for Generalized Linear Models via Coordinate Descent. J Stat Softw (2010) 33(1):1–22. doi: 10.18637/jss.v033.i01
25. Blanche P, Dartigues JF, Jacqmin-Gadda H. Estimating and Comparing Time-Dependent Areas Under Receiver Operating Characteristic Curves for Censored Event Times With Competing Risks. Stat Med (2013) 32(30):5381–97. doi: 10.1002/sim.5958
26. Yoshihara K, Shahmoradgoli M, Martínez E, Vegesna R, Kim H, Torres-Garcia W, et al. Inferring Tumour Purity and Stromal and Immune Cell Admixture From Expression Data. Nat Commun (2013) 4:2612. doi: 10.1038/ncomms3612
27. Newman AM, Liu CL, Green MR, Gentles AJ, Feng W, Xu Y, et al. Robust Enumeration of Cell Subsets From Tissue Expression Profiles. Nat Methods (2015) 12(5):453–7. doi: 10.1038/nmeth.3337
28. Hänzelmann S, Castelo R, Guinney J. GSVA: Gene Set Variation Analysis for Microarray and RNA-Seq Data. BMC Bioinf (2013) 14:7. doi: 10.1186/1471-2105-14-7
29. Zhang N, Zeng Y, Du W, Zhu J, Shen D, Liu Z, et al. The EGFR Pathway is Involved in the Regulation of PD-L1 Expression via the IL-6/JAK/STAT3 Signaling Pathway in EGFR-Mutated Non-Small Cell Lung Cancer. Int J Oncol (2016) 49(4):1360–8. doi: 10.3892/ijo.2016.3632
30. Bu LL, Yu GT, Wu L, Mao L, Deng WW, Liu JF, et al. STAT3 Induces Immunosuppression by Upregulating PD-1/PD-L1 in HNSCC. J Dent Res (2017) 96(9):1027–34. doi: 10.1177/0022034517712435
31. Cumberbatch MGK, Jubber I, Black PC, Esperto F, Figueroa JD, Kamat AM, et al. Epidemiology of Bladder Cancer: A Systematic Review and Contemporary Update of Risk Factors in 2018. Eur Urol (2018) 74(6):784–95. doi: 10.1016/j.eururo.2018.09.001
32. Hammouz RY, Kołat D, Kałuzińska Ż, Płuciennik E, Bednarek AK. Micrornas: Their Role in Metastasis, Angiogenesis, and the Potential for Biomarker Utility in Bladder Carcinomas. Cancers (Basel) (2021) 13(4):891. doi: 10.3390/cancers13040891
33. Cai Z, Zhang F, Chen W, Zhang J, Li H. Mirnas: A Promising Target in the Chemoresistance of Bladder Cancer. Onco Targets Ther (2019) 12:11805–16. doi: 10.2147/ott.S231489
34. Wieczorek E, Reszka E. Mrna, Microrna and Lncrna as Novel Bladder Tumor Markers. Clin Chim Acta (2018) 477:141–53. doi: 10.1016/j.cca.2017.12.009
35. Parizi PK, Yarahmadi F, Tabar HM, Hosseini Z, Sarli A, Kia N, et al. Micrornas and Target Molecules in Bladder Cancer. Med Oncol (2020) 37(12):118. doi: 10.1007/s12032-020-01435-0
36. Blanca A, Cheng L, Montironi R, Moch H, Massari F, Fiorentino M, et al. Mirna Expression in Bladder Cancer and Their Potential Role in Clinical Practice. Curr Drug Metab (2017) 18(8):712–22. doi: 10.2174/1389200218666170518164507
37. Zhou M, Zhang Z, Zhao H, Bao S, Sun J. A Novel Lncrna-Focus Expression Signature for Survival Prediction in Endometrial Carcinoma. BMC Cancer (2018) 18(1):39. doi: 10.1186/s12885-017-3983-0
38. Zhou M, Zhao H, Wang Z, Cheng L, Yang L, Shi H, et al. Identification and Validation of Potential Prognostic Lncrna Biomarkers for Predicting Survival in Patients With Multiple Myeloma. J Exp Clin Cancer Res (2015) 34(1):102. doi: 10.1186/s13046-015-0219-5
39. Zhou M, Zhao H, Xu W, Bao S, Cheng L, Sun J. Discovery and Validation of Immune-Associated Long non-Coding RNA Biomarkers Associated With Clinically Molecular Subtype and Prognosis in Diffuse Large B Cell Lymphoma. Mol Cancer (2017) 16(1):16. doi: 10.1186/s12943-017-0580-4
40. Jin H, Ying X, Que B, Wang X, Chao Y, Zhang H, et al. N(6)-Methyladenosine Modification of ITGA6 Mrna Promotes the Development and Progression of Bladder Cancer. EBioMedicine (2019) 47:195–207. doi: 10.1016/j.ebiom.2019.07.068
41. Gu C, Wang Z, Zhou N, Li G, Kou Y, Luo Y, et al. Mettl14 Inhibits Bladder TIC Self-Renewal and Bladder Tumorigenesis Through N(6)-Methyladenosine of Notch1. Mol Cancer (2019) 18(1):168. doi: 10.1186/s12943-019-1084-1
42. Zhang J, Zhou Q, Xie K, Cheng L, Peng S, Xie R, et al. Targeting WD Repeat Domain 5 Enhances Chemosensitivity and Inhibits Proliferation and Programmed Death-Ligand 1 Expression in Bladder Cancer. J Exp Clin Cancer Res (2021) 40(1):203. doi: 10.1186/s13046-021-01989-5
43. Han Y, Liu D, Li L. PD-1/PD-L1 Pathway: Current Researches in Cancer. Am J Cancer Res (2020) 10(3):727–42.
44. Chen H, Li M, Huang P. Lncrna SNHG16 Promotes Hepatocellular Carcinoma Proliferation, Migration and Invasion by Regulating Mir-186 Expression. J Cancer (2019) 10(15):3571–81. doi: 10.7150/jca.28428
45. Yang BY, Meng Q, Sun Y, Gao L, Yang JX. Long non-Coding RNA SNHG16 Contributes to Glioma Malignancy by Competitively Binding Mir-20a-5p With E2F1. J Biol Regul Homeost Agents (2018) 32(2):251–61.
46. Han W, Du X, Liu M, Wang J, Sun L, Li Y. Increased Expression of Long non-Coding RNA SNHG16 Correlates With Tumor Progression and Poor Prognosis in non-Small Cell Lung Cancer. Int J Biol Macromol (2019) 121:270–8. doi: 10.1016/j.ijbiomac.2018.10.004
47. Li Y, Lu Y, Chen Y. Long Non-Coding RNA SNHG16 Affects Cell Proliferation and Predicts a Poor Prognosis in Patients With Colorectal Cancer via Sponging Mir-200a-3p. Biosci Rep (2019) 39(5):BSR20182498. doi: 10.1042/bsr20182498
48. Chen W, Jiang T, Mao H, Gao R, Zhang H, He Y, et al. SNHG16 Regulates Invasion and Migration of Bladder Cancer Through Induction of Epithelial-to-Mesenchymal Transition. Hum Cell (2020) 33(3):737–49. doi: 10.1007/s13577-020-00343-9
49. Rosenberg JE, Hoffman-Censits J, Powles T, van der Heijden MS, Balar AV, Necchi A, et al. Atezolizumab in Patients With Locally Advanced and Metastatic Urothelial Carcinoma Who Have Progressed Following Treatment With Platinum-Based Chemotherapy: A Single-Arm, Multicentre, Phase 2 Trial. Lancet (2016) 387(10031):1909–20. doi: 10.1016/s0140-6736(16)00561-4
50. Wu X, Qu D, Weygant N, Peng J, Houchen CW. Cancer Stem Cell Marker DCLK1 Correlates With Tumorigenic Immune Infiltrates in the Colon and Gastric Adenocarcinoma Microenvironments. Cancers (Basel) (2020) 12(2):274. doi: 10.3390/cancers12020274
51. Buonaguro L, Tagliamonte M. Selecting Target Antigens for Cancer Vaccine Development. Vaccines (Basel) (2020) 8(4):615. doi: 10.3390/vaccines8040615
52. Joyce JA, Fearon DT. T Cell Exclusion, Immune Privilege, and the Tumor Microenvironment. Science (2015) 348(6230):74–80. doi: 10.1126/science.aaa6204
53. Waniczek D, Lorenc Z, Śnietura M, Wesecki M, Kopec A, Muc-Wierzgoń M. Tumor-Associated Macrophages and Regulatory T Cells Infiltration and the Clinical Outcome in Colorectal Cancer. Arch Immunol Ther Exp (Warsz) (2017) 65(5):445–54. doi: 10.1007/s00005-017-0463-9
54. Hui L, Chen Y. Tumor Microenvironment: Sanctuary of the Devil. Cancer Lett (2015) 368(1):7–13. doi: 10.1016/j.canlet.2015.07.039
55. Xu Q, Wang C, Yuan X, Feng Z, Han Z. Prognostic Value of Tumor-Infiltrating Lymphocytes for Patients With Head and Neck Squamous Cell Carcinoma. Transl Oncol (2017) 10(1):10–6. doi: 10.1016/j.tranon.2016.10.005
Keywords: bladder cancer, N6-methyladenosine, prognostic signature, immune infiltration, long non-coding RNA
Citation: Chen K, Zhu S, Yu W, Xia Y, Xing J, Geng J and Cheng F (2022) Comprehensive Analysis of N6-Methylandenosine-Related Long Non-Coding RNAs Signature in Prognosis and Tumor Microenvironment of Bladder Cancer. Front. Oncol. 12:774307. doi: 10.3389/fonc.2022.774307
Received: 11 September 2021; Accepted: 04 January 2022;
Published: 24 January 2022.
Edited by:
Chengfei Liu, UC Davis Medical Center, United StatesCopyright © 2022 Chen, Zhu, Yu, Xia, Xing, Geng and Cheng. This is an open-access article distributed under the terms of the Creative Commons Attribution License (CC BY). The use, distribution or reproduction in other forums is permitted, provided the original author(s) and the copyright owner(s) are credited and that the original publication in this journal is cited, in accordance with accepted academic practice. No use, distribution or reproduction is permitted which does not comply with these terms.
*Correspondence: Jie Geng, miwai668@163.com; Fan Cheng, urology1969@aliyun.com
†These authors have contributed equally to this work