- 1Department of Healthcare Administration and Medical Informatics, Kaohsiung Medical University, Kaohsiung, Taiwan
- 2Department of Business Management, National Sun Yat-sen University, Kaohsiung, Taiwan
- 3Department of Medical Research, Kaohsiung Medical University Hospital, Kaohsiung, Taiwan
- 4Department of Medical Research, China Medical University Hospital, China Medical University, Taichung, Taiwan
- 5Division of Colorectal Surgery, Department of Surgery, Kaohsiung Medical University Hospital, Kaohsiung Medical University, Kaohsiung, Taiwan
- 6Department of Surgery, Faculty of Medicine, College of Medicine, Kaohsiung Medical University, Kaohsiung, Taiwan
- 7Graduate Institute of Clinical Medicine, College of Medicine, Kaohsiung Medical University, Kaohsiung, Taiwan
- 8Division of General and Digestive Surgery, Department of Surgery, Kaohsiung Medical University Hospital, Kaohsiung Medical University, Kaohsiung, Taiwan
- 9Department of Surgery, Kaohsiung Municipal Tatung Hospital, Kaohsiung Medical University, Kaohsiung, Taiwan
- 10Center for Cancer Research, Kaohsiung Medical University, Kaohsiung, Taiwan
- 11Center for Liquid Biopsy and Cohort Research, Kaohsiung Medical University, Kaohsiung, Taiwan
- 12Pingtung Hospital, Ministry of Health and Welfare, Pingtung, Taiwan
Objective: Patients with metastatic colorectal cancer (mCRC) had oncological benefits with irinotecan dose escalation of FOLFIRI regimen combined with bevacizumab according to UGT1A1 genotypes in our previous study. In the current study, we performed a quality of life (QOL) outcome evaluation and cost-utility analysis of different irinotecan dose regimens in patients with mCRC.
Materials and Methods: With inverse probability-of-treatment weighting (IPTW) matching on all covariates, 75 patients with dose escalation of irinotecan (study group) and 121 patients with the recommended dose of irinotecan (control group) were recruited between October 2015 and December 2019. The QOL outcome measures were Functional Assessment of Cancer Therapy-Colorectal, Beck Anxiety Inventory, Beck Depression Inventory, and SF-36; cost-utility outcome measures were medical direct costs, quality-adjusted life-years (QALYs), and incremental cost-utility ratios (ICURs).
Results: All mCRC patients exhibited a significant decrease in both emotional wellbeing and depression from pretherapeutic period to posttherapeutic 6th month (P < 0.05); however, from the posttherapeutic 1st year to the 2nd year, improvement in most QOL measures was significantly better in the study group than in the control group (P < 0.05). Over a 2-year time period, the study group had higher total medical direct costs than the control group (US$ 54,742 ± 14,013 vs. US$ 54,608 ± 9,673) and higher average QALYs gained (1.88 vs. 1.65), with an ICUR of US$ 583 per QALY gained.
Conclusion: For patients with mCRC, irinotecan dose escalation appeared cost-effective with considerable QOL improvements during the study period. Further randomized, multi-institutional controlled trials are warranted to corroborate these results.
Introduction
With the recent advances in pharmacogenomic era, patients undergo genetic testing to determine their genotype before treatment, based on which a suitable medication or dosage is administered (1–3). For metastatic colorectal cancer (mCRC) patients, the standard chemotherapy regimens are 5-fluorouracil (5-FU), leucovorin, and oxaliplatin (FOLFOX); oxaliplatin with capecitabine (CAPOX); or 5-FU, leucovorin, and irinotecan (FOLFIRI). Bevacizumab is a recombinant humanized monoclonal antibody targeting the vascular endothelial growth factor and is usually added to these standard regimens to enhance the efficacy. Our previous multicenter, randomized, controlled, open-label trial study revealed that exceeding the recommended irinotecan dose is safe and effective when a regimen of FOLFIRI plus bevacizumab is administered in mCRC patients with UGT1A1∗1/∗1 and UGT1A1∗1/∗28 genotypes. Additionally, pretherapeutic UGT1A1 genotyping–guided dose adjustment achieved better outcomes compared to the standard regimen. This intention-to-treat (ITT) analysis also demonstrated the benefits of escalating doses of irinotecan under UGT1A1 genotyping. Likewise, other previous studies have also suggested that higher doses of irinotecan in the first-line or later-line setting in mCRC can confer favorable clinical outcomes (4–7).
Roncato et al. estimated the per-patient cost of treating irinotecan-related toxicity associated with the UGT1A1*28 patient genotype. Mean per-patient cost was €812 for UGT1A1*1/*1 patients, €1,119 for UGT1A1*1/*28 patients, and €4,886 for UGT1A1*28/*28 patients (8). Notably, the incremental treatment cost per patient was €4,074 higher in UGT1A1*28/*28 patients compared to UGT1A1*1/*1 patients and €307 higher in UGT1A1*28/*28 patients compared to UGT1A1*1/*28 patients. Kristin et al. also found that the total per-patient cost of a FOLFOX or FOLFIRI chemotherapy regimen was 359 million Indonesian Rupiah (IDR) with a mean average of 1.90 quality-adjusted life-years (QALYs) over a life-time horizon. Additionally, although FOLFOX or FOLFIRI plus bevacizumab increased the total per-patient cost by 108 million IDR, it increased QALYs by 0.17 (9).
Although irinotecan dose escalation demonstrates a more optimal treatment effect in patients with mCRC undergoing UGT1A1 genotyping and receiving FOLFIRI, the cost utility of different doses of irinotecan plus bevacizumab has not been comprehensively investigated. Additionally, most studies on the economic and cost-effectiveness of this treatment have analyzed the short-term results; however, few studies have analyzed the long-term results. Therefore, the objective of this prospective, long-term follow-up study was to perform a quality of life (QOL) outcome evaluation and a cost-utility analysis of different doses of irinotecan plus bevacizumab in patients with mCRC in the first-line setting.
Methods
Study Design and Study Population
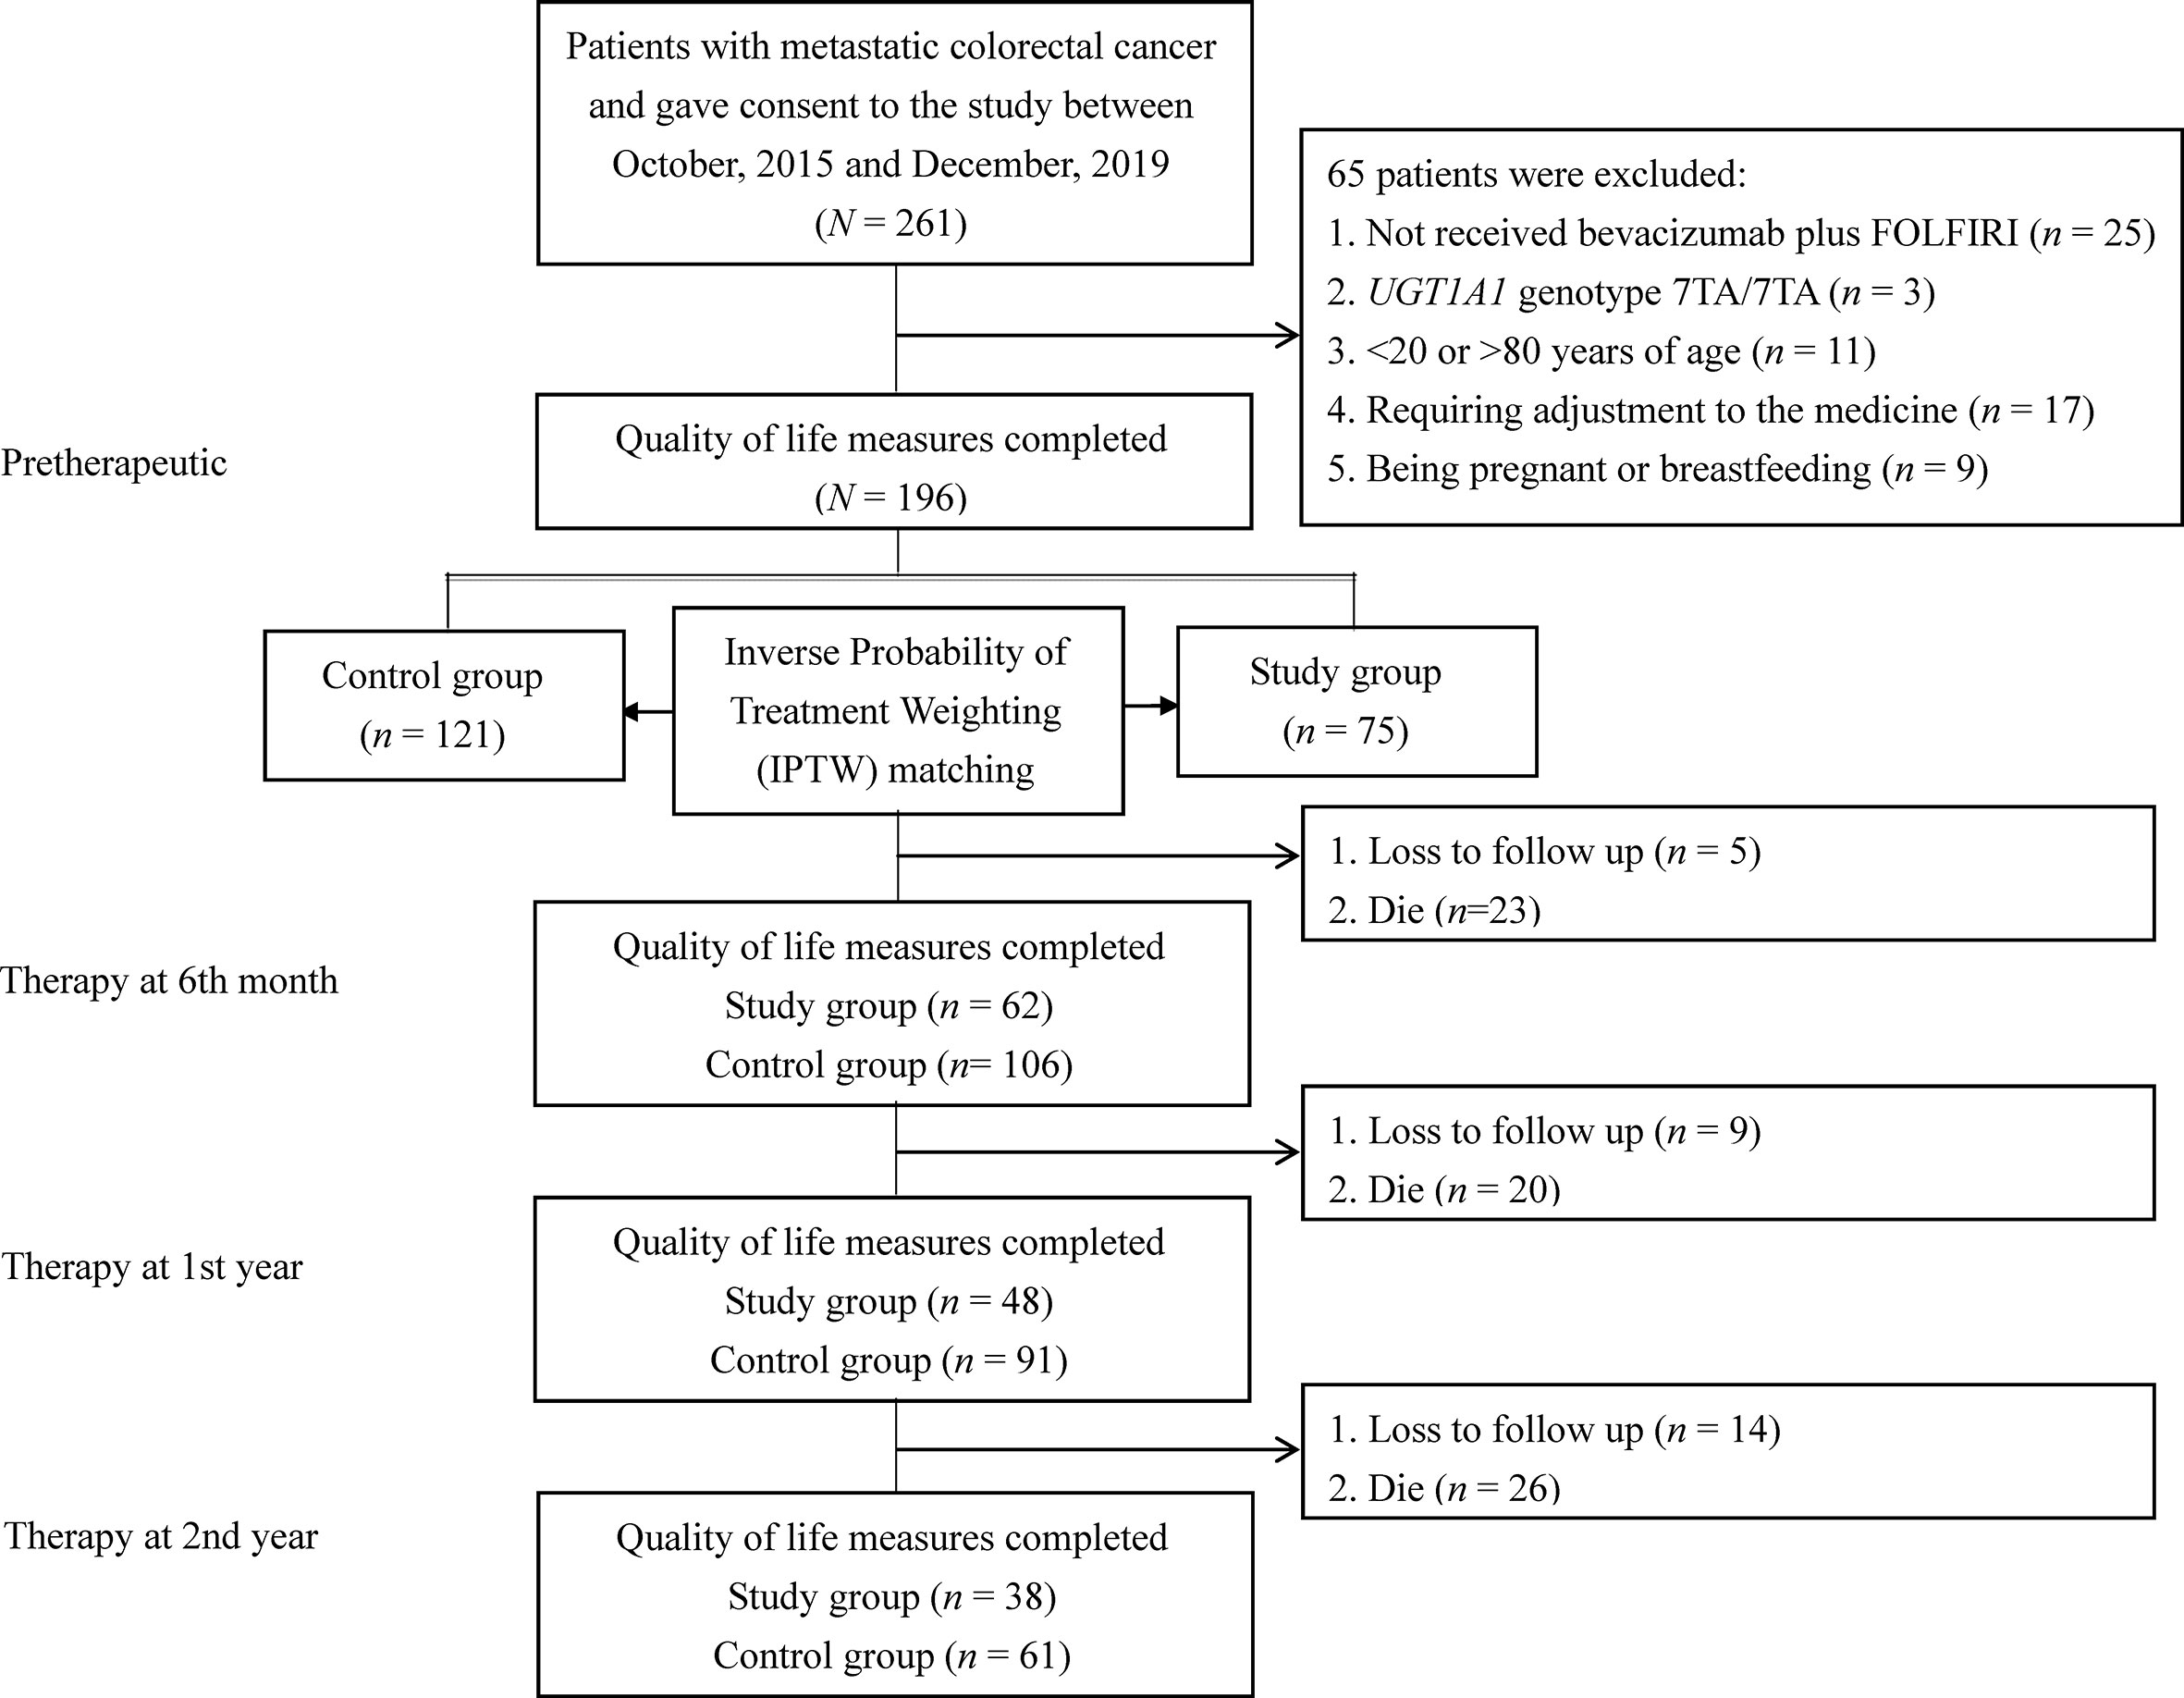
The study population included patients with mCRC at a medical center between October 2015 and December 2019. The inclusion criteria were as follows: (a) patients who underwent UGT1A1 genotyping before treatment; (b) mCRC patients with histologically diagnosed adenocarcinoma, and (c) patients aged 20–80 years. The exclusion criteria were as follows: (a) no receipt of bevacizumab plus FOLFIRI, (b) the UGT1A1 genotype 7TA/7TA (UGT1A1*28*28); (c) <20 or >80 years of age; (d) no dose esclation due to discomfort experienced by those in the dose escalation group; (e) being pregnant or breastfeeding; (f) a major comorbidity; and (g) having not signed the consent form. The recommended irinotecan dose in the FOLFIRI regimen is 180 mg/m2 based on a dose-finding study (2, 4, 10). The detailed treatment regimen on irinotecan dose escalation including patient withdrawal was described in our previous study protocol (11). According to the above criteria, mCRC patients were divided into two groups: 75 patients were categorized into the dose escalation group (>180 mg/m2, study group) and 121 patients into the recommended dose group (180 mg/m2, control group). The patients in the recommended dose group received irinotecan at a dose of 180 mg/m2. Figure 1 shows a flow diagram of the current study illustrating the enrollment, allocation, and matching analysis processes. Before study initiation, approval was obtained from the Institutional Review Board of our hospital (KMUHIRB-(EI)-20150147). The patients/participants provided their written informed consent to participate in this study.
Quality of Life Measures
The QOL measures included the Functional Assessment of Cancer Therapy-Colorectal (FACT-C) (12), Beck Depression Inventory (BDI) (13), Beck Anxiety Inventory (BAI) (14), and SF-36 (15). Higher FACT-C and SF-36 scores indicated better outcomes, but higher BDI and BAI scores exhibited worse outcomes. All enrolled patients were scheduled to complete all the above assessments at four time points: pretherapeutic and therapy at posttherapeutic 6th month, 1st year, and 2nd year.
Economic Evaluation
Cost Estimation
In accordance with the reimbursement criteria established by the National Health Insurance Administration, medical cost structure included total medical direct costs during therapy and total inpatient costs, total outpatient costs, and total medical emergency costs at posttherapeutic 2 years after discharge. All medical direct costs included expenses for physicians, ward, pharmacy, laboratory, inspection, medical materials, etc. All cost inputs were adjusted to US$ 2019 according to the consumer price index (CPI) and discounted annually by 3%.
Estimation of Utility
To estimate QALYs, cost-utility analysis often uses “utility scores” (health state valuations) anchored by 0 and 1, where 0 indicates death and 1 indicates full health. This study used the time trade-off valuation procedure to convert EuroQol-5D (EQ-5D) total scores to utility scores (16). The utilities reported by each patient were multiplied by the assumed duration of sustained benefit after intervention (summed up to the end of 2 years) to estimate QALYs. To maintain consistency with QALYs calculation, this study assumed that the only resources used by patients were those captured during the 2 years of follow-up. That is, the analysis assumed that patients did not incur any other healthcare costs during the remainder of the year.
Statistical Analysis
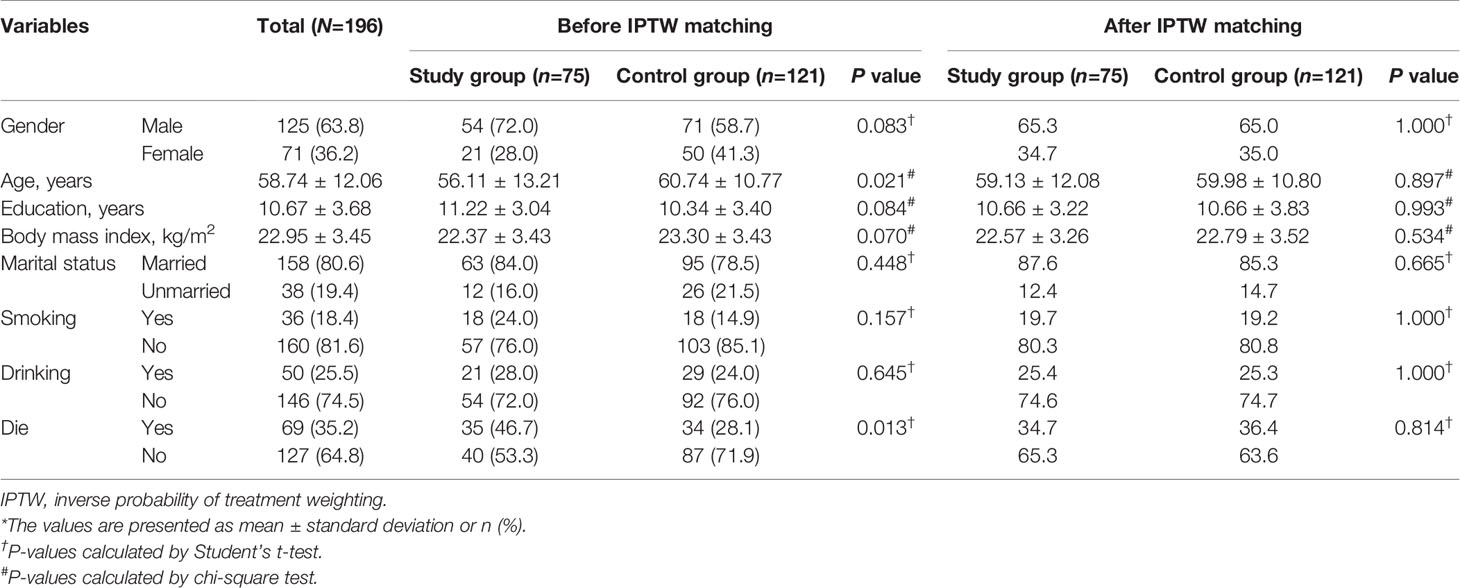
In the main patient-level analysis, we used inverse probability-of-treatment weighting (IPTW) based on propensity score to construct a weighted cohort of patients with different doses of irinotecan plus bevacizumab but similar with respect to other study characteristics. IPTW based on propensity scores was used to account for differences in study characteristics between the two regimens (17). The resulting differences between the weighted groups of interest reflected the average treatment effect (Table 1). The distribution of FACT-C scores at each time point was analyzed in terms of median, range and interquartile range and visualized by box-and-whisker plots.
A common limitation of longitudinal studies is the absence of an appropriate statistical methodology that can control for censoring and intercorrelations that occur when measures are repeatedly obtained for the same pool of subjects. To address this limitation, this study used a generalized estimating equation (GEE) model to cluster mCRC patients; the GEE model was also useful for generating propensity scores. Moreover, total scores for each QOL measure were compared between the study group and control group by using the differences-in-differences (DID) methodology (i.e., a pre–post study design with a comparison group) (18). Standard errors in DID in the predicted values were estimated using the bootstrap technique (1,000 replications and sample sizes equal to the original sample size) (19). Additionally, effect size was obtained using Cohen’s d statistics (i.e., the difference between the mean posttherapeutic QOL value and the mean pretherapeutic QOL value divided by the pooled standard deviation) (20).
After converting EQ-5D scores into utility scores, the number of QALYs over a period of 2 years was calculated for each patient by using the area under the curve approach after controlling for imbalances in baseline utility scores (21). The incremental cost-utility ratio (ICUR) was calculated as the ratio of the difference in mean cost per patient to the difference in mean QALYs per patient between the study and control groups. A willingness-to-pay (WTP) threshold of gross domestic product (GDP) US$ 26,263.5 per QALY was used to assess cost-effectiveness. A regimen is termed dominant when it is both less costly and more effective. To derive cost-effectiveness acceptability curve, this study performed nonparametric bootstrapping on the incremental cost and effectiveness with 1,000 replications and a cost-effectiveness acceptability frontier. All P values reported were two-sided, and P values of <0.05 were considered statistically significant. The software package used to perform GEE in all statistical analyses was xtgee in Stata version 13.0 (Stata Corp LP, College Station, TX, USA), and a decision tree model was built using the TreeAge Pro 2017 (Tree-Age Software Inc. Williamstown, MA, USA).
Results
To unify the study characteristics of the two groups and reinforce the subsequent research results, IPTW was used to match all study characteristics; thus, no variables were significantly different between the groups (Table 1).
Changing Trends of QOL in the Two Groups After IPTW
Figure 2 shows box plots illustrating the FACT-C score distributions in the study and control groups at different time points. From pretherapeutic to posttherapeutic 6th month after discharge, mCRC patients exhibited a significant decrease in FACT-C functional wellbeing (ES = −1.05 in the study group and ES = −0.35 in the control group), SF-36 physical functioning (ES = −0.39 in the study group and ES = −0.37 in the control group), and depression function (ES = 0.28 in the study group and ES = 0.13 in the control group; Tables 2, 3). At the remaining follow-up time points, different changing trends in QOL values in the two groups were noted.
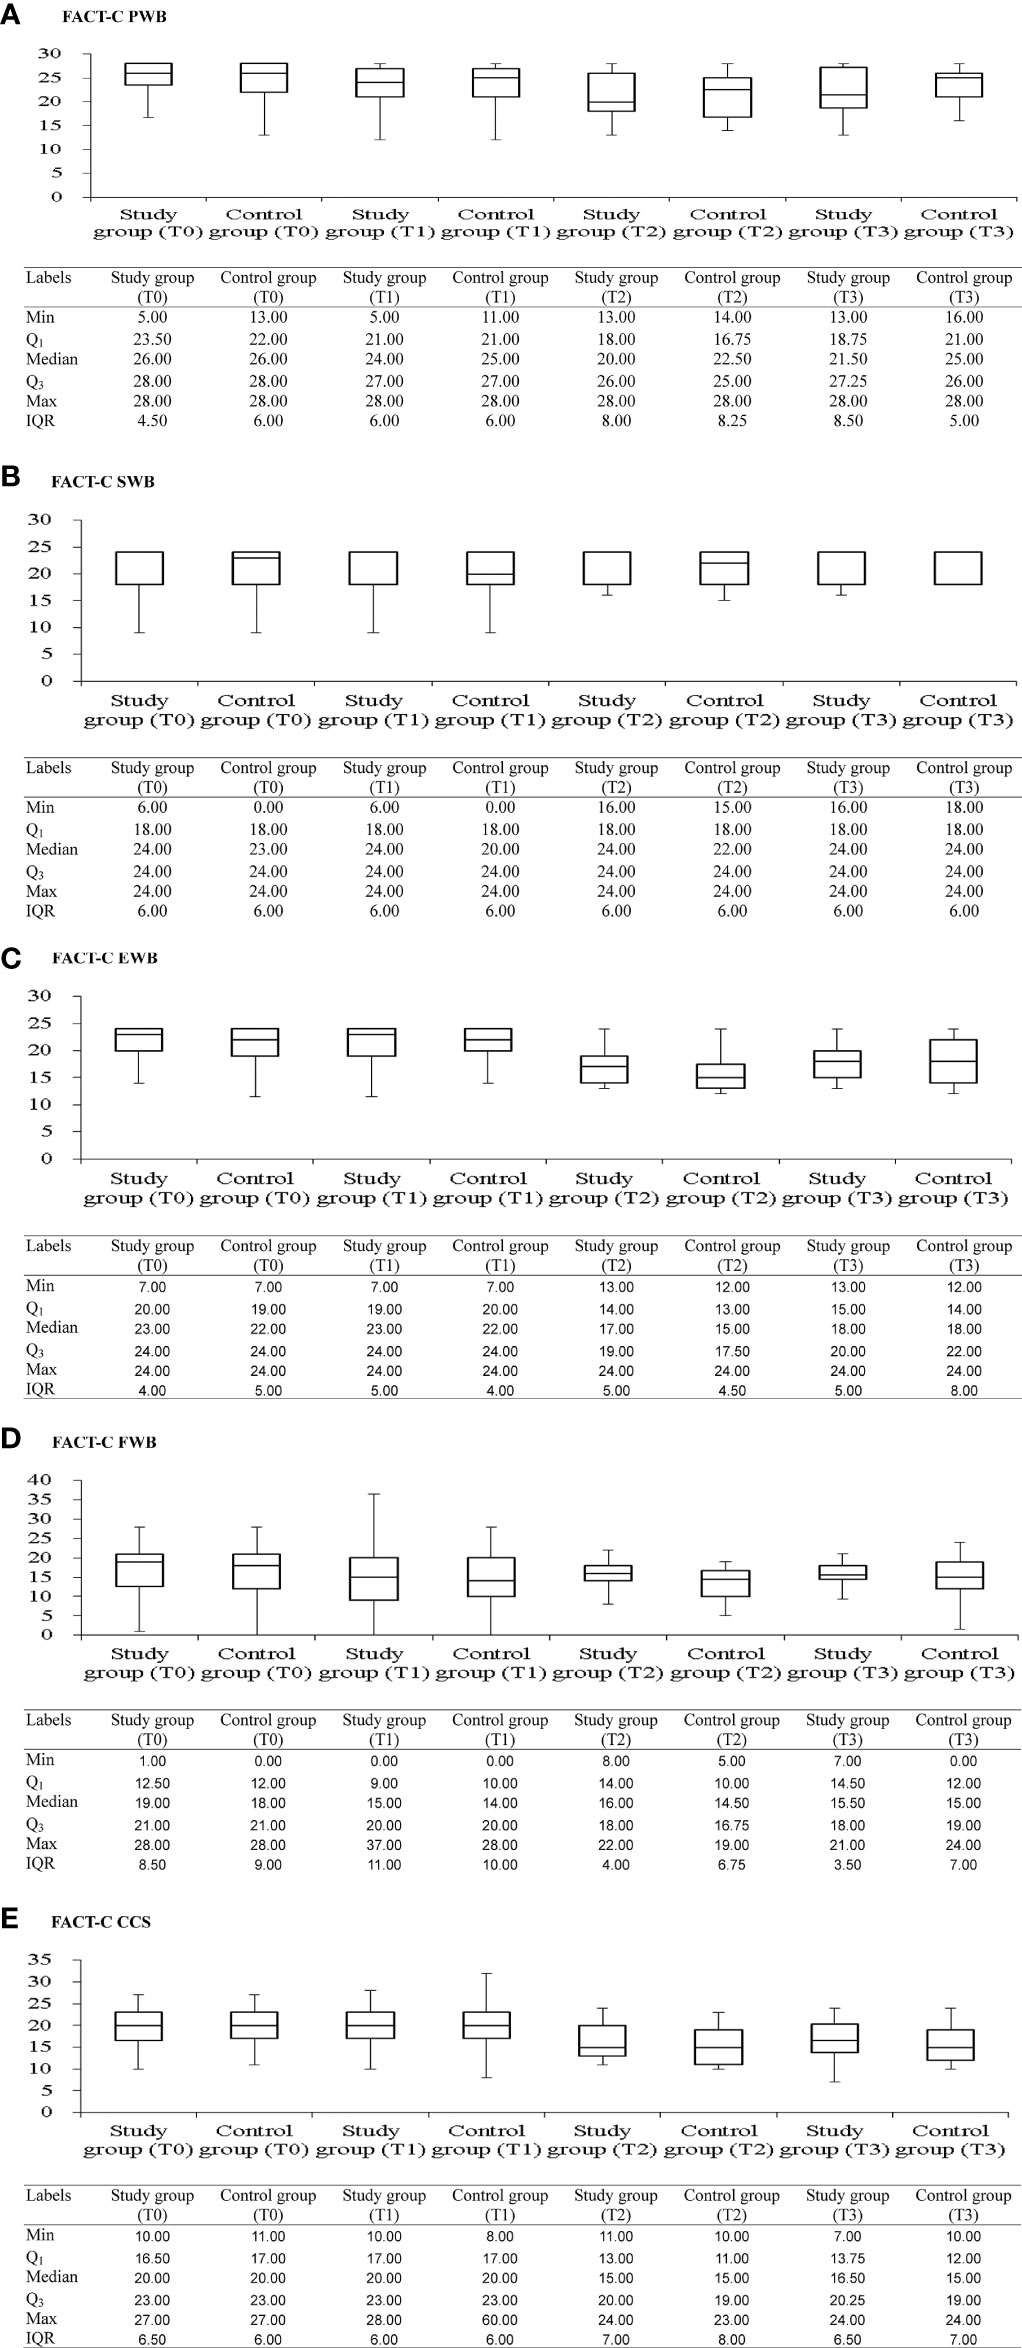
Figure 2 Box and whisker plots of the FACT-C scores [(A) FACT-C PWB; (B) FACT-C SWB; (C) FACT-C EWB; (D) FACT-C EWB; (E) FACT-C CCS] at each time-point, with study and control groups presented side by side. The box contains 50% of all values (the 25th to 75th percentile) and is divided by the horizontal bar which is the median value (50th percentile). FACT-C, functional assessment of cancer therapy-colorectal; PWB, physical wellbeing; SWB, social/family wellbeing; EWB, emotional wellbeing; FWB, functional wellbeing; CCS, colorectal cancer specific wellbeing; T0, pretherapeutic; T1, posttherapeutic 6th month; T2, posttherapeutic 1st year; T3, posttherapeutic 2nd year.
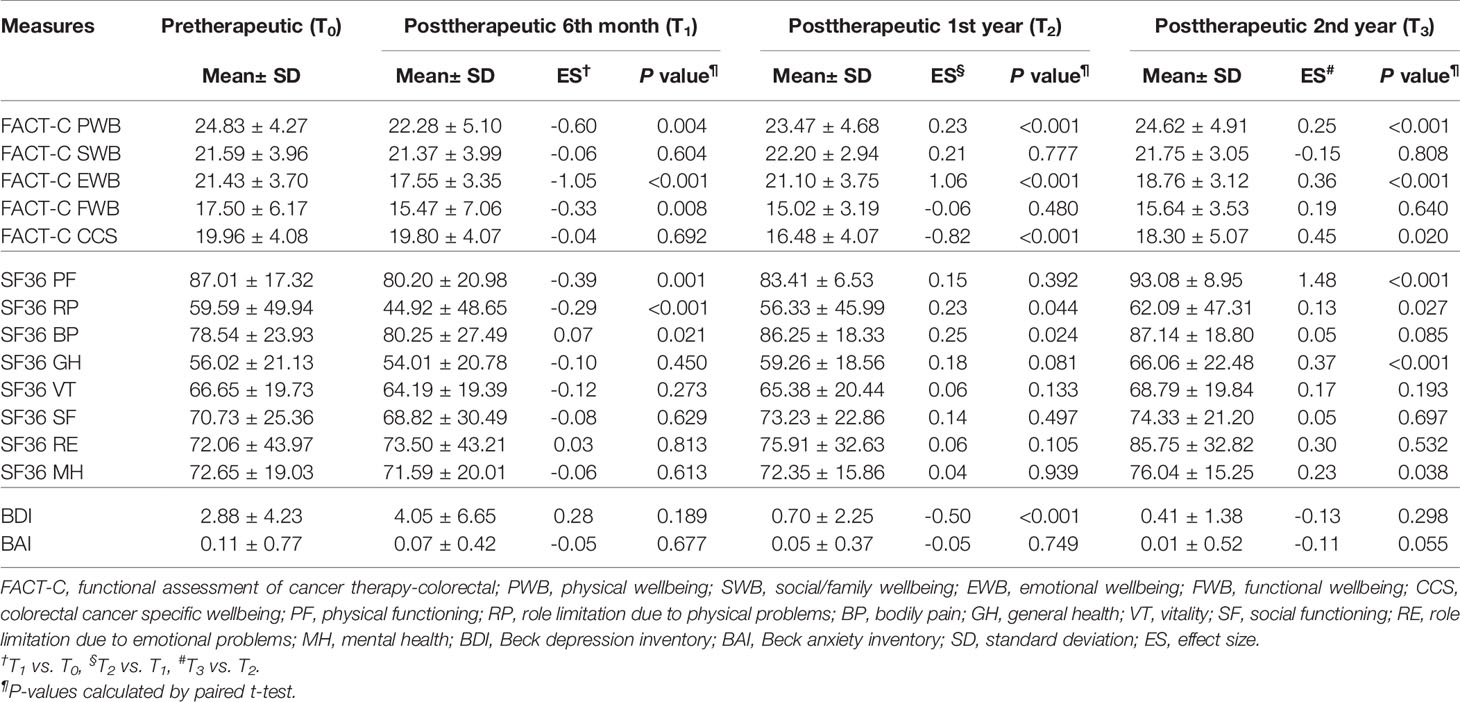
Table 2 Paired t test was employed to evaluate trends of the FACT-C, BDI, BAI, and SF-36 in the study group in patients with metastatic colorectal cancer at different time points (N=75).
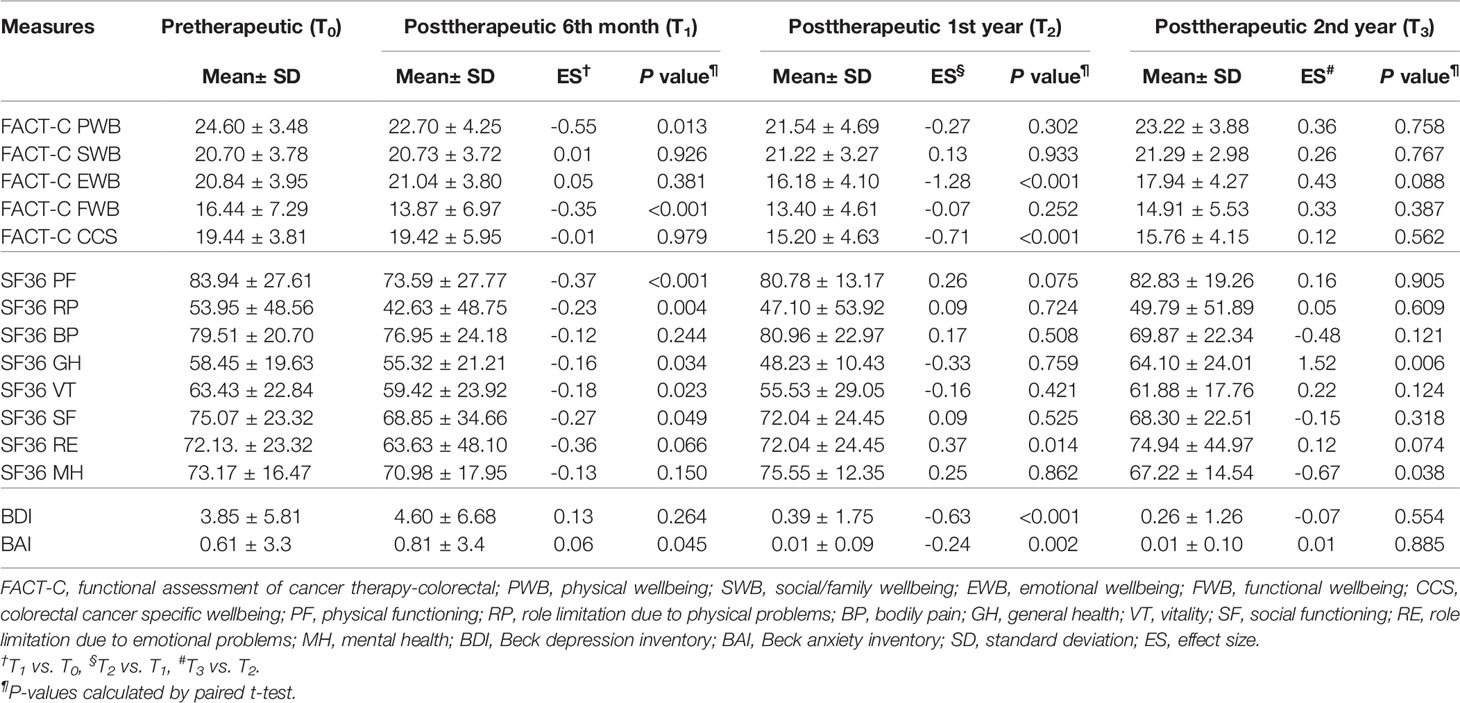
Table 3 Paired t test was employed to evaluate trends of the FACT-C, BDI, BAI, and SF-36 in the control group in patients with metastatic colorectal cancer at different time points (n=121).
Differences in the QOL Between the Two Groups After IPTW
Table 4 presents a comparison of the differences in QOL measures between the two groups at four time points: pretherapeutic (T0), posttherapeutic 6th month (T1), posttherapeutic 1st year (T2), and posttherapeutic 2nd year (T3). Compared with the control group, at T0, the study group had a significantly better function in FACT-C social/family wellbeing (P = 0.024) and BAI (P = 0.039); at T1, the study group had a significantly better function in FACT-C functional wellbeing (P = 0.025), BAI (P = 0.003), SF-36 physical functioning (P = 0.008), vitality (P = 0.031), and role limitation due to emotional problems (P = 0.033); at T2, the study group had a significantly better function in FACT-C physical wellbeing (P = 0.025), FACT-C emotional wellbeing (P = 0.002), and SF-36 role limitation due to physical problems (P = 0.033); at T3, the study group had a significantly better function in FACT-C colorectal cancer-specific wellbeing (P = 0.017), BAI (P = 0.009), SF-36 physical functioning (P = 0.002), role limitation due to physical problems (P = 0.004), and role limitation due to emotional problems (P = 0.017). Overall, from posttherapeutic 1st year to the 2nd year, improvements in most QOL measures were significant in the study group compared with those in the control group (P < 0.05).
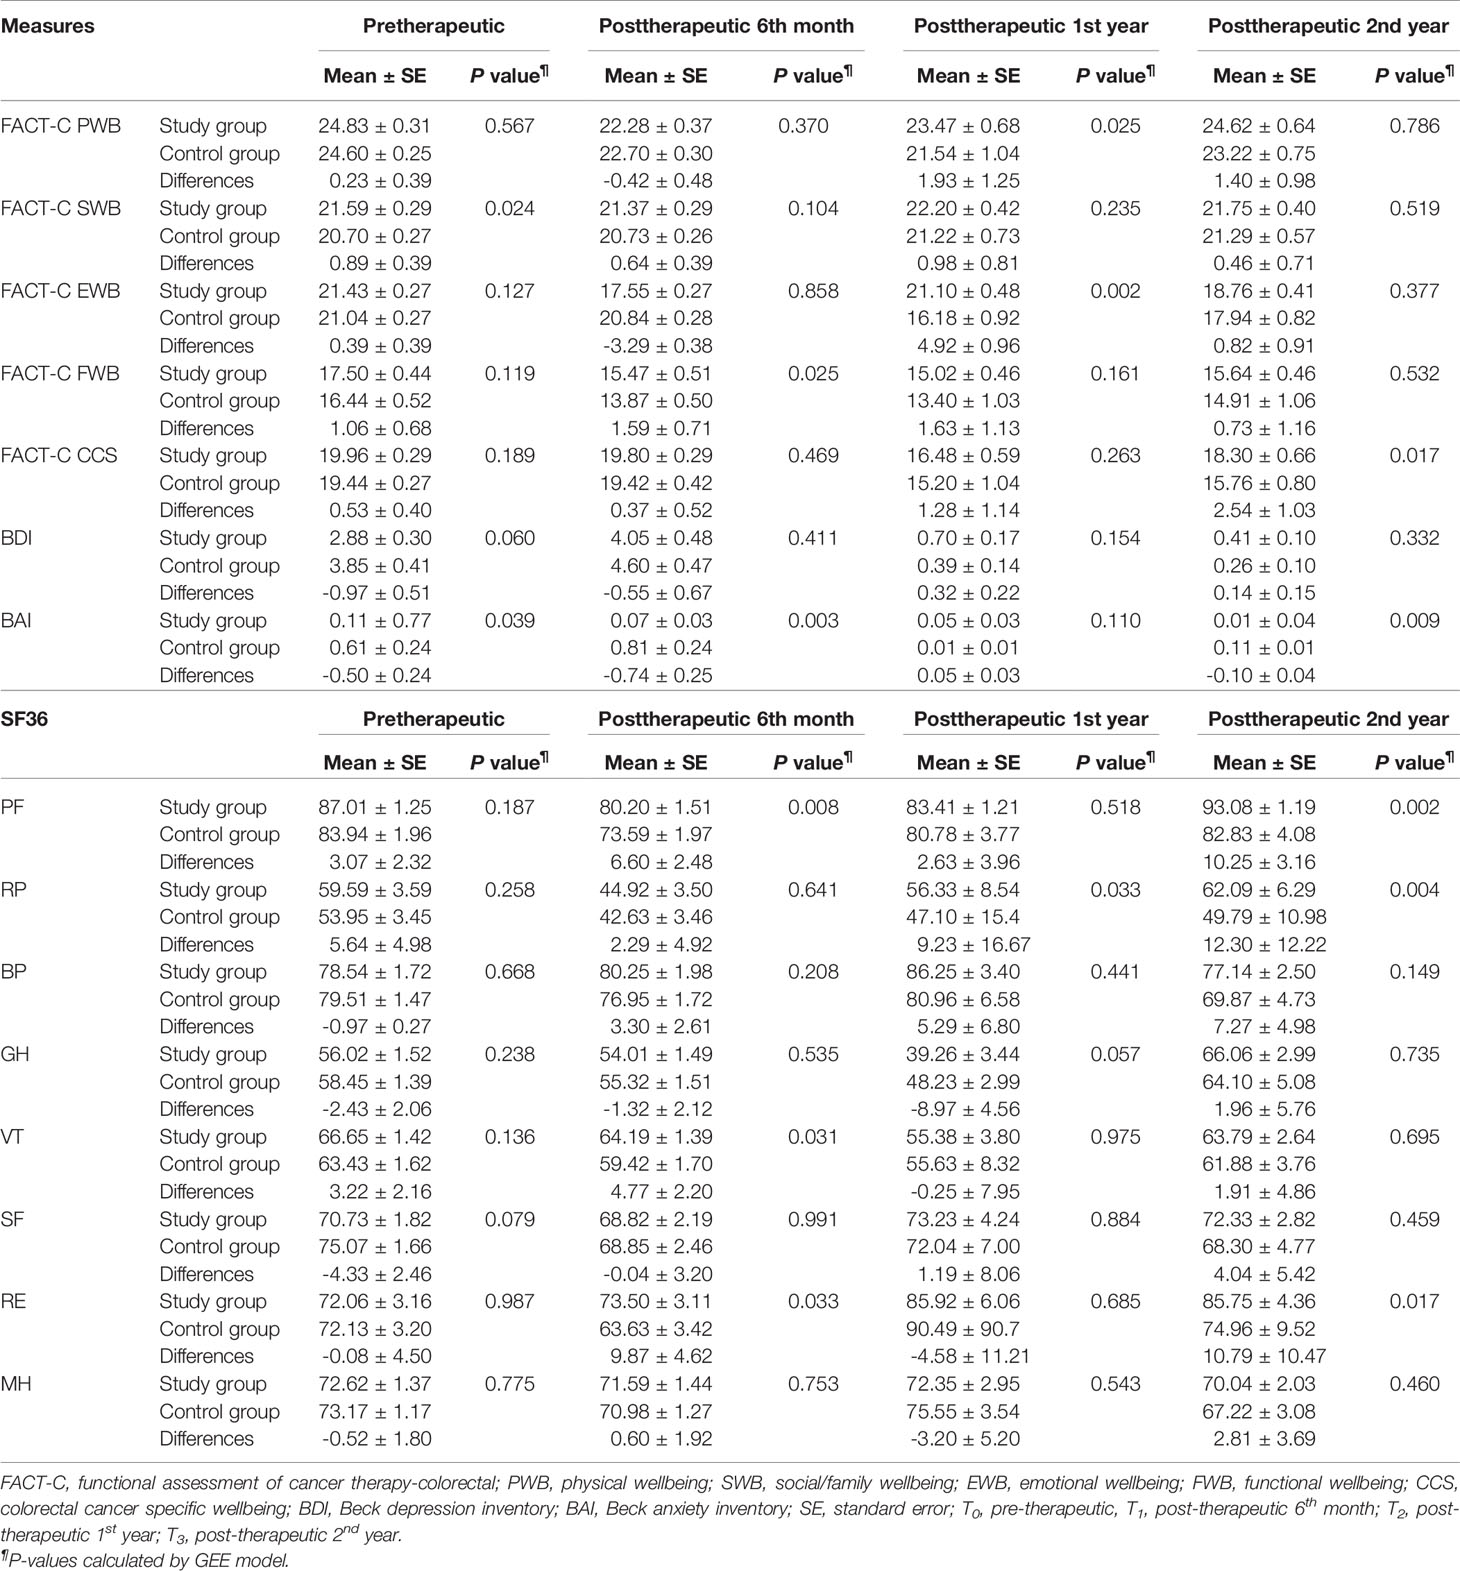
Table 4 Generalized estimating equations (GEE) model with difference-in-difference (DID) method was employed to evaluate differences in the FACT-C, BDI, BAI, and SF-36 between the two groups in patients with metastatic colorectal cancer at different time points (N=196).
Cost-Utility Analysis of the Study Group Compared With the Control Group
The mean total medical direct costs per patient over a 2-year time period included the mean total medical direct costs during therapy and the mean total medical direct costs at posttherapeutic 2 years after discharge. The mean total medical direct cost of the study group was US$ 54,742 (standard deviation, SD, US$ 14,013) compared with US$ 54,608 (SD US$ 9,673) for the control group, resulting in mean incremental costs of US$ 134 (Table 5). Treatment in the study group led to a decrease in the mean utility score from 0.97 (SD 0.09) at the pretherapeutic time point to 0.95 (SD 0.09) at posttherapeutic 2nd year compared with the control group, which had a mean of 0.94 (SD 0.16) at the pretherapeutic time point to 0.86 (SD 0.24) at posttherapeutic 2nd year (Table 6 and Figure 3). After adjusting for pretherapeutic utility, the mean QALYs per patient in the study group was 1.88, whereas the mean QALYs per patient in the control group was 1.65. This resulted in an ICUR of US$ 583 per QALY over the first 2 years for patients in the study group.
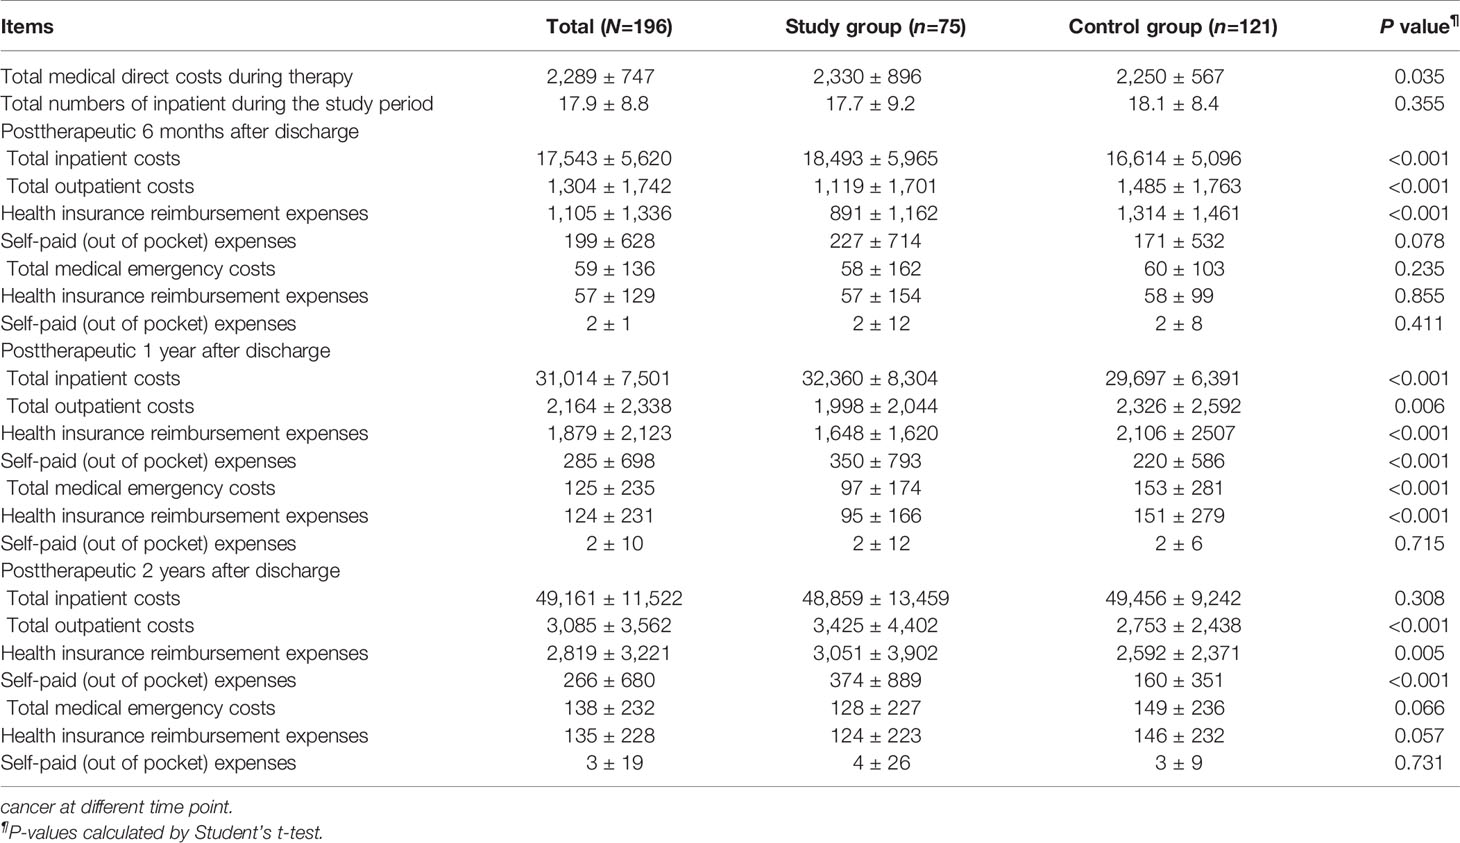
Table 5 Comparisons of means and standard deviations of medical direct costs between the two groups in patients with metastatic colorectal.
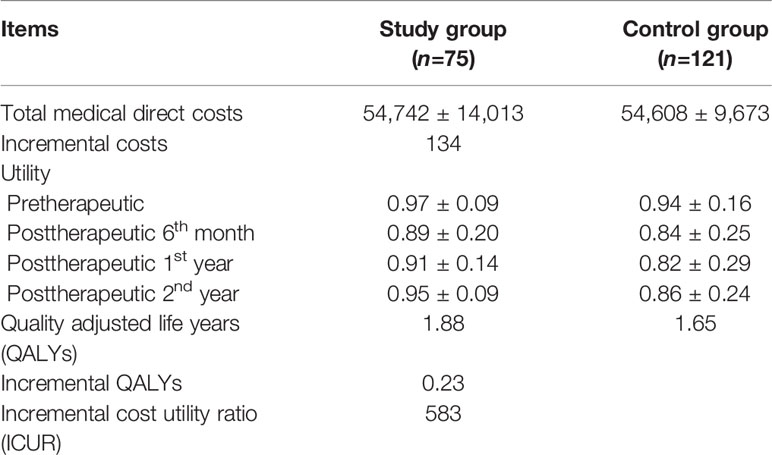
Table 6 Cost utility analysis of the study group compared to the control group in patients with metastatic colorectal cancer over a 2-year time horizon (N=196).
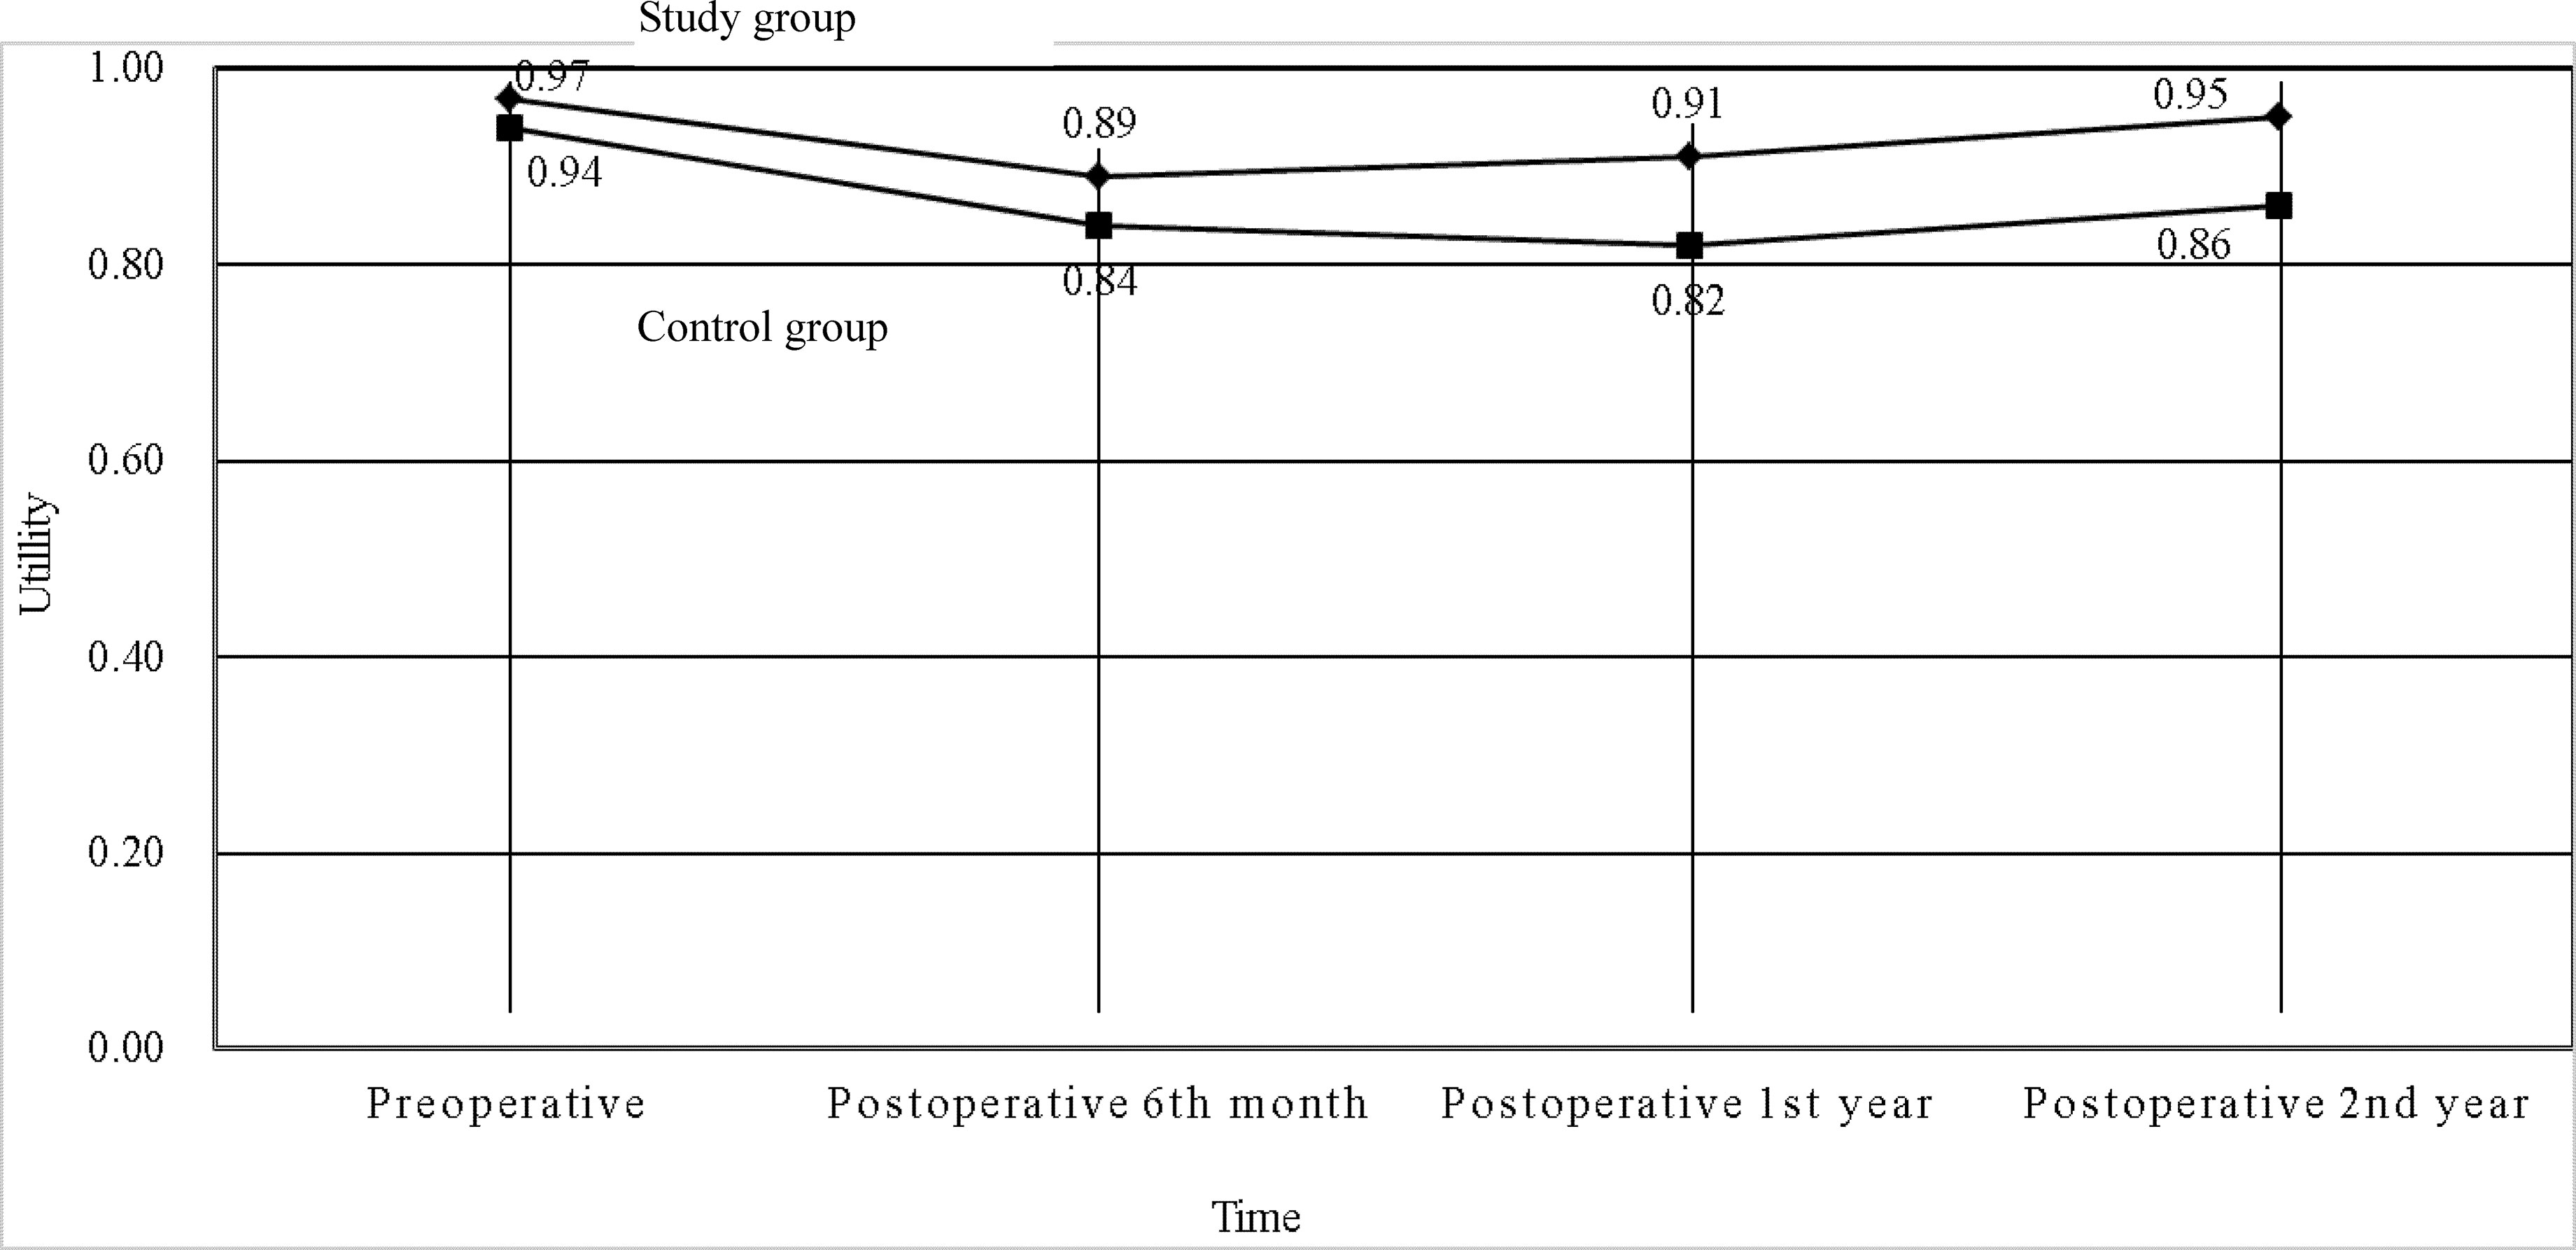
Figure 3 Utilities of the two groups in patients with metastatic colorectal cancer at different time points (N = 196).
Sensitivity Analysis
Probabilistic Sensitivity Analysis (PSA)
The ICURs for the 1,000 samples in the PSA are shown in the scatter plot (Figure 4). All points were under the US$ 26,263.5-per-QALY level, and 100% of the tested ICURs were in the northeastern quadrant. The cost-effectiveness acceptability curve is also shown in Figure 5 for varying values of WTP per QALY.
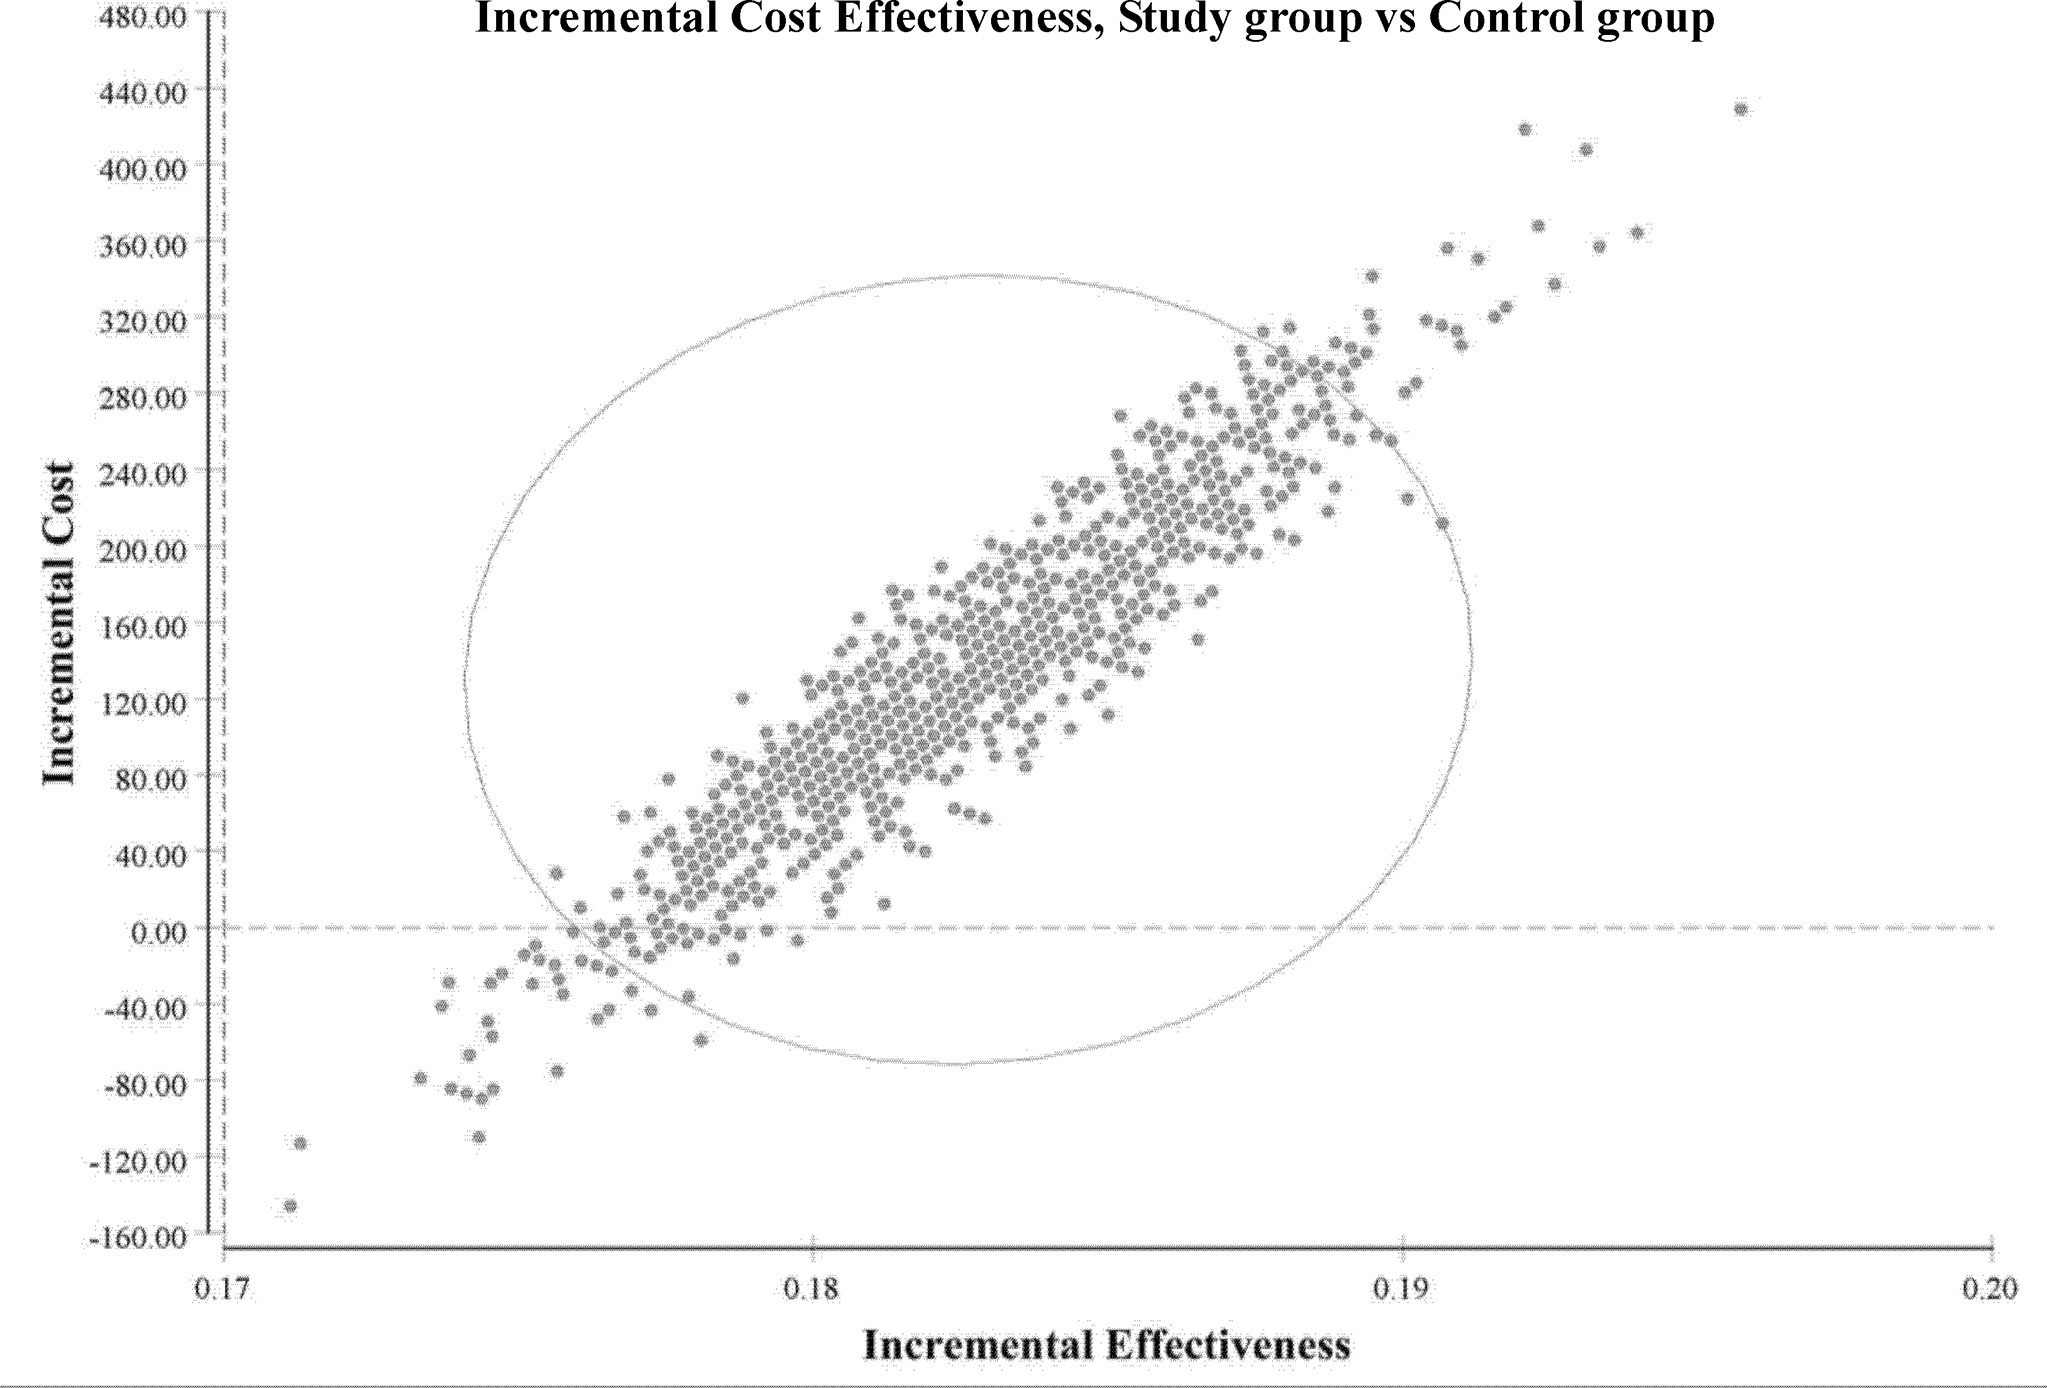
Figure 4 Incremental cost-effectiveness (study group vs. control group). Scatter plots of incremental effectiveness (quality-adjusted life-years) versus incremental costs from 1,000 resamplings in the probabilistic sensitivity analysis with variation limited to cost and effectiveness assumptions and with transition-probabilities constant. This probabilistic sensitivity analysis demonstrated that the study group had a 100% probability of achieving cost-effectiveness relative to the control group in patients with metastatic colorectal cancer. Each plotted point is the result of an incremental cost divided by incremental quality-adjusted life-years. The elliptic circle represents the 95% confidence interval.
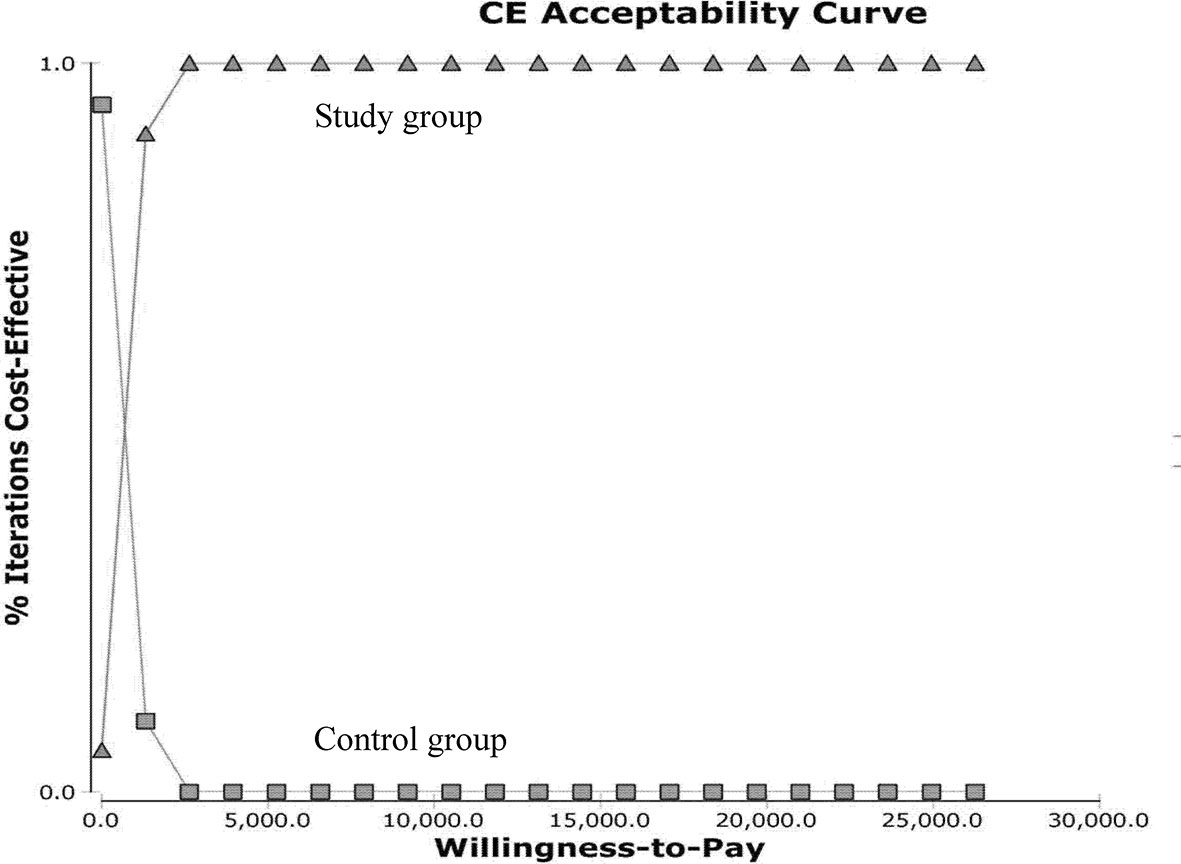
Figure 5 Cost-effectiveness acceptability curves for the probabilistic sensitivity analysis. Results from 1,000 resamplings in the probabilistic sensitivity analysis created synthetic populations of patients from the trial using bootstrapping. The lines represent the fraction of simulation iterations in which the study group achieved more cost-effectiveness than the control group (y-axis) at various levels of willingness to pay for quality-adjusted life-year (QALYs) gains (x-axis).
Univariable Sensitivity Analysis (USA)
The results of the USA are shown in the tornado diagram (Figure 6). The parameters with the greatest influence on the ICUR were total costs in the study group with improved QOL, followed by total costs in the study group with maintained QOL, and total costs in the control group with maintained QOL. Even with a broad variation in range for each parameter, the ICUR remained below US$ 26,263.5 per QALY.
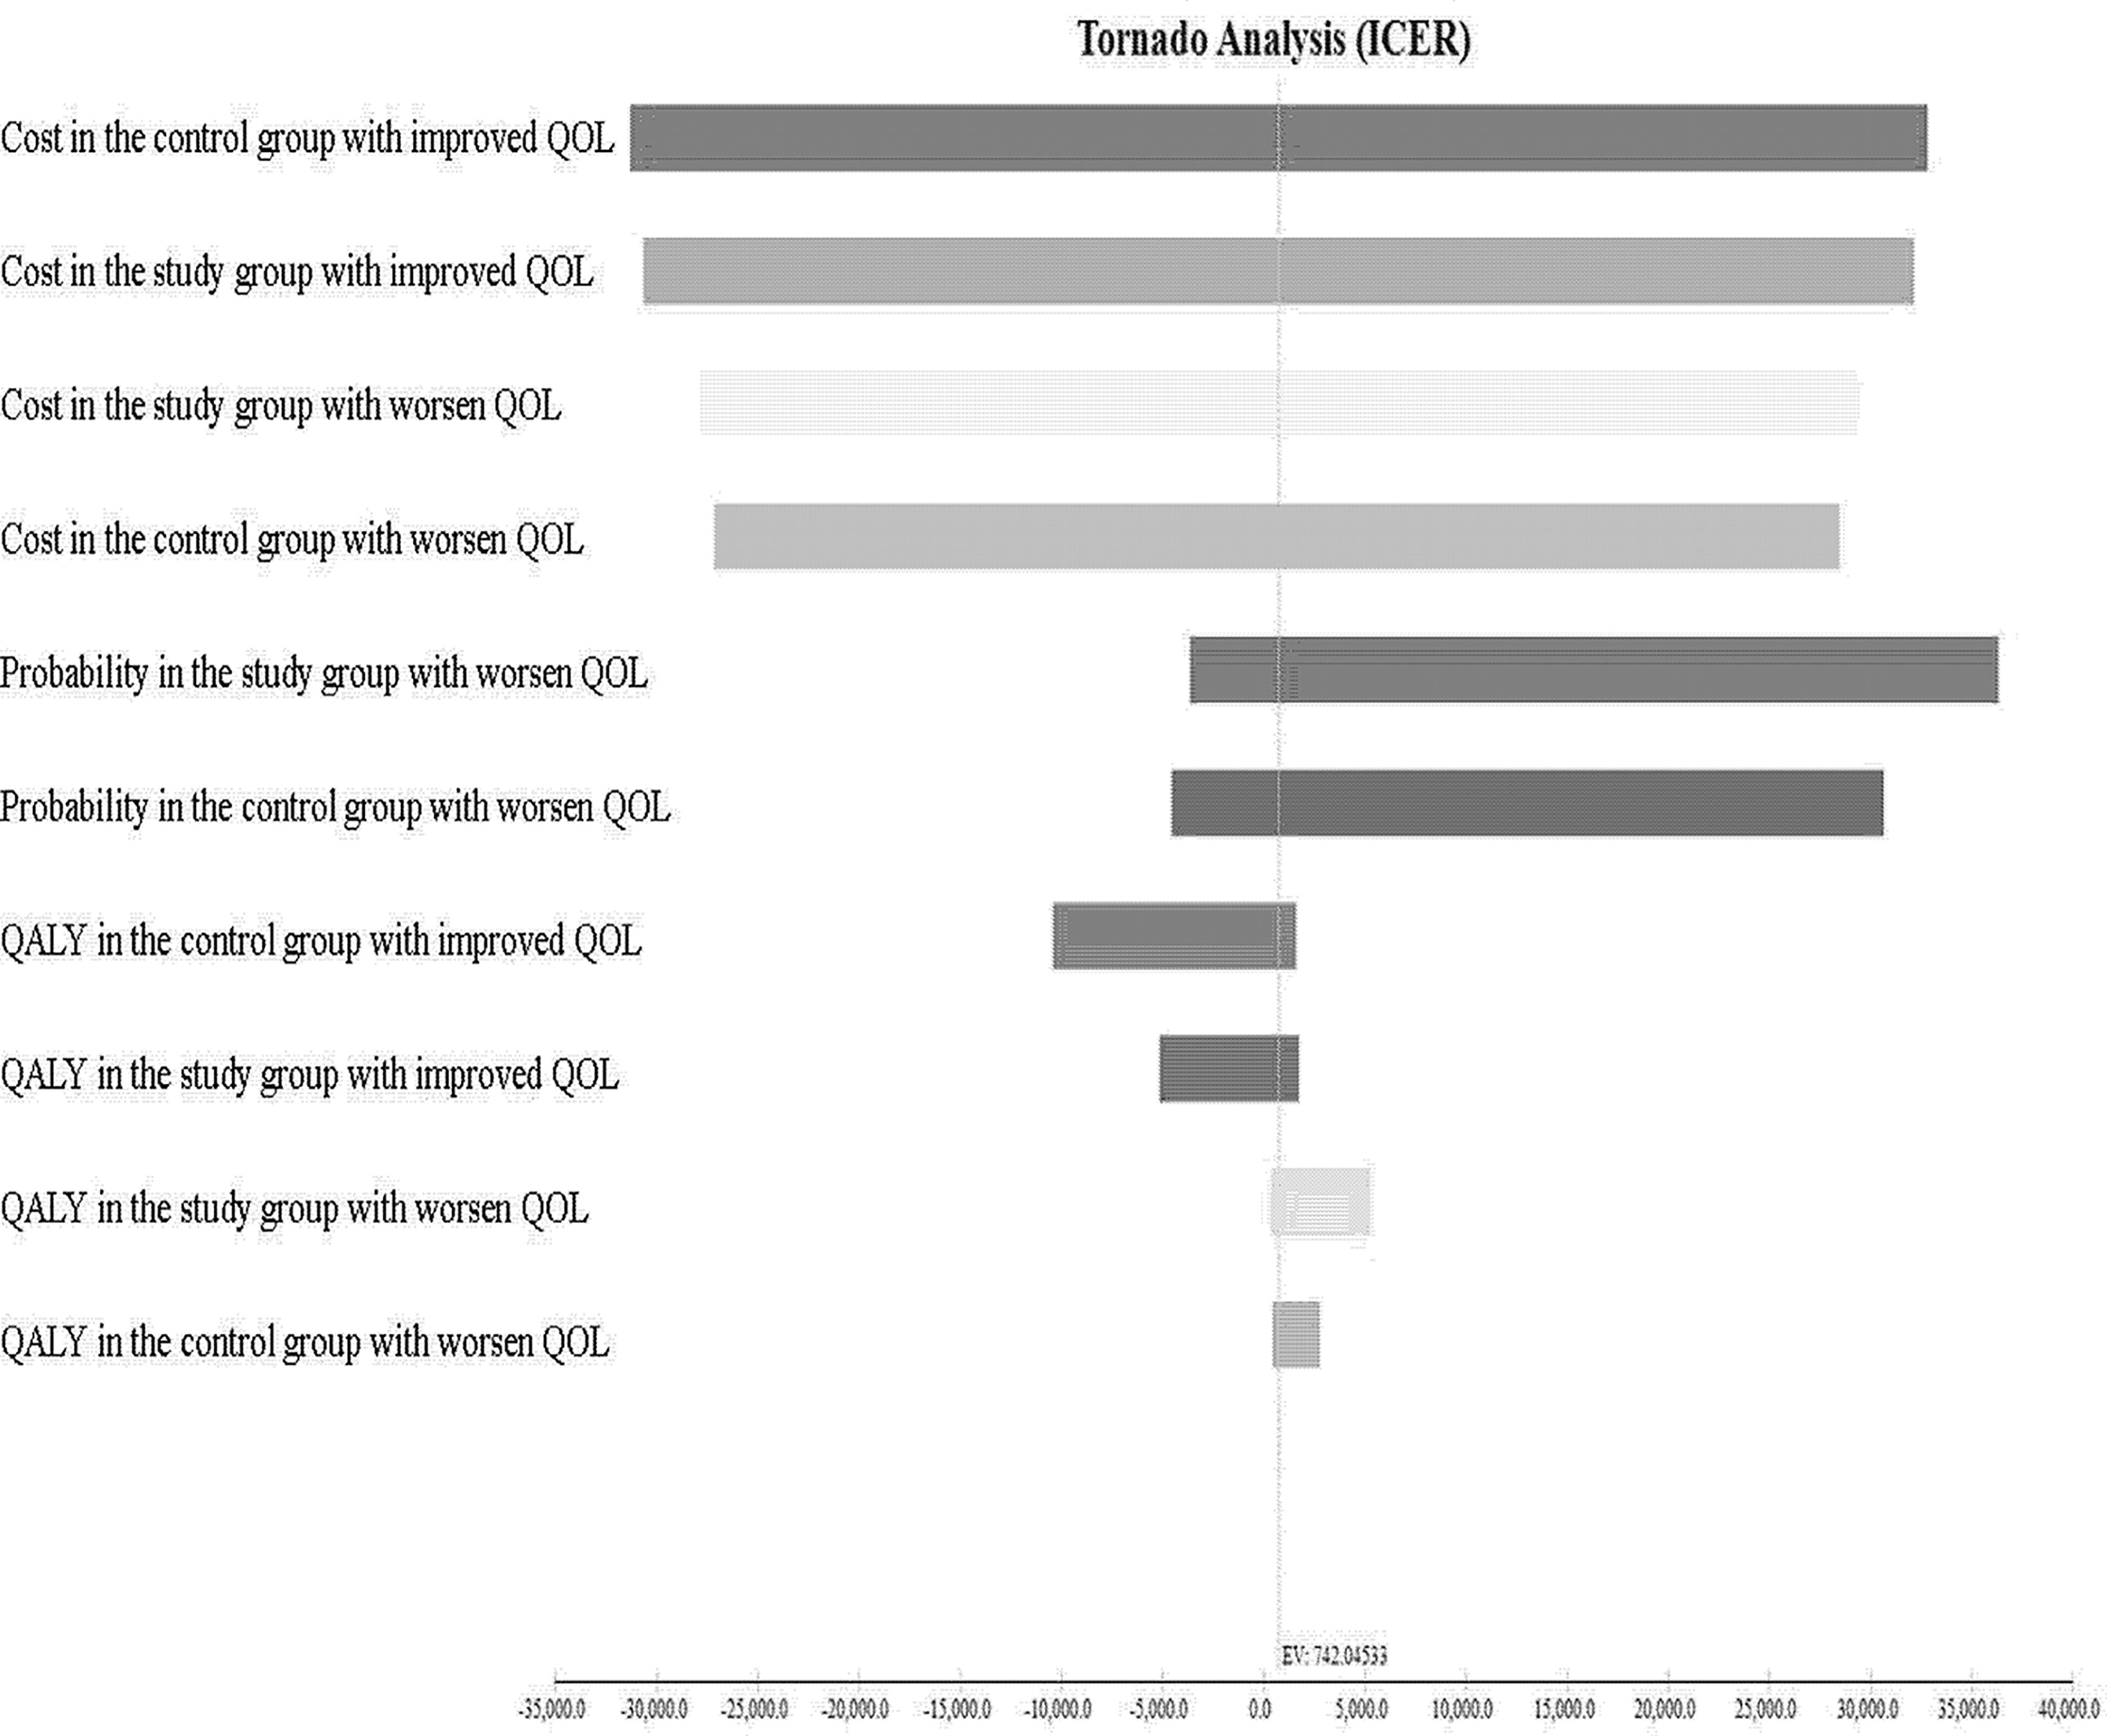
Figure 6 Tornado diagram showing one-way sensitivity analysis results. Costs are expressed in US$ 2020. ICUR, incremental cost-utility ratio; QOL, quality of life.
Discussion
In both groups of patients with mCRC, physiological functions and emotional wellbeing significantly worsened at posttherapeutic 6th month compared with the pretherapeutic status. This can probably be attributed to the adverse effect of the chemotherapy. The study group exhibited significant improvement in physiological functions and emotional wellbeing from posttherapeutic 6th month to posttherapeutic 1st year. However, the control group exhibited worse emotional wellbeing, possibly because their physiological functions had not fully recovered. From posttherapeutic 1st year to posttherapeutic 2nd year, the study group gradually improved in most QOL measures. By contrast, the control group exhibited slow improvement in physiological functions, and their moods were still affected. These results were consistent with previous reports that compared patient conditions before chemotherapy and radiotherapy; the physiological functions, social functions, and nausea and vomit symptoms of cancer patients worsened during the 6-month treatment, leading to negative emotional functions (22–24). However, most QOL outcomes improved but they still were inferior to the initial status at 1–2 years after chemotherapy and radiotherapy. These results emphasized that baseline characterization of symptom status should be incorporated into clinical trials as they may affect symptom burden.
Compared with the control group, the study group had higher mean total medical direct costs, possibly because of the dose difference. The study group had higher hospitalization expenses during therapy and subsequent hospitalization expenses compared with the control group. From pretherapeutic to posttherapeutic 6th month, patients with mCRC in both groups had significantly reduced utility, possibly because they both initially received accumulated doses of irinotecan and had substantial adverse effects. However, at posttherapeutic 1st year, the study group exhibited gradual recovery and a significant increase in their utility, whereas the control group showed a significant decline from posttherapeutic 6th month to posttherapeutic 1st year, only showing a gradual increase at the posttherapeutic 2nd year. This may be because the study group patients undergo UGT1A1 genotyping before treatment, and better oncological outcomes were verified by our previous study (2). In addition, Shulman et al. and Lu et al. revealed that in treating mCRC using FOLFIRI combined with bevacizumab, patients with genotypes UGT1A1*28/*28 had significantly increased grades III or IV hematological toxicity than those with UGT1A1*1/*28 and UGT1A1*1/*1 (10, 25). Gradual irinotecan dose escalation according to UGT1A1 genotypes can yield better treatment outcomes and more easily prevent adverse effects.
The present study indicated that escalated irinotecan dose can help achieve the optimal values for cost-effective incremental costs of care in Taiwan. Few studies have analyzed treatment with different irinotecan doses combined with bevacizumab. Obradovic et al. divided patients with mCRC into those with or without specific UGT1A1 genotypes (26); however, they did not compare patients who did not undergo genotyping (administered the fixed-dose regimen) and patients who underwent UGT1A1 genotyping (administered escalated-dose regimen). If patients with UGT1A1*1/*28 and UGT1A1*1/*1 were administered an escalated dose of irinotecan and those with UGT1A1*28/*28 were given a reduced irinotecan dose, the overall total medical direct costs may be reduced. Butzke et al. performed a sensitivity analysis and discovered that a UGT1A1 test before irinotecan chemotherapy and medical expenses were critical factors determining costs (27). Gold et al. conducted a sensitivity analysis and revealed that only when irinotecan dose adjustment achieved 98.4% of the effectiveness of the full dose, the DNA test can be continued (28). When ICUR was US$ 100,073 per QALY and WTP was US$ 100,000, UGT1A1 genotyping test remained the most optimal choice before administering irinotecan. Therefore, treatment in the study group resulted in fewer disease recurrences, and thus, an ICUR decline when additional costs after disease recurrences increased. Given this, the escalated dose of irinotecan will be cost-effective compared with the recommended dose of irinotecan when combined with other costlier treatment strategies in mCRC patients. To enable decision making for tailored therapy, before administering irinotecan, different doses should be determined according to the UGT1A1 genotype, thereby achieving more favorable cost-utility.
The following limitations of this study must be acknowledged. First, this was not a randomized study. At baseline, the study group (escalated dose group) had higher mean scores for FACT-C social/family wellbeing and BAI than the control group (recommended dose group). Therefore, the magnitude of QOL improvements obtained by different doses of irinotecan plus bevacizumab may have been underestimated. Nonetheless, the potential bias would not have changed our result that the study group seemed to achieve more cost-effectiveness than the control dose group. Second, we did not include costs involved in the nonhealthcare sector or from the societal perspective, including productivity loss and out-of-pocket expenses. Third, repeated measures of QOL outcomes were limited to 2 years. Basic symptoms of pain, neuropathic pain, and chemicals were not assessed, which is a noted limitation of the quality of life assessment in this study. Further randomized clinical trials are needed to corroborate the benefit on clinical outcomes, additional costs other than healthcare costs including survival, and overall societal impact.
The improved effectiveness in the study group was corroborated by evidence of significant improvements in QOL outcomes from posttherapeutic 6th month to posttherapeutic 2nd year. Nevertheless, we suggest that before the introduction of irinotecan treatment, patients with mCRC undergo UGT1A1 genotyping to help determine the appropriate irinotecan dose, thereby achieving higher cost-utility and better medical resource allocation. Further scientific research is needed to determine what doses achieve the most desirable therapeutic effects in different UGT1A1 genotypes, which would translate into improved QOL after such a burdensome treatment of the underlying disease. Our results may serve as potential references for health departments, academic units, and medical supply units to treat mCRC.
Data Availability Statement
The raw data supporting the conclusions of this article will be made available by the authors, without undue reservation.
Ethics Statement
The studies involving human participants were reviewed and approved by the institutional ethics committee of our hospital (KMUHIRB-(EI)-20150147). The patients/participants provided their written informed consent to participate in this study.
Author Contributions
H-YS, H-LT, and J-YW had full access to all the data in the study take responsibility for the integrity of the data and the accuracy of the data analysis. Concept and design: H-YS, H-LT, and J-YW. Acquisition, analysis, or interpretation of data: All authors. Drafting of the manuscript: H-YS, H-LT, and J-YW. Critical revision of the manuscript for important intellectual content: All authors. Statistical analysis: H-YS. Obtained funding: JYW. Supervision: H-YS, H-LT, and J-YW. All authors contributed to the article and approved the submitted version.
Funding
This work was supported by grants through funding from the Ministry of Science and Technology (MOST 109-2314-B-037-035, MOST 109-2314-B-037-040, MOST 109-2314-B-037-046-MY3, MOST110-2314-B-037-097) and the Ministry of Health and Welfare (MOHW109-TDU-B-212-134026, MOHW109-TDU-B-212-114006, MOHW110-TDU-B-212-1140026) and funded by the health and welfare surcharge of on tobacco products, and the Kaohsiung Medical University Hospital (KMUH110-0R37, KMUH110-0R38, KMUH110-0M34, KMUH110-0M35, KMUH110-0M36, KMUHSA11013, KMUH-DK(C)110010, KMUH-DK(B)110004-3) and KMU Center for Cancer Research (KMU-TC109A04-1) and KMU Center for Liquid Biopsy and Cohort Research Center Grant (KMU-TC109B05) and KMU Office for Industry-Academic Collaboration (S109036), Kaohsiung Medical University. In addition, this study was supported by the Grant of Taiwan Precision Medicine Initiative, Academia Sinica, Taiwan, R.O.C.
Conflict of Interest
The authors declare that the research was conducted in the absence of any commercial or financial relationships that could be construed as a potential conflict of interest.
Publisher’s Note
All claims expressed in this article are solely those of the authors and do not necessarily represent those of their affiliated organizations, or those of the publisher, the editors and the reviewers. Any product that may be evaluated in this article, or claim that may be made by its manufacturer, is not guaranteed or endorsed by the publisher.
References
1. Zhu J, Liu A, Sun X, Liu L, Zhu Y, Zhang T, et al. Multicenter, Randomized, Phase III Trial of Neoadjuvant Chemoradiation With Capecitabine and Irinotecan Guided by UGT1A1 Status in Patients With Locally Advanced Rectal Cancer. J Clin Oncol (2020) 38:4231–9. doi: 10.1200/JCO.20.01932
2. Tsai HL, Huang CW, Lin YW, Wang JH, Wu CC, Sung YC, et al. Determination of the UGT1A1 Polymorphism as Guidance for Irinotecan Dose Escalation in Metastatic Colorectal Cancer Treated With First-Line Bevacizumab and FOLFIRI (PURE FIST). Eur J Cancer (2020) 138:19–29. doi: 10.1016/j.ejca.2020.05.031
3. Glimelius B, Stintzing S, Marshall J, Yoshino T, De Gramont A. Metastatic Colorectal Cancer: Advances in the Folate-Fluoropyrimidine Chemotherapy Backbone. Cancer Treat Rev (2021) 98:102218. doi: 10.1016/j.ctrv.2021.102218
4. Qingwei Z, Dongsheng H, Duo L, Youlei W, Songxia Y, Ziqi Y, et al. Fluorouracil Supplemented With Oxaliplatin or Irinotecan for Solid Tumors: Indications From Clinical Characteristics and Health Outcomes of Patients. Front Oncol (2020) 10:1542. doi: 10.3389/fonc.2020.01542
5. Toffoli G, Cecchin E, Gasparini G, D’Andrea M, Azzarello G, Basso U. Genotype-Driven Phase I Study of Irinotecan Administered in Combination With Fluorouracil/Leucovorin in Patients With Metastatic Colorectal Cancer. J Clin Oncol (2010) 28:866–71. doi: 10.1200/JCO.2009.23.6125
6. Innocenti F, Schilsky RL, Ramírez J, Janisch L, Undevia S, House LK, et al. Dose-Finding and Pharmacokinetic Study to Optimize the Dosing of Irinotecan According to the UGT1A1 Genotype of Patients With Cancer. J Clin Oncol (2014) 32:2328–34. doi: 10.1200/JCO.2014.55.2307
7. Cremolini C, Antoniotti C, Rossini D, Lonardi S, Loupakis F, Pietrantonio F, et al. Upfront FOLFOXIRI Plus Bevacizumab and Reintroduction After Progression Versus Mfolfox6 Plus Bevacizumab Followed by FOLFIRI Plus Bevacizumab in the Treatment of Patients With Metastatic Colorectal Cancer (TRIBE2): A Multicentre, Open-Label, Phase 3, Randomized, Controlled Trial. Lancet Oncol (2020) 21(4):497–507. doi: 10.2139/ssrn.3478102
8. Roncato R, Cecchin E, Montico M, Mattia ED, Giodini L, Buonadonna A, et al. Cost Evaluation of Irinotecan-Related Toxicities Associated With the UGT1A1*28 Patient Genotype. Clin Pharmacol Ther (2017) 102(1):123–30. doi: 10.1002/cpt.615
9. Kristin E, Endarti D, Khoe LC, Taroeno-Hariadi KW, Trijayanti C, Armansyah A, et al. Economic Evaluation of Adding Bevacizumab to Chemotherapy for Metastatic Colorectal Cancer (mCRC) Patients in Indonesia. Asian Pac J Cancer Prev (2021) 22(6):1921–6. doi: 10.31557/APJCP.2021.22.6.1921
10. Lu CY, Huang CW, Wu IC, Tsai HL, Ma CJ, Yeh YS, et al. Clinical Implication of UGT1A1 Promoter Polymorphism for Irinotecan Dose Escalation in Metastatic Colorectal Cancer Patients Treated With Bevacizumab Combined With FOLFIRI in the First Line Setting. Transl Oncol (2015) 8:474e9. doi: 10.1016/j.tranon.2015.11.002
11. Yeh YS, Tsai HL, Huang CW, Wang JH, Lin YW, Tang HC, et al. Prospective Analysis of UGT1A1 Promoter Polymorphism for Irinotecan Dose Escalation in Metastatic Colorectal Cancer Patients Treated With Bevacizumab Plus FOLFIRI as the First-Line Setting: Study Protocol for a Randomized Controlled Trial. Trials (2016) 17:46. doi: 10.1186/s13063-016-1153-3
12. Ward WL, Hahn EA, Mo F, Hernandez L, Tulsky DS, Cella D. Reliability and Validity of the Functional Assessment of Cancer Therapy-Colorectal (FACT-C) Quality of Life Instrument. Qual Life Res (1999) 8:181–95. doi: 10.1023/A:1008821826499
13. Zheng YP, Wei LA, Goa LG, Zhang GC, Wong CG. Applicability of the Chinese Beck Depression Inventory. Compr Psychiatry (1988) 29:484–9. doi: 10.1016/0010-440X(88)90063-6
14. Osman A, Kopper BA, Barrios FX, Osman JR, Wade T. The Beck Anxiety Inventory: Reexamination of Factor Structure and Psychometric Properties. J Clin Psychol (1997) 53:7–14. doi: 10.1002/(SICI)1097-4679(199701)53:1<7::AID-JCLP2>3.0.CO;2-S
15. Fuh JL, Wang SJ, Lu SR, Juang KD, Lee SJ. Psychometric Evaluation of a Chinese (Taiwanese) Version of the SF-36 Health Survey Amongst Middle-Aged Women From a Rural Community. Qual Life Res (2000) 9:675–83. doi: 10.1023/a:1008993821633
16. Lee HY, Hung MC, Hu FC, Chang YY, Hsieh CL, Wang JD. Estimating Quality Weights for EQ-5d (EuroQol-5 Dimensions) Health States With the Time Trade-Off Method in Taiwan. J Formos Med Assoc (2013) 112:699–706. doi: 10.1016/j.jfma.2012.12.015
17. Rosenbaum PR. Model-Based Direct Adjustment. J Am Stat Assoc (1987) 82:387–94. doi: 10.1080/01621459.1987.10478441
18. Zeger SL, Liang KY. Longitudinal Data Analysis for Discrete and Continuous Outcomes. Biometrics (1986) 42:121–30. doi: 10.2307/2531248
19. Schluchter MD. Flexible Approaches to Computing Mediated Effects in Generalized Linear Models: Generalized Estimating Equations and Bootstrapping. Multivariate Behav Res (2008) 43:268–88. doi: 10.1080/00273170802034877
20. Nakagawa S, Cuthill IC. Effect Size, Confidence Interval and Statistical Significance: A Practical Guide for Biologists. Biol Rev Camb Philos Soc (2007) 82:591–605. doi: 10.1111/j.1469-185X.2007.00027.x
21. Manca A, Hawkins N, Sculpher MJ. Estimating Mean QALYs in Trial-Based Cost-Effectiveness Analysis: The Importance of Controlling for Baseline Utility. Health Econ (2005) 14:487–96. doi: 10.1002/hec.944
22. Van Der Weijst L, Lievens Y, Schrauwen W, Surmont V. Health-Related Quality of Life in Advanced Non-Small Cell Lung Cancer: A Methodological Appraisal Based on a Systematic Literature Review. Front Oncol (2019) 9:715. doi: 10.3389/fonc.2019.00715
23. Rosenthal DI, Mendoza TR, Fuller CD, Hutcheson KA, Wang XS, Hanna EY, et al. Patterns of Symptom Burden During Radiotherapy or Concurrent Chemoradiotherapy for Head and Neck Cancer: A Prospective Analysis Using the University of Texas MD Anderson Cancer Center Symptom Inventory-Head and Neck Module. Cancer (2014) 120:1975–84. doi: 10.1002/cncr.28672
24. Johdi NA, Sukor NF. Colorectal Cancer Immunotherapy: Options and Strategies. Front Immunol (2020) 11:1624. doi: 10.3389/fimmu.2020.01624
25. Shulman K, Cohen I, Barnett-Griness O, Kuten A, Gruber SB, Lejbkowicz F, et al. Clinical Implications of UGT1A1*28 Genotype Testing in Colorectal Cancer Patients. Cancer (2011) 117:3156–62. doi: 10.1002/cncr.25735
26. Obradovic M, Mrhar A, Kos M. Cost-Effectiveness of UGT1A1 Genotyping in Second-Line, High-Dose, Once Every 3 Weeks Irinotecan Monotherapy Treatment of Colorectal Cancer. Pharmacogenomics (2008) 9:539–49. doi: 10.2217/14622416.9.5.539
27. Butzke B, Oduncu FS, Severin F, Pfeufer A, Heinemann V, Giessen-Jung C, et al. The Cost-Effectiveness of UGT1A1 Genotyping Before Colorectal Cancer Treatment With Irinotecan From the Perspective of the German Statutory Health Insurance. Acta Oncol (2016) 55:318–28. doi: 10.3109/0284186X.2015.1053983
Keywords: metastatic colorectal cancer, FOLFIRI, irinotecan dose escalation, quality of life, cost-utility analysis
Citation: Shi H-Y, Chen Y-C, Huang C-W, Li C-C, Su W-C, Chang T-K, Chen P-J, Yin T-C, Tsai H-L and Wang J-Y (2022) Effectiveness and Cost-Utility Analysis of Different Doses of Irinotecan Plus Bevacizumab in Patients With Metastatic Colorectal Cancer: A Long-Term and Prospective Cohort Study. Front. Oncol. 12:756078. doi: 10.3389/fonc.2022.756078
Received: 10 August 2021; Accepted: 22 February 2022;
Published: 14 March 2022.
Edited by:
David Tougeron, CHU Poitiers, FranceReviewed by:
Yu Sunakawa, St. Marianna University School of Medicine, JapanEleonora Anna Mess, Wroclaw Medical University, Poland
Copyright © 2022 Shi, Chen, Huang, Li, Su, Chang, Chen, Yin, Tsai and Wang. This is an open-access article distributed under the terms of the Creative Commons Attribution License (CC BY). The use, distribution or reproduction in other forums is permitted, provided the original author(s) and the copyright owner(s) are credited and that the original publication in this journal is cited, in accordance with accepted academic practice. No use, distribution or reproduction is permitted which does not comply with these terms.
*Correspondence: Jaw-Yuan Wang, Y3k2MTQxMTJAbXMxNC5oaW5ldC5uZXQ=; amF3eXVhbndhbmdAZ21haWwuY29t; Hsiang-Lin Tsai, Y2h1bnBpbjg3MDEzMkB5YWhvby5jb20udHc=
†These authors have contributed equally to this work
 Hon-Yi Shi
 Yen-Cheng Chen5,6
 Wei-Chih Su
 Po-Jung Chen
 Tzu-Chieh Yin
 Hsiang-Lin Tsai
 Jaw-Yuan Wang