
94% of researchers rate our articles as excellent or good
Learn more about the work of our research integrity team to safeguard the quality of each article we publish.
Find out more
ORIGINAL RESEARCH article
Front. Oncol., 17 January 2023
Sec. Cancer Immunity and Immunotherapy
Volume 12 - 2022 | https://doi.org/10.3389/fonc.2022.1074779
 Krystle L. Ong1
 Marcus D. Davis1
 Kalyn K. Purnell1Hannah Cutshall1
 Harish C. Pal1
 Ashley N. Connelly1
 Christian X. Fay1
 Valeriya Kuznetsova1
 Elizabeth E. Brown1,2
 Zdenek Hel1,2,3*
Hematologic malignancies, including multiple myeloma (MM), promote systemic immune dysregulation resulting in an alteration and increased plasticity of myeloid cell subsets. To determine the heterogeneity of the myeloid cell compartment in the peripheral blood of patients with MM, we performed a detailed investigation of the phenotype and function of myeloid subpopulations. We report that a subset of MM patients exhibits a specific myeloid cell phenotype indicative of altered myelopoiesis characterized by significant changes in the properties of circulating granulocytic, monocytic, and eosinophilic populations. The subset, referred to as MM2, is defined by a markedly elevated level of CD64 (FcγRI) on the surface of circulating neutrophils. Compared to healthy controls or MM1 patients displaying intermediate levels of CD64, neutrophils from MM2 patients exhibit a less differentiated phenotype, low levels of CD10 and CXC chemokine receptor 2 (CXCR2), increased capacity for the production of mitochondrial reactive oxygen species, and an expansion of CD16neg immature neutrophil subset. Classical and patrolling monocytes from MM2 patients express elevated levels of CD64 and activation markers. MM2 eosinophils display lower levels of C-C Chemokine receptor 3 (CCR3), Toll-like receptor 4 (TLR4, CD284), and tissue factor (TF, CD142). The MM2 (CD64high) phenotype is independent of age, race, sex, and treatment type. Characteristic features of the MM2 (CD64high) phenotype are associated with myeloma-defining events including elevated involved/uninvolved immunoglobulin free light chain (FLC) ratio at diagnosis. Detailed characterization of the altered myeloid phenotype in multiple myeloma will likely facilitate the identification of patients with an increased risk of disease progression and open new avenues for the rational design of novel therapeutic approaches.
Multiple myeloma (MM) is a malignancy of post-germinal center terminally differentiated plasma cells producing antibodies and complexes of immunoglobulin heavy and light chains (1). Diagnosis is based on several myeloma-defining events including an accumulation of monoclonal plasma cells in the bone marrow microenvironment (BME), the presence of end-organ damage, or, in the absence of end-organ damage, elevated involved to uninvolved immunoglobulin free light chain (FLC) ratio and presence of at least one bone lesion by magnetic resonance imaging (1, 2). MM is associated with significant immune defects resulting in recurrent bacterial infections and other immune-related complications; however, the underlying causes of immune dysregulation in MM patients are not well understood (3–8). Immune reprograming in MM promotes angiogenesis and immunosuppression contributing to disease progression to extramedullary sites (9, 10).
Chronic inflammatory diseases, including solid and hematological malignancies, are frequently associated with pathologic dysregulation of the myeloid cell compartment including (11–19). During unresolved chronic inflammation, partial reprogramming of the BME results in altered granulopoiesis and recruitment of transcriptionally and physiologically distinct myeloid cell populations (12, 13, 20, 21). Recent studies demonstrate the plasticity of innate immune cells, specifically neutrophils, polymorphonuclear myeloid-derived suppressor cells (PMN-MDSCs), and monocyte subpopulations, in chronic pathologic conditions (12–19, 22–24).
Neutrophils represent the most abundant circulating leukocyte population equipped for the sensitive detection of bacterial and viral products during inflammatory responses (25). Previously, we demonstrated that neutrophils from individuals infected with human immunodeficiency virus-1 exert inhibitory effects on T-cell function and proliferation characterized by programmed death-ligand 1 (PD-L1) expression and release of reactive oxygen species (ROS) (23). PD-L1-expressing neutrophils play a critical role in the suppression of lymphocyte proliferation in endotoxemia (26). Reports of immunosuppressive properties of neutrophils and PMN-MDSCs, including increased arginase-1 expression and differences in phagocytic and oxidative burst capacities, support the critical role of neutrophils in fostering the tumor microenvironment promoting myelomagenesis (9, 17, 27). Neutrophils and PMN-MDSCs are expanded in the BME and peripheral blood of patients with MM (15, 28–32), protect MM cells from chemotherapy-induced toxicity resulting in reduced chemoselectivity (33), and inhibit T-cell immune response (34). Romano et al. described immunosuppressive high-density neutrophils in monoclonal gammopathy of undetermined significance (MGUS) and MM patients characterized by increased STAT3 and CD64 expression and hypothesized that this population may contribute to the increased susceptibility to infections and immune dysfunction supporting tumor progression (9). The neutrophil to lymphocyte ratio is increased in some MM patients and has been utilized to predict outcomes in newly diagnosed patients, patients that have previously undergone autologous hematopoietic stem cell transplant (aHSCT), and transplant-ineligible patients in MM (35–37).
Increased frequency of patrolling monocytes was observed in the BME of patients with MM relative to patients with pre-MM conditions, including MGUS and smoldering multiple myeloma (19). Patrolling monocytes promote an increase in osteoclast formation by upregulating the expression of IL-21 receptor, supporting a pivotal role of monocytes in MM disease progression (19). Macrophages from patients with MM use vasculogenic mimicry to contribute to neovessel construction following exposure to angiogenic cytokines (38).
Our knowledge regarding the heterogeneity of granulocytic and monocytic subpopulations and how innate immune population phenotypes affect the pathogenesis of MM remains limited. In this study, we investigated the heterogeneity of the phenotypic profiles of circulating neutrophilic, monocytic, and eosinophilic subpopulations in patients with MM and examined the relationship between distinct MM innate immune phenotypes and myeloma-defining events.
Eligible MM patients with histologically confirmed diagnoses enrolled in the Integrated Molecular And Genetic Epidemiology study (IMAGE) (39) were included. Patients with a diagnosis of MM were identified based on the ICD-9 classifications (203) or International Classification of Disease for Oncology third revision code 9732/3 and confirmed based on revised and updated International Multiple Myeloma Working Group classification criteria for MM (1). Myeloma was defined by the cumulative presence of clonal bone marrow plasma cells ≥ 10 percent or biopsy-proven bony or extramedullary plasmacytoma and the presence of one or more MM defining events including organ damage (hypercalcemia, renal insufficiency, anemia, or lytic bone lesions or severe osteopenia, or pathologic fractures attributed to plasma cell proliferative disorder), clonal bone marrow plasma cells ≥ 60 percent, serum involved to uninvolved FLC ratio > 100, or more than one focal bone lesion (> 5 mm) identified as previously reported (1). Each MM case was reviewed by an expert panel to ensure consistent case definitions and to minimize phenotype misclassification. Patients with extramedullary or solitary plasmacytoma or other plasma cell proliferative disorders were excluded (n=2). An additional 2 MM patients were excluded based on treatment status. After eligibility screening, a total of 35 MM patients, all previously treated as specified in Table 1, were included in this investigation.
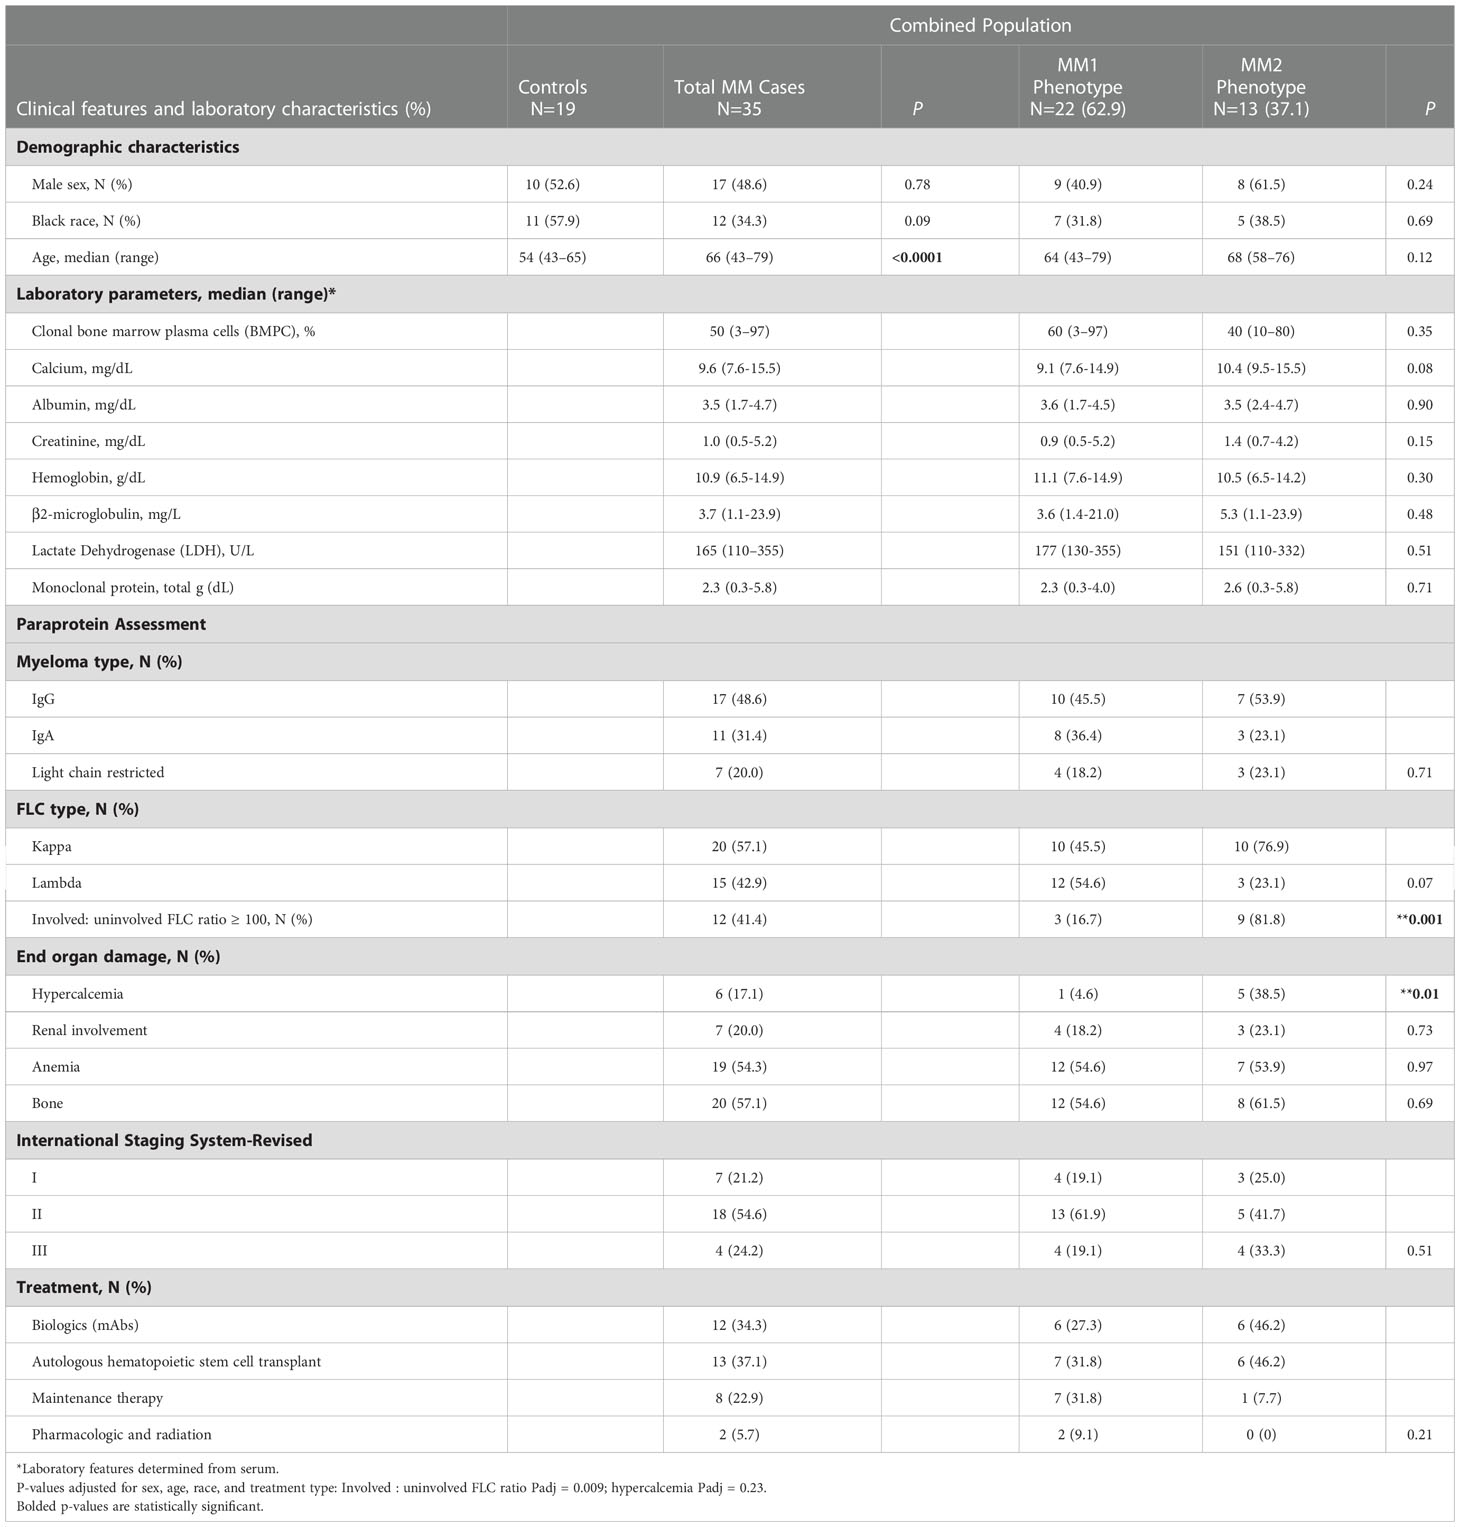
Table 1 Control and multiple myeloma patient demographics and diagnostic clinical and laboratory characteristics of MM patients by MM1 and MM2 phenotypes.
Diagnostic and defining clinical features including clonal bone marrow plasma cells (%), serum monoclonal (M)-protein, involved to uninvolved FLC ratio > 100, immunoglobulin (Ig) isotype (IgG, IgA), clonality (kappa, lambda), end-organ damage [hypercalcemia (serum calcium, >11.5 mg/dl), renal insufficiency (serum creatinine, >177.0 μmol/L (>2 mg/dl) or estimated creatinine clearance <40 mL/min per 1.73 m2), anemia (normochromic, normocytic with hemoglobin >2 g/dl below the lower limit of normal or hemoglobin <10 g/dl)], bone involvement (radiologic evidence of lytic lesions, severe osteopenia or pathologic fractures1), and the revised and updated International Staging System (R-ISS) (1), and the Durie Salmon (DS) staging system (40) were determined by laboratory studies, medical history or physical examination as appropriate.
Controls were recruited through the 1917 Clinic at Dewberry at the University of Alabama at Birmingham. Eligible controls were 43 years of age and older without a history of monoclonal gammopathy of undetermined significance, smoldering multiple myeloma, MM, or other cancers. Participant characteristics are summarized in Table 1.
All methods were performed in accordance with the relevant guidelines and regulations. Peripheral blood was collected by certified phlebotomists in tubes containing acid citrate dextrose (ThermoFisher, Waltham, MA) from MM patients or controls following informed consent. Data acquisition was performed by the IMAGE study team. Study protocols were approved by the Institutional Review Board of the University of Alabama at Birmingham (IRB protocols 141218001 and 071106009).
A/B human serum was purchased from ThermoFisher. All solutions and materials for cell counting and the cell counter were purchased by Nexcelom (Lawrence, MA). Antibodies for flow cytometry were purchased from BioLegend (San Diego, CA) unless indicated otherwise (Supplemental Table 1). Dimethyl sulfoxide (DMSO), Dulbecco’s phosphate buffer solution (DPBS), and Ethylenediaminetetraacetic acid (EDTA) were purchased from Corning (Corning, NY). Phorbol myristate acetate (PMA) (Sigma Aldrich, St. Louis, MO) was dissolved in DMSO at a concentration of 1mg/ml. 2’,7’-dichlorodihydrofluorescein (H2-DCFDA) (Sigma Aldrich) was dissolved in DMSO at a concentration of 1mM. All antibody stain panels were made in 10% A/B human serum in DPBS.
Twenty milliliters of ACD-treated blood was collected from MM patients or controls and processed within three hours of the collection as described previously (41). Briefly, fifty microliters of whole blood were stained for 30 minutes with 50 μl of pre-mixed antibodies for the base panel and whole blood staining (Supplementary Table 1) at 4°C. Samples were washed with 4 ml 0.1M EDTA in DPBS and centrifuged at 200 x g for 5 minutes. Red blood cell lysis and fixation was performed in 1 ml of 1x 1-step Fix/lyse buffer (Invitrogen, Waltham, MA) at room temperature for 15 minutes. Samples were washed with 2% fetal bovine serum (FBS) (Atlanta Biologicals, Atlanta GA) in DPBS, centrifuged for 5 minutes at 200 x g, and suspended in equal parts 2% FBS in DPBS and intracellular fixation buffer (IC fix) (Invitrogen). All samples were held at 4°C prior to analysis, filtered with 40 μm mesh, and acquired on the Attune NxT flow cytometer (ThermoFisher) within 24 hours of processing, and FlowJo V 10.7 (FlowJo LLC, Ashland, OR) was used for data analysis. Determination of the levels of surface antigens using acoustic self-focusing technology may result in negative values following background subtraction; however, the resulting values retain biological significance. Fluorescent minus one (FMO) controls were employed to account for autofluorescence and nonspecific signals. The percentage of CD64neg cells was determined as events below the gate set at 95% of events of FMO control from a healthy donor (Supplemental Figure 2B).
Four ml of whole blood was diluted with 4 ml of DPBS and layered onto 4 ml of discontinuous Ficoll-Paque PREMIUM density gradient (1.078g/ml) (GE Healthcare, Chicago, IL). The samples were centrifuged for 30 minutes at 400 x g. The PBMC layer was isolated into 10 ml of DPBS, centrifuged at 300 x g for 10 minutes, washed with 10 ml of DPBS, and centrifuged at 200 x g for 10 minutes. PBMCs were suspended in 10% A/B human serum in DPBS. Twenty μl of cell suspension was stained with 20 μl Viastain™ Acridine Orange/Propidium Iodide Staining Solution for 2 minutes at RT. 20 μl of stained cells were loaded on a hemocytometer and counted using the Cellometer K2 Fluorescent Viability Cell Counter. Aliquots of 1 x 10⁶ PBMCs/50 μl were suspended in 10% A/B human serum and incubated at 4°C for 30 minutes. Samples were stained with 50 μl of pre-mixed antibodies for the base panel and PBMC staining (Supplementary Table 1) at 4°C for 30 minutes, washed with 2% FBS in DPBS, and suspended in equal parts 2% FBS in DPBS and IC fix. Sample acquisition and analysis of LDNs within the PBMC sample were performed as described in “whole blood staining.”
Single cells were identified and doublets were removed using forward scatter height and area. For all phenotypic analyses, CD3+ and CD19+ events corresponding to T and B lymphocytes, respectively, were removed. For monocyte analyses, CD14 and CD16 were utilized following the removal of CD15+ and CCR3+ events. Patrolling monocytes (Pt Mo) were identified as CD16highCD14low and classical monocytes (Cl Mo) as CD16lowCD14high (Supplemental Figure 1). Since the intermediate monocyte population defined as CD16highCD14high was not clearly defined in most patients and was highly affected by shifts in the expression of CD16 on classical monocytes, a separate examination of the intermediate monocyte population was not included in the final analysis. For whole blood neutrophil and LDN analyses, CD193+ (CCR3) and CD14+ events were removed. Mature neutrophils (mNs) were identified as CD16high and immature neutrophils (imNs) as CD16-. For eosinophils, CCR3+ and CD15+ were analyzed following the removal of CD14+ and CD16+ events (Supplemental Figure 1).
Fifty microliters of fresh whole blood from healthy or MM patients were stained with 50 μl of a separate pre-mixed antibody absolute count panel for 30 minutes at 4°C (Supplemental Table 1). Red blood cell lysis and fixation were performed in 1 ml of 1x 1-step Fix/lyse buffer at RT for 15 minutes. 50 μl of CountBright™ Absolute Counting Beads (ThermoFisher) were added to samples using a pre-determined concentration given by the manufacturer. Samples were held at 4°C prior to acquisition and acquired on the Attune NxT flow cytometer (ThermoFisher) within 24 hours of processing and analyzed with FlowJo V 10.7 (FlowJo LLC). Bead counts were determined per the instructions by the manufacturer. Briefly, the bead adjustment factor was calculated by dividing the number of beads gated by the pre-determined concentration of beads per 50 μl. Leukocytes were gated with side scatter and forward scatter area and total neutrophils were gated using CD15+CD14- gate with adjustment performed by multiplying cell counts by the bead adjustment factor.
For quantification of neutrophil or monocyte subsets in whole blood, the percentages of the subset gate from total neutrophils (imN and mN) or monocytes (Pt Mo and Cl Mo) were multiplied by the adjusted total neutrophil or monocyte count. A count threshold of 150 imN per sample was determined based on the calculated mean imN frequency of samples. The majority of healthy controls did not meet the event threshold for imNs and were excluded in the phenotypic analyses.
For the quantification of neutrophils in the PBMC layer, the percentage of total LDNs was gated and multiplied by the percentage of total neutrophils in whole blood. LDN subsets were quantified by multiplying the percent of the subset of total neutrophils by the PBMC neutrophil count.
The SPHERO™ Ultra Rainbow Calibration Particle Kit (Spherotech Inc., Lake Forest, IL) was utilized to assess variation in laser fluorophore intensities with rainbow beads acquired at each time of sample acquisition. Histogram overlays including rainbow beads acquired at baseline and each subsequent sample after were generated of each fluorophore. The need for MFI adjustment was determined by the difference of emission peaks varying by a half log or greater. If adjustments were needed, histogram emission peaks 1-6 were gated for each fluorophore, as demonstrated in the company protocol, and the mean MFI was determined for each peak. The difference between peak MFIs was calculated by subtracting the current MFI from the baseline MFI. The percentage difference was determined by dividing the mean MFI difference by the MFI at baseline for each peak. Mean peak percent difference was determined by averaging percentages of peaks 3-6 for each fluorophore. MFIs of specific markers were then multiplied by the percentage corresponding to the fluorophore the marker was conjugated to, resulting in the normalized MFI.
Two milliliters of isotonic lysis buffer (155 mM NH4Cl, 10mM KHCO3, 0.1mM EDTA in water sterile filtered with a Steritop 0.22µm filter) (26) was added to 50-100 μl of whole blood and set on a rotator for 5 minutes or until the red blood cells were lysed. Two milliliters of 2% FBS in DPBS was added and samples were centrifuged for 5 minutes at 200 x g. The pellet was suspended in 500 μl of 2% FBS in DPBS for immediate acquisition for functional assays or 10% human A/B serum in DPBS for further processing for proliferation assessment.
Intracellular staining was performed using the Cytofix/Cytoperm™ Fixation/Permeabilization Kit (BD Biosciences). One hundred microliters of whole blood from MM patients were isotonically lysed as described in “isotonic lysis of cells.” PBMCs were isolated, and 2.5 x 10⁵ PBMC aliquots were suspended in 50 μl of 10% A/B human serum in DPBS for 30 minutes at 4°C. Fifty microliters of the extracellular Ki67 antibody panel were added for 30 minutes at 4°C (Supplementary Table 1). The fixation and permeabilization were performed according to the manufacturer’s protocol. Samples were then stained with 5 μl of Ki67 antibody for 30 minutes at 4°C. Samples were washed with 2% FBS in DPBS and centrifuged for 5 minutes at 200 x g. This step was repeated. The final pellet was suspended in equal parts 2% FBS in DPBS and IC fix. Sample acquisition and analysis were performed as described in above with a final cytogram visualized by side scatter and Ki67 and quartile gate applied using a fluorescence minus one (FMO) for APC to set the negative gate and determine Ki67-positive cells.
The LEGENDplex™ Human Essential Immune Response Panel 740929 13-plex kit and LEGENDplex™ customization kit, including CCL2, CCL11, CRP, CXCL10, D-dimer, G-CSF, IFNγ, IL-18, IL-1β, IL-6, CXCL9, and TNF-R1 were utilized (BioLegend). Plasma samples were stored at -80°C. For the assay, the samples were thawed, centrifuged for 10 minutes x 500 g, and filtered using the filter plate for LEGENDplex™ Assay (BD Biosciences). Samples were processed according to the manufacturer’s instructions for the filter plate assay. In brief, 25 μl aliquots were added to the 96-well plate with 25 μl assay buffer for samples, 25 μl of Matrix B for standards, and 12.5 μl of the pre-mixed immune bead solution at RT covered on a shaker for 2 hours in the dark. Unbound beads were removed with gentle vacuum pressure and then washed with 1X wash buffer. 12.5 μl of detection antibody was added to samples and incubated for 1 hour covered on a shaker at RT in the dark. 12.5 μl of SA-PE was added to samples and incubated for 1 hour covered and shaken at RT in the dark. Samples were washed with 1X wash buffer and manually transferred to FACs tubes with a final volume of 150 μl per sample. The template for data acquisition and instrument setup was performed as described in the manufacturer’s protocol on the BD Symphony™ (BD Biosciences) the same day. Analyses were performed utilizing the online LEGENDplex™ Data Analysis Software (BioLegend).
Plasma was collected after single discontinuous density gradient centrifugation as described in “the processing of peripheral blood mononuclear cells (PBMCs)” and stored at -80°C until use. Plasma levels of sCD14 and lipocalin-2 (NGAL) were measured using commercial ELISA kits Hycult HK320 and Hycult HK330 (Hycult Biotechnology, Uden, the Netherlands), and sCD163 using commercial ELISA kit Quantikine DC1630 (R&D Systems, Minneapolis, MN) according to the manufacturer’s instructions. The final dilution ratio was 1:80 for sCD14 and NGAL and 1:10 for sCD163. Absorbance was measured with the ELx808™ Biotek absorbance microplate reader (Biotek, Winooski, WT), and concentrations were calculated using Gen5™ data analysis software (BioTek) based on a standard curve.
Fifty microliters of whole blood or isolated PBMCs (1 x 10⁶ aliquots per 50 μl) were stained with the ROS antibody panel in pre-warmed tubes (Supplemental Table 1). A final concentration of 20µM of H2-DCFDA was added, and samples were simultaneously stimulated with or without 10nM of PMA. Samples were incubated at 37°C for 30 minutes. Samples were lysed as described in “isotonic lysis of cells,” acquired within 30 minutes after preparation, and analyzed via flow cytometry. The same protocol was performed for superoxide production, utilizing the MitoSOX antibody panel, and a final concentration of 2mM of MitoSOX™ Red (Invitrogen) was added to samples simultaneously with PMA stimulation (Supplemental Table 1).
Fifty microliters of fresh whole blood or isolated PBMCs (1 x 10⁶ cells per 50 μl sample) from MM patients or controls were stained with the MitoTracker Green antibody panel using pre-warmed tubes (Supplemental Table 1). A final concentration of 1 μM of MitoTracker™ Green FM (MTG) (Invitrogen) was added to tubes to determine mitochondrial mass. Simultaneously, a final concentration of 500nM tetramethylrhodamine ethyl ester (MitoStatus TMRE) (BD Biosciences) was added to determine mitochondrial membrane potential (ΔΨm). Samples were incubated at 37°C for 30 minutes and lysed as described in “isotonic lysis of cells.” The samples were analyzed by flow cytometry within 30 minutes. ΔΨm was adjusted to the mitochondrial mass of a corresponding sample and presented as ΔΨm/MTG ratio.
Fifty microliters of fresh whole blood or isolated PBMCs (1 x 10⁶ per 50 μl sample) from MM patients or HD was stained with a premade antibody mix base panel and the pHrodo antibody panel using pre-warmed tubes (Supplemental Table 1). 10 μl of pHrodo™ Red E. coli BioParticles™ (ThermoFisher) was added to determine the phagocytic capacity of leukocytes as indicated by an increase in pHrodo™ red fluorescence indicating a decrease in pH. Samples were incubated at 37°C for 30 minutes. Samples were processed as described in “whole blood staining.”
Tests for statistical significance of myeloid phenotype marker expressions (p<0.05) were conducted using the Mann-Whitney rank-sum test between MM cases and controls. Correlations between marker expression and clinical parameters were evaluated using the Spearman rank-order test. Tests for statistical significance of marker expressions stratified by disease stage were performed using the Kruskal-Wallis one-way ANOVA followed by Dunn’s Multiple Comparison post hoc test. The myeloid phenotype of MM patients relative to clinical parameters was calculated using logistic regression adjusted for confounders (race, sex, age, and treatment type). All calculations were performed with GraphPad Prism (GraphPad Software Inc., La Jolla, CA) or Stata v.16.0 (StataCorp, College Station, TX).
To determine the heterogeneity of the myeloid cell compartment in the peripheral blood of patients with MM, whole blood cells were characterized by multiparametric flow cytometry using antibodies designed to assess myeloid cell differentiation and activation (Supplemental Table 1; Supplemental Figures 1 and 2). Neutrophil phenotype was assessed on two distinct neutrophil subsets, CD16neg immature neutrophils (imN) and CD16pos mature neutrophils (mN) (Supplemental Figure 1; Figure 1A). Comprehensive analyses revealed two distinct phenotypes characterized by specific patterns of surface antigen expression on neutrophils, monocytes, and eosinophils. A subset of MM patients exhibited significantly higher surface levels of CD64 (FcγRI) on CD16pos circulating mNs (Figures 1A–C) (42, 43). MM patients exhibiting CD64 expression on mNs equal to or higher than 15 standard deviations from the mean value detected in HDs were included in the MM2 (CD64high) group; patients with mN CD64 expression below this level were included in the MM1 (CD64low) group (Figures 1B, C). MM2 (CD64high) phenotype was observed in 13 out of 35 patients (37%). The percentage of CD64neg cells was highest in HDs and lowest in MM2 patients (Supplemental Figure 2B). The lower maturation status of mNs from MM2 (CD64high) patients is indicated by increased CD64 levels and reduced levels of CXC chemokine receptor 2 (CXCR2), CD10, and CD15 compared to neutrophils from MM1 patients or healthy donors (Figure 1D). Neutrophils from MM2 patients displayed elevated levels of PD-L1 relative to MM1 (p<0.001) or controls (p<0.01) suggesting enhanced immunosuppressive potential (16, 17, 23, 44) (Figure 1D). There was no indication of neutrophil activation as determined by an absence of changes in the surface levels of CD16 or lectin-type oxidized LDL receptor 1 (Lox-1) and an absence of surface shedding of CD31 or CD62L (42, 45–47) (Figure 1D and Supplemental Figure 3A). Similarly, no indication of neutrophil degranulation was observed on neutrophils from MM2 patients as determined by an absence of changes in the levels of degranulation markers myeloperoxidase (MPO), CD11b, CD63, or CD66b (48–51) (Figure 1D and Supplemental Figure 3A). The neutrophil: lymphocyte ratio did not significantly differ between controls, MM1, and MM2 patients (Supplemental Figure 3B). The presented data indicate the presence of a phenotypically distinct and alternatively differentiated mature neutrophil population in MM2 patients that does not exhibit typical signs of activation or degranulation.
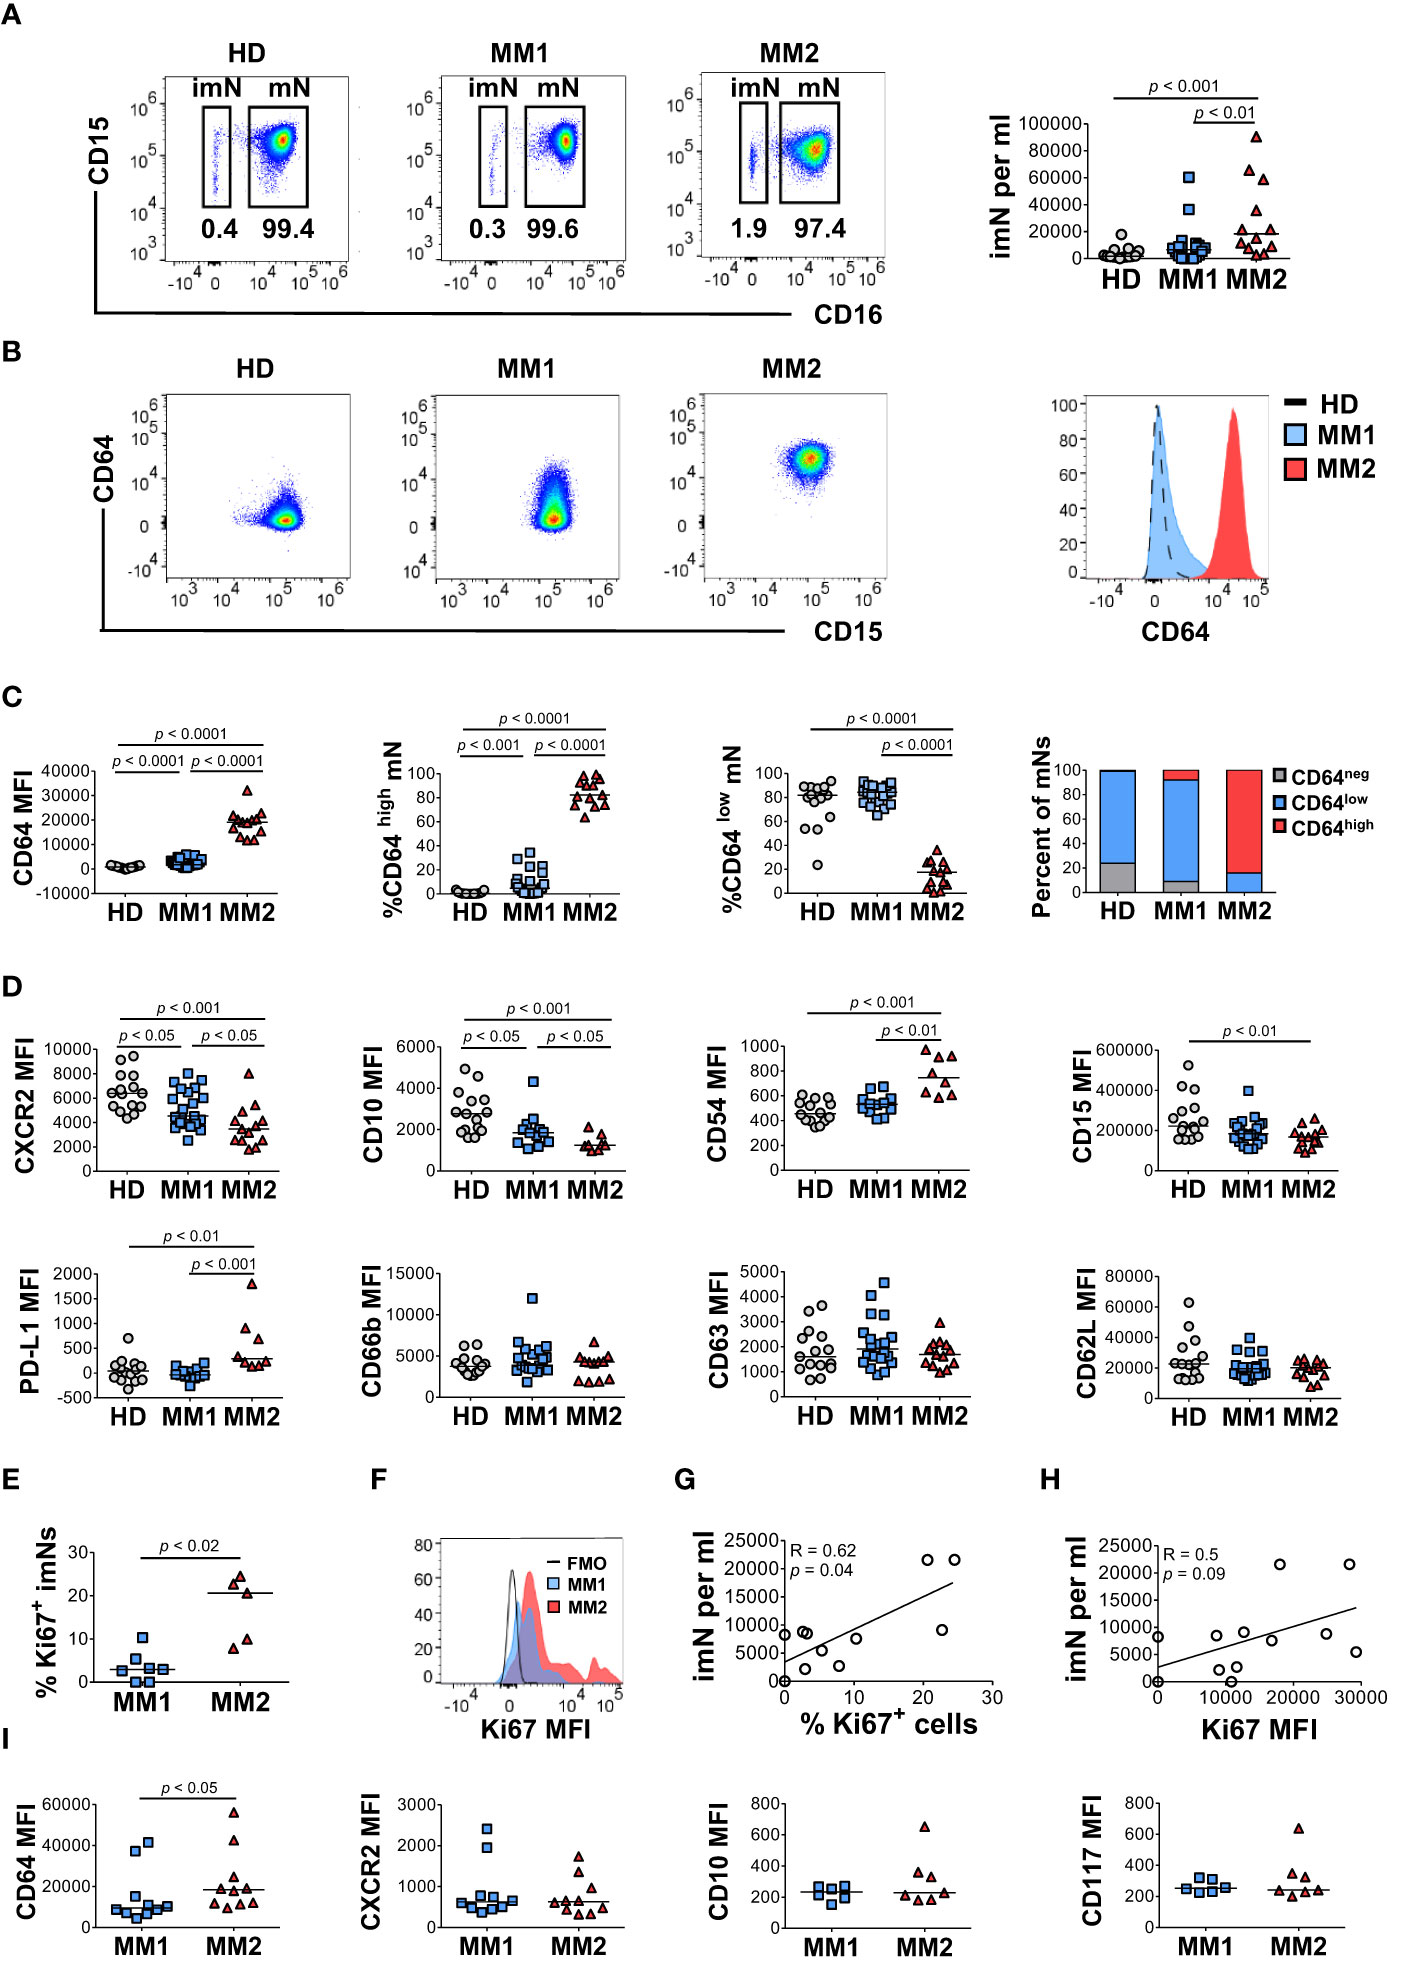
Figure 1 A subset of MM patients exhibits an altered neutrophil phenotype. (A) Left panel: representative cytograms of CD15+CD16+ mature neutrophils (mNs) and CD15+CD16- immature neutrophils (imNs) in whole blood of a healthy donor (HD), MM1 patient, and MM2 patient. Right panel: frequency of imN per ml of blood of MM1 and MM2 patients and HD. (B) Representative cytograms of mNs of HD and MM1 and MM2 patients and a histogram overlay of CD64 expression. (C) Levels of expression of CD64 and percentages of CD64high and CD64low mNs in HD, MM1 and MM2 patients. (D) Levels of expression of maturation and activation markers on mNs of HD, MM1 and MM2 patients. (E) Percentage of Ki67+ imNs of total imNs. (F) Histogram overlay of Ki67 intracellular expression on imNs and (G) a correlation between imN frequency and the percentage of Ki67+ imNs, n=11. (H) Correlation between imN frequency and MFI of Ki67+ imNs, n=11. (I) Levels of expression of maturation and activation surface markers on imNs of MM1 and MM2 patients. MFI, median fluorescent intensity. Statistical analyses were performed using the Mann-Whitney rank-sum test (A, C–E and I) or Spearman correlation (G, H). Spearman correlation coefficients R and p values are indicated; bars and lines represent median values and simple linear regression analysis, respectively.
Immature neutrophils (imNs) consist of circulating neutrophil progenitor populations characterized by the SSChighCCR3-CD10lowCD15+CD16neg phenotype (42, 52, 53). imNs are expanded in patients with a variety of chronic inflammatory diseases and multiple types of cancer (15, 42, 54–57). MM2 patients exhibit a significant expansion of CD16neg imNs relative to MM1 patients (p<0.01) or controls (p<0.001; Figure 1B, right panel). imNs from MM2 patients display higher intracellular expression of a proliferation marker Ki67 relative to MM1 (p<0.02; Figures 1E, F). A significant positive correlation was observed between the frequency of imNs and the percentage of Ki67+ imNs (Figure 1G; correlation coefficient R=0.62, p=0.04), and a trend for a positive correlation was observed between imN frequency and Ki67 expression (Figure 1H). The percentage of Ki67+ mNs did not significantly differ between MM1 and MM2 patients (Supplemental Figure 3D). imNs expressed higher levels of CD64 on MM2 relative to MM1 (p<0.05) with no significant difference in the expression of other markers tested (Figure 1I and Supplemental Figure 3E).
Low-density neutrophils (LDNs) or PMN-MDSCs co-localizing with lymphocytes following cell separation by density gradient centrifugation are expanded in chronic inflammatory conditions and cancer and exert significant immunosuppressive properties (15, 23, 28, 44, 52, 58). Significantly higher frequencies of total LDNs (p<0.05) and CD16neg immature LDNs (imLDNs) (p<0.001) were observed in MM2 patients compared to controls (Figures 2A, B). Mature LDNs (mLDNs) from MM2 patients exhibited less differentiated neutrophil phenotype relative to MM1 patients as indicated by elevated CD117 (p<0.01) and CD64 (p<0.0001) (Figure 2C) (54, 55, 59). Consistent with the findings in whole blood, mLDNs from MM2 patients exhibited a significant decrease in CD15 expression relative to controls (p<0.05; Figure 2C). imLDNs from MM2 exhibited significantly higher expressions of CD64 (p<0.01) and CD62L (p<0.05) relative to MM1 (Figure 2D).
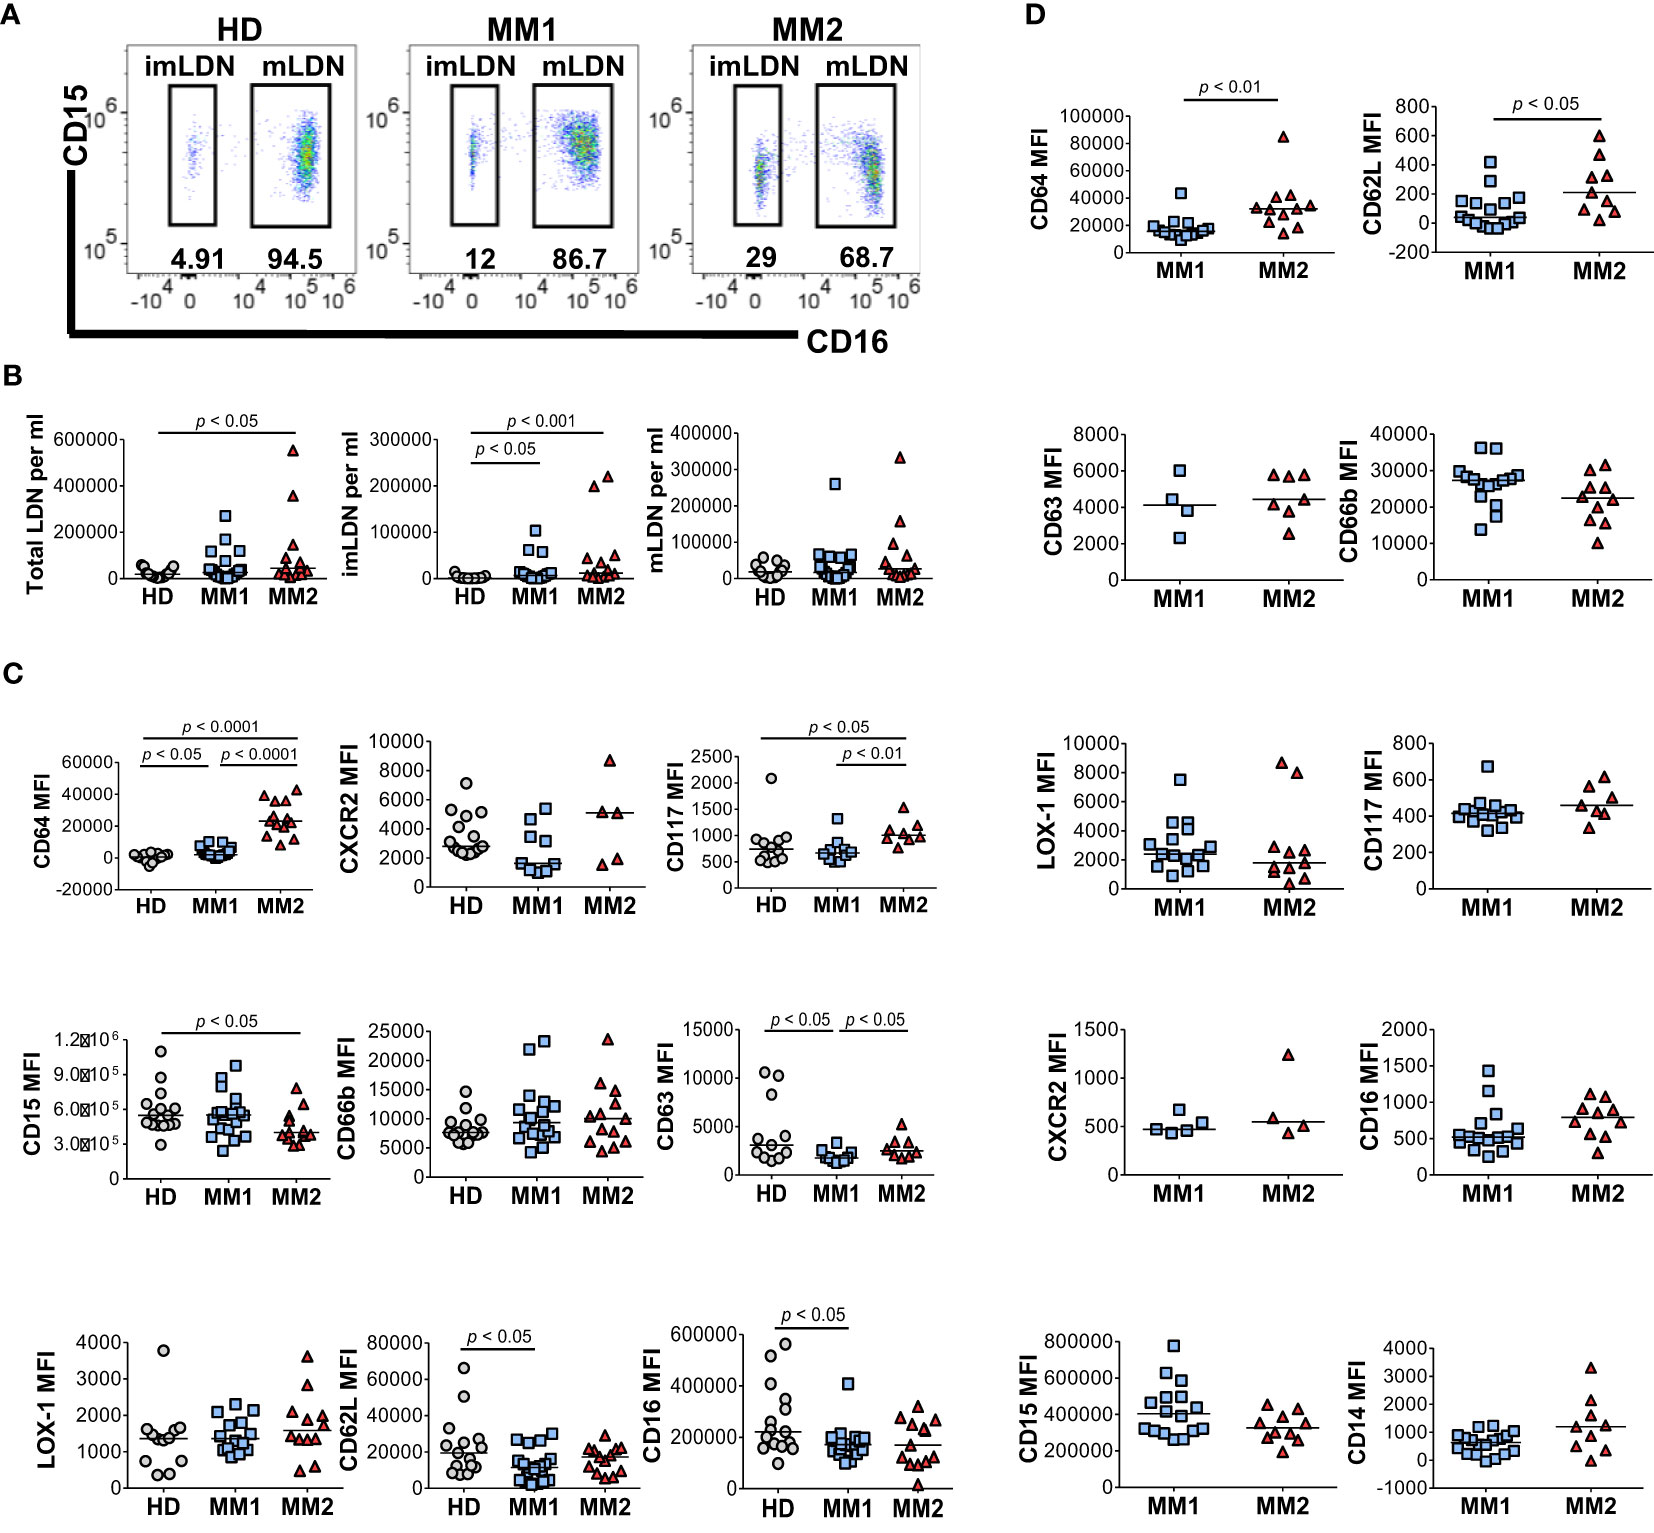
Figure 2 Distinct phenotypes on low-density neutrophils obtained from MM1 and MM2 patients. (A) Representative cytograms of CD15+CD16+ mature low-density neutrophils (mLDNs) and CD15+CD16- immature low-density neutrophils (imLDNs). (B) Frequencies of total LDNs, mLDNs, and imLDNs in the blood of HD, MM1, and MM2 patients. (C, D) Surface expression of maturation, degranulation, and activation markers on mLDNs (C) and imLDNs (D) from MM1, and MM2 patients. MFI, median fluorescent intensity; statistical analyses were performed using the Mann-Whitney rank-sum test with p values indicated. Bars represent median values.
To address monocytic heterogeneity in MM, the phenotypes of classical (CD16lowCD14high) and patrolling (CD14lowCD16high) monocyte subpopulations were determined (60, 61). MM2 patients exhibited a significantly lower frequency of patrolling monocytes relative to MM1 (p<0.05) or controls (p<0.01; Figures 3A, B). There were no significant differences in the frequency of total monocyte population, frequency of M-MDSCs, or lymphocyte: monocyte ratios between MM2 patients and HD (Figure 3B and Supplemental Figure 3C). The intermediate monocyte population defined as CD16highCD14high was not clearly defined in most patients and was highly affected by the shifts in the expression of CD16 on classical monocytes; it was therefore not included in the final analysis. Consistent with the mature neutrophil phenotype, classical monocytes from MM2 patients exhibited significantly higher expression of CD64 (p<0.05) and lower levels of CXCR2 (p<0.01) compared to MM1 (Figure 3C). Patrolling monocytes from MM2 patients exhibited higher levels of CD64 relative to MM1 patients (p<0.001) and controls (p<0.0001; Figure 3D). In contrast, CXCR2 levels on patrolling monocytes from MM2 patients were significantly higher relative to controls (p<0.01; Figure 3D).
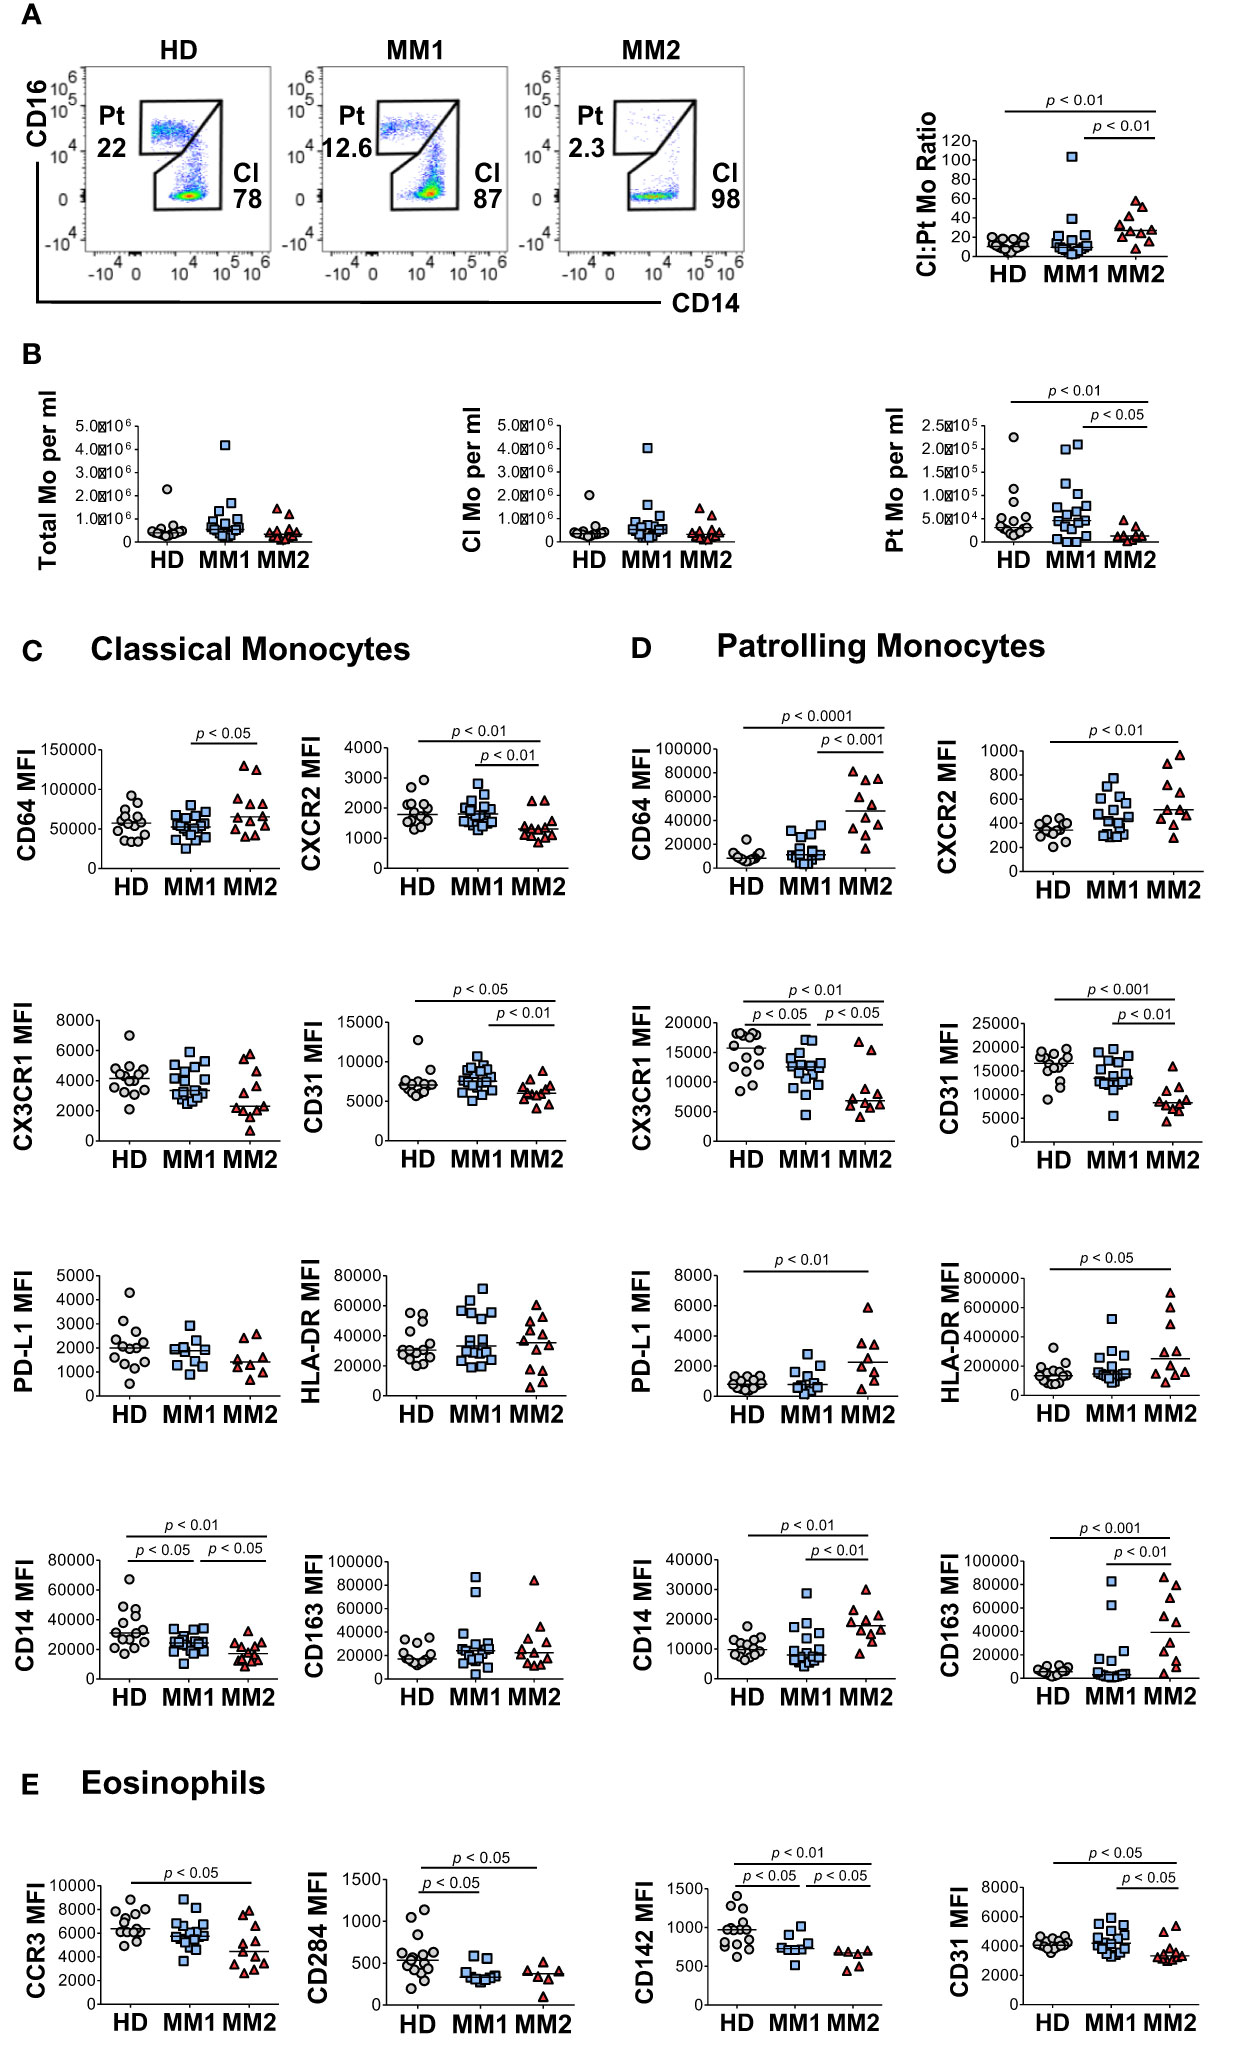
Figure 3 Altered monocytic and eosinophilic phenotypes in MM2 patients. (A) Left panel: representative cytograms of CD16lowCD14high classical monocytes (Cl Mo) and CD16highCD14low patrolling monocytes (Pt Mo) in whole blood from HD, MM1 and MM2 patients. Right panel: classical to patrolling monocyte ratios from HD, (n=15) MM1, (n=16) and MM2 (n=10) patients. (B) Frequencies of total, classical, and patrolling monocytes. (C, D) Surface levels of monocyte markers on classical (C) or patrolling monocytes (D). (E) Surface levels of eosinophil markers of HD, MM1, and MM2 patients. MFI, median fluorescent intensity; statistical analyses were performed using the Mann-Whitney rank-sum test with p values indicated. Bars represent median values.
An activated monocytic phenotype was observed in MM2 relative to MM1 patients indicated by a significant decrease in CD31 expression on classical and patrolling monocytes (Figures 3C, D and Supplemental Figure 4). Additionally, patrolling monocytes from MM2 patients demonstrate a significant increase in activation markers CD163 (p<0.01) and CD169 (p<0.01; Figure 3D and Supplemental Figure 4F). Patrolling monocytes from MM2 exhibited downregulation of CX3 chemokine receptor 1 (CX3CR1) (p<0.01) and upregulation of PD-L1 (p<0.01) relative to controls consistent with the features observed in an immunosuppressive environment (23, 26) (Figure 3D).
Eosinophils were shown to accelerate MM progression in synergy with microbiota-driven IL-17-producing cells in murine models (62). Decreased C-C Chemokine receptor 3 (CCR3) expression on eosinophils was observed in MM2 patients compared to controls (p<0.05; Figure 3E). Eosinophils from MM2 patients exhibited lower levels of cell signaling receptor tissue factor (CD142) (63) (p<0.05), activation marker CD66b (64) (p<0.05) and CD31 (p<0.05) relative to MM1 patients (Figure 3E and Supplemental Figure 5).
Next, the differences in the bioenergetic properties of myeloid cells in MM patients were assessed. Neutrophils from MM2 patients exhibited significantly higher mitochondrial superoxide production detected using MitoSOX™ Red fluorogenic dye in the absence and presence of PMA stimulation compared to neutrophils from MM1 patients or controls (Figure 4A). Similar results were observed in the LDN subpopulations suggesting that neutrophils from MM2 patients exert higher capacity for mitochondrial superoxide release (Figure 4B). Neutrophil subpopulations from both MM1 and MM2 patients demonstrated significantly higher mitochondrial potential detected using the cationic TMRE dye sequestered by mitochondria with adjustment for mitochondrial mass indicated by MitoTracker™ Green staining relative to controls (p<0.05; Figure 4C). Classical and patrolling monocytes from MM2 patients exhibited increased mitochondrial potential relative to controls (p<0.01; Figure 4D). mLDNs from MM2 patients demonstrated higher phagocytic capacity as determined by the phagocytosis of pHrodo™ Red E. coli-conjugated BioParticles™ relative to controls (p<0.05; Supplemental Figure 6A). No differences were observed in the phagocytic capacity of monocyte subpopulations between MM1 and MM2 patients (Supplemental Figure 6B).
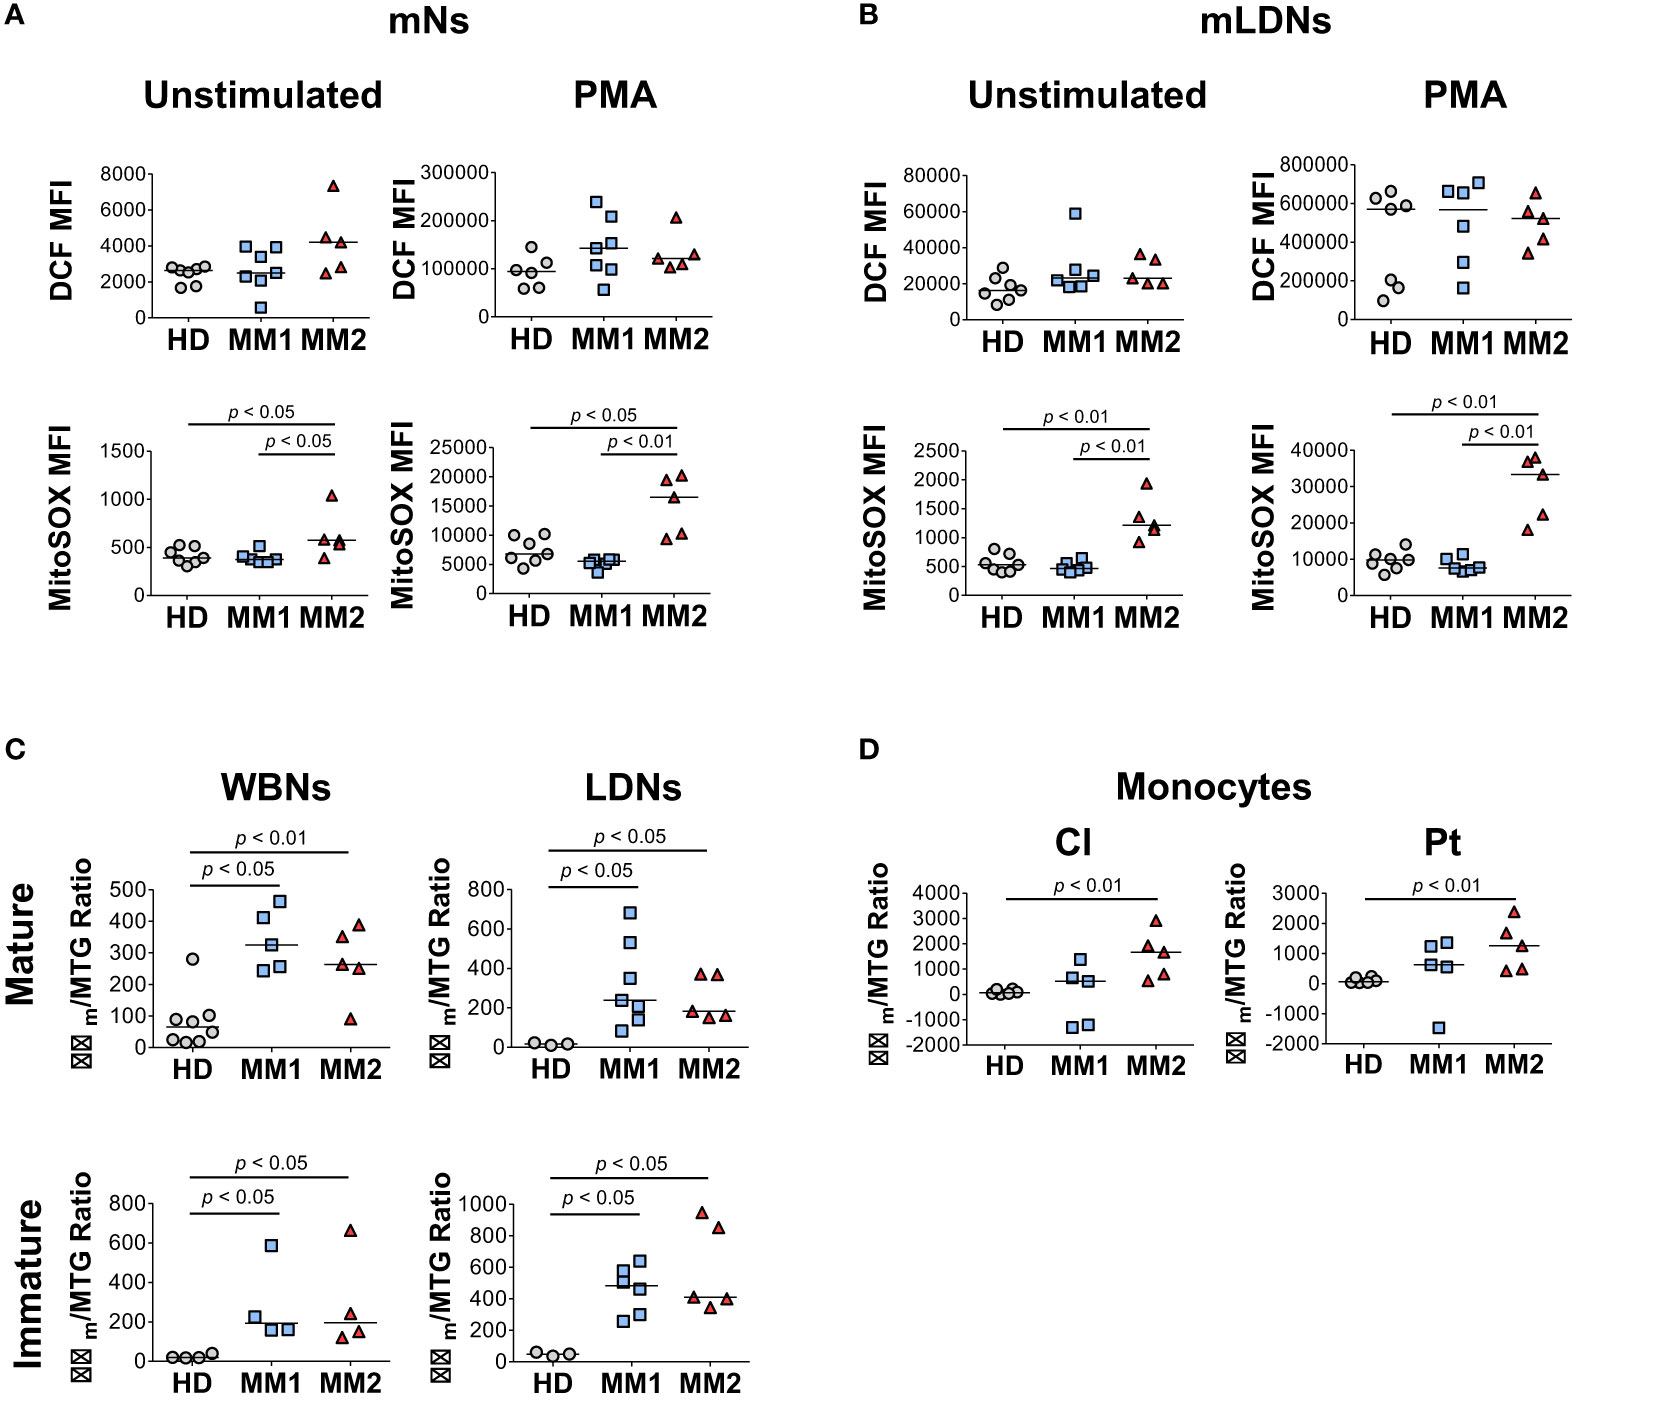
Figure 4 Myeloid cells obtained from MM2 patients exert altered functional activity. (A, B) Reactive oxygen species (ROS) production determined by dichlorodihydrofluorescein (DCF) staining and mitochondrial superoxide production by MitoSOX™ Red at baseline and upon stimulation with phorbol myristate acetate (PMA) in mNs (A) and mLDNs (B) of HD (n=8) and MM1, (n=5) and MM2 (n=5) patients. (C, D) Mitochondrial membrane potential was determined using tetramethylrhodamine ethyl ester (TMRE) staining adjusted for mitochondrial mass as detected by MitoTracker™ Green (Δψm/MTG) on neutrophils (C) and monocytes (D). MFI, median fluorescent intensity; statistical analyses were performed using the Mann-Whitney rank-sum test with p values indicated. Bars represent median values.
MM2 patients exhibited higher plasma levels of several key markers of myeloid cell activation. CXCL9 (monokine induced by interferon-gamma; MIG) levels were significantly higher in MM2 relative to MM1 patients (p<0.01) or controls (p<0.0001; Figure 5A). Both MM1 and MM2 patients displayed higher levels of CXCL10 (IP-10) and tumor necrosis factor receptor 1 (TNF-R1) relative to controls (Figure 5A). The levels of CXCL9 and TNF-R1 positively correlated with the levels of CD64 on mature neutrophils and classical and patrolling monocytes (Figure 5B). MM1 patients demonstrated higher levels of CCL2 (monocyte chemoattractant protein-1; MCP1), eosinophil chemotactic CC-chemokine CCL11 (eotaxin-1), and neutrophil gelatinase-associated lipocalin (NGAL) relative to controls (Figure 5A). There was no significant difference in plasma levels of granulocyte colony-stimulating factor (G-CSF), CRP, IL-6, IL-1β, IFNγ, and TNFα between MM1 and MM2 patients (Supplemental Figure 7 and data not shown). To assess the level of monocyte/macrophage activation, plasma levels of soluble markers sCD14 and sCD163 were determined (65–68). The levels of sCD14 were lower in both MM1 and MM2 patients relative to controls (Figure 5A), corresponding to lower levels of cell-associated CD14 on classical but not patrolling monocytes (Figures 3C, D). In contrast, sCD163 was significantly elevated in the plasma of MM2 patients relative to controls (p<0.05; Figure 5A), consistent with a prior study (66). The level of sCD163 corresponded to elevated CD163 expression on patrolling monocytes (Figure 3D) and negatively correlated with the expression of CX3CR1 on patrolling and classical monocytes (Figure 5B).
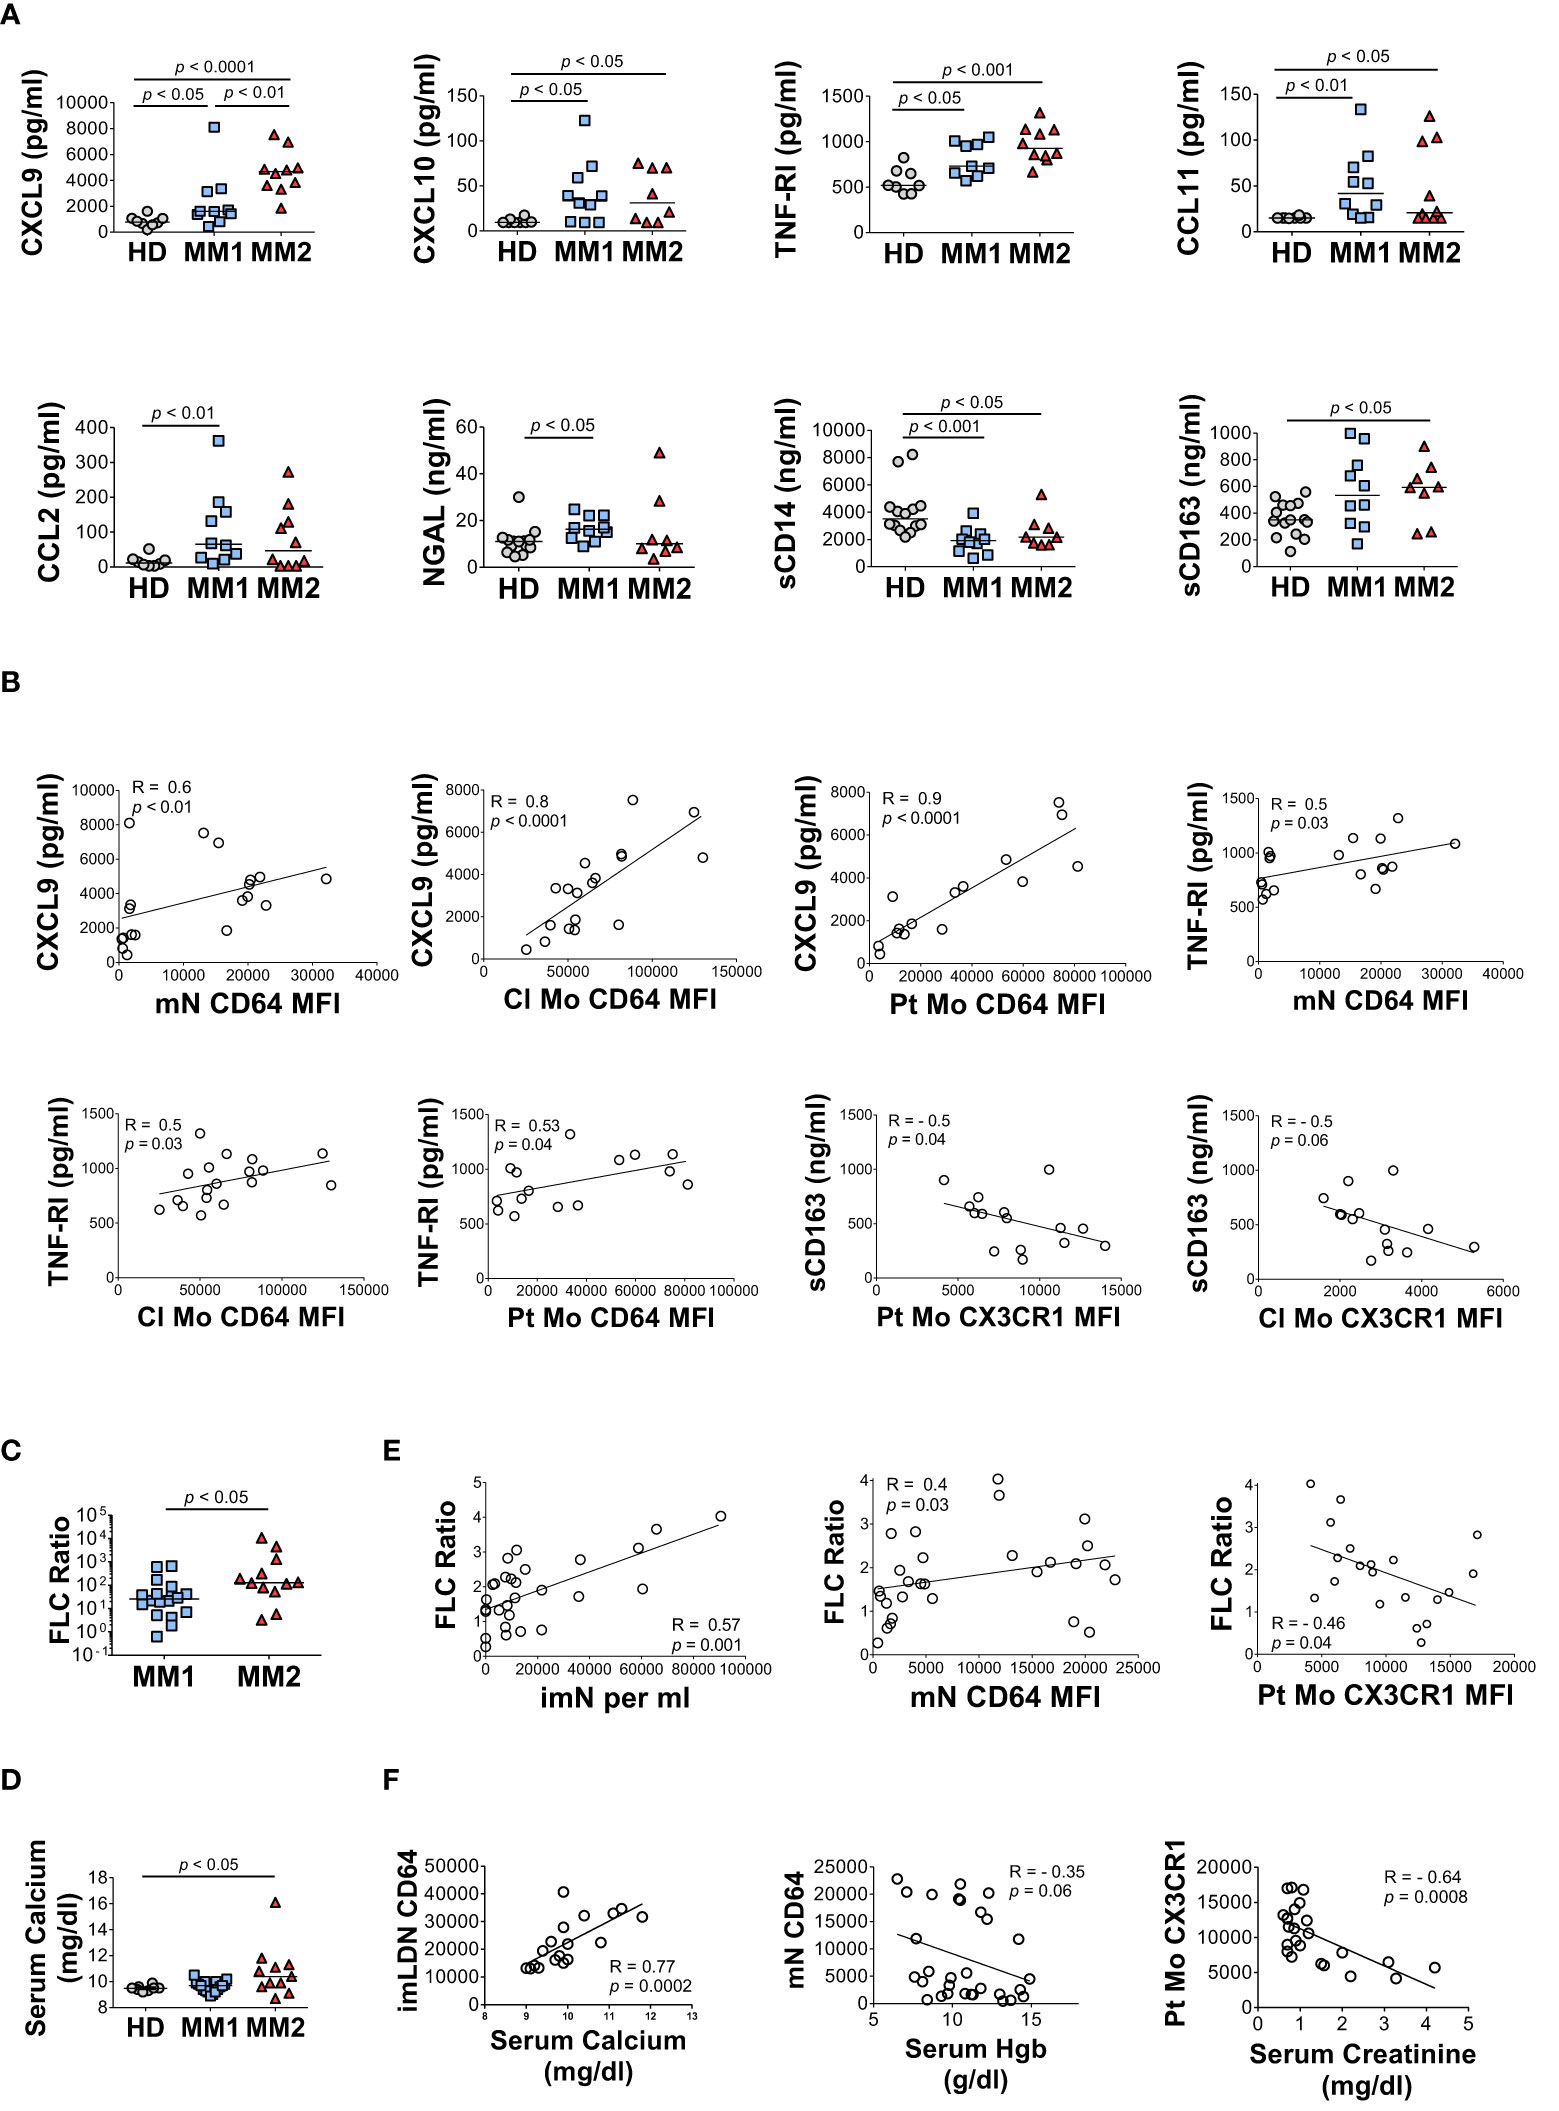
Figure 5 The MM2 phenotype is associated with changes in the plasma levels of markers of inflammation and with clinical markers of disease progression. (A) Levels of cytokines and markers of myeloid activation in plasma of HD and MM1 and MM2 patients. (B) Correlations between the plasma levels of markers of myeloid activation and surface levels of antigens on mN and patrolling monocytes. (C) (involved/uninvolved immunoglobulin free light chain) FLC Ratio of MM1 and MM2 patients. (D) Serum calcium levels of HD, MM1, and MM2 patients. (E) Correlation between the FLC ratio and characteristic features of the MM2 phenotype (n=29). (F) Correlations between the characteristic features of the MM2 phenotype and myeloma-defining events (n=24). Serum calcium levels adjusted for albumin [(0.8 x (4g/dl*normal albumin – patient albumin)) + patient serum calcium level]. MFI, median fluorescent intensity. (A, C, D) or the Spearman correlation test (B, E, F). Spearman correlation coefficients R and p values are indicated; bars and lines represent median values and simple linear regression analysis, respectively.
Clinical features indicative of end-organ damage at diagnosis are summarized in Table 1. Compared to the MM1 phenotype, significantly more patients with the MM2 (CD64 high) phenotype displayed involved to uninvolved FLC ratios > 100 at diagnosis after adjusting for sex, race, age, and treatment (p=0.009), suggesting that the MM2 phenotype may be reflective of myeloid dysregulation in MM patients with elevated FLC ratios (Figure 5C; Table 1). MM2 patients exhibited a trend toward increased serum calcium levels relative to controls (Figure 5D and Table 1).
Myeloma-defining events were analyzed in relation to the defining characteristics of the MM2 phenotype. The involved to uninvolved FLC ratio positively correlated with the frequency of imNs (R=0.57, p=0.001) and CD64 expression on mNs (R=0.4, p=0.03) and negatively correlated with CX3CR1 expression on patrolling monocytes (R= -0.46, p=0.04, Figure 5E). High CD64 expression on imLDNs positively correlated with elevated serum calcium related to hypercalcemia (R=0.77, p=0.0002; Figure 5F). Additionally, high CD64 expression on mNs partially correlated with lower hemoglobin values used to define anemia (R= -0.35, p=0.06; Figure 5G). Levels of CX3CR1 on patrolling monocytes negatively correlated with serum creatinine levels indicating renal involvement (R= -0.64, p=0.0008; Figure 5F).
G-CSF, which is commonly administered after aHSCT, has been previously reported to induce high neutrophil CD64 expression (69–71). Although CD64 expression on mNs and classical monocytes positively correlated with the start of induction therapy, aHSCT did not notably contribute to the MM2 phenotype (Supplemental Figures 8 and 9). Of the twelve patients treated with monoclonal antibody-based therapy in combination with chemotherapy, six demonstrated the MM2 phenotype, with the difference between groups not reaching a level of statistical significance (Table 1). Logistic regression analysis demonstrated an absence of any significant association between the MM phenotype and the remission state. A significant increase in CD15 expression on mNs of MM patients with dominant lambda clonal disease was observed relative to those with kappa disease (p<0.001) and an increase in CX3CR1 was observed on classical monocytes obtained from patients with the IgG isotype (p<0.05). No other notable differences were observed in relation to the myeloma isotypes (Supplemental Figure 10). Lower levels of CD284 (p<0.05) and CD142 (p<0.05) were observed on eosinophils obtained from patients with a diagnosed bone disease (Supplemental Figure 11). No other significant differences with regard to MM2 phenotype components were observed (Supplemental Figure 11).
To address the relationship between the characteristic components of the MM2 (CD64 high) phenotype and disease stage, granulocytic and monocytic markers of MM patients and plasma markers of myeloid activation were stratified by the revised and updated International Staging System (R-ISS) criteria with R-ISS stage III indicative of advanced disease (Figure 6 and Supplemental Figure 12). Mature neutrophils from some, but not all, MM stage III patients exhibited significantly higher CD64 expression (p<0.001) relative to controls. Mature neutrophils from stage II patients exhibited significantly lower levels of CXCR2 (p<0.05) and CD10 (p<0.01) relative to controls (Figure 6A). No difference was observed in neutrophil activation and degranulation markers among MM patients (Figure 6A) indicating that the observed differences were not induced by neutrophil activation or degranulation. A significant decrease of CD14 expression was observed on classical monocytes (p<0.01) from stage III patients, while patrolling monocytes from stage III patients exhibited significantly lower levels of CX3CR1 (p<0.01) and CD31 (p<0.01) relative to controls (Figures 6B, C). Further, a significant increase was observed in CD64 (p<0.01) and CD169 (p<0.05) on patrolling monocytes from stage III patients relative to controls (Figure 6C and Supplemental Figure 12C). The levels of CXCL9, TNF-RI, and sCD163 were significantly elevated in stage III patients relative to HD (Figure 6D). Similar trends in myeloid marker expression and cytokine levels were observed utilizing the Durie-Salmon (DS) staging system, in particular an increase of CD64 and a decrease of CXCR2 and CD10 levels on neutrophils from patients with an advanced disease stage (Supplemental Figure 13). Overall, these data suggest that several components of the MM2 myeloid phenotype are associated with an advanced MM disease stage.
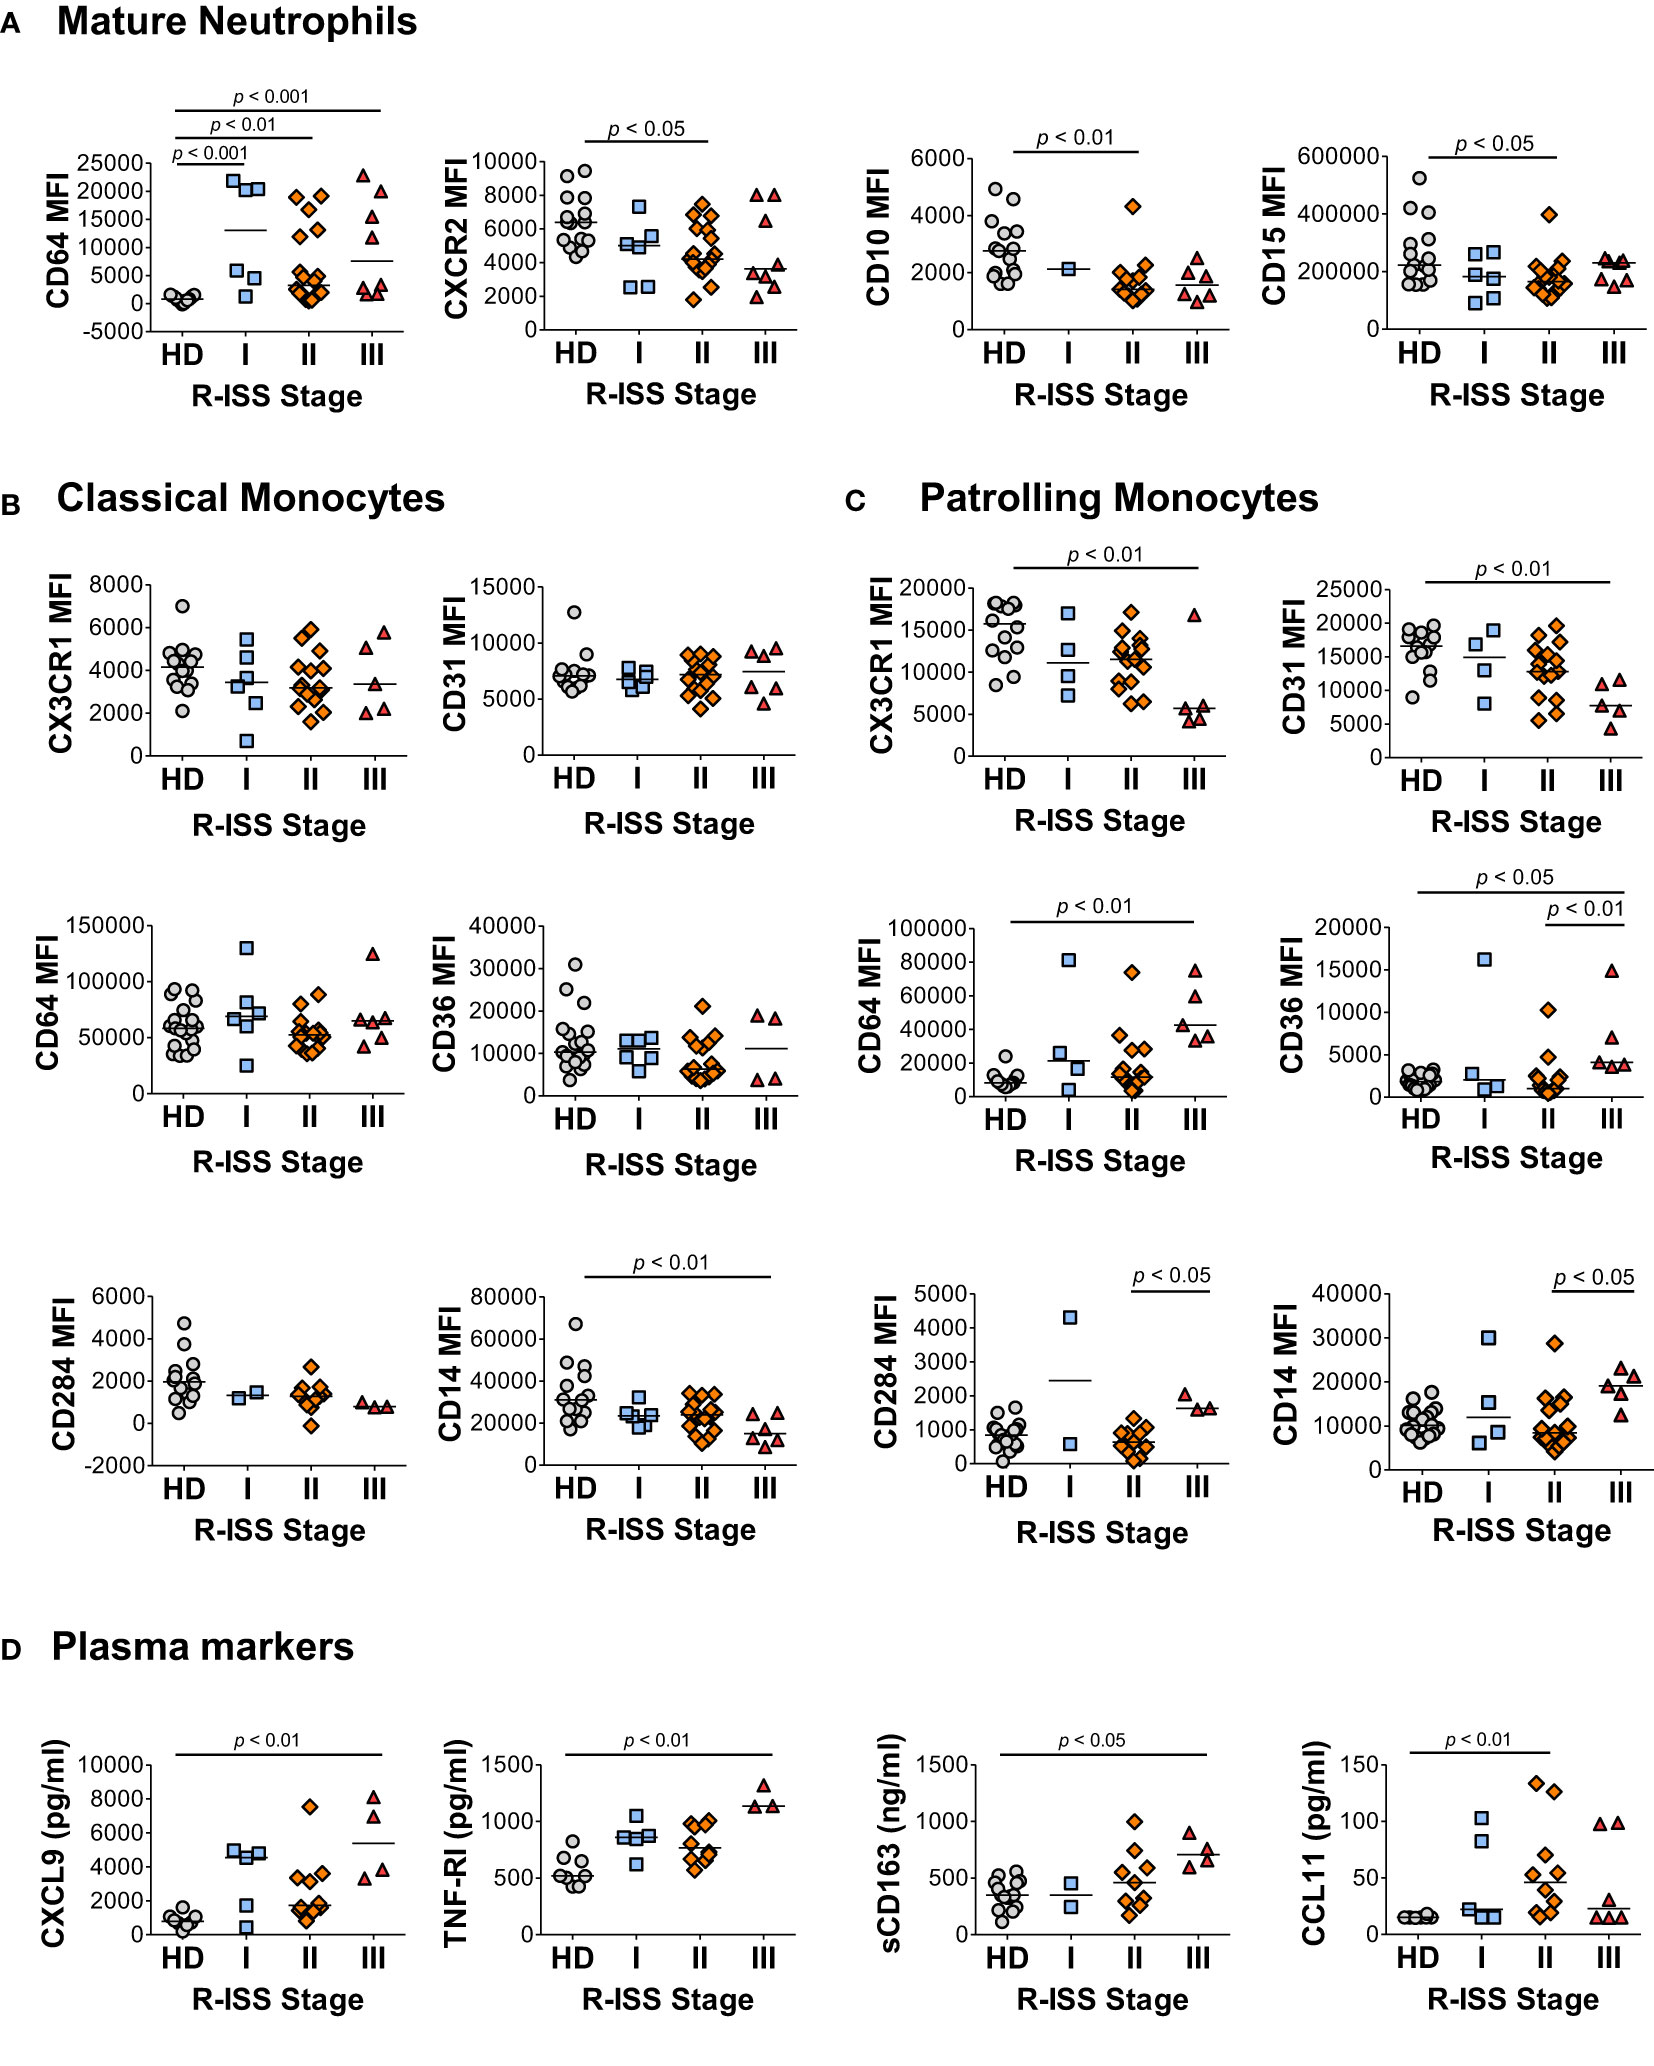
Figure 6 Characteristic features of the MM2 phenotype are associated with an advanced R-ISS stage. (A–C) Expression of surface markers on mature neutrophils (A), classical monocytes (B), and patrolling monocytes (C) stratified using R-ISS. (D) Levels of cytokines and plasma markers of activation stratified using R-ISS. MFI, median fluorescent intensity; statistical analyses were performed using the Kruskal-Wallis one-way ANOVA test followed by Dunn’s post hoc test with p values as indicated. Bars represent median values.
In this study, we report that a subset of MM patients exhibits an altered myeloid cell phenotype characterized by significant changes in the properties of circulating granulocytic, monocytic, and eosinophilic populations. Characteristic features of the observed MM2 (CD64high) phenotype are associated with advanced-stage disease and myeloma-defining events, including hypercalcemia and elevated involved-to-uninvolved free light chain ratio. MM2 (CD64high) phenotype is independent of age, race, sex, and treatment type and is characterized by a significant upregulation of CD64 and downregulation of CXCR2 and CD10 on mature neutrophils indicative of their lower maturation status. Additional components of the MM2 phenotype include upregulation of CD64 and activation markers on classical and patrolling monocytes, upregulation of PD-L1 on patrolling monocytes, and downregulation of cell signaling receptors on eosinophils. Functionally, neutrophil subpopulations from MM2 patients exhibit a higher capacity for the production of mitochondrial ROS. The findings presented here are consistent with the dysregulation of myelopoiesis resulting in the release of distinct myeloid cell subsets with altered phenotypic and functional properties (12, 20, 72–74).
The significance of assessment of neutrophil CD64 expression as a potential diagnostic tool is corroborated by previous observations demonstrating elevated STAT3 signaling and expression of CD64 on neutrophils from MGUS and MM patients and an association between upregulated CD64 and disease progression in MM patients treated with bortezomib, thalidomide, and dexamethasone (9, 75). In line with prior studies, the results presented here demonstrate that the presence of neutrophils with high CD64 expression in MM2 patients is significantly associated with the FLC ratio > 100 (Table 1). Consistent with a prior report, we did not observe an association between the level of CD64 expression on neutrophils and the presence of specific myeloma isotypes (9). The translational relevance of quantitative assessment of CD64 levels on neutrophils in clinical settings is supported by its use in other conditions, including the discrimination between sepsis and non-septic systemic inflammatory response syndrome (76, 77). In a human CD64 transgenic mouse model of B-cell lymphoma, CD64-directed bispecific antibodies were demonstrated to eliminate lymphoma cells and promote protection up to 100 days post tumor inoculation (78).
LDNs, commonly referred to as PMN-MDSCs in cancer, represent a pathologically activated neutrophil subpopulation expanded in various malignancies (13, 79). PMN-MDSCs are implicated in regulating the immune response in cancerous conditions and exert potent immunosuppressive properties including increased arginase-1 expression and inhibition of T-cell proliferation (15, 33, 34, 73, 74). Consistent with prior studies, we observe a significant increase in the frequencies of LDNs and imLDNs in MM2 patients relative to controls (Figure 2B). imN frequency detected in whole blood is significantly elevated in MM2 patients compared to MM1 or controls (Figure 1A). In concordance with our observations, prior studies reported the expansion of PMN-MDSC in MM and demonstrated their immunosuppressive capacity and ability to protect MM cells from chemotherapy-induced toxicity (28–34). Hsu et al. have shown that immature neutrophils exert enhanced migratory responses in breast-liver metastasis in response to complement 3a (11, 80). The shift in the immune cell compartments in the BME of MM results in an expansion of regulatory T cells (81) and MDSCs (28) promoting an immunosuppressive environment associated with altered function of myeloid cells consistent with the MM2 phenotype presented here (31, 33, 34). MM cells induce the development of MDSCs from healthy donor peripheral blood mononuclear cells via a bidirectional interaction between MM cells and MDSCs (29). Exosomes derived from the bone marrow stromal cells in MM patients alter myelopoiesis via activation of STAT1 and STAT3 pathways and increase of the levels of anti-apoptotic proteins Bcl-xL and Mcl-1 resulting in immature myeloid cells with immunosuppressive activity (72). The relevance of the determination of imN/PMN-MDSCs as an indicator of myeloid dysfunction and advanced disease is supported by prior reports demonstrating strong associations between PMN-MDSC frequencies and poor clinical outcomes in cancer (13, 79, 82).
A dysregulated functional capacity of myeloid cells in MM patients, including decreased capacity for phagocytosis and oxidative burst associated with elevated neutrophil CD64 levels, increased STAT3 phosphorylation, and immunosuppressive properties, has been previously reported (9). In the current study, we demonstrate an increase in the mitochondrial superoxide production in mature neutrophils of MM2 patients indicating a primed phenotype in the absence of signs of cellular activation or degranulation (Figures 4A, B). No differences in total ROS production were observed between the neutrophils of MM1 and MM2 patients (Figures 4A, B). Differences between the studies could be attributed to variances in the methods of assessment with prior studies utilizing different stimulants (e.g. fMLF), time of incubation, and other experimental conditions.
High serum levels of CXCL9 and CXCL10, closely related inflammatory cytokines interacting with chemokine receptor CXCR3, have been proposed as potential biomarkers of MM progression associated with poor overall survival (83, 84). High concentrations of CXCL9 and CXCL10 interfere with the infiltration of natural killer (NK) cells into the MM microenvironment and limit their anti-myeloma activity (85, 86). We demonstrate that CXCL9 is significantly elevated in MM2 patients and in patients with R-ISS stage III (Figures 5 and 6), consistent with prior studies (83, 84). We further show that the levels of CXCL9 closely correlate with the expression of CD64 on myeloid cells, in particular on classical and patrolling monocytes (R=0.8; p<0.0001; Figure 5). An elevated level of sCD163 has been proposed as an independent biomarker in MM with sCD163 levels in bone marrow aspirates and peripheral blood of MM patients shown to be associated with poor disease outcomes (66). Consistent with a prior report (66), we demonstrate that sCD163 levels are significantly elevated in the plasma of MM2 patients or patients diagnosed with R-ISS stage III disease (Figure 5A and Figure 6D).
Tumor progression, through immune editing of myeloid cells, has been demonstrated in experimental and clinical models of MM and patrolling monocytes were previously described as a potential indicator of circulating osteoclast precursors (33, 87). We did not observe a difference in the levels of classical and patrolling monocyte markers between the groups of patients with or without bone disease at the time of diagnosis (Supplemental Figure 11). The presented data provide a detailed characterization of circulating monocytic subsets, including the downregulation of CX3CR1 and upregulation of PD-L1 on patrolling monocytes in MM2 patients. To our knowledge, a detailed phenotypic characterization of circulating eosinophils has not been previously reported in patients with MM. It has been suggested that eosinophils can contribute to MM progression and demonstrate immunosuppressive properties (62, 88). Additionally, studies in allergic rhinitis (89) and pulmonary inflammation (90) demonstrate a critical role of CCR3 expression in the inflammatory pathway and recruitment of eosinophils. The data presented here demonstrating a significant downregulation of CCR3 on eosinophils in MM2 patients are consistent with prior studies and support active involvement of eosinophils in the pathogenesis of MM.
Limitations of this study include limited sample size and younger age of controls relative to MM patients. However, healthy controls did not contribute to the interpretation of findings from case-only analyses of patients in the MM1 and MM2 groups where no correlation with age was detected. Although MM phenotypes were primarily stratified based on neutrophil CD64 expression, other criteria including CXCR2 expression on mature neutrophils and CX3CR1 on monocytes were independently considered. Follow-up studies focusing on a detailed analysis of circulating innate immune cell subsets and their migratory properties present in the BME pre- and post-transplantation of treated and treatment-naïve patients would provide additional information regarding the evolving dynamics of myeloid cell populations in MM. Assessment of the immunosuppressive capacity of individual myeloid populations and their relationship to neoplastic plasma cells in the bone marrow would provide further insight into the biological and functional consequences of the dysregulated MM2 (CD64 high) phenotype. In this study, we did not observe any statistically significant differences between MM1 and MM2 phenotypic features in relation to the treatment status. Longitudinal investigations with serial samples collected before, during, and after treatment are warranted to closely evaluate the predictive value of markers of myeloid dysregulation in MM and associated precancerous conditions.
The novel myeloid phenotype described here improves our understanding of the phenotypic and functional changes of neutrophils, monocytes, and eosinophils in MM patients. The results of this study highlight the importance of myeloid cell subsets as a parameter in the assessment and clinical monitoring of advanced-stage disease progression in MM and open new possibilities for the design of innovative therapeutic approaches.
The original contributions presented in the study are included in the article/Supplementary Material. Further inquiries can be directed to the corresponding author.
The studies involving human participants were reviewed and approved by Institutional Review Board of the University of Alabama at Birmingham. The patients/participants provided their written informed consent to participate in this study.
Contribution: KO and ZH conceived, designed, and planned the experiments. KO, ZH, and EB coordinated the study, interpreted the data, and wrote the manuscript. KP and EB identified and recruited patients. EB, KP, and HC reviewed and provided clinical information for the study. KO, MD, AC, HP, and VK performed whole blood and PBMC processing for analysis of samples and contributed to antibody panel design. KO, MD, CF, and HP performed the ELISA studies and cytokine analyses. KO performed functional assays, Ki67 staining, and flow cytometry analysis. KO and EB analyzed clinical data and performed statistical analyses. All authors contributed to the article and approved the submitted version.
This work was supported by the National Institutes of Health (R01HL129878 and R01DK108353, ZH; U01CA249955 and R01CA186646, EB). The content is solely the responsibility of the authors and does not necessarily represent the official views of the National Institutes of Health.
The authors would like to thank the members of the IMAGE study team for assistance with the collection of patient samples and relevant clinical data, the 1917 Clinic at Dewberry for the collection of control samples, and the UAB Rheumatic Disease Core Center (RDCC; supported by NIH grant P30 AR048311) Comprehensive Flow Cytometry Core for their assistance.
The authors declare that the research was conducted in the absence of any commercial or financial relationships that could be construed as a potential conflict of interest.
All claims expressed in this article are solely those of the authors and do not necessarily represent those of their affiliated organizations, or those of the publisher, the editors and the reviewers. Any product that may be evaluated in this article, or claim that may be made by its manufacturer, is not guaranteed or endorsed by the publisher.
The Supplementary Material for this article can be found online at: https://www.frontiersin.org/articles/10.3389/fonc.2022.1074779/full#supplementary-material
1. Rajkumar SV, Dimopoulos MA, Palumbo A, Blade J, Merlini G, Mateos M-V, et al. International myeloma working group updated criteria for the diagnosis of multiple myeloma. Lancet Oncol (2014) 15(12):e538–e48. doi: 10.1016/s1470-2045(14)70442-5
2. Dimopoulos M, Kyle R, Fermand JP, Rajkumar SV, San Miguel J, Chanan-Khan A, et al. Consensus recommendations for standard investigative workup: Report of the international myeloma workshop consensus panel 3. Blood (2011) 117(18):4701–5. doi: 10.1182/blood-2010-10-299529
3. Pratt G, Goodyear O, Moss P. Immunodeficiency and immunotherapy in multiple myeloma. Br J Haematol (2007) 138(5):563–79. doi: 10.1111/j.1365-2141.2007.06705.x
4. Sorrig R, Klausen TW, Salomo M, Vangsted A, Gimsing P. Risk factors for blood stream infections in multiple myeloma: A population-based study of 1154 patients in Denmark. Eur J Haematol (2018) 101(1):21–7. doi: 10.1111/ejh.13066
5. Tete SM, Bijl M, Sahota SS, Bos NA. Immune defects in the risk of infection and response to vaccination in monoclonal gammopathy of undetermined significance and multiple myeloma. Front Immunol (2014) 5:257. doi: 10.3389/fimmu.2014.00257
6. Kristinsson SY, Tang M, Pfeiffer RM, Bjorkholm M, Goldin LR, Blimark C, et al. Monoclonal gammopathy of undetermined significance and risk of infections: A population-based study. Haematologica (2012) 97(6):854–8. doi: 10.3324/haematol.2011.054015
7. Li L, Wang L. Multiple myeloma: What do we do about immunodeficiency? J Cancer (2019) 10(7):1675–84. doi: 10.7150/jca.29993
8. Tamura H. Immunopathogenesis and immunotherapy of multiple myeloma. Int J Hematol (2018) 107(3):278–85. doi: 10.1007/s12185-018-2405-7
9. Romano A, Parrinello NL, Simeon V, Puglisi F, La Cava P, Bellofiore C, et al. High-density neutrophils in mgus and multiple myeloma are dysfunctional and immune-suppressive due to increased Stat3 downstream signaling. Sci Rep (2020) 10(1):1983. doi: 10.1038/s41598-020-58859-x
10. Binsfeld M, Muller J, Lamour V, De Veirman K, De Raeve H, Bellahcène A, et al. Granulocytic myeloid-derived suppressor cells promote angiogenesis in the context of multiple myeloma. Oncotarget (2016) 7(25):37931–43. doi: 10.18632/oncotarget.9270
11. Hsu BE, Tabaries S, Johnson RM, Andrzejewski S, Senecal J, Lehuede C, et al. Immature low-density neutrophils exhibit metabolic flexibility that facilitates breast cancer liver metastasis. Cell Rep (2019) 27(13):3902–15.e6. doi: 10.1016/j.celrep.2019.05.091
12. Casbon A-J, Reynaud D, Park C, Khuc E, Gan DD, Schepers K, et al. Invasive breast cancer reprograms early myeloid differentiation in the bone marrow to generate immunosuppressive neutrophils. Proc Natl Acad Sci (2015) 112(6):E566–E75. doi: 10.1073/pnas.1424927112
13. Veglia F, Perego M, Gabrilovich D. Myeloid-derived suppressor cells coming of age. Nat Immunol (2018) 19(2):108–19. doi: 10.1038/s41590-017-0022-x
14. Sagiv JY, Michaeli J, Assi S, Mishalian I, Kisos H, Levy L, et al. Phenotypic diversity and plasticity in circulating neutrophil subpopulations in cancer. Cell Rep (2015) 10(4):562–73. doi: 10.1016/j.celrep.2014.12.039
15. Condamine T, Dominguez GA, Youn JI, Kossenkov AV, Mony S, Alicea-Torres K, et al. Lectin-type oxidized ldl receptor-1 distinguishes population of human polymorphonuclear myeloid-derived suppressor cells in cancer patients. Sci Immunol (2016) 1(2):aaf8943–aaf8943. doi: 10.1126/sciimmunol.aaf8943
16. Jimenez RV, Kuznetsova V, Connelly AN, Hel Z, Szalai AJ. C-reactive protein promotes the expansion of myeloid derived cells with suppressor functions. Front Immunol (2019) 21:2183. doi: 10.3389/fimmu.2019.02183
17. Vlkova M, Chovancova Z, Nechvatalova J, Connelly AN, Davis MD, Slanina P, et al. Neutrophil and granulocytic myeloid-derived suppressor cell-mediated T cell suppression significantly contributes to immune dysregulation in common variable immunodeficiency disorders. J Immunol (2019) 202(1):93–104. doi: 10.4049/jimmunol.1800102
18. Rundgren IM, Ersvaer E, Ahmed AB, Ryningen A, Bruserud O. Circulating monocyte subsets in multiple myeloma patients receiving autologous stem cell transplantation - a study of the preconditioning status and the course until posttransplant reconstitution for a consecutive group of patients. BMC Immunol (2019) 20(1):39. doi: 10.1186/s12865-019-0323-y
19. Bolzoni M, Ronchetti D, Storti P, Donofrio G, Marchica V, Costa F, et al. Il21r expressing Cd14(+)Cd16(+) monocytes expand in multiple myeloma patients leading to increased osteoclasts. Haematologica (2017) 102(4):773–84. doi: 10.3324/haematol.2016.153841
20. Schultze JL, Mass E, Schlitzer A. Emerging principles in myelopoiesis at homeostasis and during infection and inflammation. Immunity (2019) 50(2):288–301. doi: 10.1016/j.immuni.2019.01.019
21. Jaillon S, Ponzetta A, Di Mitri D, Santoni A, Bonecchi R, Mantovani A. Neutrophil diversity and plasticity in tumour progression and therapy. Nat Rev Cancer (2020) 20(9):485–503. doi: 10.1038/s41568-020-0281-y
22. Ng LG, Ostuni R, Hidalgo A. Heterogeneity of neutrophils. Nat Rev Immunol (2019) 19(4):255–65. doi: 10.1038/s41577-019-0141-8
23. Bowers NL, Helton ES, Huijbregts RP, Goepfert PA, Heath SL, Hel Z. Immune suppression by neutrophils in hiv-1 infection: Role of pd-L1/Pd-1 pathway. PLoS Pathog (2014) 10(3):e1003993. doi: 10.1371/journal.ppat.1003993
24. Quail DF, Amulic B, Aziz M, Barnes BJ, Eruslanov E, Fridlender ZG, et al. Neutrophil phenotypes and functions in cancer: A consensus statement. J Exp Med (2022) 219(6). doi: 10.1084/jem.20220011
25. Nicolás-Ávila JÁ, Adrover JM, Hidalgo A. Neutrophils in homeostasis, immunity, and cancer. Immunity (2017) 46(1):15–28. doi: 10.1016/j.immuni.2016.12.012
26. de Kleijn S, Langereis JD, Leentjens J, Kox M, Netea MG, Koenderman L, et al. Ifn-Gamma-Stimulated neutrophils suppress lymphocyte proliferation through expression of pd-L1. PLoS One (2013) 8(8):e72249. doi: 10.1371/journal.pone.0072249
27. Puglisi F, Parrinello NL, Giallongo C, Cambria D, Camiolo G, Bellofiore C, et al. Plasticity of high-density neutrophils in multiple myeloma is associated with increased autophagy Via Stat3. Int J Mol Sci (2019) 20(14):3548. doi: 10.3390/ijms20143548
28. Favaloro J, Liyadipitiya T, Brown R, Yang S, Suen H, Woodland N, et al. Myeloid derived suppressor cells are numerically, functionally and phenotypically different in patients with multiple myeloma. Leuk Lymphoma (2014) 55(12):2893–900. doi: 10.3109/10428194.2014.904511
29. Görgün GT, Whitehill G, Anderson JL, Hideshima T, Maguire C, Laubach J, et al. Tumor-promoting immune-suppressive myeloid-derived suppressor cells in the multiple myeloma microenvironment in humans. Blood J Am Soc Hematol (2013) 121(15):2975–87. doi: 10.1182/blood-2012-08-448548
30. Romano A, Parrinello NL, La Cava P, Tibullo D, Giallongo C, Camiolo G, et al. Pmn-mdsc and arginase are increased in myeloma and may contribute to resistance to therapy. Expert Rev Mol Diagn (2018) 18(7):675–83. doi: 10.1080/14737159.2018.1470929
31. Perez C, Botta C, Zabaleta A, Puig N, Cedena M-T, Goicoechea I, et al. Immunogenomic identification and characterization of granulocytic myeloid-derived suppressor cells in multiple myeloma. Blood (2020) 136(2):199–209. doi: 10.1182/blood.2019004537
32. Giallongo C, Tibullo D, Parrinello NL, La Cava P, Di Rosa M, Bramanti V, et al. Granulocyte-like myeloid derived suppressor cells (G-mdsc) are increased in multiple myeloma and are driven by dysfunctional mesenchymal stem cells (Msc). Oncotarget (2016) 7(52):85764. doi: 10.18632/oncotarget.7969
33. Ramachandran IR, Condamine T, Lin C, Herlihy SE, Garfall A, Vogl DT, et al. Bone marrow pmn-mdscs and neutrophils are functionally similar in protection of multiple myeloma from chemotherapy. Cancer Lett (2016) 371(1):117–24. doi: 10.1016/j.canlet.2015.10.040
34. Ramachandran IR, Martner A, Pisklakova A, Condamine T, Chase T, Vogl T, et al. Myeloid-derived suppressor cells regulate growth of multiple myeloma by inhibiting T cells in bone marrow. J Immunol (2013) 190(7):3815–23. doi: 10.4049/jimmunol.1203373
35. Romano A, Laura Parrinello N, Cerchione C, Letizia Consoli M, Parisi M, Calafiore V, et al. The nlr and lmr ratio in newly diagnosed mm patients treated upfront with novel agents. Blood Cancer J (2017) 7(12):1–3. doi: 10.1038/s41408-017-0019-6
36. Solmaz Medeni S, Acar C, Olgun A, Acar A, Seyhanlı A, Taskıran E, et al. Can neutrophil-to-Lymphocyte ratio, monocyte-to-Lymphocyte ratio, and platelet-to-Lymphocyte ratio at day+ 100 be used as a prognostic marker in multiple myeloma patients with autologous transplantation? Clin Transplant (2018) 32(9):e13359. doi: 0.1111/ctr.13359
37. Lee G-W, Park SW, Go S-I, Kim H-G, Kim MK, Min C-K, et al. The derived neutrophil-to-Lymphocyte ratio is an independent prognostic factor in transplantation ineligible patients with multiple myeloma. Acta Haematologica (2018) 140(3):146–56. doi: 10.1159/000490488
38. Scavelli C, Nico B, Cirulli T, Ria R, Di Pietro G, Mangieri D, et al. Vasculogenic mimicry by bone marrow macrophages in patients with multiple myeloma. Oncogene (2008) 27(5):663–74. doi: 10.1038/sj.onc.1210691
39. VanValkenburg ME, Pruitt GI, Brill IK, Costa L, Ehtsham M, Justement IT, et al. Family history of hematologic malignancies and risk of multiple myeloma: Differences by race and clinical features. Cancer Causes Control (2016) 27(1):81–91. doi: 10.1007/s10552-015-0685-2
40. Durie BG, Salmon SE. A clinical staging system for multiple myeloma. correlation of measured myeloma cell mass with presenting clinical features, response to treatment, and survival. Cancer cytopathology (1975) 36(3):842–54. doi: 10.1002/1097-0142(197509)36:3<842::aid-cncr2820360303>3.0.co;2-u
41. Connelly AN, Huijbregts RPH, Pal HC, Kuznetsova V, Davis MD, Ong KL, et al. Optimization of methods for the accurate characterization of whole blood neutrophils. Sci Rep (2022) 12(1):3667. doi: 10.1038/s41598-022-07455-2
42. Elghetany MT. Surface antigen changes during normal neutrophilic development: A critical review. Blood Cells Molecules Dis (2002) 28(2):260–74. doi: 10.1006/bcmd.2002.0513
43. Kerst JM, van de Winkel JG, Evans AH, de Haas M, Slaper-Cortenbach IC, de Wit TP, et al. Granulocyte colony-stimulating factor induces hfc gamma ri (Cd64 antigen)-positive neutrophils Via an effect on myeloid precursor cells. Blood (1993) 81(6):1457–64. doi: 10.1182/blood.V81.6.1457.1457
44. Marvel D, Gabrilovich DI. Myeloid-derived suppressor cells in the tumor microenvironment: Expect the unexpected. J Clin Invest (2015) 125(9):3356–64. doi: 10.1172/jci80005
45. Ivetic A, Hoskins Green HL, Hart SJ. L-selectin: A major regulator of leukocyte adhesion, migration and signaling. Front Immunol (2019) 10:1068. doi: 10.3389/fimmu.2019.01068
46. Snyder KM, McAloney CA, Montel JS, Modiano JF, Walcheck B. Ectodomain shedding by Adam17 (a disintegrin and metalloproteinase 17) in canine neutrophils. Vet Immunol Immunopathol (2021) 231:110162. doi: 10.1016/j.vetimm.2020.110162
47. Landsberger M, Zhou J, Wilk S, Thaumuller C, Pavlovic D, Otto M, et al. Inhibition of lectin-like oxidized low-density lipoprotein receptor-1 reduces leukocyte adhesion within the intestinal microcirculation in experimental endotoxemia in rats. Crit Care (2010) 14(6):R223. doi: 10.1186/cc9367
48. Berg M, James SP. Human neutrophils release the leu-8 lymph node homing receptor during cell activation. Blood (1990) 76(11):2381–8. doi: 10.1182/blood.V76.11.2381.2381
49. Ekstedt S, Safholm J, Georen SK, Cardell LO. Dividing neutrophils in subsets reveals a significant role for activated neutrophils in the development of airway hyperreactivity. Clin Exp Allergy (2019) 49(3):285–91. doi: 10.1111/cea.13311
50. Cassatella MA, Ostberg NK, Tamassia N, Soehnlein O. Biological roles of neutrophil-derived granule proteins and cytokines. Trends Immunol (2019) 40(7):648–64. doi: 10.1016/j.it.2019.05.003
51. Borregaard N, Cowland JB. Granules of the human neutrophilic polymorphonuclear leukocyte. Blood (1997) 89(10):3503–21. doi: 10.1182/blood.V89.10.3503
52. Mistry P, Nakabo S, O'Neil L, Goel RR, Jiang K, Carmona-Rivera C, et al. Transcriptomic, epigenetic, and functional analyses implicate neutrophil diversity in the pathogenesis of systemic lupus erythematosus. Proc Natl Acad Sci U.S.A. (2019) 116(50):25222–8. doi: 10.1073/pnas.1908576116
53. Fujimoto H, Sakata T, Hamaguchi Y, Shiga S, Tohyama K, Ichiyama S, et al. Flow cytometric method for enumeration and classification of reactive immature granulocyte populations. Cytometry (2000) 42(6):371–8. doi: 10.1002/1097-0320(20001215)42:6<371::AID-CYTO1004>3.0.CO;2-G
54. Dinh HQ, Eggert T, Meyer MA, Zhu YP, Olingy CE, Llewellyn R, et al. Coexpression of Cd71 and Cd117 identifies an early unipotent neutrophil progenitor population in human bone marrow. Immunity (2020) 53(2):319–34.e6. doi: 10.1016/j.immuni.2020.07.017
55. Zhu YP, Padgett L, Dinh HQ, Marcovecchio P, Blatchley A, Wu R, et al. Identification of an early unipotent neutrophil progenitor with pro-tumoral activity in mouse and human bone marrow. Cell Rep (2018) 24(9):2329–41.e8. doi: 10.1016/j.celrep.2018.07.097
56. Brandau S, Trellakis S, Bruderek K, Schmaltz D, Steller G, Elian M, et al. Myeloid-derived suppressor cells in the peripheral blood of cancer patients contain a subset of immature neutrophils with impaired migratory properties. J Leukoc Biol (2011) 89(2):311–7. doi: 10.1189/jlb.0310162
57. Lund-Johansen F, Terstappen LWΜM. Differential surface expression of cell adhesion molecules during granulocyte maturation. J Leukocyte Biol (1993) 54(1):47–55. doi: 10.1002/jlb.54.1.47
58. Hacbarth E, Kajdacsy-Balla A. Low density neutrophils in patients with systemic lupus erythematosus, rheumatoid arthritis, and acute rheumatic fever. Arthritis Rheumatism (1986) 29(11):1334–42. doi: 10.1002/art.1780291105
59. Rice CM, Davies LC, Subleski JJ, Maio N, Gonzalez-Cotto M, Andrews C, et al. Tumour-elicited neutrophils engage mitochondrial metabolism to circumvent nutrient limitations and maintain immune suppression. Nat Commun (2018) 9(1):5099. doi: 10.1038/s41467-018-07505-2
60. Passlick B, Flieger D, Ziegler-Heitbrock HW. Identification and characterization of a novel monocyte subpopulation in human peripheral blood. Blood (1989) 74(7):2527–34. doi: 10.1182/blood.V74.7.2527.2527
61. Geissmann F, Jung S, Littman DR. Blood monocytes consist of two principal subsets with distinct migratory properties. Immunity (2003) 19(1):71–82. doi: 10.1016/S1074-7613(03)00174-2
62. Calcinotto A, Brevi A, Chesi M, Ferrarese R, Garcia Perez L, Grioni M, et al. Microbiota-driven interleukin-17-Producing cells and eosinophils synergize to accelerate multiple myeloma progression. Nat Commun (2018) 9(1):4832. doi: 10.1038/s41467-018-07305-8
63. Cugno M, Marzano AV, Lorini M, Carbonelli V, Tedeschi A. Enhanced tissue factor expression by blood eosinophils from patients with hypereosinophilia: A possible link with thrombosis. PLoS One (2014) 9(11):e111862. doi: 10.1371/journal.pone.0111862
64. Yoon J, Terada A, Kita H. Cd66b regulates adhesion and activation of human eosinophils. J Immunol (2007) 179(12):8454. doi: 10.4049/jimmunol.179.12.8454
65. Shive CL, Jiang W, Anthony DD, Lederman MM. Soluble Cd14 is a nonspecific marker of monocyte activation. AIDS (2015) 29(10):1263–5. doi: 10.1097/QAD.0000000000000735
66. Andersen MN, Abildgaard N, Maniecki MB, Moller HJ, Andersen NF. Monocyte/Macrophage-derived soluble Cd163: A novel biomarker in multiple myeloma. Eur J Haematol (2014) 93(1):41–7. doi: 10.1111/ejh.12296
67. Hel Z, Xu J, Denning WL, Helton ES, Huijbregts RP, Heath SL, et al. Dysregulation of systemic and mucosal humoral responses to microbial and food antigens as a factor contributing to microbial translocation and chronic inflammation in hiv-1 infection. PLoS Pathog (2017) 13(1):e1006087. doi: 10.1371/journal.ppat.1006087
68. Litzman J, Nechvátalová J, Xu J, Tichá O, Vlková M, Hel Z. Chronic immune activation in common variable immunodeficiency (Cvid) is associated with elevated serum levels of soluble Cd14 and Cd25 but not endotoxaemia. Clin Exp Immunol (2012) 170(3):321–32. doi: 10.1111/j.1365-2249.2012.04655.x
69. Khoury HJ, Loberiza FR Jr., Ringden O, Barrett AJ, Bolwell BJ, Cahn JY, et al. Impact of posttransplantation G-csf on outcomes of allogeneic hematopoietic stem cell transplantation. Blood (2006) 107(4):1712–6. doi: 10.1182/blood-2005-07-2661
70. Repp R, Valerius T, Sendler A, Gramatzki M, Iro H, Kalden J, et al. Neutrophils express the high affinity receptor for igg (Fc gamma ri, Cd64) after in vivo application of recombinant human granulocyte colony- stimulating factor. Blood (1991) 78(4):885–9. doi: 10.1182/blood.V78.4.885.885
71. Fjaertoft G, Douhan Håkansson L, Pauksens K, Sisask G, Venge P. Neutrophil Cd64 (Fcγri) expression is a specific marker of bacterial infection: A study on the kinetics and the impact of major surgery. Scandinavian J Infect Dis (2007) 39(6-7):525–35. doi: 10.1080/00365540601113693
72. Wang J, De Veirman K, De Beule N, Maes K, De Bruyne E, Van Valckenborgh E, et al. The bone marrow microenvironment enhances multiple myeloma progression by exosome-mediated activation of myeloid-derived suppressor cells. Oncotarget (2015) 6(41):43992. doi: 10.18632/oncotarget.6083
73. Alvarez R, Oliver L, Valdes A, Mesa C. Cancer-induced systemic myeloid dysfunction: Implications for treatment and a novel nanoparticle approach for its correction. Semin Oncol (2018) 45(1-2):84–94. doi: 10.1053/j.seminoncol.2018.05.001
74. Tcyganov E, Mastio J, Chen E, Gabrilovich DI. Plasticity of myeloid-derived suppressor cells in cancer. Curr Opin Immunol (2018) 51:76–82. doi: 10.1016/j.coi.2018.03.009
75. Ohsaka A, Saionji K, Takagi S, Igari J. Increased expression of the high-affinity receptor for igg (Fcri, Cd64) on neutrophils in multiple myeloma. Hematopathology Mol Hematol (1996) 10:151–60.
76. Hirsh M, Mahamid E, Bashenko Y, Hirsh I, Krausz MM. Overexpression of the high-affinity fcgamma receptor (Cd64) is associated with leukocyte dysfunction in sepsis. Shock (Augusta Ga) (2001) 16(2):102–8. doi: 10.1097/00024382-200116020-00003
77. Groselj-Grenc M, Ihan A, Derganc M. Neutrophil and monocyte Cd64 and Cd163 expression in critically ill neonates and children with sepsis: Comparison of fluorescence intensities and calculated indexes. Mediators Inflammation (2008) 2008:202646. doi: 10.1155/2008/202646
78. Honeychurch J, Tutt AL, Valerius T, Heijnen IAFM, Van de Winkel JGJ, Glennie MJ. Therapeutic efficacy of Fcγri/Cd64-directed bispecific antibodies in b-cell lymphoma. Blood (2000) 96(10):3544–52. doi: 10.1182/blood.V96.10.3544
79. Veglia F, Sanseviero E, Gabrilovich DI. Myeloid-derived suppressor cells in the era of increasing myeloid cell diversity. Nat Rev Immunol (2021) 21:485–98. doi: 10.1038/s41577-020-00490-y
80. Hsu BE, Roy J, Mouhanna J, Rayes RF, Ramsay L, Tabariès S, et al. C3a elicits unique migratory responses in immature low-density neutrophils. Oncogene (2020) 39(12):2612–23. doi: 10.1038/s41388-020-1169-8
81. Beyer M, Kochanek M, Giese T, Endl E, Weihrauch MR, Knolle PA, et al. In vivo peripheral expansion of naive Cd4+Cd25high Foxp3+ regulatory T cells in patients with multiple myeloma. Blood (2006) 107(10):3940–9. doi: 10.1182/blood-2005-09-3671
82. Zhang S, Ma X, Zhu C, Liu L, Wang G, Yuan X. The role of myeloid-derived suppressor cells in patients with solid tumors: A meta-analysis. PLoS One (2016) 11(10):e0164514. doi: 10.1371/journal.pone.0164514
83. Bolomsky A, Schreder M, Hübl W, Zojer N, Hilbe W, Ludwig H. Monokine induced by interferon gamma (Mig/Cxcl9) is an independent prognostic factor in newly diagnosed myeloma. Leukemia Lymphoma (2016) 57(11):2516–25. doi: 10.3109/10428194.2016.1151511
84. Pellegrino A, Antonaci F, Russo F, Merchionne F, Ribatti D, Vacca A, et al. Cxcr3-binding chemokines in multiple myeloma. Cancer Lett (2004) 207(2):221–7. doi: 10.1016/j.canlet.2003.10.036
85. Ponzetta A, Benigni G, Antonangeli F, Sciumè G, Sanseviero E, Zingoni A, et al. Multiple myeloma impairs bone marrow localization of effector natural killer cells by altering the chemokine microenvironment. Cancer Res (2015) 75(22):4766–77. doi: 10.1158/0008-5472.CAN-15-1320
86. Bonanni V, Antonangeli F, Santoni A, Bernardini G. Targeting of Cxcr3 improves anti-myeloma efficacy of adoptively transferred activated natural killer cells. J immunotherapy Cancer (2019) 7(1):1–16. doi: 10.1186/s40425-019-0751-5
87. Petitprez V, Royer B, Desoutter J, Guiheneuf E, Rigolle A, Marolleau JP, et al. Cd14+ Cd16+ monocytes rather than Cd14+ Cd51/61+ monocytes are a potential cytological marker of circulating osteoclast precursors in multiple myeloma. A Preliminary Study. Int J Lab Hematol (2015) 37(1):29–35. doi: 10.1111/ijlh.12216
88. Driscoll J, Aslam I, Malek E. Eosinophils upregulate pd-L1 and pd-L2 expression to enhance the immunosuppressive microenvironment in multiple myeloma. Blood (2017) 130(Supplement 1):4417–. doi: 10.1182/blood.V130.Suppl_1.4417.4417
89. Fulkerson PC, Fischetti CA, McBride ML, Hassman LM, Hogan SP, Rothenberg ME. A central regulatory role for eosinophils and the Eotaxin/Ccr3 axis in chronic experimental allergic airway inflammation. Proc Natl Acad Sci (2006) 103(44):16418. doi: 10.1073/pnas.0607863103
Keywords: multiple myeloma, myelopoiesis, cancer, granulocyte, neutrophil, monocyte, immune dysregulation
Citation: Ong KL, Davis MD, Purnell KK, Cutshall H, Pal HC, Connelly AN, Fay CX, Kuznetsova V, Brown EE and Hel Z (2023) Distinct phenotype of neutrophil, monocyte, and eosinophil populations indicates altered myelopoiesis in a subset of patients with multiple myeloma. Front. Oncol. 12:1074779. doi: 10.3389/fonc.2022.1074779
Received: 19 October 2022; Accepted: 09 December 2022;
Published: 17 January 2023.
Edited by:
Sabrina Manni, University of Padua, ItalyReviewed by:
Gwendal Lazennec, UMR9005 Modélisation et ingénierie des systèmes complexes biologiques pour le diagnostic (Sys2Diag), FranceCopyright © 2023 Ong, Davis, Purnell, Cutshall, Pal, Connelly, Fay, Kuznetsova, Brown and Hel. This is an open-access article distributed under the terms of the Creative Commons Attribution License (CC BY). The use, distribution or reproduction in other forums is permitted, provided the original author(s) and the copyright owner(s) are credited and that the original publication in this journal is cited, in accordance with accepted academic practice. No use, distribution or reproduction is permitted which does not comply with these terms.
*Correspondence: Zdenek Hel, emRlbmVraGVsQHVhYm1jLmVkdQ==
Disclaimer: All claims expressed in this article are solely those of the authors and do not necessarily represent those of their affiliated organizations, or those of the publisher, the editors and the reviewers. Any product that may be evaluated in this article or claim that may be made by its manufacturer is not guaranteed or endorsed by the publisher.
Research integrity at Frontiers
Learn more about the work of our research integrity team to safeguard the quality of each article we publish.