
95% of researchers rate our articles as excellent or good
Learn more about the work of our research integrity team to safeguard the quality of each article we publish.
Find out more
ORIGINAL RESEARCH article
Front. Oncol. , 19 January 2023
Sec. Cancer Imaging and Image-directed Interventions
Volume 12 - 2022 | https://doi.org/10.3389/fonc.2022.1068231
 Yue Zhao1,2†
 Xiaoliang Tan3†Jingmu Chen3Hongweng Tan3Huasheng Huang3Peng Luo3Yongsheng Liang3Xinqing Jiang1,2*
Objectives: To explore the value of T1 mapping on gadoxetic acid-enhanced magnetic resonance imaging (MRI) in preoperative predicting cytokeratin 19 (CK19) expression for hepatocellular carcinoma (HCC).
Methods: This retrospective study included 158 patients from two institutions with surgically resected treatment-native solitary HCC who underwent preoperative T1 mapping on gadoxetic acid-enhanced MRI. Patients from institution I (n = 102) and institution II (n = 56) were assigned to training and test sets, respectively. univariable and multivariable logistic regression analyses were performed to investigate the association of clinicoradiological variables with CK19. The receiver operating characteristic (ROC) curve and precision-recall (PR) curve were used to evaluate the performance for CK19 prediction. Then, a prediction nomogram was developed for CK19 expression. The performance of the prediction nomogram was evaluated by its discrimination, calibration, and clinical utility.
Results: Multivariable logistic regression analysis showed that AFP>400ng/ml (OR=4.607, 95%CI: 1.098-19.326; p=0.037), relative apparent diffusion coefficient (rADC)≤0.71 (OR=3.450, 95%CI: 1.126-10.567; p=0.030), T1 relaxation time in the 20-minute hepatobiliary phase (T1rt-HBP)>797msec (OR=4.509, 95%CI: 1.301-15.626; p=0.018) were significant independent predictors of CK19 expression. The clinical-quantitative model (CQ-Model) constructed based on these significant variables had the best predictive performance with an area under the ROC curve of 0.844, an area under the PR curve of 0.785 and an F1 score of 0.778. The nomogram constructed based on CQ-Model demonstrated satisfactory performance with C index of 0.844 (95%CI: 0.759-0.908) and 0.818 (95%CI: 0.693-0.902) in the training and test sets, respectively.
Conclusions: T1 mapping on gadoxetic acid-enhanced MRI has good predictive efficacy for preoperative prediction of CK19 expression in HCC, which can promote the individualized risk stratification and further treatment decision of HCC patients.
Hepatocellular carcinoma (HCC) is the third most common cause of cancer-related death worldwide, with an increasing incidence and mortality in the past 20 years (1). Although the prognosis of patients with HCC has improved with advances in surgical and imaging technology, the high rates of intrahepatic recurrence after hepatectomy still remain a major challenge for treatment of HCC, and two thirds of recurrences are within 5 years (2, 3). Recurrence after hepatectomy may be associated with the degree of differentiation, microvascular invasion, satellite focus and related gene expression, among which cytokeratin 19 (CK19) expression is considered to be an important influencing factor (4).
CK19 is well acknowledged as a biliary/progenitor cell marker and a tumor stem cell marker, and plays an important role in promoting malignant property of HCC (5). Compared with patients with CK19-negative HCCs, CK19-positive HCCs is associated with clinical aggressiveness due to more tumor invasion, higher rate of lymph node metastasis intrahepatic recurrence, and poorer prognosis after resection and liver transplantation (6, 7). Therefore, understanding CK19 expression status of HCC at diagnosis can be significant for better clinical decision making and improved prognosis. However, since CK19 expression status can only be diagnosed histologically (8), its use as a prognostic indicator for treatment allocation is limited.
Several studies have assessed the imaging findings associated with poor prognosis for CK19-positive HCCs. For instance, irregular tumor margin, rim arterial phase hyperenhancement, lower tumor-to-liver apparent diffusion coefficient (ADC) ratio, and lower tumor-to-liver signal intensity (SI) ratio at hepatobiliary phase (HBP) imaging are considered to be significant independent variables for potentially predicting CK19-positive HCCs (9–11). Radiomics can extract a large number of high-dimensional quantitative features from multimodal medical images, and then reveal the correlation between these features and the diagnosis, pathology, and prognosis of the tumor (12). Recently, studies have used radiomics based on MRI to predict CK19 in HCCs (13–16). Radiomics has progressed quite significantly, but the following problems remain. First, accurate image segmentation relies on manual delineation, which is time-consuming and easily affected by the operator. Second, the different designs of the image features can lead to different analytic results (17, 18). Unlike traditional radiomics, Deep learning (DL) models are capable of automatic learning, extracting, and selecting image features for prediction, and thereby can more comprehensively and profoundly excavate information from images. Chen Y et al. (19) fully utilized the image information including intratumoral and peritumoral regions of the hepatic lesions through a DL algorithm, providing more valuable relevant information for better prediction of CK19 expression. Although DL-based model is a promising approach, there are still some problems in the application, such as the black box problem, non-transparency of decision-making, and difficulty in interpretation from the clinical aspect (20). Thus, a feasible and quantitative method is urgently needed to predict CK19 expression in HCC patients. T1 mapping is a non-invasive method for quantitative analysis of T1 value in tissues. It reflects the intrinsic characteristics of tissues and is not affected by scanning sequence parameters (21). Moreover, it is positively proportional to the concentration of gadolinium contrast agent in tissues, and can more accurately and objectively reflect the uptake of gadoxetic acid (22). To our knowledge, the quantitative evaluation of CK19 expression of HCC using T1 mapping has not been reported. Therefore, the purpose of this study was to preoperatively identify CK19 expression status of HCC by T1 mapping on gadoxetic acid-enhanced MRI.
This study was a retrospective study, which was approved by the hospital ethics Committee, and patients were exempted from signing informed consent. The flow chart of data collection and research design is shown in Figure 1. We retrospectively collected patients from Zhanjiang Central People’s Hospital (Institution I) and Guangzhou First People’s Hospital (Institution II). Inclusion criteria were as follows (1): Single HCC was pathologically diagnosed after hepatectomy and immunohistochemical examination of CK19 was performed (2); Gadoxetic acid-enhanced MRI examination was performed within 2 weeks before surgery, including T1 mapping in the pre-enhanced and 20-minute hepatobiliary phase (HBP) after gadoxetic acid injection (3); Complete clinical and pathologic data. Exclusion criteria were as follows (1): administration of other preoperative antitumor therapies, such as radiofrequency ablation, transcatheter arterial chemoembolization (TACE), etc. (2); more than one tumor or having satellite nodules (3); presence of macrovascular invasion or extrahepatic spreading (4); unrecorded pathologic findings of CK19 (5); suboptimal MR image quality for interpretation. MR images of 102 patients from institution I were used as the training set to establish prediction models to predict CK19 expression in HCC. The predictive performances of models were evaluated by test sets (56 cases from institution II).
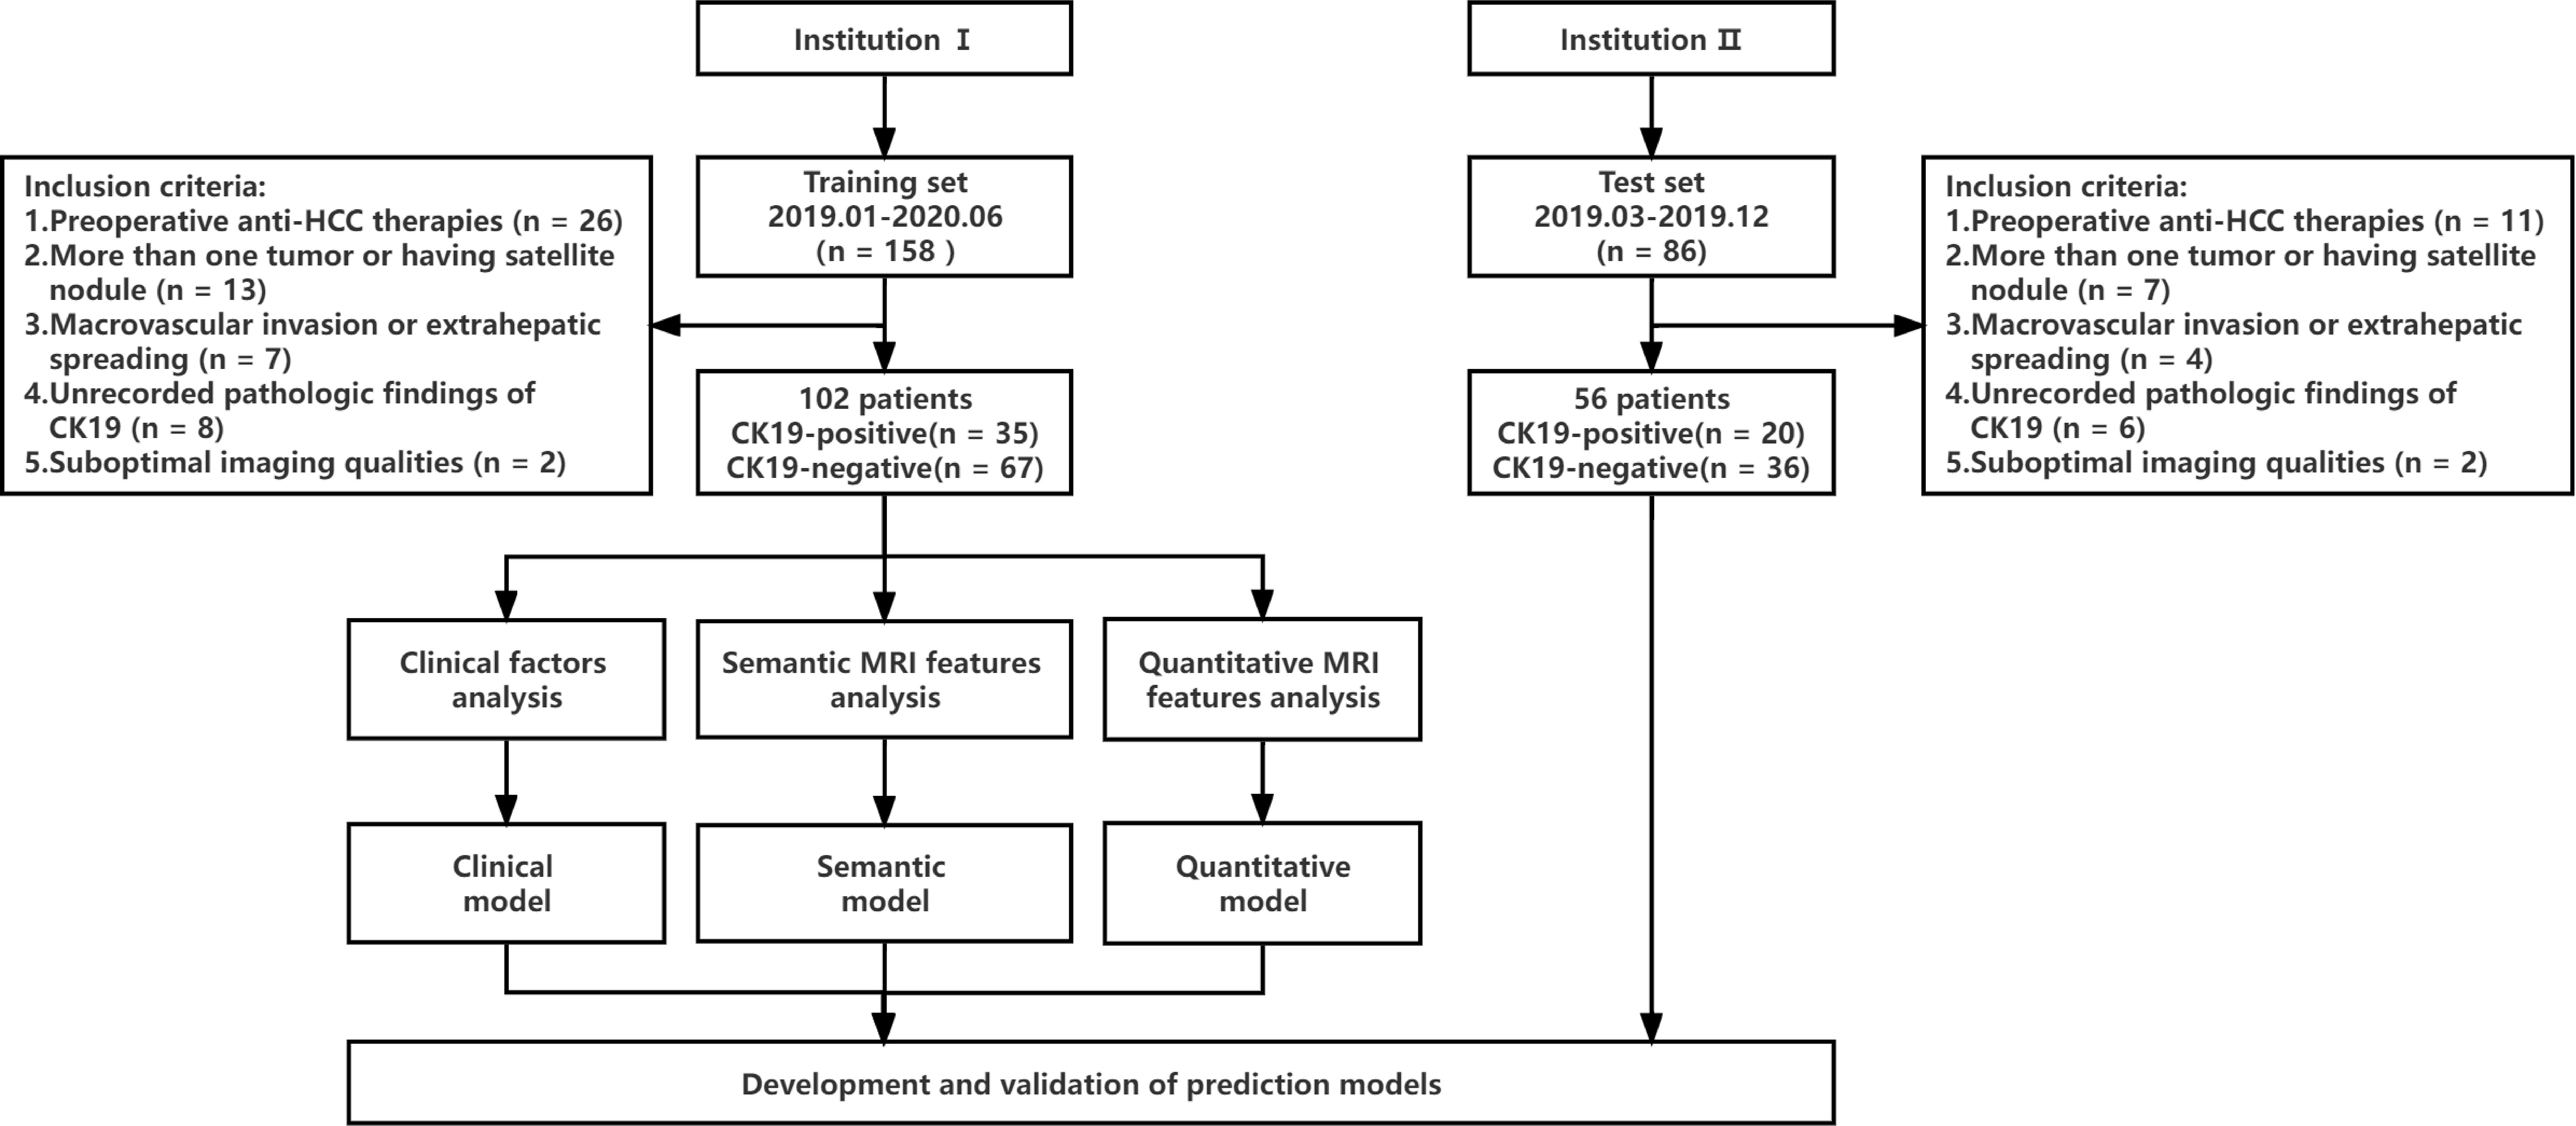
Figure 1 Study flowchart. CK19, Cytokeratin 19; HCC, hepatocellular carcinoma.
Preoperative laboratory indicators included Alpha Fetoprotein (AFP), Alanine aminotransferase (ALT), Aspartate aminotransferase (AST), Glutamyl transpeptidase (GGT), Alkaline phosphatase (ALP), Albumin (ALB), Total bilirubin (TBIL), Direct bilirubin (DBIL), Serum creatinine (Scr), Prothrombin time (PT) and International Normalized ratio (INR), Neutrophils to lymphocyte ratio (NLR), Platelet to lymphocyte ratio (PLR).
The diagnostic criteria for HCC were based on morphological criteria defined by the World Health Organization. The expression of CK19 was semiquantitatively evaluated by immunochemical staining. The hepatocytes and bile ducts of normal liver tissues were used as negative and positive controls, respectively. Tumors were classified as negative (<5% of tumor cells) or positive (≥5% of tumor cells) for CK19 by an experienced pathologist who was blinded to clinical and imaging information.
MRI examinations in all patients from institution I and institution II were performed using a 1.5T (Magnetom Aera; Siemens Healthcare) and 3.0T (Magnetom Trio A Tim; Siemens Healthcare) MR scanner, respectively. The scanning range covered from the top to the lower edge of the liver with an 8-channel phased-array coil as the receiver coil. Gadoxetic acid-enhanced MRI was obtained including the pre-enhanced, enhanced arterial phase (AP, 20–40s), portal phase (PVP, 50–70s), equilibrium phase (EP, 100–120s), and 20min HBP images. Gadoxetic acid (Primovist; Bayer Schering Pharma, Berlin, Germany) was injected into the cubital vein at a flow rate of 1.0 ml/s and a dose of 0.025 mmol/kg, followed by 20 ml of normal saline for flushing. A more detailed description of the MRI methods and specific sequences and parameters of MRI scans are shown in Supplementary Materials 1.1 and Table S1.
Preoperative MRI images were retrospectively analyzed on the Picture Archiving and Communication System (PACS). The semantic and quantitative MRI features were evaluated by two abdominal radiologists independently (reader 1 [TAN XL] and reader 2 [CHEN JM] both with 6 years of experience in liver imaging) who were blinded to the patients’ clinical and pathologic information. Discrepancies in semantic features were resolved by consensus after reevaluating the images. Quantitative characteristics were obtained by averaging the estimates of two readers. One reader [TAN XL] repeated the assessment in the same manner after 2 weeks to minimize the memory effect to evaluate intraobserver agreement. The intra- and inter-class correlation coefficients (ICCs) were calculated to measure the intra- and inter-rater reproducibility of semantic and quantitative characteristics, respectively.
Semantic MRI features include 1) Tumor margin; 2) Hemorrhage; 3) Necrosis; 4) Fat component; 5) Target sign; 6) Washout; 7) Rim Arterial phase hyperenhancement (rim APHE); 8) Corona enhancement; 9) Intratumoralarteries; 10) Radiologic capsule; 11) Peritumoral hypointensity on HBP. A detailed description of semantic MRI features is provided in Supplementary Material 1.2. All quantitative measurements were performed manually on the PACS. The region of interest (ROI) was placed as far as possible in the area with obvious enhancement of lesion to avoid necrosis, hemorrhage, fat and artifacts. The area of ROI was about 1.0~1.5 cm2; the same lesion was measured three times with the same ROI, and then average amounts were calculated. The signal intensity (SI) of tumor and surrounding normal liver parenchyma were measured at Pre, AP, PVP, EP and HBP images respectively, and then the tumor to liver contrast ratio (TLR) was calculated. Additionally, ADC values of the lesion and surrounding normal liver parenchyma were measured on the ADC images, and tumor-to-liver ADC values were calculated (recorded as relative ADC, rADC); precontrast and postcontrast T1 relaxation time were measured before and 20 minutes after the administration of the contrast medium (recorded as T1rt-Pre and T1rt-HBP, respectively), and reduction rate of T1 relaxation time (rrT1rt) was calculated. The description and formulas of quantitative parameters are detailed in the Supplemental Materials 1.2.
All HCC patients were regularly monitored for recurrence via CT or MRI once every 3 months for 2 years after resection. The recurrence status included new intrahepatic lesions and/or extrahepatic metastasis and the criteria were as follows: 1) new intrahepatic lesions with typical imaging features of HCC, or confirmed by histopathology, or with tumor stain during postoperative TACE; 2) extrahepatic metastasis confirmed by typical imaging features or histopathological analysis.
A Student t-test (mean ± standard deviation) or Wilcoxon rank-sum test (median, P25 ~ P75) was performed for continuous variables. The categorical variables were compared by χ2. The ICCs of quantitative data between the two observers was calculated. Spearman coefficient was used for correlation analysis between quantitative parameters and CK19 status. Multivariable logistic regression analyses were performed to identify the independent predictors of CK19-positive HCCs. Akaike Information Criterion (AIC) was used to determine the optimal prediction model. The receiver operator characteristic (ROC) curve was used to evaluate the performance of predicting the expression of CK19. The comparison of different area under ROC (AUROC) curves was conducted by DeLong’s test. In view of the imbalance between the patients with CK19-negative HCCs and those with CK19-positive HCCs, we further used the F1 score and the area under the precision-recall curve (AUPRC) to compare performances, as these methods are more informative in the evaluation of binary classifiers on imbalanced data sets. Calibration curve was used to assess the consistency of nomogram. Decision Curve Analysis (DCA) was used to evaluate the clinical utility of nomogram by quantifying the net benefit under different threshold probabilities. R software (version 3.4.1) was used for analysis. All differences were considered statistically significant with a p value of <0.05.
A total of 102 patients from institution I were included in this study, including 35 CK19-positive HCCs and 67 CK19-negative HCCs. 56 patients from institution II were included, among which 20 were positive and 36 were negative regarding CK19 expression. The distribution of clinicopathological features in the training and test sets is shown in Table 1. The results of univariable analysis of clinical factors in the training set showed that AFP and NLR were significant variables associated with CK19 expression (P<0.05, Supplementary Table S2).
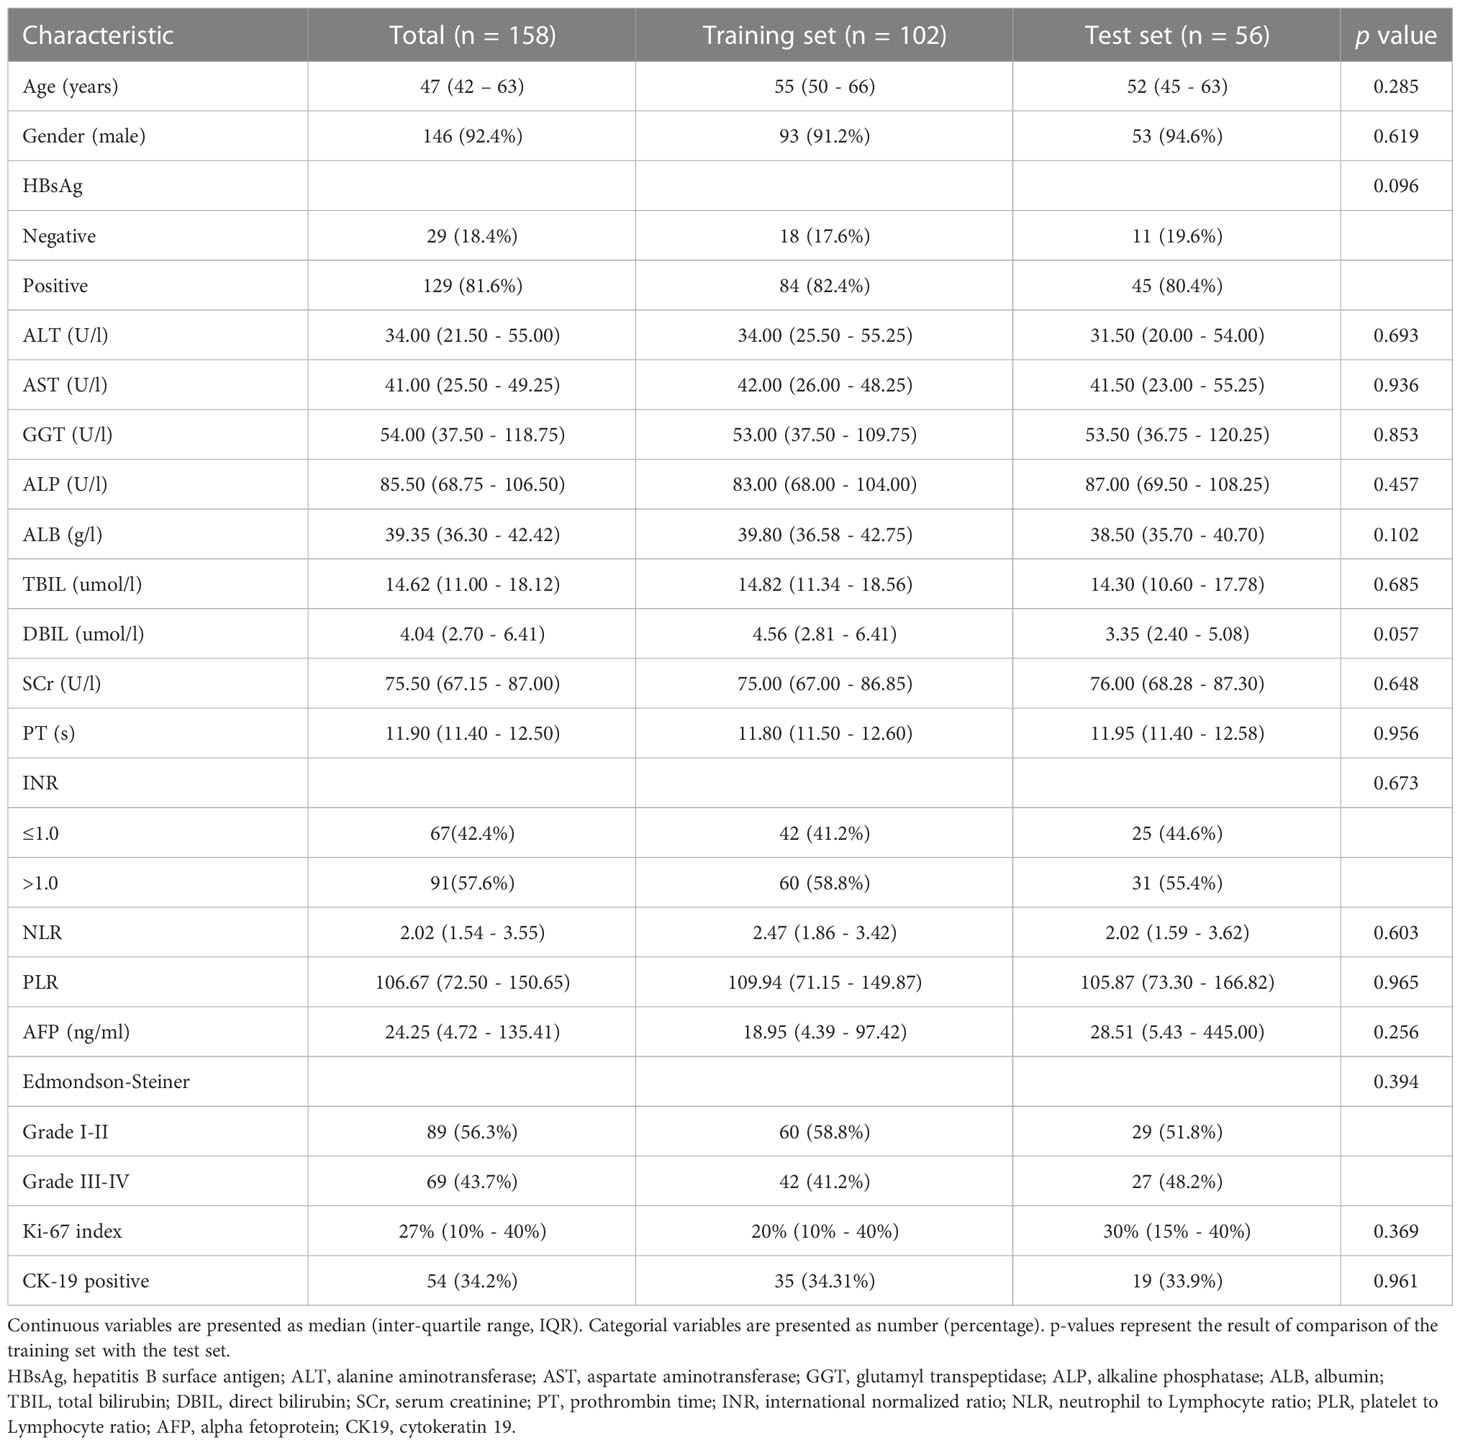
Table 1 Baseline clinical and pathological characteristics of the training and test sets.
The results of univariable analysis of semantic features in the training set showed that CK19-positive HCCs more frequently showed nonsmooth tumor margin (p=0.035), target sign (p=0.005) and corona enhancement (p=0.043) compared to CK19-negative HCCs (Supplementary Table S3).
Agreement analysis of quantitative parameters indicated that ICCs were all above 0.70 (0.70 ~0.86, p<0.001, Table 2), which proved that the two radiologists were consistent in the analysis of quantitative features. Correlation analysis showed that T1rt-Pre (r=0.352, p<0.001) and T1rt-HBP (r=0.366, p<0.001) were moderately positively correlated with CK19. rADC (r=-0.358, p<0.001) and HBP-TLR (r=-0.309, p=0.002) were moderately negatively correlated with CK19. There was no statistical significance between other MRI quantitative parameters and CK19 (p>0.05) (Supplementary Table S4).
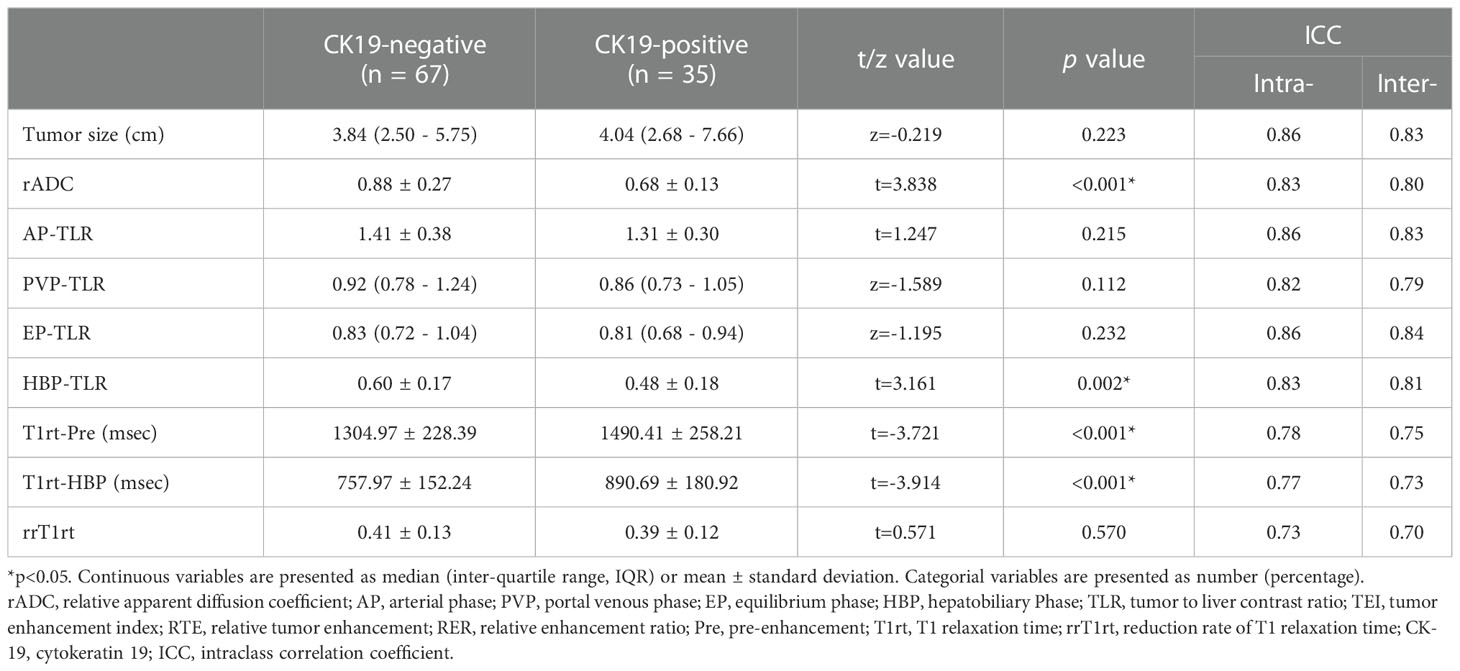
Table 2 Comparison of quantitative MRI parameters between CK19-negative and positive HCCs in training set.
rADC, HBP-TLR, T1rt-Pre and T1rt-HBP between CK19-positive and negative HCCs groups showed significant statistical differences (Table 2 and Figure 2). The univariable discriminative performances of the above quantitative parameters were detailed in the Supplementary Table S5. Among these quantitative parameters, T1rt-HBP had the highest diagnostic performance in predicting CK19-positive HCCs, with an AUROC of 0.712, sensitivity and specificity of 80.00% and 62.29%, respectively. The AUC of HBP-TLR was 0.681, the sensitivity and specificity were 74.29% and 59.70%, respectively. The AUC of rADC was 0.710, the sensitivity and specificity were 68.57% and 68.66%, respectively.
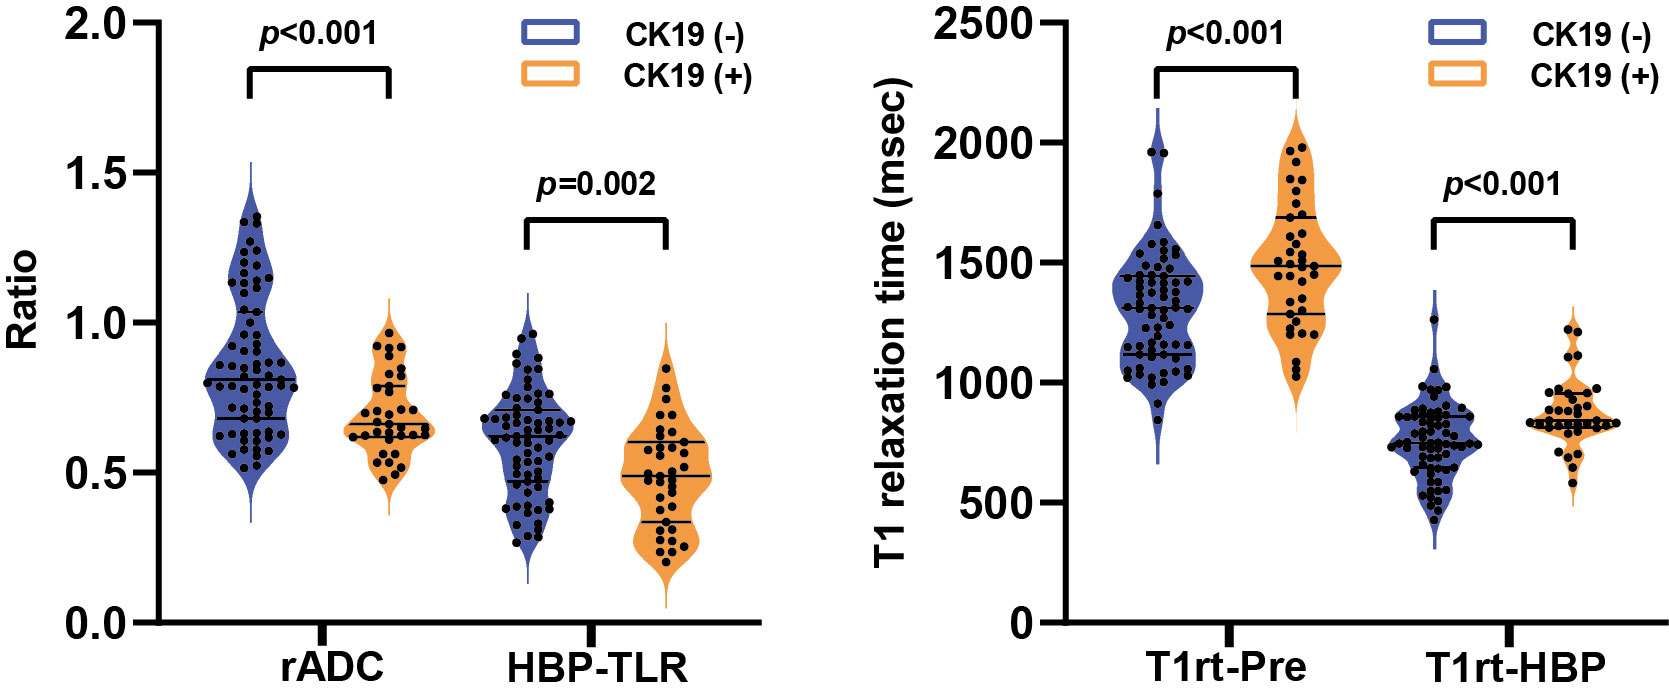
Figure 2 The violin plots show the comparison of relative apparent diffusion coefficient (rADC) and tumor-to-liver signal intensity ratio on the hepatobiliary phase (HBP-TLR) (A), T1 relaxation time of pre-contract (T1rt-Pre) and hepatobiliary phase (T1rt-HBP) (B) between CK19-negative and CK19-positive groups. CK19, Cytokeratin 19; HCC, hepatocellular carcinoma.
Multivariable logistic regression showed AFP>400ng/ml (p=0.037, OR=4.607, 95%CI: 1.098-19.326), rADC ≤ 0.71 (p=0.030, OR=3.450, 95%CI: 1.126-10.567), T1rt-HBP>797 msec (p=0.018, OR=4.509, 95%CI: 1.301-15.626) were independent predictors of CK19-positive HCCs (Supplementary Table S6).
Clinical model (C-Model), semantic model (S-Model), quantitative model (Q-Model), clinical-semantic model (CS-Model), clinical-quantitative model (CQ-Model), semantic-quantitative model (SQ-Model) and clinical-semantic-quantitative model (CSQ-Model) were constructed based on clinical (AFP, NLR), semantic (nonsmooth margin, target sign, peritumoral enhancement) and quantitative (HBP-TLR, rADC, T1rt-Pre, T1rt-HBP) variables, respectively. Stepwise regressions based on the AIC were used to further select the above variables to construct multivariable logistic regression models for CK19-positive HCCs in the training dataset (Supplementary Table S7). Interestingly, semantic features were excluded during the stepwise regressions analysis of CSQ-Model, so the CSQ-Model was equivalent to the CQ-Model. The predictive efficacy of each model is shown in Table 3. CQ-model had the largest AUROC (0.844, 95%CI: 0.754-0.933) (Figure 3). ROC analysis among models was followed by the DeLong test to compare the predictive performance (Supplementary Table S8). Precision-recall curve further illustrated similar results that CQ-Model had the largest AUPRC (0.785) (Figure 4) and F1 score (0.778).
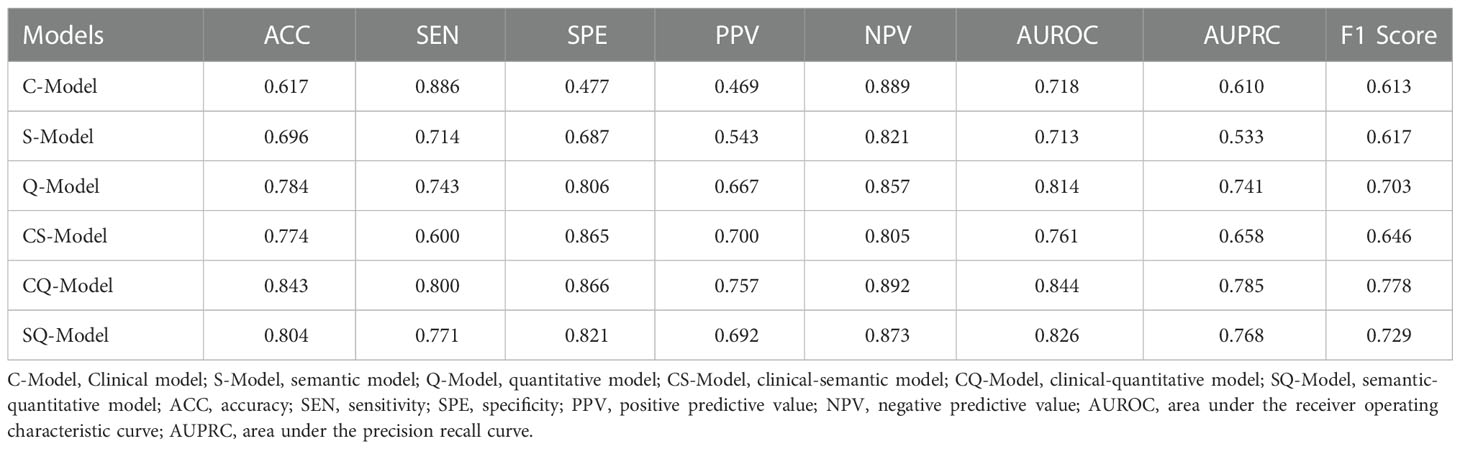
Table 3 Performance of CK19-positive HCCs prediction models in training set.
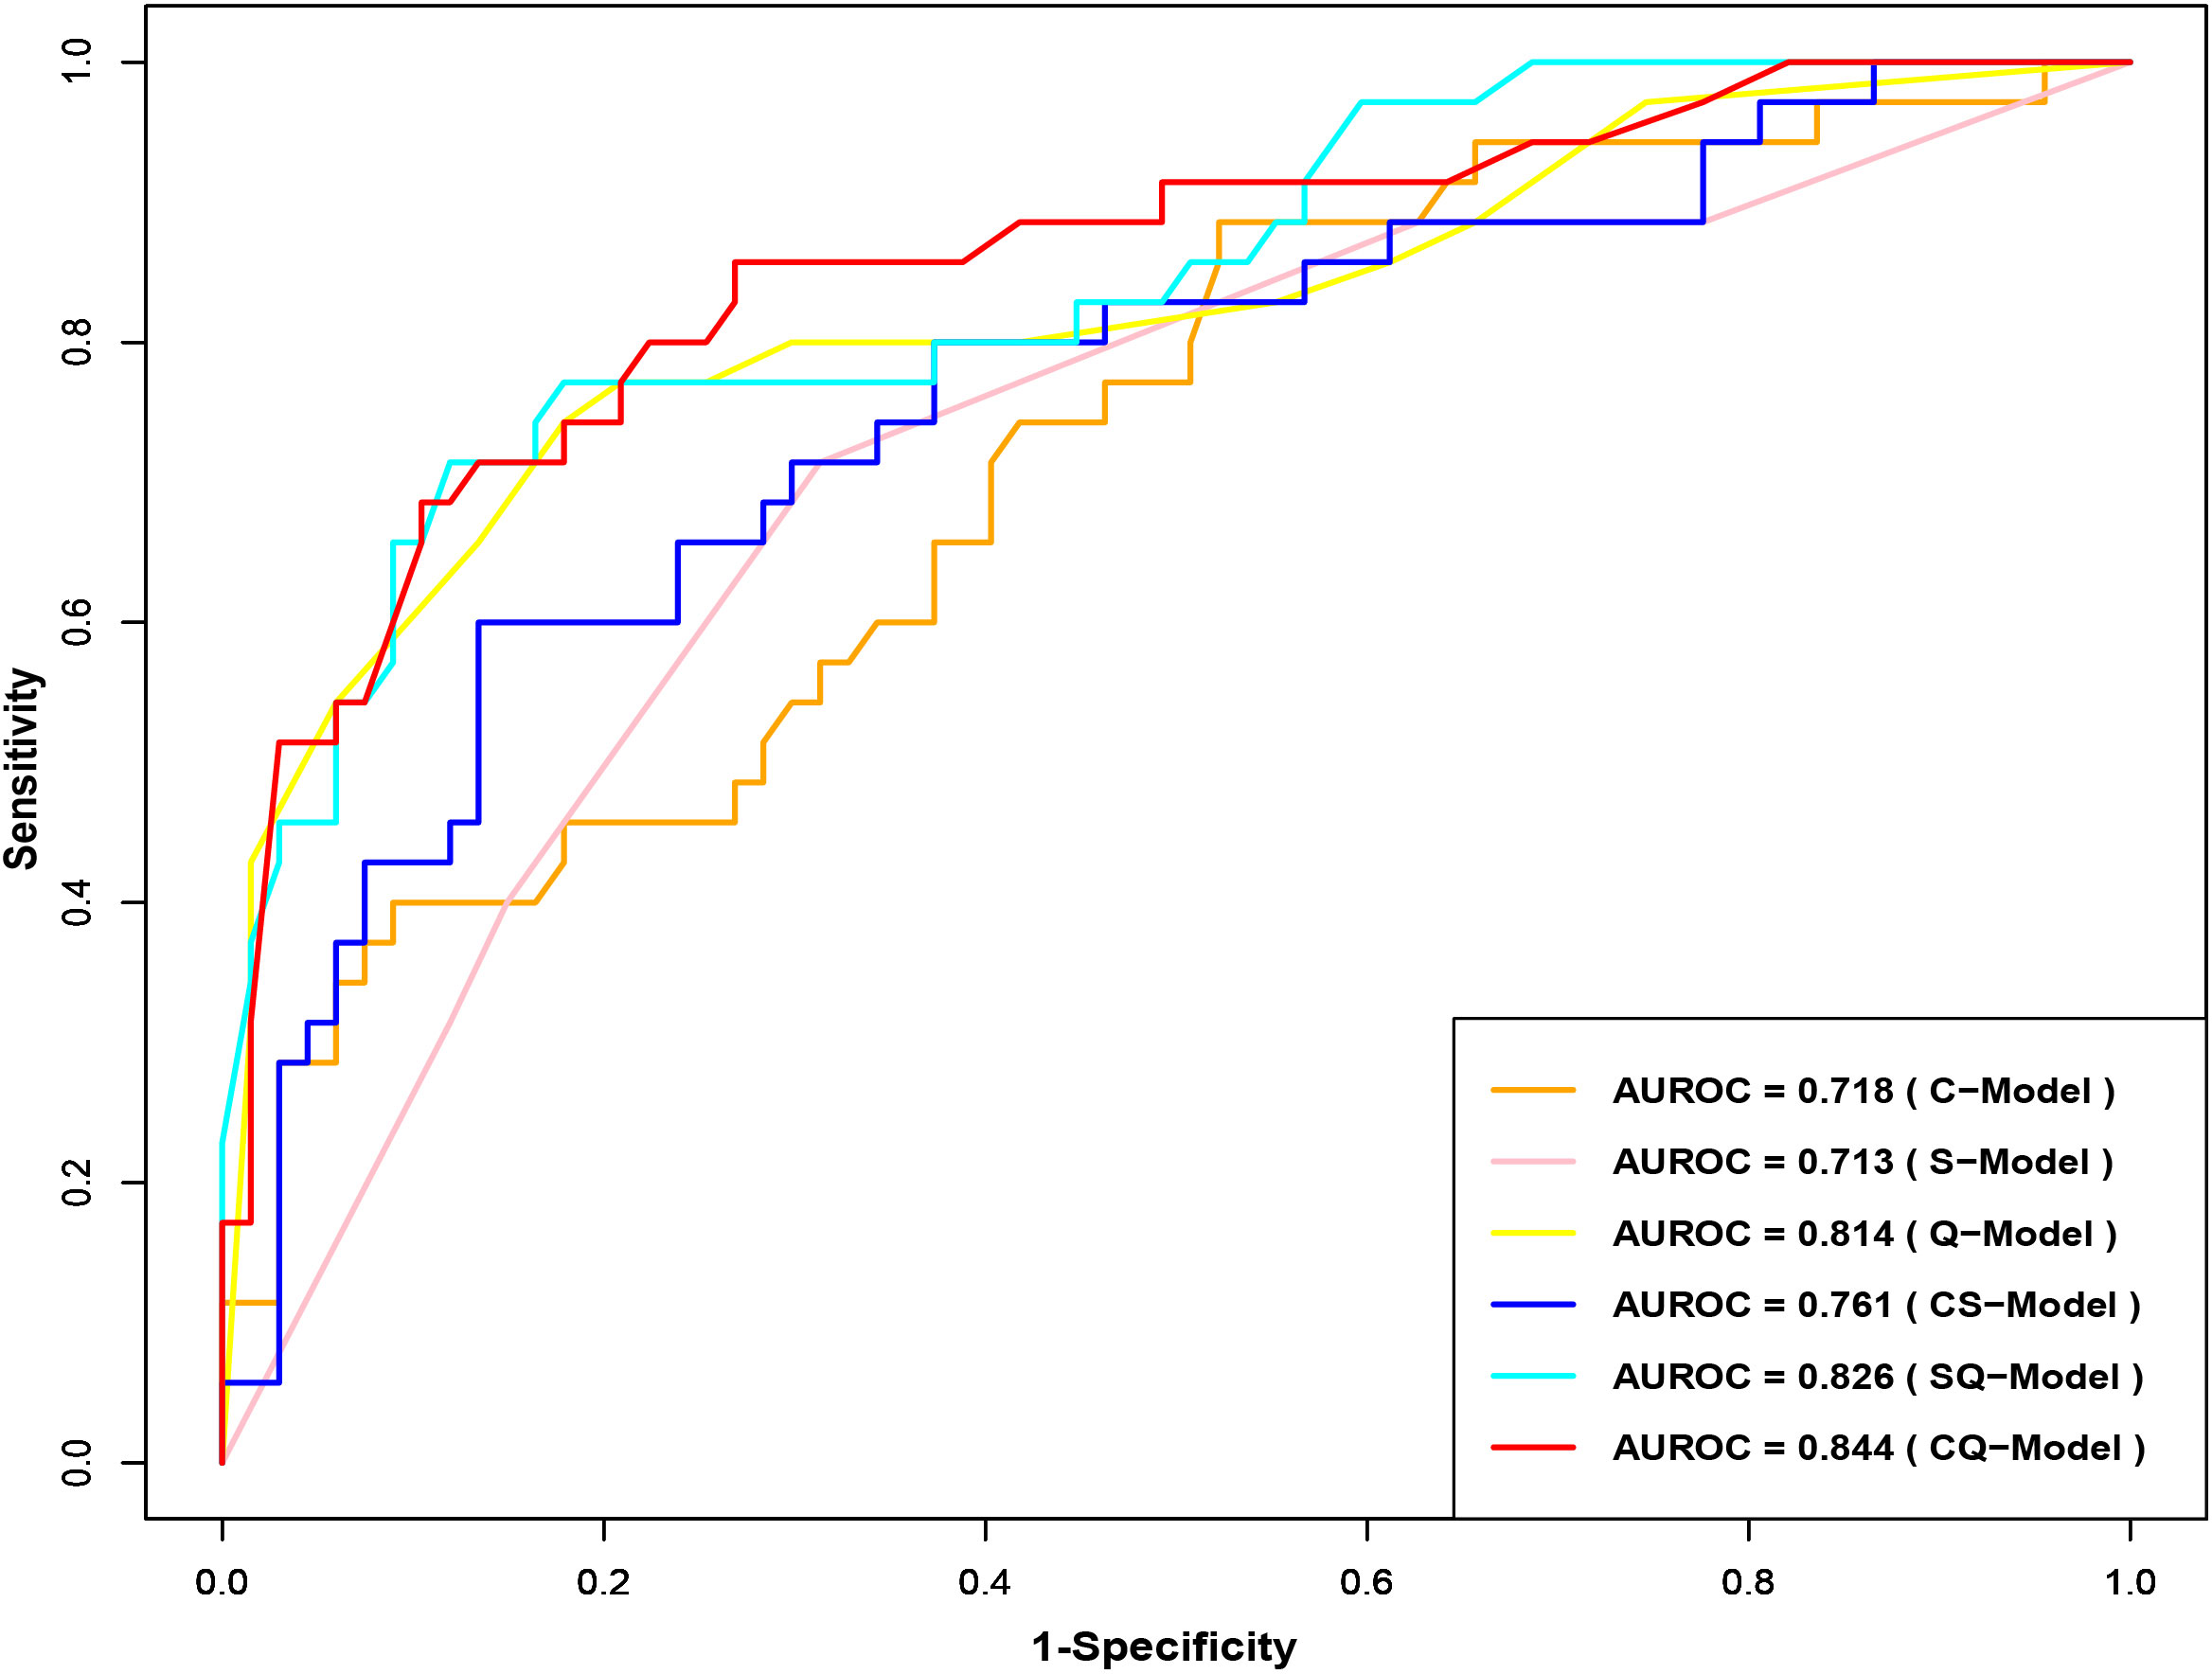
Figure 3 Receiver operator characteristic curves of CK19-positive HCC prediction model. CK19, Cytokeratin 19; HCC, hepatocellular carcinoma.
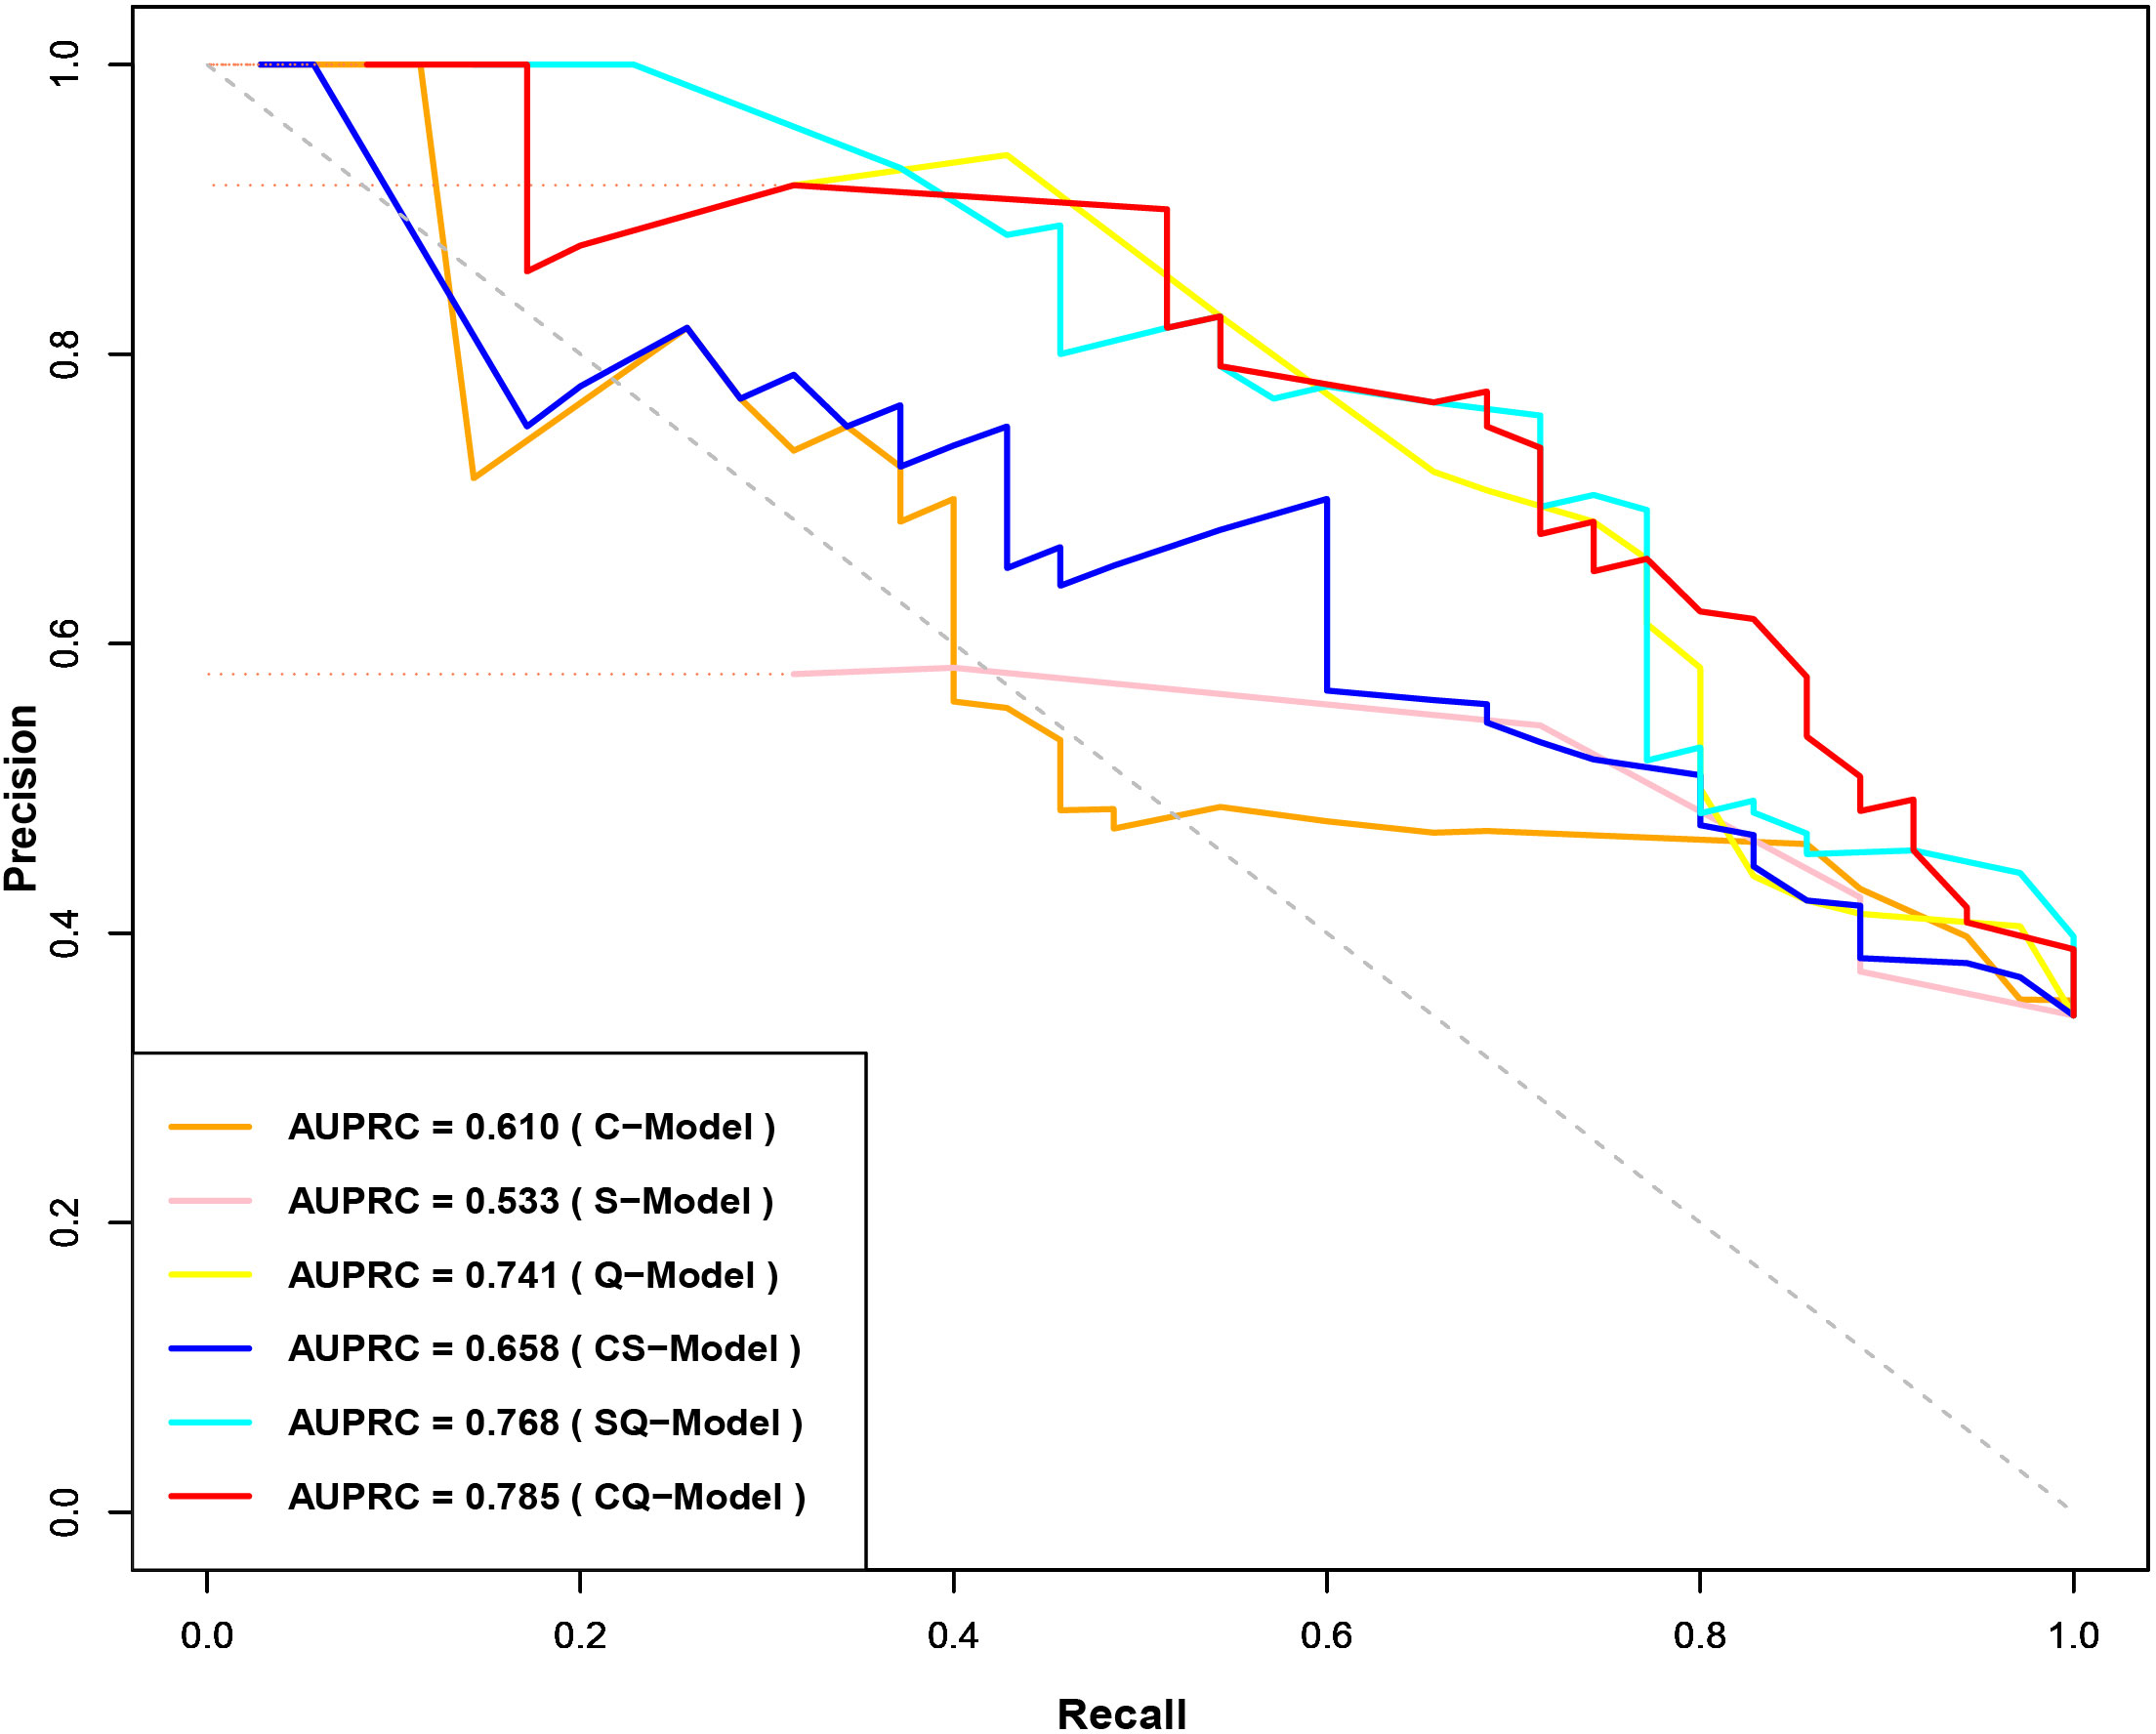
Figure 4 Precision-Recall Curves of CK19-positive HCC prediction model. CK19, Cytokeratin 19; HCC, hepatocellular carcinoma.
Based on CQ-Model, a nomogram was developed to predict CK19-positive HCCs (Figure 5), and the C-indexes in the training and test set were (0.844, 95%CI: 0.759-0.908) and (0.818, 95%CI: 0.693-0.902), respectively. The calibration curve showed that the probability of CK19-positive HCCs predicted by the CQ-Model was in good agreement with the actual probability (Supplementary Figure S1). Decision curve analysis demonstrated that CQ-Models provided larger net benefit across the range of reasonable threshold probabilities compared with the treat-all strategy and treat-none strategy (Supplementary Figure S2).
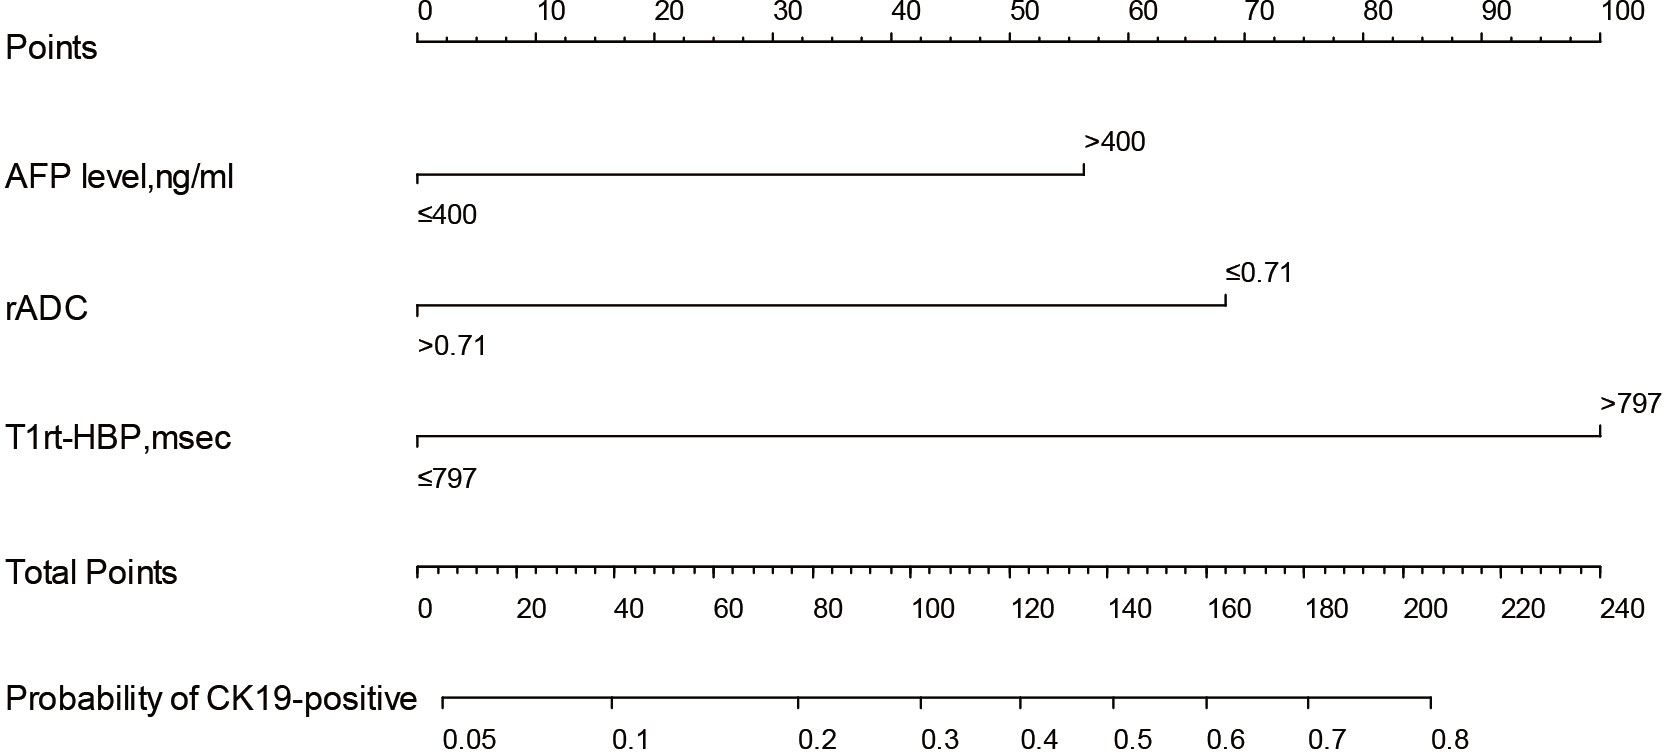
Figure 5 Nomogram of the CQ-Model. Predictor points are found on an uppermost point scale that corresponds to each variable. On the bottom scale, points for all variables are added and translated into the probability of CK19-positive HCC.
In this study, we successfully developed and tested a nomogram based on T1 mapping on gadoxetic acid-enhanced MRI, which was used to individually predict CK19 expression in HCC, demonstrating good predictive efficiency and clinical utility. The nomogram is easy for clinical application and can facilitate personalized risk stratification and further treatment decisions for patients with CK19-positive HCC.
Our study showed that elevated preoperative serum AFP levels (>400ng/ml) were an independent factor of CK19-positive HCCs, which is consistent with previous studies (11). AFP is an important tumor marker for HCC and has been confirmed to be associated with CK19 expression. In HCC patients, elevated serum AFP level is positively correlated with poor differentiation, microvascular invasion and tumor recurrence (23, 24), which is consistent with the biological behavior of CK19-positive HCCs with high aggression. Through comparative analysis, we found that combining preoperative serum AFP level of HCC patients can improve the predictive performances of semantic and quantitative MRI model. In addition, we also found that nonsmooth tumor margin, target sign and peritumoral enhancement on MRI were closely correlated with CK19 status in HCC. Multivariable analysis based on semantic MRI features showed that target sign was an independent factor associated with CK19-positive HCCs, which was similar to the findings of Hu et al. (10). Previous studies have indicated that target sign was an important independent predictor for the diagnosis of intrahepatic cholangiocarcinoma (ICC), which is related to the pathological morphology of peripheral hyperproliferation and central stromal fibrosis (25, 26). The formation of stromal fibrosis seemed to be more common in CK19-positive HCCs than in CK19-negative HCCs, which indicated the morphological characteristics of CK19-positive HCC could be between those of typical HCC and ICC (5, 27). Based on semantic MRI features of HCC, the accuracy and sensitivity for prediction of CK19 expression were limited in our study, which was similar to the results of previous studies (9, 10); therefore, there remain limitations to its application in daily practice.
We conducted correlation analysis between quantitative MRI parameters and CK19 status, and the results showed that the correlation degree between quantitative parameters based on T1 mapping and CK19 status was higher than that based on signal intensity (SI). T1 relaxation time is an absolute value, which is not affected by scanning sequence parameters, and is proportional to the concentration of gadolinium contrast agent in the tissue (28), while SI is a relative value, the difference of technical factors will affect the value of SI, and does not have a linear relationship with the concentration of contrast agent, so T1 relaxation time is more accurate and reliable than SI. This has been demonstrated in the evaluation of liver function in patients with HCC and staging hepatic fibrosis (29, 30). In addition, the correlation between quantitative parameters based on T1 mapping and CK19 is also better than relative ADC values. The reason may be that T1 relaxation time reflects the inherent characteristics of tissues and can directly reflect the proliferation of tumor, while the ADC value can only indirectly reflect the proliferation of tumor through the diffusion of water molecules (31). therefore, the quantitative parameters based on T1 mapping are more closely related to the CK19 status. In general, T1 relaxation time of HCC correlated with CK19 status, and tumor proliferation was more active in CK19-positive HCCs compared with CK19-negative HCCs, resulting in prolonged T1 relaxation time. The univariable analysis of quantitative parameters showed that T1rt-HBP had the best efficiency for predicting CK19-positive HCCs, possibly because the T1 relaxation time was proportional to the concentration of gadolinium contrast agent, and more gadolinium contrast agent enters the tumor tissue at the HBP, thereby shortening the T1 relaxation time. Therefore, T1rt-HBP can more accurately predict CK19-positive HCCs.
To identified the best model for predicting CK19-positive HCCs, stepwise regressions based on the AIC were used to select variables to construct different predictive models. Our study showed that the CQ-model combining AFP and quantitative features had the best predictive performance. Some radiomics studies (13–16) showed that radiomics scores had good diagnostic efficacy in predicting CK19 expression. In the study by Wang W et al. (13), the combined model achieved a higher AUC than in our study for predicting CK19 expression (0.959 vs 0.844), albeit using a single-institution set. Besides, Yang F et al. (16). reported similar AUC for identifying CK19 status (0.857) with their radiomics signatures extracted from multisequence MRI, However, the AUCs of the two validation sets were only 0.726 and 0.790, respectively. Similarly, Chen Y et al. (19). achieved good results in predicting CK19 expression by DL model, but the DL model did not perform well in the test set (AUC), with AUCs of only 0.614 and 0.750 in the two test sets, respectively. The small sample size of the test set or the differences in MRI protocols may affect the robustness of the model. Undoubtedly, radiomics is a promising approach, but these studies are limited by image segmentation and standardization to the detriment of clinical practice. In contrast, our proposed CQ model is relatively easier to implement clinically, and the combination of quantitative MRI features (T1rt-HBP, rADC) and clinical information (AFP) can provide complementary information in building the model and improve the predictive performance. Meanwhile, the application of the CQ-Model in external test data demonstrated good robustness with different MRI scanners and with different parameter settings. We suggest that T1 mapping can be integrated as an additional protocol in gadoxetic acid-enhanced MR imaging for evaluating CK19 expression status in HCC, and T1 relaxation time is expected to provide additional information for predicting CK19-positive HCCs, which is preliminary and warrants further validation.
There were several limitations to our study. First, this is a retrospective study and only single HCC was selected, which may have selection bias in data homogeneity. Second, the small sample size of the test set may affect the robustness of model. Therefore, the prediction model needs to be further optimized through large-scale and multicenter studies in future studies. Third, we did not calculate the T1 relaxation time ratio of tumor to liver parenchyma because the presence of liver cirrhosis might have some influence on the results.
In summary, T1 mapping on gadoxetic acid-enhanced MRI combined with Diffusion-weighted Imaging and AFP can help predict the CK19 expression status in HCC, which is expected to provide important guiding value for the subsequent treatment and prognostic assessment of HCC patients. These results warrant further validation in future randomized trials to test the clinical utility of our imaging signature in combination with clinical-radiologic criteria to guide individualized therapeutic selection.
The original contributions presented in the study are included in the article/Supplementary Material. Further inquiries can be directed to the corresponding author.
The studies involving human participants were reviewed and approved by The Ethics Review Board of Central People’s Hospital of Zhanjiang. Written informed consent for participation was not required for this study in accordance with the national legislation and the institutional requirements.
XT, JC, and YZ conducted the literature search. XT, JC, YZ, HH, PL and XJ designed the study. XT, JC, PL, and HH collected the data. XT, JC, YZ, HH, PL, and YL analyzed the data. All authors verified the data. XT, JC, YZ, PL, HH, and YL edited the manuscript. HT, YL, XT, and YZ reviewed the manuscript. All authors contributed to the article and approved the submitted version.
The authors declare that the research was conducted in the absence of any commercial or financial relationships that could be construed as a potential conflict of interest.
All claims expressed in this article are solely those of the authors and do not necessarily represent those of their affiliated organizations, or those of the publisher, the editors and the reviewers. Any product that may be evaluated in this article, or claim that may be made by its manufacturer, is not guaranteed or endorsed by the publisher.
The Supplementary Material for this article can be found online at: https://www.frontiersin.org/articles/10.3389/fonc.2022.1068231/full#supplementary-material
1. Sung H, Ferlay J, Siegel RL, Laversanne M, Soerjomataram I, Jemal A, et al. Global cancer statistics 2020: GLOBOCAN estimates of incidence and mortality worldwide for 36 cancers in 185 countries. CA Cancer J Clin (2021) 71:209–49. doi: 10.3322/caac.21660
2. Marrero JA, Kulik LM, Sirlin CB, Zhu AX, Finn RS, Abecassis MM, et al. Diagnosis, staging, and management of hepatocellular carcinoma: 2018 practice guidance by the American association for the study of liver diseases: Marrero et al. Hepatology (2018) 68:723–50. doi: 10.1002/hep.29913
3. Galle PR, Forner A, Llovet JM, Mazzaferro V, Piscaglia F, Raoul J-L, et al. EASL clinical practice guidelines: Management of hepatocellular carcinoma. J Hepatol (2018) 69:182–236. doi: 10.1016/j.jhep.2018.03.019
4. Calderaro J, Ziol M, Paradis V, Zucman-Rossi J. Molecular and histological correlations in liver cancer. J Hepatol (2019) 71:616–30. doi: 10.1016/j.jhep.2019.06.001
5. Rhee H, Kim H, Park YN. Clinico-Radio-Pathological and molecular features of hepatocellular carcinomas with keratin 19 expression. Liver Cancer (2020) 9:663–81. doi: 10.1159/000510522
6. Fatourou E, Koskinas J, Karandrea D, Palaiologou M, Syminelaki T, Karanikolas M, et al. Keratin 19 protein expression is an independent predictor of survival in human hepatocellular carcinoma. Eur J Gastroenterol Hepatol (2015) 27:1094–102. doi: 10.1097/MEG.0000000000000398
7. Lee S-H, Lee J-S, Na G-H, You Y-K, Kim D-G. Immunohistochemical markers for hepatocellular carcinoma prognosis after liver resection and liver transplantation. Clin Transplant (2017) 31:e12852. doi: 10.1111/ctr.12852
8. Mehrpouya M, Pourhashem Z, Yardehnavi N, Oladnabi M. Evaluation of cytokeratin 19 as a prognostic tumoral and metastatic marker with focus on improved detection methods. J Cell Physiol (2019) 234:21425–35. doi: 10.1002/jcp.28768
9. Choi S-Y, Kim SH, Park CK, Min JH, Lee JE, Choi Y-H, et al. Imaging features of gadoxetic acid–enhanced and diffusion-weighted MR imaging for identifying cytokeratin 19-positive hepatocellular carcinoma: A retrospective observational study. Radiology (2018) 286:897–908. doi: 10.1148/radiol.2017162846
10. Hu X-X, Wang W-T, Yang L, Yang Z-X, Liang H-Y, Ding Y, et al. MR features based on LI-RADS identify cytokeratin 19 status of hepatocellular carcinomas. Eur J Radiol (2019) 113:7–14. doi: 10.1016/j.ejrad.2019.01.036
11. Wang H, Yang C, Zeng M, Rao S, Ji Y, Weng X, et al. Magnetic resonance texture analysis for the identification of cytokeratin 19-positive hepatocellular carcinoma. Eur J Radiol (2019) 117:164–70. doi: 10.1016/j.ejrad.2019.06.016
12. Parekh VS, Jacobs MA. Deep learning and radiomics in precision medicine. Expert Rev Precis Med Drug Dev (2019) 4:59–72. doi: 10.1080/23808993.2019.1585805
13. Wang W, Gu D, Wei J, Ding Y, Yang L, Zhu K, et al. A radiomics-based biomarker for cytokeratin 19 status of hepatocellular carcinoma with gadoxetic acid–enhanced MRI. Eur Radiol (2020) 30:3004–14. doi: 10.1007/s00330-019-06585-y
14. Huang X, Long L, Wei J, Li Y, Xia Y, Zuo P, et al. Radiomics for diagnosis of dual-phenotype hepatocellular carcinoma using gd-EOB-DTPA-enhanced MRI and patient prognosis. J Cancer Res Clin Oncol (2019) 145:2995–3003. doi: 10.1007/s00432-019-03062-3
15. Chen J, Wu Z, Xia C, Jiang H, Liu X, Duan T, et al. Noninvasive prediction of HCC with progenitor phenotype based on gadoxetic acid-enhanced MRI. Eur Radiol (2020) 30:1232–42. doi: 10.1007/s00330-019-06414-2
16. Yang F, Wan Y, Xu L, Wu Y, Shen X, Wang J, et al. MRI-Radiomics prediction for cytokeratin 19-positive hepatocellular carcinoma: A multicenter study. Front Oncol (2021) 11:672126. doi: 10.3389/fonc.2021.672126
17. Hosny A, Parmar C, Quackenbush J, Schwartz LH, Aerts HJWL. Artificial intelligence in radiology. Nat Rev Cancer (2018) 18:500–10. doi: 10.1038/s41568-018-0016-5
18. Yasaka K, Akai H, Kunimatsu A, Kiryu S, Abe O. Deep learning with convolutional neural network in radiology. Jpn J Radiol (2018) 36:257–72. doi: 10.1007/s11604-018-0726-3
19. Chen Y, Chen J, Zhang Y, Lin Z, Wang M, Huang L, et al. Preoperative prediction of cytokeratin 19 expression for hepatocellular carcinoma with deep learning radiomics based on gadoxetic acid-enhanced magnetic resonance imaging. J Hepatocell Carcinoma (2021) Volume 8:795–808. doi: 10.2147/JHC.S313879
20. Price WN. Big data and black-box medical algorithms. Sci Transl Med (2018) 10:eaao5333. doi: 10.1126/scitranslmed.aao5333
21. Taylor AJ, Salerno M, Dharmakumar R, Jerosch-Herold M. T1 mapping. JACC Cardiovasc Imaging (2016) 9:67–81. doi: 10.1016/j.jcmg.2015.11.005
22. Haimerl M, Verloh N, Zeman F, Fellner C, Nickel D, Lang SA, et al. Gd-EOB-DTPA-enhanced MRI for evaluation of liver function: Comparison between signal-intensity-based indices and T1 relaxometry. Sci Rep (2017) 7:43347. doi: 10.1038/srep43347
23. Galle PR, Foerster F, Kudo M, Chan SL, Llovet JM, Qin S, et al. Biology and significance of alpha-fetoprotein in hepatocellular carcinoma. Liver Int (2019) 39:2214–29. doi: 10.1111/liv.14223
24. Zheng Y, Zhu M, Li M. Effects of alpha-fetoprotein on the occurrence and progression of hepatocellular carcinoma. J Cancer Res Clin Oncol (2020) 146:2439–46. doi: 10.1007/s00432-020-03331-6
25. Ni T, Shang X-S, Wang W-T, Hu X-X, Zeng M-S, Rao S-X. Different MR features for differentiation of intrahepatic mass-forming cholangiocarcinoma from hepatocellular carcinoma according to tumor size. Br J Radiol (2018), 20180017. doi: 10.1259/bjr.20180017
26. Park HJ, Kim YK, Park MJ, Lee WJ. Small intrahepatic mass-forming cholangiocarcinoma: target sign on diffusion-weighted imaging for differentiation from hepatocellular carcinoma. Abdom Imaging (2013) 38:793–801. doi: 10.1007/s00261-012-9943-x
27. Aishima S, Nishihara Y, Kuroda Y, Taguchi K, Iguchi T, Taketomi A, et al. Histologic characteristics and prognostic significance in small hepatocellular carcinoma with biliary differentiation: Subdivision and comparison with ordinary hepatocellular carcinoma. Am J Surg Pathol (2007) 31:783–91. doi: 10.1097/01.pas.0000213421.53750.0a
28. Rao C, Wang X, Li M, Zhou G, Gu H. Value of T1 mapping on gadoxetic acid-enhanced MRI for microvascular invasion of hepatocellular carcinoma: a retrospective study. BMC Med Imaging (2020) 20:43. doi: 10.1186/s12880-020-00433-y
29. Kim JE, Kim HO, Bae K, Choi DS, Nickel D. T1 mapping for liver function evaluation in gadoxetic acid–enhanced MR imaging: comparison of look-locker inversion recovery and B1 inhomogeneity–corrected variable flip angle method. Eur Radiol (2019) 29:3584–94. doi: 10.1007/s00330-018-5947-4
30. Wang Q, Liu H, Zhu Z, Sheng Y, Du Y, Li Y, et al. Feasibility of T1 mapping with histogram analysis for the diagnosis and staging of liver fibrosis: Preclinical results. Magn Reson Imaging (2021) 76:79–86. doi: 10.1016/j.mri.2020.11.006
31. Guo Y, Chen J, Zhang Y, Guo Y, Jiang M, Dai Y, et al. Differentiating cytokeratin 19 expression of hepatocellular carcinoma by using multi-b-value diffusion-weighted MR imaging with mono-exponential, stretched exponential, intravoxel incoherent motion, diffusion kurtosis imaging and fractional order calculus models. Eur J Radiol (2022) 150:110237. doi: 10.1016/j.ejrad.2022.110237
Keywords: hepatocellular carcinoma, cytokeratin 19, magnetic resonance imaging, T1 mapping, nomogram
Citation: Zhao Y, Tan X, Chen J, Tan H, Huang H, Luo P, Liang Y and Jiang X (2023) Preoperative prediction of cytokeratin-19 expression for hepatocellular carcinoma using T1 mapping on gadoxetic acid-enhanced MRI combined with diffusion-weighted imaging and clinical indicators. Front. Oncol. 12:1068231. doi: 10.3389/fonc.2022.1068231
Received: 12 October 2022; Accepted: 19 December 2022;
Published: 19 January 2023.
Edited by:
Amedeo Columbano, University of Cagliari, ItalyReviewed by:
Angelo Vanzulli, Niguarda Ca’ Granda Hospital, ItalyCopyright © 2023 Zhao, Tan, Chen, Tan, Huang, Luo, Liang and Jiang. This is an open-access article distributed under the terms of the Creative Commons Attribution License (CC BY). The use, distribution or reproduction in other forums is permitted, provided the original author(s) and the copyright owner(s) are credited and that the original publication in this journal is cited, in accordance with accepted academic practice. No use, distribution or reproduction is permitted which does not comply with these terms.
*Correspondence: Xinqing Jiang, Y2hhb3l1ZXpqQGhvdG1haWwuY29t
†These authors have contributed equally to this work and share first authorship
Disclaimer: All claims expressed in this article are solely those of the authors and do not necessarily represent those of their affiliated organizations, or those of the publisher, the editors and the reviewers. Any product that may be evaluated in this article or claim that may be made by its manufacturer is not guaranteed or endorsed by the publisher.
Research integrity at Frontiers
Learn more about the work of our research integrity team to safeguard the quality of each article we publish.