 Ziyang Zeng
 Zhen Liu
 Jie Li
 Juan Sun
 Mingwei Ma
 Xin Ye
 Jianchun Yu
 Weiming Kang
- Department of General Surgery, Peking Union Medical College Hospital, Chinese Academy of Medical Sciences and Peking Union Medical College, Beijing, China
Background: The spleen is the largest peripheral lymphoid organ in the body. Studies have implicated the spleen in the development of cancer. However, it is unknown whether splenic volume (SV) is associated with the clinical outcome of gastric cancer.
Methods: Data of gastric cancer patients treated with surgical resection were retrospectively analyzed. Patients were divided into three groups: underweight, normal-weight and overweight. Overall survival was compared in patients with high and low splenic volume. The correlation between splenic volume and peripheral immune cells were analyzed.
Results: Of 541 patients, 71.2% were male and the median age was 60. Underweight, normal-weight and overweight patients accounted for 5.4%, 62.3% and 32.3%, respectively. High splenic volume was associated with unfavorable prognosis across the three groups. In addition, the increase of splenic volume during neoadjuvant chemotherapy was not associated with prognosis. The baseline splenic volume was negatively correlated with lymphocytes (r=-0.21, p<0.001) and positively correlated with NLR (neutrophil-to-lymphocyte ratio) (r=0.24, p<0.001). In a group of patients (n=56), splenic volume was found to have negative correlation with CD4+T cells (r=-0.27, p=0.041) and NK cells (r=-0.30, p=0.025).
Conclusions: The presence of high splenic volume is a biomarker of unfavorable prognosis and reduced circulating lymphocytes in gastric cancer.
Introduction
Gastric cancer is the fifth most common and the fourth most lethal cancer in the world (1). Despite the development in conventional therapeutic strategies, including surgery, radiotherapy and chemotherapy, the overall prognosis remained poor, with an estimated 5-year survival rate of 45% in advanced stage (2). The past decade has witnessed the emergence of immunotherapy in cancer therapy, and immune checkpoint inhibitors (ICIs) have emerged as a new therapeutic strategy in gastric cancer (3). The ATTRACTION-2 study has demonstrated prolonged survival by anti-PD1 therapy in the third-line setting of gastric cancer (4), but the clinical benefit was observed only in a minority of patients. When applied as monotherapy, different trials of anti-PDL1 showed a range of response rates from 11% to 22% in the unselected patients (4–6). However, in patients with MSI-H, which is characterized by high number of tumor neoantigens, the objective response rates ranged from 47% to 57% (6–8). EBV-positive GC is another particular subtype associated with enhanced clinical benefit, with a rather wide range of objective response rates of 25% to 100% (9–13) in various settings. The highly inflamed microenvironment of MSI-H and EBV-positive tumors can partly explain the favorable response of ICIs (14). Accordingly, high tumor mutational burden (TMB-H) which facilitates immune recognition is also predictive of improved clinical response and overall survival (15). However, these predictive biomarkers currently in use are largely derived from immune microenvironment within the tumor, and does not fully account for the systemic immune landscape.
Recent studies suggested that successful immunotherapy depends on the system-wide immune response, rather than the local response within tumor (16). Antitumor immune response cannot proceed without communication with the periphery (17). Studies have found that PD1 and PDL1 blockade drove new T cell clones into the tumor microenvironment, instead of reinvigorating pre-existing effector T cells (18, 19). And the crossing of survival curves between anti-PDL1 and chemotherapy in the phase 3 KEYNOTE-061 and KEYNOTE-062 trials also suggested a period needed for awakening the immune system to attack tumor cells after the initiation of ICIs (7, 8), addressing the importance of immunological background in driving and sustaining efficacious immunotherapy responses.
Also, it is now accepted that conventional chemotherapy can augment antitumor immune response by increasing antigenicity and adjuvanticity of cancer cells, and rebound replenishment of immune cell pools following lymphodepletion (20, 21). In the setting of chemotherapy, therapeutic efficacy was found to substantially correlate with lymphocyte and NK cell counts in the periphery (22, 23). Studies showed that some chemotherapeutic drugs appeared more effective in immuno-competent hosts than in immuno-deficient counterparts (20). These data suggested the fundamental role of global immune macroenvironment (17, 24, 25) as the basis for various therapies. Immunity is coordinated across diverse cell types and tissues. And with the advent of immunotherapy, either used alone or in combination with chemotherapy, a thorough understanding of the systemic immunity is needed to better harness the potentiality of immunotherapy to treat gastric cancer.
As the largest peripheral lymphoid organ in the body, the spleen is a pivotal site for innate and adaptive immune response, and is estimated to host one third of the immune cells in the body (26). The spleen is now receiving more attention in the context of cancer for its capacity in generating tumor-associated macrophages (TAMs) and tumor-associated neutrophils (TANs) (27, 28). In a few solid tumors (29, 30), splenic volume proved to be a prognostic biomarker that was associated with the immune status of patients.
In this retrospective study, we focused on the spleen and aimed to determine the prognostic role of baseline splenic volume in patients with gastric cancer. Further, we explored whether the splenic volume was correlated to peripheral immune cells.
Methods
Patients
Data of patients who underwent surgical resection for gastric cancer between January 2015 and March 2018 in Peking Union Medical College Hospital (PUMCH) were retrospectively reviewed. Clinical data were extracted from an electronic database. The baseline CT scan images were retrieved from a workstation (Syngo MMWP; Siemens Healthcare). Besides the baseline CT, we also retrieved CT scans after neoadjuvant chemotherapy was completed (evaluated before surgery) in available cases, to compare the change of splenic volume (△SV) during neoadjuvant chemotherapy and evaluated the prognostic effects.
As the spleen serves a reservoir of immune cells, we also compared the difference of circulating immune cell populations in patients with high SV and low SV. In a subset of patients in our cohort, immunophenotyping of blood lymphocytes was analyzed by flow cytometry (NAVIOS, Bechman Coulter, USA). Freshly collected EDTA-anticoagulated whole blood was incubated and tested with a panel of monoclonal antibodies directed against CD3, CD4, CD8, CD19, CD16 and CD56. Lymphocyte subsets were calculated using a dual-platform method with the white blood cell counts and lymphocyte differentials obtained from blood routine tests of the same specimen. All blood tests were performed at baseline, which was before the initiation of treatments.
The WHO criteria for obesity was adopted to classify the total patients into 3 groups: underweight (<18.50kg/m²), normal weight (18.5-24.99 kg/m²) and overweight (≥25.00kg/m²) (31). This is because the volume of spleen is proportional to the patients’ BMI. To allow comparisons of high and low splenic volume only made within patients with similar BMI, we conducted the comparative study in each BMI group, respectively.
Before surgery, neoadjuvant chemotherapy (NAC) was administered depending on clinical assessments at baseline evaluation. The indication for NAC in our center was locally advanced gastric cancer with clinical T stage ≥ 3 or N stage ≥ 1. Radical total or subtotal gastrectomy with D2 lymphadenectomy were performed for curative resection. Palliative resection was performed in the presence of major symptoms for patients with non-curative gastric cancer. The tumor size was defined as the longest diameter of the tumor mass visible on pathological examination. Pathologic staging was assigned based on the 8th edition of the American Joint Committee on Cancer (AJCC) staging manual. After surgery, patients were followed up every 3-6 months for two years and every one year thereafter. The study was approved by the institutional review boards of PUMCH (K1447). Written informed consent was waived because of the retrospective nature of this study.
Definition of postoperative complications
All 30-day postoperative adverse events were graded by the Clavien-Dindo system (32, 33). Adverse events classified as Clavien-Dindo grade II or higher were defined as postoperative complications. Postoperative complications included abdominal complications: anastomotic leakage, intra-abdominal infection, peritoneal effusion, bleeding, pancreatic fistula, chylous leakage, delayed gastric emptying, mechanical bowel obstruction, paralytic ileus and delayed wound dehiscence; respiratory complications: pneumonia, pleural effusion and pulmonary embolism; and infection with unknown causes, cardiovascular complications and urinary complications.
Spleen volumetry
The baseline CT images were analyzed on the workstation and the splenic volume (SV) of the patients was measured by an experienced analyzer. Briefly, the margin of the spleen was manually contoured in each CT image to calculate the area that was enclosed, taking into account the slice thickness. Then, the volume of each slice of the spleen from the upper pole to the lower pole was summed to obtain the total volume of the spleen (Supplementary Figure 1). To ensure reproducibility, the same analyzer repeated the measurements on one hundred randomly selected patients to calculate intra-observer variability. Two analyzers independently performed measurements on twenty randomly selected patients to calculate inter-observer variability. The agreement between analyses were calculated using concordance correlation coefficients (CCC).
Statistical analysis
All statistical analyses were performed using the R software (4.1.3). Concordance correlation coefficients (CCC) were calculated using the R package ‘cccrm’. The comparisons between continuous data were performed using Mann Whitney test or Kruskal-Wallis test. Paired samples Wilcoxon test was used for the comparison of splenic volume before and after neoadjuvant chemotherapy. We used the maximally selected log-rank statistics to choose the optimal cutoff for splenic volume with the R package ‘maxstat’ (34). Patients were divided into a high SV and low SV group by a candidate splenic volume threshold. The cutoff that best separated patient outcome with the maximum log-rank statistics and minimum P value was selected as the optimal cutoff. Overall survival was defined as the time from surgery to death. Kaplan-Meier curves with log-rank tests were used to compare survival between different groups. Cox proportional hazard regression model was performed for multivariate analyses. In multivariate Cox analysis, clinically important variables were entered into the model. The correlations between the splenic volume and celluar blood components were evaluated with Spearman’s rank correlation coefficient. A two-sided P value less than 0.05 was considered to indicate statistical significance.
Results
Patient characteristics
Between January 2015 and March 2018, a total of 944 patients who had surgical resection for gastric cancer were screened, of whom 541 were eligible for the study. Patients were excluded because of incomplete clinical data (n=8), unavailable CT scan (n=298), previous splenectomy (n=1), prior treatment before admission (n=11) and follow-up for less than two years (n=85) (Figure 1). In this study, 56 patients were tested for lymphocyte subsets before treatment initiation, including CD3/CD4/CD8+T cells and CD16+CD56+NK cells, and 30 patients were tested for peripheral CD19+B cells. And the association between splenic volume and immunocyte subsets were investigated in this group of patients (Figure 1).
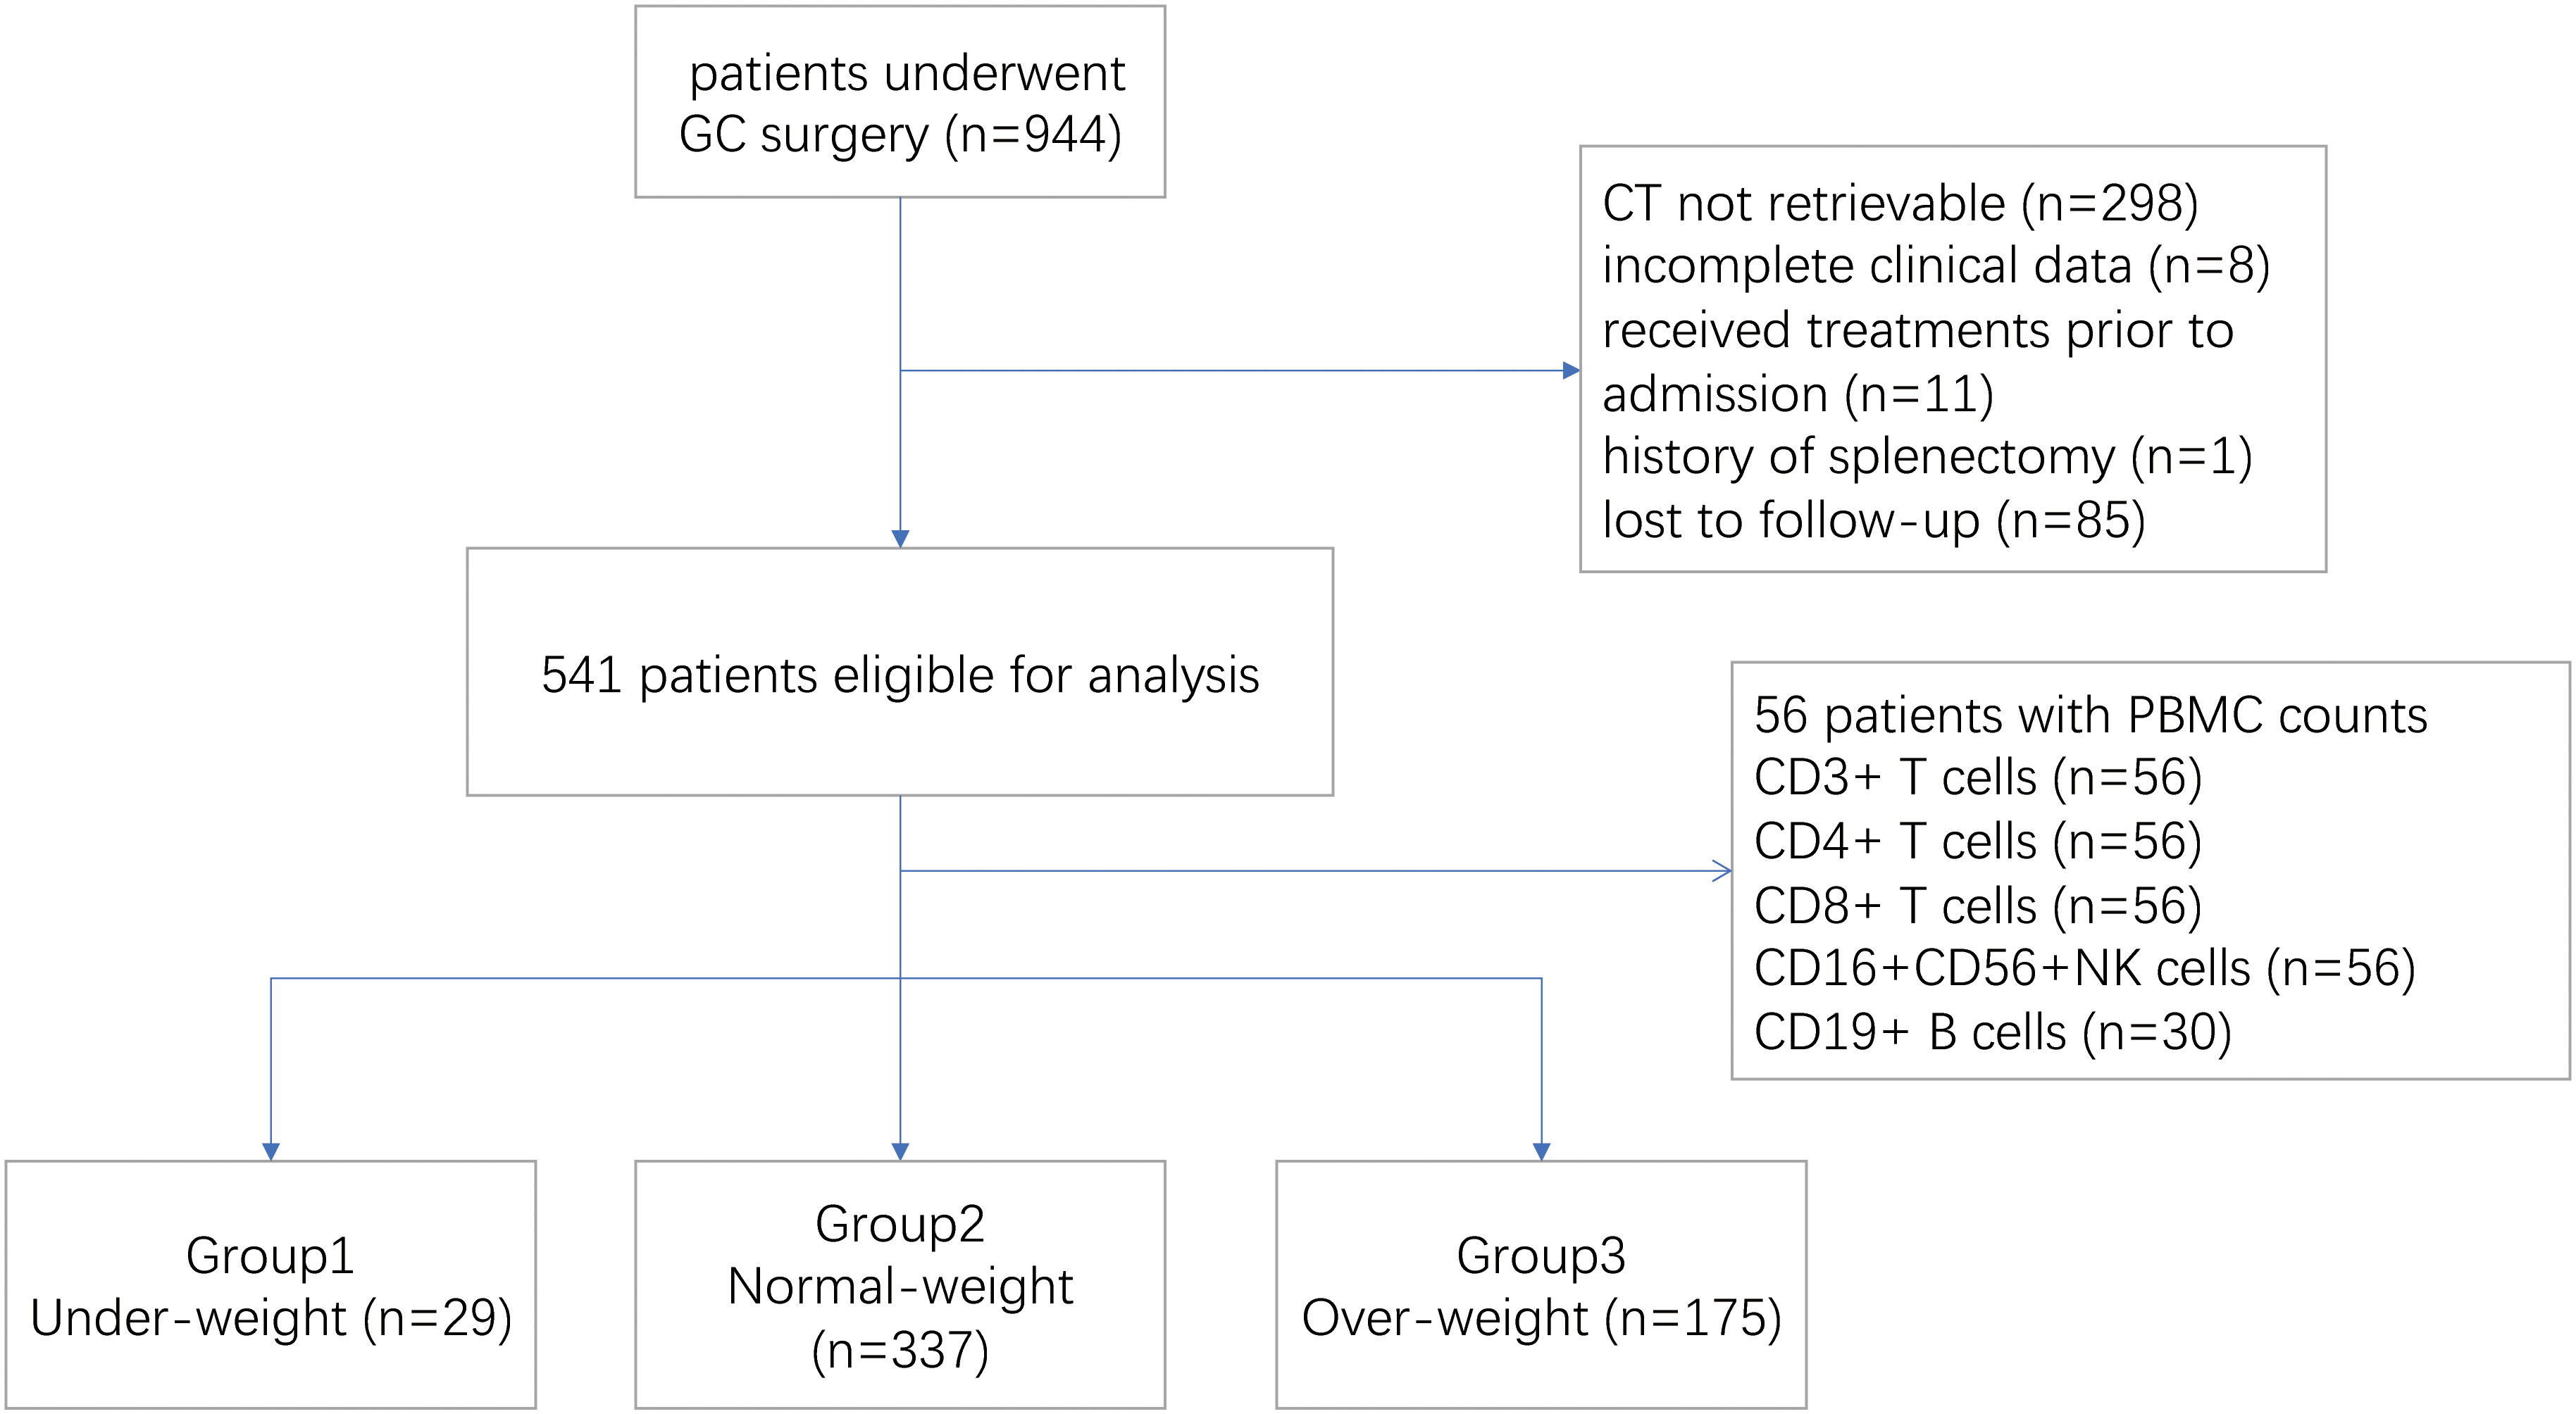
Figure 1 Study flowchart.
Of 541 patients enrolled, the median (IQR) age was 60 (53–67), and most patients were male (385 [71.2%]). The median (IQR) BMI was 23.4 (21.3-25.6) kg/m². In the total population, 157 (29.0%) had received neoadjuvant chemotherapy before surgery. The proportion of total and partial resection was 64.3% and 35.7%, respectively. Adjuvant chemotherapy was administered in 314 (58.0%) patients post surgery. The median (IQR) value of the CT-based splenic volume was 167.0 (124.9 to 224.6) ml, with a substantial agreement for inter-reader variability (CCC [concordance correlation coefficient]:0.997, 95%CI = 0.994–0.999) and intra-reader variability (CCC:0.997, 95%CI = 0.996–0.998). Baseline patient characteristics are detailed in Table 1.
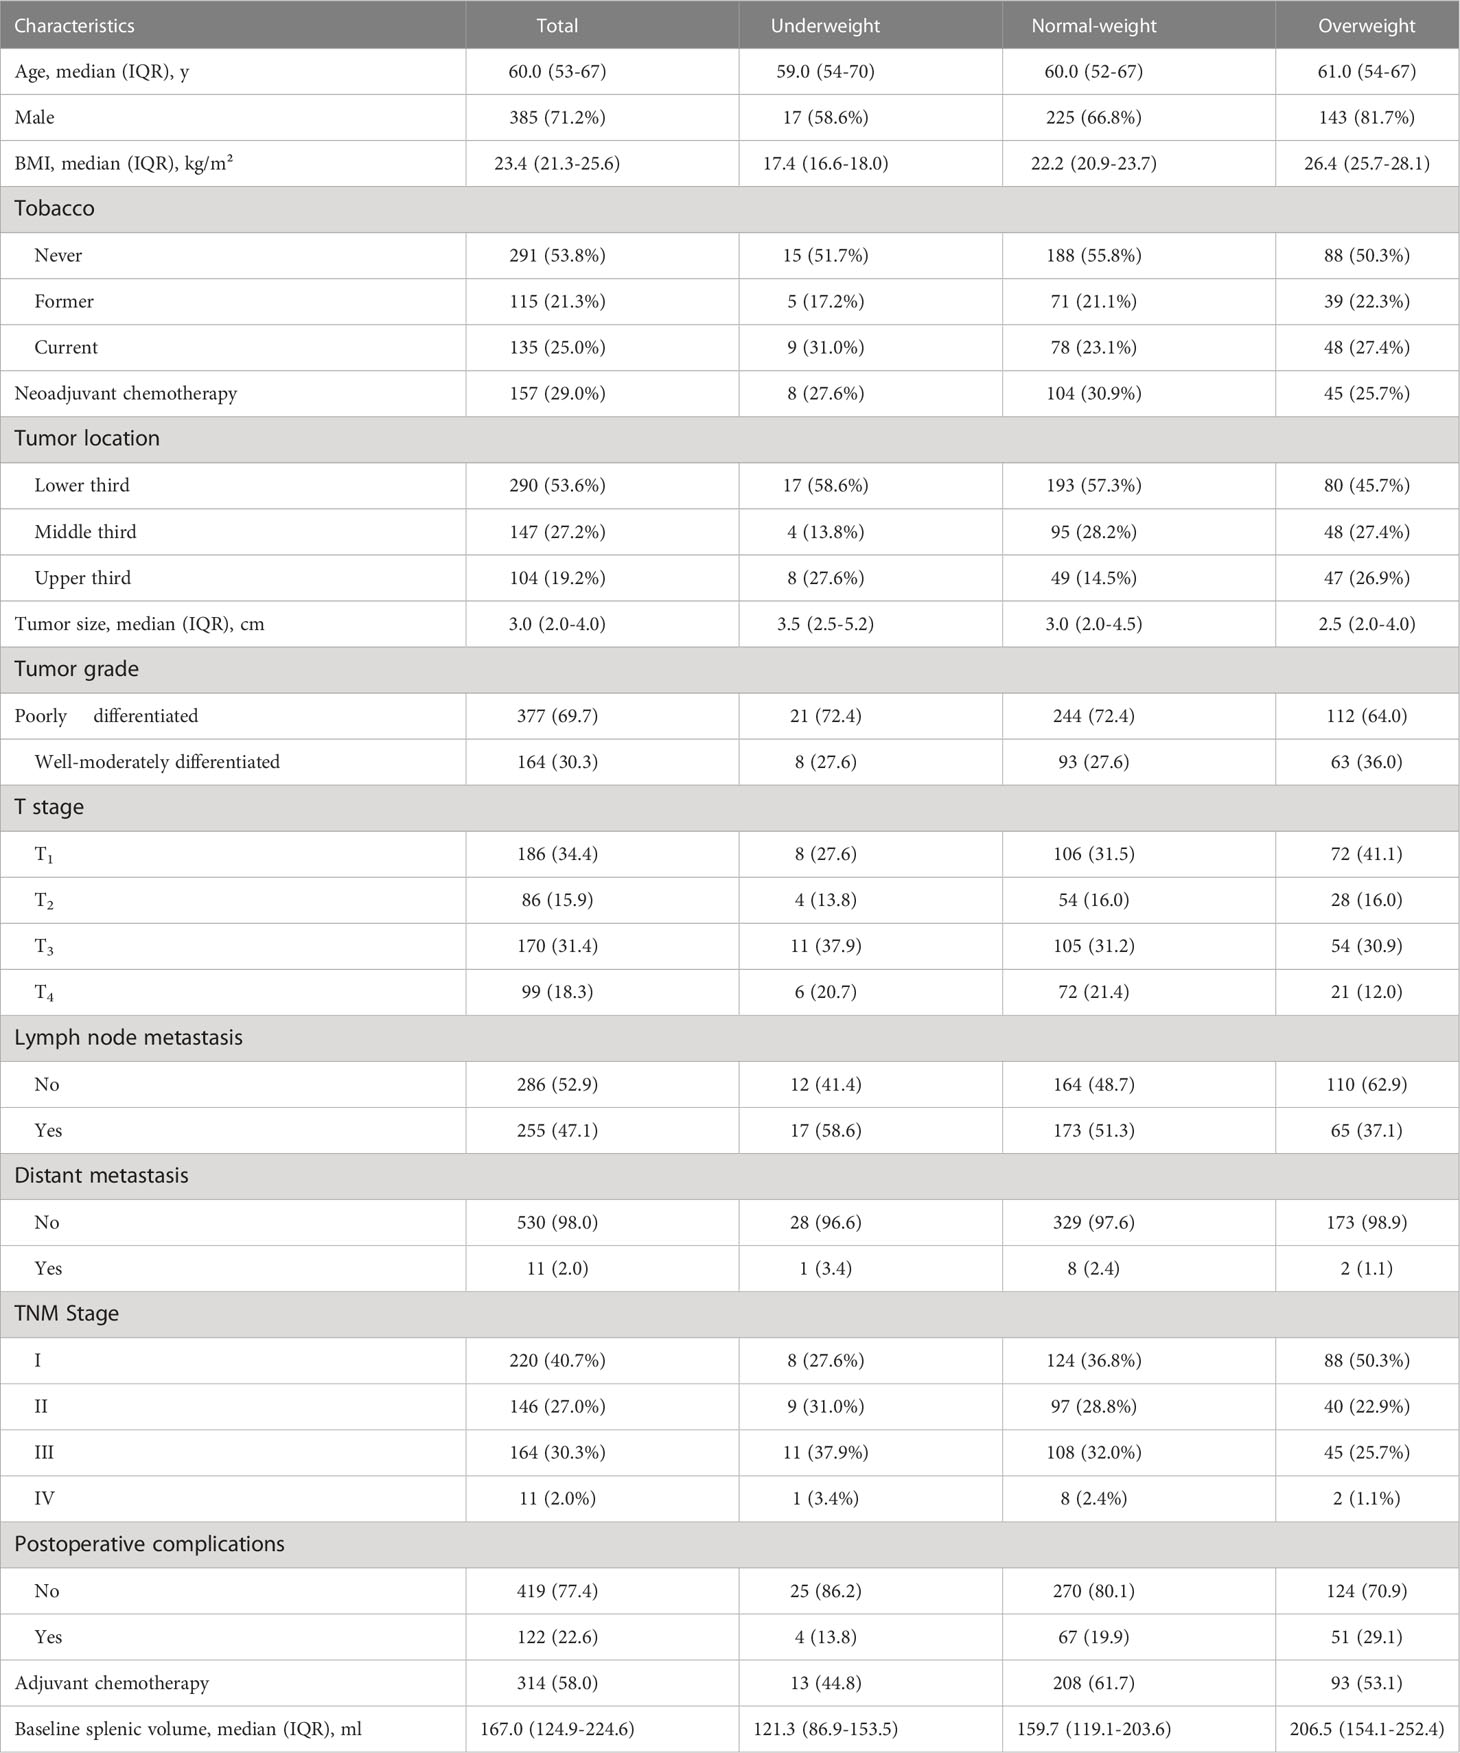
Table 1 Patient characteristics.
Based on the BMI stratification, there were 32.3%, 62.3% and 5.4% patients in the overweight, normal-weight and underweight group, respectively. Underweight, normal weight and overweight patients not only showed different splenic volume (median 121.3 ml vs 159.7 ml vs 206.5 ml, p<0.001) (Figure 2A), but also different long-term survival patterns (Figure 2B). Consistent with a large cohort study of the prognostic effect of BMI in gastric cancer (35), the survival curves in our study showed that the overweight patients were associated with more favorable clinical outcome, followed by normal-weight and underweight patients (Figure 2B). To analyze the prognostic effects of different splenic volume in patients of comparable body size, we divided the study population into underweight (<18.50kg/m²), normal-weight (18.5-24.99 kg/m²) and overweight (≥25.00kg/m²) to study the survival differences between high SV and low SV in each BMI subgroup independently (Table 1).
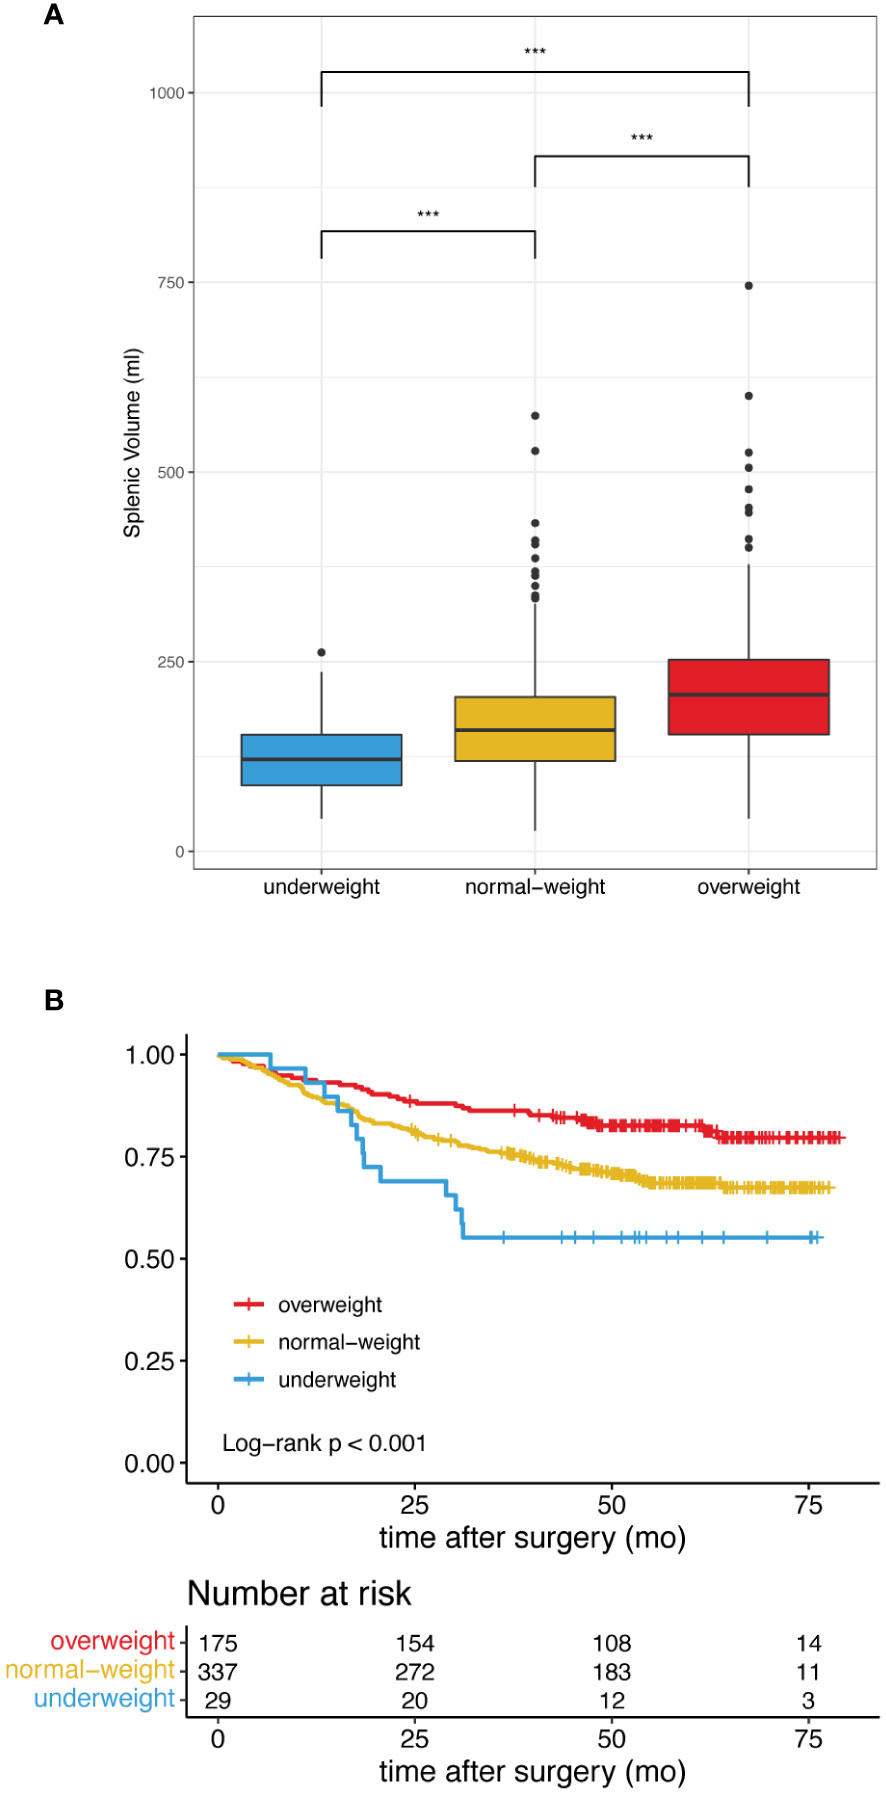
Figure 2 Difference of splenic volume and overall survival in patients classified as underweight, normal-weight and overweight. (A) High BMI is associated with Increased splenic volume. *** indicates p< 0.001. (B) Patients with high BMI showed improved overall survival.
Survival analysis
In our pre-analysis of all patients, splenic volume was not associated with OS in the univariate analysis (Supplementary Table 1; Supplementary Figure 2A). However, splenic volume was revealed as a significant prognostic factor in multivariate analysis (Supplementary Table 1). As the high BMI associated with high SV was strongly associated with favorable prognosis (Supplementary Figure 2B), this led us to speculate that the prognostic effect of SV could be masked by BMI. Thus, we divided the total patients into three BMI groups. In underweight, normal-weight and overweight patients, we divided the patients according to median splenic volume and found no significant difference in survival (Supplementary Figure 3). Next, we dichotomized the splenic volume into high SV and low SV based on the optimal cutoff of 138 ml, 215 ml and 185 ml, respectively, by identifying the maximum statistics (Supplementary Figure 4). High splenic volume was significantly associated with OS, with HR of 3.15 (95% CI, 1.03-9.58) in underweight, 1.55 (95% CI, 1.01-2.39) in normal-weight and 2.80 (95% CI, 1.21-6.47) in overweight patients (Figures 3A-C). The prognostic effect of high splenic volume was further validated by multivariate Cox analysis. In the underweight group, however, limited numbers (n=29) precluded us from conducting multivariate analysis for this group. As we further performed analyses in the normal-weight and overweight group, we found that in normal-weight group, high splenic volume was independently associated with a greater risk of death (HR: 1.86, 95% CI: 1.15-3.02, p=0.012) (Table 2). In overweight group, high splenic volume also remained an independent factor of OS (HR: 3.55, 95% CI: 1.36-9.26, p=0.010) (Table 3). Further, when the patients were divided according to TNM stage, the prognostic effect of high splenic volume was more prominent in stage III-IV patients (Supplementary Figure 5).
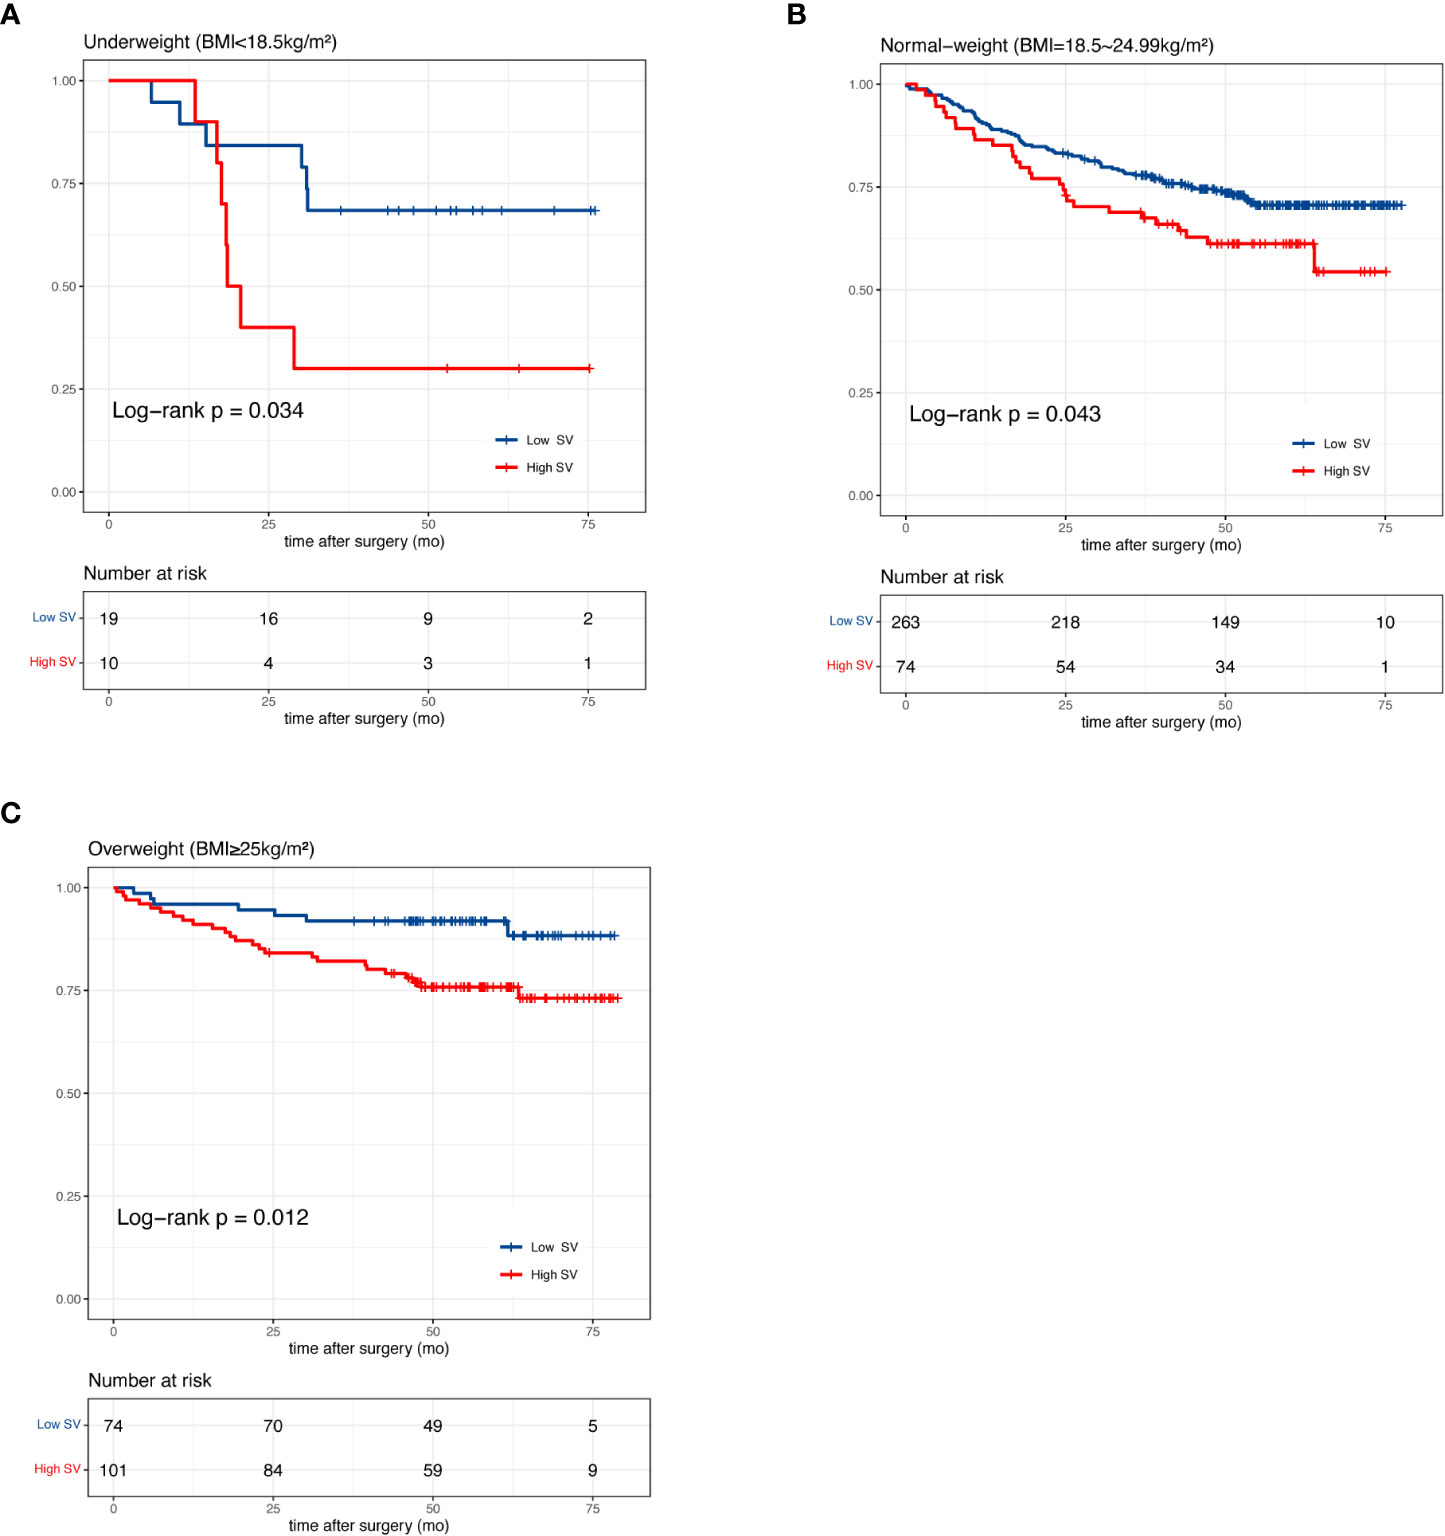
Figure 3 Kaplan-Meier curves of patients with high and low splenic volume in (A) underweight (B) normal-weight and (C) overweight patients.
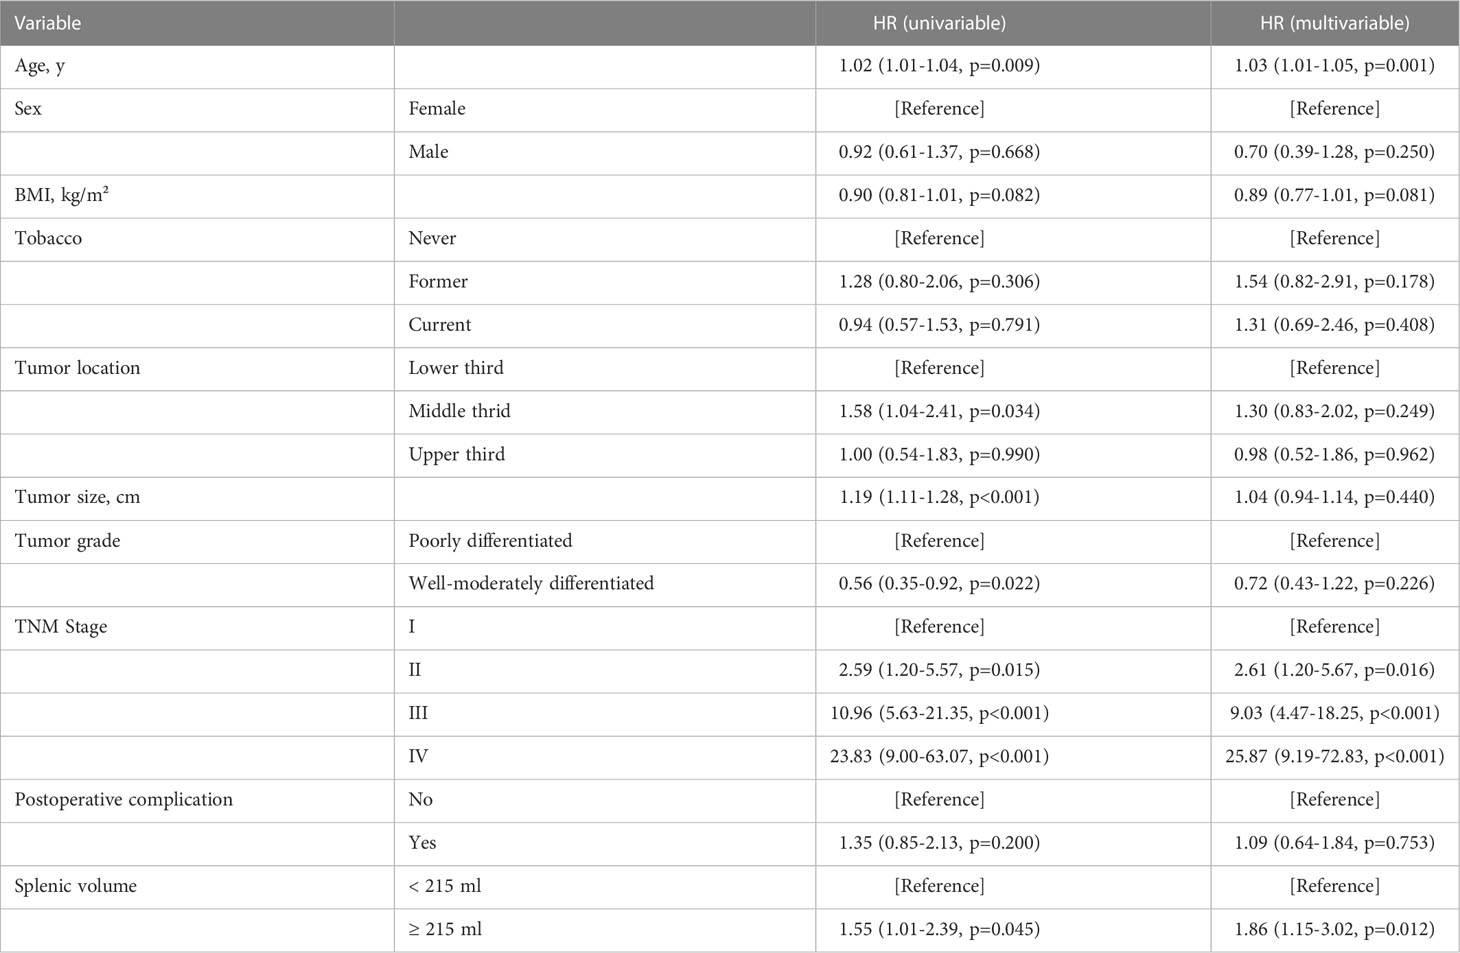
Table 2 Multivariate Cox analysis for OS in normal-weight patients.

Table 3 Multivariate Cox analysis for OS in overweight patients.
Next, we investigated the association of △SV during NAC with overall survival. In 101 patients with available CT after NAC, the median (IQR) SV after NAC was 228 (159 to 291) ml versus 188 (140 to 242) ml before NAC (p<0.001) (Figure 4). An increase of splenic volume was observed in 82 patients, whereas 19 had decreased splenic volume. The median (range) percentage change of SV was 13.8% (-4.1% to 58.2%). The increase of splenic volume was not significantly associated with OS (HR:0.80; 95% CI: 0.37-1.75) (Figure 4).
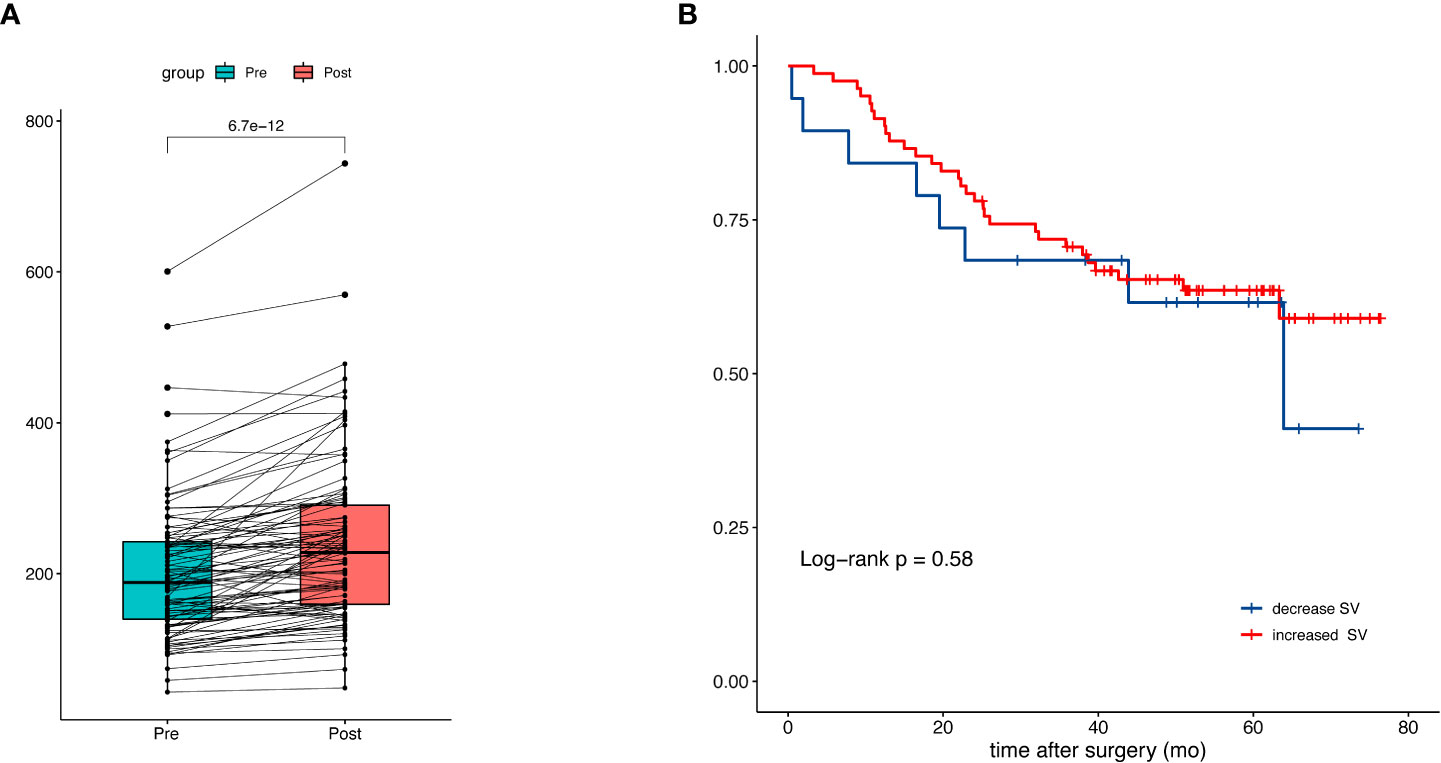
Figure 4 Splenic volume change during neoadjuvant chemotherapy and the prognostic impact. (A) Comparison of splenic volume before and after NAC. (B) Kaplan-Meier curves of patients with increased and decreased splenic volume.
Baseline splenic volume and immune status
Platelet and lymphocyte counts were consistently lower in the high SV patients than low SV patients across the three groups. Neutrophil count was generally higher in high SV patients across three groups, but the difference was only significant in normal-weight patients (median [IQR]: 3.7 [2.9-4.6] vs 3.3 [2.6-4.0], p=0.044). We did not find any significant difference in WBC and monocytes. It should be noted that neutrophil to lymphocyte ratio (NLR), which is a measure of systemic inflammation, was greater in patients with high SV (Supplementary Table 2). Further, we calculated the Spearman’s correlation in the 541 patients as shown in Figure 5. The splenic volume was negatively correlated with lymphocytes (r=-0.21, p<0.001), and positively correlated with NLR (r=0.24, p<0.001). As a reference, the splenic volume was negatively correlated with platelets (r=-0.26, p<0.001). The correlation with neutrophils was slight (r=0.08, p=0.06) (Figure 5). Further, we performed analyses in fifty-six patients for lymphocyte subsets. The characteristic of this group of patients was detailed in Supplementary Table 3. The SV was negatively correlated with CD4+T cells (r=-0.27, p=0.041) and NK cells (r=-0.30, p=0.025) while the correlation with CD8+T cells and B cells were not significant (Supplementary Figure 6).

Figure 5 Correlation of splenic volume (ml) and lymphocytes (*10^9/L), neutrophils (*10^9/L), platelets (*10^9/L) and NLR (neutrophil-to-lymphocte ratio).
Discussion
To our knowledge, this is the first study to investigate the association between baseline splenic volume and the clinical outcome in patients with gastric cancer. The main finding is that patients with low splenic volume had longer overall survival than patients with high splenic volume in a given range of BMI. The negative effect of splenomegaly for overall survival was independent of other prognostic factors, such as age, tumor size and pathological stage. Furthermore, we found a remarkably inverse correlation between baseline splenic volume and the number of circulating lymphocytes. In a subgroup of patients, we found splenic volume tended to inversely correlate with CD4+T cells and NK cells.
Studies have focused on the splenic volume in a few malignancies. In metastatic colorectal cancer, splenic volume > 180 ml was associated with poor PFS (29). In NSCLC, splenic volume > 194 ml was associated with both poor PFS and poor OS (30). Our study supports the prognostic role of splenic volume in gastric cancer. Although splenic volume is proportional to BMI, our finding is unlikely to be biased by the effect of BMI. Gastric cancer patients with higher BMI consistently showed favorable prognosis in our study and other researches (35–38). Gastrectomy can lead to weight loss in patients due to decreased gastric volume and hormone changes. The underlying cause of better prognosis for higher BMI might be related to achieving ideal body weight after gastrectomy and thus better condition in the long term. Excess adipose tissue could also serve as an energy reserve and confers a survival advantage in times of stress and diet restriction. As there is an evident survival advantage with higher BMI, one should have expected a better rather than worse prognosis for patients with high SV instead of the opposite. We found that the cutoff in our study was smaller for underweight patients (138 ml), however, cutoff values reversed for “normal weight” (215 ml) and “overweight” (185 ml) patients. This could be caused by the different composition of the two groups as the overweight group was characterized by less advanced stage patients, and patients with high BMI might have distinct physiology compared with low BMI patients during tumor development. It is possible that these factors could affect the cutoff selection. On the other hand, the median value of splenic volume did not associate with overall survival in our pre-analysis. And despite the positive results with the optimal cutoff values, it is possible that neither the median nor the optimal cutoff could reveal the biologically meaningful classifications. Studies would be warranted to select a more reasonable threshold for splenic volume. It should be acknowledged in our study that the cutoff points should not be translated into risk stratification in the clinical setting, but rather, a reflection of the potential immunosuppressive role of the spleen in gastric cancer patients.
In this study, we also observed a majority of patients underwent spleen enlargement during chemotherapy. The proportion of patients with increased splenic volume during neoadjuvant chemotherapy was similar to that in a previous report of coloretal cancer (39). A known mechanism is chemotherapy-induced hepatic sinusoidal injury, which can result in portal hypertension and the presentation of splenomegaly (39). In spite of this, our study herein showed that the increase in splenic volume does not have a significant impact on prognosis.
It has been found that splenic hematopoietic activity is an important source of tumor-promoting myeloid cells in cancer. In animal models, it was found that the tumor induced an expansion of monocytes with features of myeloid progenitors in a niche of spleen (marginal zone), in which these cells cross-present tumor antigens to memory CD8+T cells and caused immune tolerization (40). It was also discovered that tumor enhanced the capacity of the spleen to recruit granulocyte–macrophage progenitors, which subsequently differentiated into potent myeloid-derived suppressor cells (MDSCs). Splenectomy not only dampened the immunosuppressive function of the myeloid cells but also increased the frequency of infiltrating cytotoxic T cell in tumor microenvironment (41). More recently, it has been identified that a population of erythroid progenitor cells (CD71+TER119+) became dominant in the spleen after tumor establishment, closely resembled MDSCs in transcriptome and impaired effector T cell functions in a similar immunosuppressive way (42). Further, the expansion of CD71+TER119+ erythroid cells in the spleen could be triggered by inflammation-stress and express immune checkpoint molecules, infiltrate tumors, and promote tumor growth (43). Taken together, the spleen can be viewed as a crucial site for extramedullary hematopoiesis and an origin of myeloid lineage with potent immunosuppressive capacities in the context of cancer.
Consistent with the immunosuppressive role of the spleen found in animal studies, we observed an altered peripheral immunity related to the increasing of splenic volume in our study. Neutrophil-to-lymphocyte ratio (NLR) is a negative prognostic indicator in various cancer types (44), as well as a predictor of response to immunotherapy and clinical benefits (45). NLR is also a well defined prognostic index in gastric cancer (46). And a recent study revealed that NLR predicts prognosis in metastatic gastric cancer treated with PD1 inhibitor (47).Neutrophilia is a hallmark of the innate immune response including phagocytosis, release of a variety of cytokines and production of molecular mediators, while lymphocytopenia is a reflection of depressed adaptive immune response, the combination of which measures the intensity of immune-inflammatory response and stress reaction to cancer (48). In our study, we found a more robust association of the splenic volume with lymphocytopenia, indicating a close relationship between the splenic volume and the adaptive arm of the immune system. We also studied the association of splenic volume with two important lymphocyte subsets, CD4+ and CD8+T cells in a small group of patients. While CD8+T cells have powerful killing effects on cancer cells (49), CD4+T cells help CD8+ T cells priming and maturation, so CD4+ T cells must present in the tumor microenvironment for a successful antitumor response (50). It was found that in immunotherapy of gastrointestinal cancer, the decrease of circulating CD4+T cell and CD8+T cell after the first dose of ICIs could indicate poor survival in patients (51). Thus, more emphasis should be put on circulating lymphocyte subsets, especially in the era of immunotherapy. Although we found an inverse correlation between splenic volume and CD4+ T cell counts, this was only observed in a group with limited sample size, and more comprehensive studies that include larger cohorts would be needed to support this association.
As an innate immune cell, NK cell is now regarded as a bridge linking the innate and adaptive immunity as it shapes the adaptive immune response by secreting cytokines (52). A growing number of studies suggested that NK cells can be educated during development, possess antigen-specific receptors, undergo clonal expansion and acquire immunological memory (53). Although high circulating NK cell count was associated with better OS in gastric cancer (23), the prognostic role of NK cells was conflicted in various cancers and warrant further study (54–57).
In conclusion, our study revealed a prognostic role of high splenic volume in gastric cancer and the association of splenic volume with blood immune cells. This is in line with the idea that immune response is coordinated across different tissues, and represents a possible biomarker for immunotherapy benefits.
Data availability statement
The datasets presented in this article are not readily available because the data contain potentially identifying patient information. Requests to access the datasets should be directed to WK, a2FuZ3dtQHB1bWNoLmNu.
Ethics statement
The studies involving human participants were reviewed and approved by Institutional Review Boards of Peking Union Medical College Hospital. Written informed consent for participation was not required for this study in accordance with the national legislation and the institutional requirements.
Author contributions
Conceptualization, XY, JY and WK; Data curation, ZZ and ZL; Formal analysis, ZZ, ZL, JL, JS and MM; Writing – original draft, ZZ; Writing – review & editing, ZL, JL, JS, MM, XY, JY and WK.
Funding
National High Level Hospital Clinical Research Funding (No. 2022-PUMCH-C-048 & No. 2022-PUMCH-B-005).
Conflict of interest
The authors declare that the research was conducted in the absence of any commercial or financial relationships that could be construed as a potential conflict of interest.
Publisher’s note
All claims expressed in this article are solely those of the authors and do not necessarily represent those of their affiliated organizations, or those of the publisher, the editors and the reviewers. Any product that may be evaluated in this article, or claim that may be made by its manufacturer, is not guaranteed or endorsed by the publisher.
Supplementary material
The Supplementary Material for this article can be found online at: https://www.frontiersin.org/articles/10.3389/fonc.2022.1065716/full#supplementary-material
Supplementary Figure 1 | Example of splenic volumetry on a CT scan image. A 54-year-old man (BMI: 24.5kg/m2) underwent CT scan for baseline evaluation of gastric cancer. The CT scan shows the wedge-shaped spleen on the axial slice. By manually tracing the boundary of the spleen, the area that was enclosed could be calculated, with the slice thickness (A). The volume of every slice was added up to represent the total volume (B). The splenic volume measured on this CT was 170.87 ml.
Supplementary Figure 2 | Kaplan-Meier plot of patients with high and low SV stratified by median value (n=541).
Supplementary Figure 3 | Kaplan-Meier curves of patients stratified by median splenic volume in (A) underweight (B) normal-weight and (C) overweight group.
Supplementary Figure 4 | Selection of the optimal cutoff point using maxstat R package. In underweight (A), normal-weight (B) and overweight (C) group, patients were divided into two groups based on a candidate splenic volume cutoff. The X-axis indicates the candidate cutoff point of splenic volume (ml). The Y-axis reports the corresponding standardized log-rank statistic values. Different splenic volume were examined as candidate cutoff points and the value that best separates survival curves was selected as the optimal cutoff. The vertical dotted line indicated the splenic volume that generated the maximum standardized log-rank statistics and minimum p value. As is shown in the plots, the optimal cutoffs for underweight, normal-weight and overweight group were 138 ml (A), 215 ml (B) and 185 ml (C), respectively.
Supplementary Figure 5 | Kaplan-Meier curves of patients with high and low SV stratified by TNM stage in (A) underweight (B) normal-weight and (C) overweight group.
Supplementary Figure 6 | Correlation of splenic volume and lymphocyte subsets.
References
1. Sung H, Ferlay J, Siegel RL, Laversanne M, Soerjomataram I, Jemal A, et al. Global cancer statistics 2020: GLOBOCAN estimates of incidence and mortality worldwide for 36 cancers in 185 countries. CA Cancer J Clin (2021) 71(3):209–49. doi: 10.3322/caac.21660
2. Chen ZD, Zhang PF, Xi HQ, Wei B, Chen L, Tang Y. Recent advances in the diagnosis, staging, treatment, and prognosis of advanced gastric cancer: A literature review. Front Med (Lausanne) (2021) 8:744839. doi: 10.3389/fmed.2021.744839
3. Takei S, Kawazoe A, Shitara K. The new era of immunotherapy in gastric cancer. Cancers (Basel) (2022) 14(4):1054. doi: 10.3390/cancers14041054
4. Kang YK, Boku N, Satoh T, Ryu MH, Chao Y, Kato K, et al. Nivolumab in patients with advanced gastric or gastro-oesophageal junction cancer refractory to, or intolerant of, at least two previous chemotherapy regimens (ONO-4538-12, ATTRACTION-2): a randomised, double-blind, placebo-controlled, phase 3 trial. Lancet (2017) 390(10111):2461–71. doi: 10.1016/S0140-6736(17)31827-5
5. Seiwert TY, Burtness B, Mehra R, Weiss J, Berger R, Eder JP, et al. Safety and clinical activity of pembrolizumab for treatment of recurrent or metastatic squamous cell carcinoma of the head and neck (KEYNOTE-012): an open-label, multicentre, phase 1b trial. Lancet Oncol (2016) 17(7):956–65. doi: 10.1016/S1470-2045(16)30066-3
6. Fuchs CS, Doi T, Jang RW, Muro K, Satoh T, Machado M, et al. Safety and efficacy of pembrolizumab monotherapy in patients with previously treated advanced gastric and gastroesophageal junction cancer: Phase 2 clinical KEYNOTE-059 trial. JAMA Oncol (2018) 4(5):e180013. doi: 10.1001/jamaoncol.2018.0013
7. Shitara K, Ozguroglu M, Bang YJ, Di Bartolomeo M, Mandala M, Ryu MH, et al. Pembrolizumab versus paclitaxel for previously treated, advanced gastric or gastro-oesophageal junction cancer (KEYNOTE-061): a randomised, open-label, controlled, phase 3 trial. Lancet (2018) 392(10142):123–33. doi: 10.1016/S0140-6736(18)31257-1
8. Shitara K, Van Cutsem E, Bang YJ, Fuchs C, Wyrwicz L, Lee KW, et al. Efficacy and safety of pembrolizumab or pembrolizumab plus chemotherapy vs chemotherapy alone for patients with first-line, advanced gastric cancer: The KEYNOTE-062 phase 3 randomized clinical trial. JAMA Oncol (2020) 6(10):1571–80. doi: 10.1001/jamaoncol.2020.3370
9. Kim ST, Cristescu R, Bass AJ, Kim KM, Odegaard JI, Kim K, et al. Comprehensive molecular characterization of clinical responses to PD-1 inhibition in metastatic gastric cancer. Nat Med (2018) 24(9):1449–58. doi: 10.1038/s41591-018-0101-z
10. Wang F, Wei XL, Wang FH, Xu N, Shen L, Dai GH, et al. Safety, efficacy and tumor mutational burden as a biomarker of overall survival benefit in chemo-refractory gastric cancer treated with toripalimab, a PD-1 antibody in phase Ib/II clinical trial NCT02915432. Ann Oncol (2019) 30(9):1479–86. doi: 10.1093/annonc/mdz197
11. Kubota Y, Kawazoe A, Sasaki A, Mishima S, Sawada K, Nakamura Y, et al. The impact of molecular subtype on efficacy of chemotherapy and checkpoint inhibition in advanced gastric cancer. Clin Cancer Res (2020) 26(14):3784–90. doi: 10.1158/1078-0432.CCR-20-0075
12. Qiu MZ, He CY, Yang DJ, Zhou DL, Zhao BW, Wang XJ, et al. Observational cohort study of clinical outcome in Epstein-Barr virus associated gastric cancer patients. Ther Adv Med Oncol (2020) 12:1–13. doi: 10.1177/1758835920937434
13. Bai Y, Xie T, Wang Z, Tong S, Zhao X, Zhao F, et al. Efficacy and predictive biomarkers of immunotherapy in Epstein-Barr virus-associated gastric cancer. J Immunother Cancer (2022) 10(3):1–10. doi: 10.1136/jitc-2021-004080
14. Kim TS, da Silva E, Coit DG, Tang LH. Intratumoral immune response to gastric cancer varies by molecular and histologic subtype. Am J Surg Pathol (2019) 43(6):851–60. doi: 10.1097/PAS.0000000000001253
15. Samstein RM, Lee CH, Shoushtari AN, Hellmann MD, Shen R, Janjigian YY, et al. Tumor mutational load predicts survival after immunotherapy across multiple cancer types. Nat Genet (2019) 51(2):202–6. doi: 10.1038/s41588-018-0312-8
16. Spitzer MH, Carmi Y, Reticker-Flynn NE, Kwek SS, Madhireddy D, Martins MM, et al. Systemic immunity is required for effective cancer immunotherapy. Cell (2017) 168(3):487–502.e15. doi: 10.1016/j.cell.2016.12.022
17. Hiam-Galvez KJ, Allen BM, Spitzer MH. Systemic immunity in cancer. Nat Rev Cancer (2021) 21(6):345–59. doi: 10.1038/s41568-021-00347-z
18. Yost KE, Satpathy AT, Wells DK, Qi Y, Wang C, Kageyama R, et al. Clonal replacement of tumor-specific T cells following PD-1 blockade. Nat Med (2019) 25(8):1251–9. doi: 10.1038/s41591-019-0522-3
19. Wu TD, Madireddi S, de Almeida PE, Banchereau R, Chen YJ, Chitre AS, et al. Peripheral T cell expansion predicts tumour infiltration and clinical response. Nature (2020) 579(7798):274–8. doi: 10.1038/s41586-020-2056-8
20. Bracci L, Schiavoni G, Sistigu A, Belardelli F. Immune-based mechanisms of cytotoxic chemotherapy: implications for the design of novel and rationale-based combined treatments against cancer. Cell Death Differ (2014) 21(1):15–25. doi: 10.1038/cdd.2013.67
21. Galluzzi L, Humeau J, Buque A, Zitvogel L, Kroemer G. Immunostimulation with chemotherapy in the era of immune checkpoint inhibitors. Nat Rev Clin Oncol (2020) 17(12):725–41. doi: 10.1038/s41571-020-0413-z
22. Li Y, Wei Y, He Q, Wang X, Fan C, Li G. Clinicopathological and prognostic significance of high circulating lymphocyte ratio in patients receiving neoadjuvant chemotherapy for advanced gastric cancer. Sci Rep (2018) 8(1):6223. doi: 10.1038/s41598-017-18705-z
23. Pernot S, Terme M, Radosevic-Robin N, Castan F, Badoual C, Marcheteau E, et al. Infiltrating and peripheral immune cell analysis in advanced gastric cancer according to the Lauren classification and its prognostic significance. Gastric Cancer (2020) 23(1):73–81. doi: 10.1007/s10120-019-00983-3
24. Allen BM, Hiam KJ, Burnett CE, Venida A, DeBarge R, Tenvooren I, et al. Systemic dysfunction and plasticity of the immune macroenvironment in cancer models. Nat Med (2020) 26(7):1125–34. doi: 10.1038/s41591-020-0892-6
25. Wall I, Boulat V, Shah A, Blenman KRM, Wu Y, Alberts E, et al. Leveraging the dynamic immune environment triad in patients with breast cancer: Tumour, lymph node, and peripheral blood. Cancers (Basel) (2022) 14(18):4505. doi: 10.3390/cancers14184505
26. Steenbrugge J, De Jaeghere EA, Meyer E, Denys H, De Wever O. Splenic hematopoietic and stromal cells in cancer progression. Cancer Res (2021) 81(1):27–34. doi: 10.1158/0008-5472.CAN-20-2339
27. Cortez-Retamozo V, Etzrodt M, Newton A, Rauch PJ, Chudnovskiy A, Berger C, et al. Origins of tumor-associated macrophages and neutrophils. Proc Natl Acad Sci U S A. (2012) 109(7):2491–6. doi: 10.1073/pnas.1113744109
28. Wu C, Hua Q, Zheng L. Generation of myeloid cells in cancer: The spleen matters. Front Immunol (2020) 11:1126. doi: 10.3389/fimmu.2020.01126
29. Niogret J, Limagne E, Thibaudin M, Blanc J, Bertaut A, Le Malicot K, et al. Baseline splenic volume as a prognostic biomarker of FOLFIRI efficacy and a surrogate marker of MDSC accumulation in metastatic colorectal carcinoma. Cancers (Basel) (2020) 12(6):1429. doi: 10.3390/cancers12061429
30. Galland L, Lecuelle J, Favier L, Fraisse C, Lagrange A, Kaderbhai C, et al. Splenic volume as a surrogate marker of immune checkpoint inhibitor efficacy in metastatic non small cell lung cancer. Cancers (Basel) (2021) 13(12):3020. doi: 10.3390/cancers13123020
31. Obesity: preventing and managing the global epidemic. report of a WHO consultation Vol. 894. World Health Organ Tech Rep Ser (2000) p. 1–253.
32. Dindo D, Demartines N, Clavien PA. Classification of surgical complications: a new proposal with evaluation in a cohort of 6336 patients and results of a survey. Ann Surg (2004) 240(2):205–13. doi: 10.1097/01.sla.0000133083.54934.ae
33. Clavien PA, Barkun J, de Oliveira ML, Vauthey JN, Dindo D, Schulick RD, et al. The clavien-dindo classification of surgical complications: five-year experience. Ann Surg (2009) 250(2):187–96. doi: 10.1097/SLA.0b013e3181b13ca2
34. Hothorn T, Lausen B. On the exact distribution of maximally selected rank statistics. Comput Statist Data Anal (2003) 43:121–37. doi: 10.1016/S0167-9473(02)00225-6
35. Lee JH, Park B, Joo J, Kook MC, Kim YI, Lee JY, et al. Body mass index and mortality in patients with gastric cancer: a large cohort study. Gastric Cancer (2018) 21(6):913–24. doi: 10.1007/s10120-018-0818-x
36. Wada T, Kunisaki C, Ono HA, Makino H, Akiyama H, Endo I. Implications of BMI for the prognosis of gastric cancer among the Japanese population. Dig Surg (2015) 32(6):480–6. doi: 10.1159/000440654
37. Liu BZ, Tao L, Chen YZ, Li XZ, Dong YL, Ma YJ, et al. Preoperative body mass index, blood albumin and triglycerides predict survival for patients with gastric cancer. PloS One (2016) 11(6):e0157401. doi: 10.1371/journal.pone.0157401
38. Feng F, Zheng G, Guo X, Liu Z, Xu G, Wang F, et al. Impact of body mass index on surgical outcomes of gastric cancer. BMC Cancer (2018) 18(1):151. doi: 10.1186/s12885-018-4063-9
39. Overman MJ, Maru DM, Charnsangavej C, Loyer EM, Wang H, Pathak P, et al. Oxaliplatin-mediated increase in spleen size as a biomarker for the development of hepatic sinusoidal injury. J Clin Oncol (2010) 28(15):2549–55. doi: 10.1200/JCO.2009.27.5701
40. Ugel S, Peranzoni E, Desantis G, Chioda M, Walter S, Weinschenk T, et al. Immune tolerance to tumor antigens occurs in a specialized environment of the spleen. Cell Rep (2012) 2(3):628–39. doi: 10.1016/j.celrep.2012.08.006
41. Wu C, Ning H, Liu M, Lin J, Luo S, Zhu W, et al. Spleen mediates a distinct hematopoietic progenitor response supporting tumor-promoting myelopoiesis. J Clin Invest (2018) 128(8):3425–38. doi: 10.1172/JCI97973
42. Zhao L, He R, Long H, Guo B, Jia Q, Qin D, et al. Late-stage tumors induce anemia and immunosuppressive extramedullary erythroid progenitor cells. Nat Med (2018) 24(10):1536–44. doi: 10.1038/s41591-018-0205-5
43. Sano Y, Yoshida T, Choo MK, Jimenez-Andrade Y, Hill KR, Georgopoulos K, et al. Multiorgan signaling mobilizes tumor-associated erythroid cells expressing immune checkpoint molecules. Mol Cancer Res (2021) 19(3):507–15. doi: 10.1158/1541-7786.MCR-20-0746
44. Templeton AJ, McNamara MG, Seruga B, Vera-Badillo FE, Aneja P, Ocana A, et al. Prognostic role of neutrophil-to-lymphocyte ratio in solid tumors: a systematic review and meta-analysis. J Natl Cancer Inst (2014) 106(6):dju124. doi: 10.1093/jnci/dju124
45. Valero C, Lee M, Hoen D, Weiss K, Kelly DW, Adusumilli PS, et al. Pretreatment neutrophil-to-lymphocyte ratio and mutational burden as biomarkers of tumor response to immune checkpoint inhibitors. Nat Commun (2021) 12(1):729. doi: 10.1038/s41467-021-20935-9
46. Hu ZD, Huang YL, Qin BD, Tang QQ, Yang M, Ma N, et al. Prognostic value of neutrophil to lymphocyte ratio for gastric cancer. Ann Transl Med (2015) 3(4):50. doi: 10.3978/j.issn.2305-5839.2015.03.26
47. Gou M, Qu T, Wang Z, Yan H, Si Y, Zhang Y, et al. Neutrophil-to-Lymphocyte ratio (NLR) predicts PD-1 inhibitor survival in patients with metastatic gastric cancer. J Immunol Res (2021) 2021:2549295. doi: 10.1155/2021/2549295
48. Zahorec R. Neutrophil-to-lymphocyte ratio, past, present and future perspectives. Bratisl Lek Listy. (2021) 122(7):474–88. doi: 10.4149/BLL_2021_078
49. Raskov H, Orhan A, Christensen JP, Gogenur I. Cytotoxic CD8(+) T cells in cancer and cancer immunotherapy. Br J Cancer (2021) 124(2):359–67. doi: 10.1038/s41416-020-01048-4
50. Alspach E, Lussier DM, Miceli AP, Kizhvatov I, DuPage M, Luoma AM, et al. MHC-II neoantigens shape tumour immunity and response to immunotherapy. Nature (2019) 574(7780):696–701. doi: 10.1038/s41586-019-1671-8
51. Liu C, Wang Y, Li S, Jiao X, Zou J, Wang Z, et al. Early change in peripheral CD4(+) T cells associated with clinical outcomes of immunotherapy in gastrointestinal cancer. Immunotherapy (2021) 13(1):55–66. doi: 10.2217/imt-2020-0068
52. Wang F, Lau JKC, Yu J. The role of natural killer cell in gastrointestinal cancer: killer or helper. Oncogene (2021) 40(4):717–30. doi: 10.1038/s41388-020-01561-z
53. Sun JC, Lanier LL. NK cell development, homeostasis and function: parallels with CD8(+) T cells. Nat Rev Immunol (2011) 11(10):645–57. doi: 10.1038/nri3044
54. Liu X, Ran R, Shao B, Rugo HS, Yang Y, Hu Z, et al. Combined peripheral natural killer cell and circulating tumor cell enumeration enhance prognostic efficiency in patients with metastatic triple-negative breast cancer. Chin J Cancer Res (2018) 30(3):315–26. doi: 10.21147/j.issn.1000-9604.2018.03.04
55. Mazzaschi G, Facchinetti F, Missale G, Canetti D, Madeddu D, Zecca A, et al. The circulating pool of functionally competent NK and CD8+ cells predicts the outcome of anti-PD1 treatment in advanced NSCLC. Lung Cancer (2019) 127:153–63. doi: 10.1016/j.lungcan.2018.11.038
56. Ottonello S, Genova C, Cossu I, Fontana V, Rijavec E, Rossi G, et al. Association between response to nivolumab treatment and peripheral blood lymphocyte subsets in patients with non-small cell lung cancer. Front Immunol (2020) 11:125. doi: 10.3389/fimmu.2020.00125
Keywords: gastric cancer, spleen, prognosis, immune system, lymphocyte
Citation: Zeng Z, Liu Z, Li J, Sun J, Ma M, Ye X, Yu J and Kang W (2023) Baseline splenic volume as a biomarker for clinical outcome and circulating lymphocyte count in gastric cancer. Front. Oncol. 12:1065716. doi: 10.3389/fonc.2022.1065716
Received: 21 October 2022; Accepted: 28 December 2022;
Published: 30 January 2023.
Edited by:
Ji-Feng Feng, Zhejiang Cancer Hospital, University of (CAS), ChinaReviewed by:
Jose Luis Subiza, Inmunotek SL, SpainRobert J. Canter, University of California, Davis, United States
Copyright © 2023 Zeng, Liu, Li, Sun, Ma, Ye, Yu and Kang. This is an open-access article distributed under the terms of the Creative Commons Attribution License (CC BY). The use, distribution or reproduction in other forums is permitted, provided the original author(s) and the copyright owner(s) are credited and that the original publication in this journal is cited, in accordance with accepted academic practice. No use, distribution or reproduction is permitted which does not comply with these terms.
*Correspondence: Weiming Kang, a2FuZ3dtQHB1bWNoLmNu