 Subhash Chand
 Vikrant Mehta2†
 Anupkumar R. Anvikar
 Harish Chander
95% of researchers rate our articles as excellent or good
Learn more about the work of our research integrity team to safeguard the quality of each article we publish.
Find out more
ORIGINAL RESEARCH article
Front. Oncol. , 09 December 2022
Sec. Breast Cancer
Volume 12 - 2022 | https://doi.org/10.3389/fonc.2022.1058931
Breast cancer remains the most commonly diagnosed cancer worldwide and exhibits a poor prognosis. The induction of genetic changes deregulates several genes that increase the disposal towards this life-threatening disease. CHAC2, a member of the glutathione degrading enzyme family has been shown to suppress gastric and colorectal cancer progression, however, the expression of CHAC2 in breast cancer has not been reported. We did an analysis of CHAC2 expression in breast cancer patients from various online tools like UALCAN, GEPIA2, GENT2, TIMER2, and bcGenExminer v4.8. Further, we used the Kaplan-Meier plotter to establish the significance of CHAC2 in BC patient survival and prognosis while TISIDB and TIMER databases were used to investigate the filtration of immune cells. The results showed that CHAC2 levels were high in breast cancer patients and elevated CHAC2 was associated with low overall survival. Taken together, the results of the present study show that like its paralog CHAC1, CHAC2 may also be an important biomarker and could have a potential therapeutic implication in breast cancer.
As per GLOBOCAN 2021, Breast cancer is now the most commonly diagnosed cancer with more than 2.2 million cases that resulted in close to 0.7 million deaths in the year 2020 (1).
Difficulties in early detection, resistance to conventional chemotherapy, tumor heterogeneity, and the associated side-effects of the treatment are a few among many hurdles that lead to worse prognosis and overall survival (OS) of breast cancer patients thus warranting identification of new biomarkers for early cancer detection and development of novel treatment strategies (2–4). Identifying novel biomarkers responsible for tumor progression may provide a better course of treatment, and may also contribute in improving the prognosis of breast cancer patients (5, 6) Located on chromosome no 2 (2p16.2), Cation transport regulator homolog 2 (CHAC2) is one of the members of the CHAC family that catalyzes the glutathione degradation to 5-oxoproline and cystein-glycine, however with lower catalytic efficiency compared to CHAC1 (7). Cation transport regulator homolog 1 (CHAC1), the other member of the CHAC family was discovered as a proapoptotic component of the unfolded protein response (UPR) pathway (8). The aberrant expression of CHAC1 surprisingly has been linked with both tumor suppression as well as tumor progression (9–13). Liu et al. (14) reported that CHAC2 essentially acted as a tumor suppressor in gastric and colorectal cancer as evident from in vitro and in vivo studies.
We have recently shown that high levels of CHAC1 are associated with increased proliferation, lymph node metastasis, and poor prognosis in breast cancer (15, 16). However, the expression of CHAC2 in breast cancer and its association with the prognosis of breast cancer is unknown. In the present study, we have investigated the transcriptomic data of CHAC2 expression in breast normal-like vs. tumor samples and molecular subtypes. Further online databases (UALCAN, UCSCxena, Enrichr, GEPIA2, and GeneMANIA) deciphered CHAC2 expression in breast cancer through gene ontology studies, interaction, and correlation analysis. Kaplan-Meier plotter analysis established the prognostic signifcance of CHAC2 expression in breast cancer.
Differential analysis of CHAC2 gene expression in breast vs normal tissues was carried out using UALCAN web server (http://ualcan.path.uab.edu) (17), GEPIA2 (http://gepia2.cancer-pku.cn) (18), bc-GenExMiner v4.8 (http://bcgenex.ico.unicancer.fr) (19). A pan-cancer analysis of CHAC2 expression was done with the help of UALCAN, GENT2 (http://gent2.appex.kr/gent2/) (20), TNMplot (https://tnmplot.com/analysis/) (21), and TIMER2.0 (http://timer.cistrome.org/) (22) databases. Further, we utilized UALCAN, bc-GenExMiner v4.8, and GEPIA2 to analyse the CHAC2 gene expression on the basis of various clinicopathological parameters such as molecular subtypes, tumor stages, lymph node metastasis status, age, Nottingham Prognostic index (NPI), and Scarff-Bloom-Richardson (SBR) grading.
The promoter methylation and CHAC2 expression was analysed with UALCAN database according to normal vs tumor samples followed by normal vs molecular subtypes of breast cancer. The analysis of CHAC2 expression with respect to p53 mutation was carried out with the help of UALCAN and bc-GenExMiner v4.8. We further utilized muTarget database which performs the data processing in R statistical environment and uses the TCGA database to acquire RNA-sequencing and mutation data. The database contains 7876 solid tumor samples from 18 diverse tumor types with both somatic mutation and RNA-seq data. Running parameters used to do the analysis were FC>1.4, p < 0.01, and at least 2% mutation prevalence (23).
Analysis of the survival data was executed with Kaplan-Meier plotter (https://kmplot.com/analysis/) which is a widely used tool to evaluate the correlation of genes of interest with survival times based on mRNA, miRNA, or protein expression in more than 30000 samples from 21 tumor types (24). We analyzed the CHAC2 expression (235117_at) in terms of disease mean-free survival (DMFS), overall survival (OS), and relapse-free survival (RFS) from Kaplan-Meier plotter. Further, we used bc-GenExMiner v4.8 and GENT2 database to determine the survival difference between low and high CHAC2 expression groups.
TIMER database is used to investigate the tumor-immune interaction (http://timer.cistrome.org/). TIMER database provides the infiltration of six different immune infiltrates like B cell, CD4+ T cell, CD8+ T cell, neutrophil, macrophage, and dendritic cells. TIMER database was further used to estimate whether the expression of CHAC2 correlated with immune cell infiltration (25). Moreover, it also provides gene expression data, clinical outcomes, somatic mutations, and somatic copy number alterations in various cancers (25). Wilcoxon test is used to calculate the statistical significance of data obtained from this database. Besides TIMER, we also used the TISIDB database (http://cis.hku.hk/TISIDB/index.php) to elucidate the infiltration of various immune cells with respect to CHAC2 expression in Pan-cancer analysis and later with Breast Invasive carcinoma (26).
We obtained top 10 most closely correlated genes from GEPIA2 database and obtained a heat map depicting this correlation with the help of bc-GenExMiner v4.8. Alternatively, the correlation graph of CHAC2 with the most closely correlated gene was generated using UALCAN, GEPIA2, and UCSC Xena database. UCSC Xena (https://xena.ucsc.edu/) can be used to explore multi-omics data from large public TCGA and GDC genomics datasets (27). The expression data of a particular gene can be visualized in terms of expression, DNA methylation, phenotypic annotations, and ATAC-seq signals.
The gene ontology (GO) studies of CHAC2 were done using the Enrichr server (https://maayanlab.cloud/Enrichr/). The signaling pathways and the functional enrichment of co-expressed genes were categorized into biological processes, molecular functions, and cellular components (28, 29).
GeneMANIA database (http://genemania.org) was used to plot the gene interaction network of CHAC2 (30). Maximum resultant genes were set to ‘20’ and maximum resultant attributes were set to ‘10’. Further top 10 correlated genes as obtained from the GEPIA2 database were uploaded as a gene set and another interaction network was obtained.
The different databases to demonstrate the CHAC2 expression in breast cancer. CHAC2 was expressed at high levels in tumor tissues compared to adjacent normal tissues as per UALCAN (Figure 1A) and the GEPIA2 database (Figure 1B). We further looked into the CHAC2 expression patterns using the bcGenexminer database within the adjacent tumor area and the transcript levels of CHAC2 were high in tumor samples compared to adjacent normal and healthy controls (Figure 1C). Subsequently, a pan-cancer analysis of CHAC2 expression in various cancers and we attempted the same by utilizing UALCAN (Figure S1A), TNMplot (Figure S1B), GENT2 (Figure S1C), and TIMER2 (Figure S1D) database to perform the analysis. In summary, we found significantly high CHAC2 expression (p-value <0.0001) in breast tumor cases compared to their normal counterparts (Figure 1).
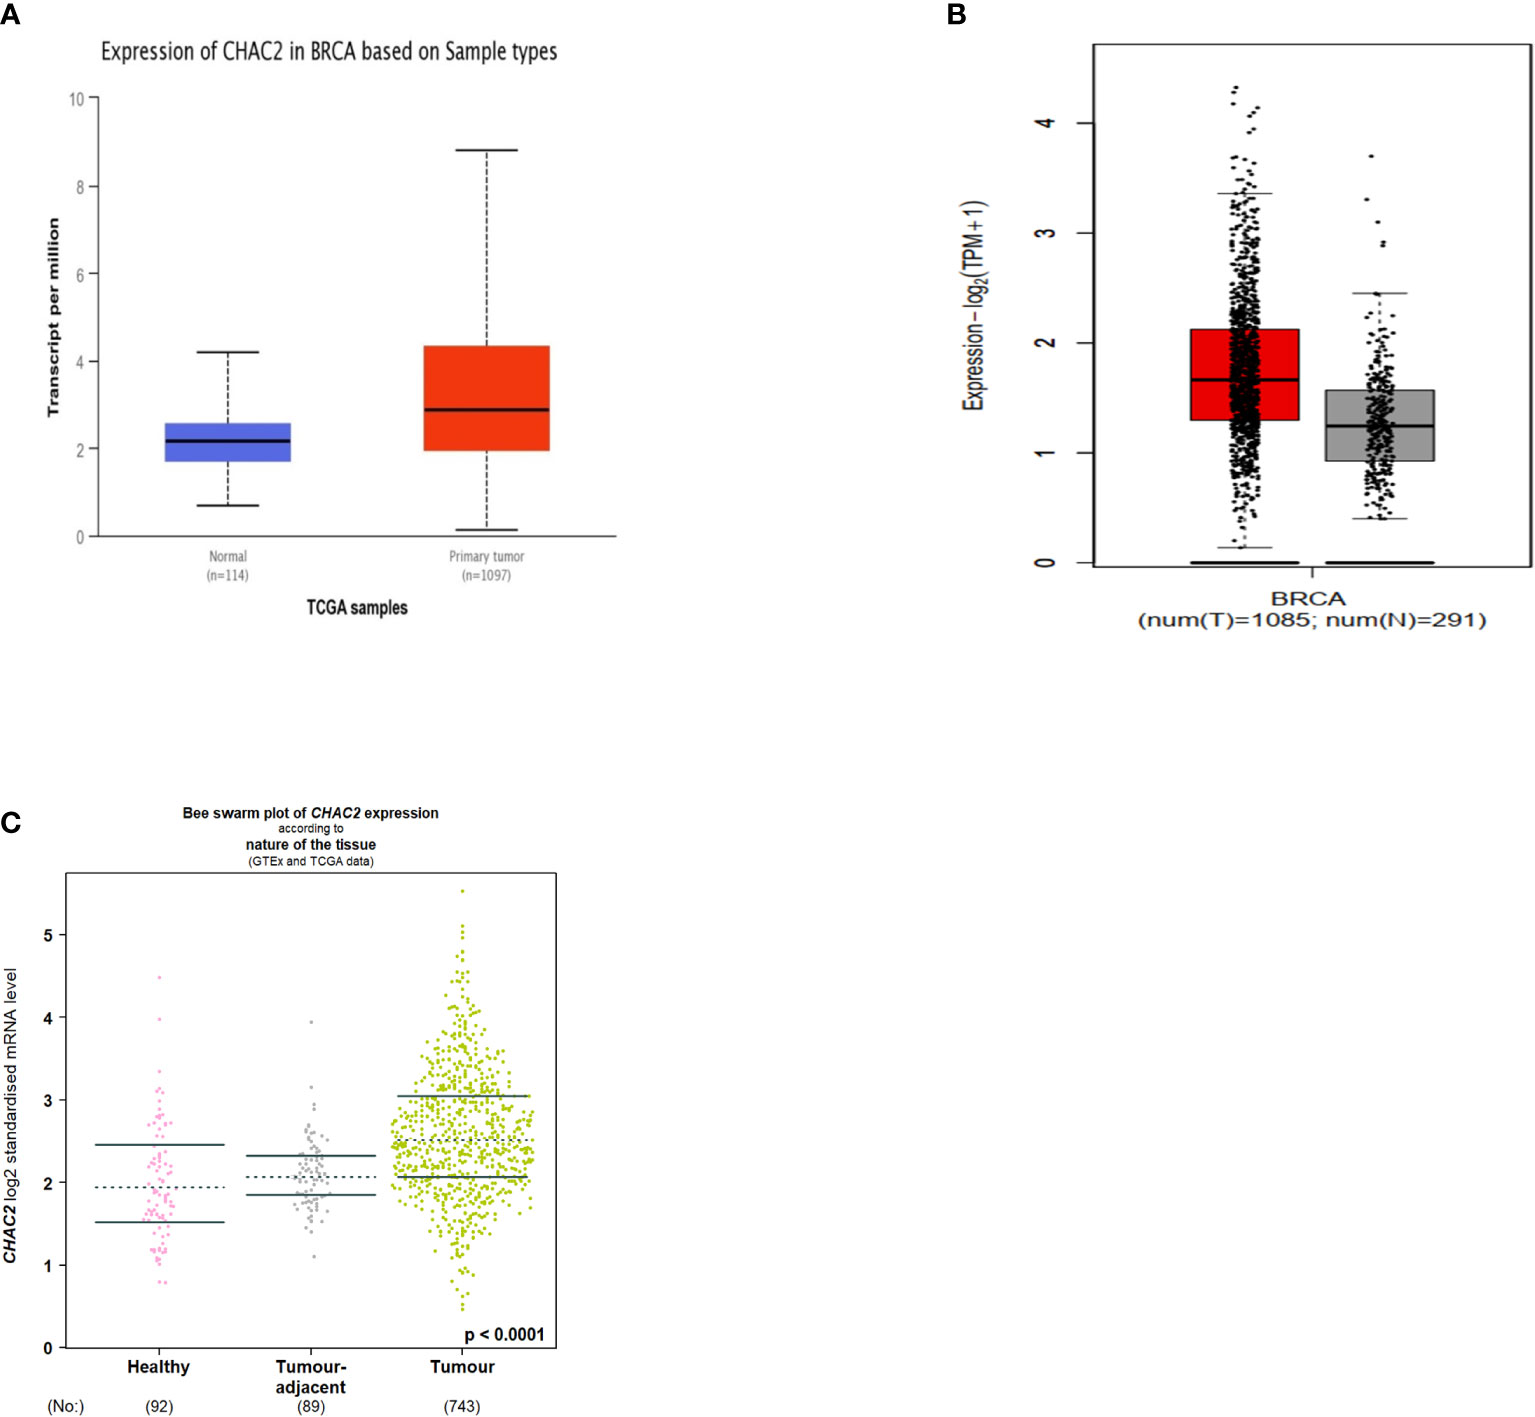
Figure 1 CHAC2 transcript levels in cancer and normal human breast tissues according to (A) UALCAN (Box Plot), (B) GEPIA2 (Box Plot), (C) bcGenExminer v4.8 (Bee swarm plot).
Breast cancer can be divided into four molecular subtypes based on the expression of certain markers like estrogen receptor (ER), progesterone receptor (PR), and Human epidermal growth factor receptor 2 (HER2) while the subtype lacking the expression of all these receptors is known as triple-negative breast cancer (TNBC) (31). Importantly, HER2 and TNBC are associated with poor survival and frequent relapse (31). Our analysis found that CHAC2 expression was significantly high (p-value<0.0001) in these aggressive subtypes compared to luminal (A & B) subtypes from multiple databases (Figures 2A-D). We further investigated if high CHAC2 correlated with the stage and positive node metastasis of the tumor. Unsurprisingly, the overall CHAC2 expression enhanced with the node metastasis (Figure 2E) and stage (Figure 2F) of the breast tumor indicating that high CHAC2 expression correlated with increasing tumor stage and node metastasis.
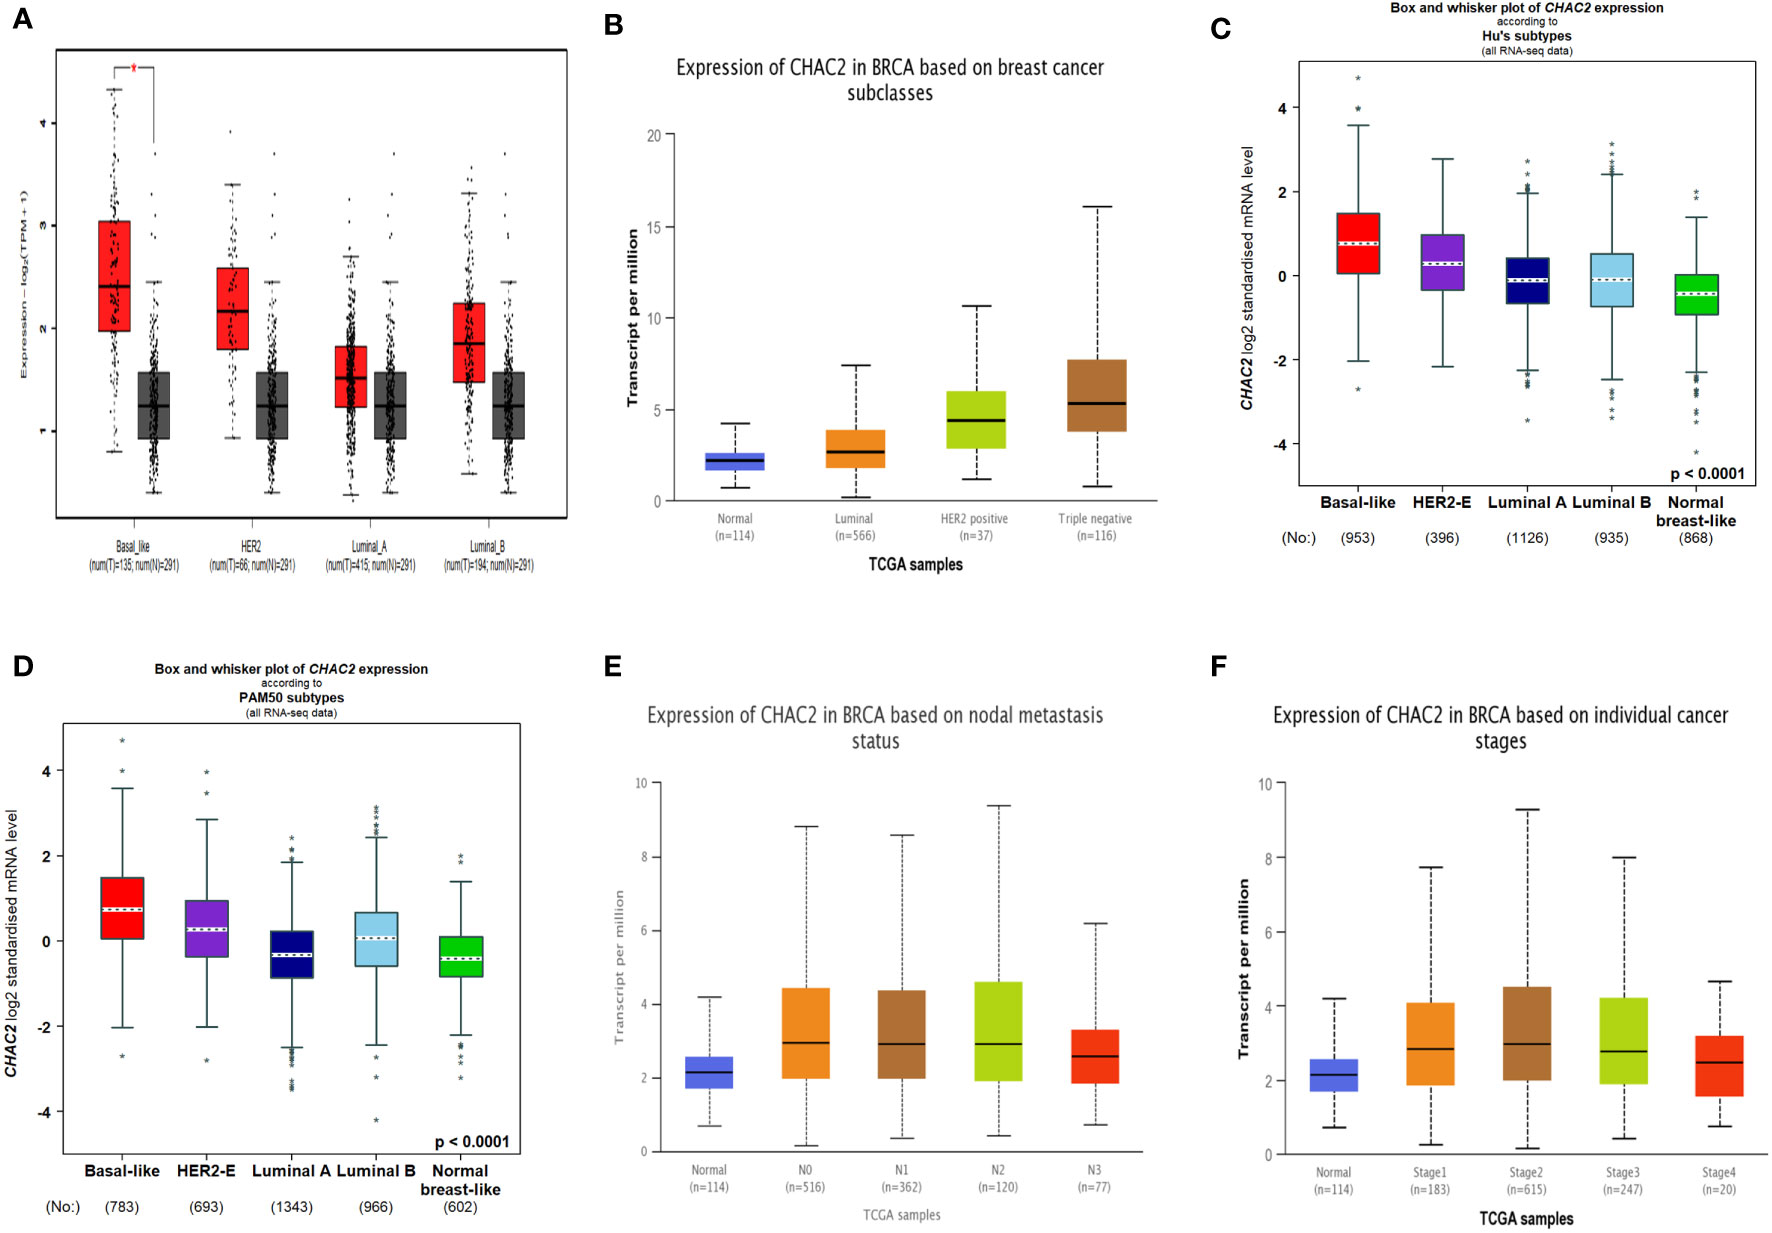
Figure 2 Molecular subtypes of breast cancer and CHAC2 expression according to (A) GEPIA2, (B) UALCAN, (C, D) bcGenExminer v4.8 (E) CHAC2 expression and its association with the status of node metastasis according to UALCAN (F) CHAC2 expression and its association with the breast cancer stage according to UALCAN analysis. *p < 0.05.
To evaluate the CHAC2 expression according to various clinicopathologic parameters, bcGenexminer v4.8 was used. The analysis was done based on various parameters as indicated (Table 1). In summary, CHAC2 mRNA expression was significantly enhanced (p-value=0.0004) in women with age ≤ 51. Similarly, tumors with ER- status, PR-, Her2+, Basal-like, and TNBC had significantly high CHAC2 transcript levels (p-value<0.0001). Moreover, the analysis according to the prognostic index like Nottingham prognostic index (NPI) and Scarff Bloom and Richardson (SBR) grade status revealed a direct correlation of CHAC2 expression with increasing tumor grade and stage (Table 1).
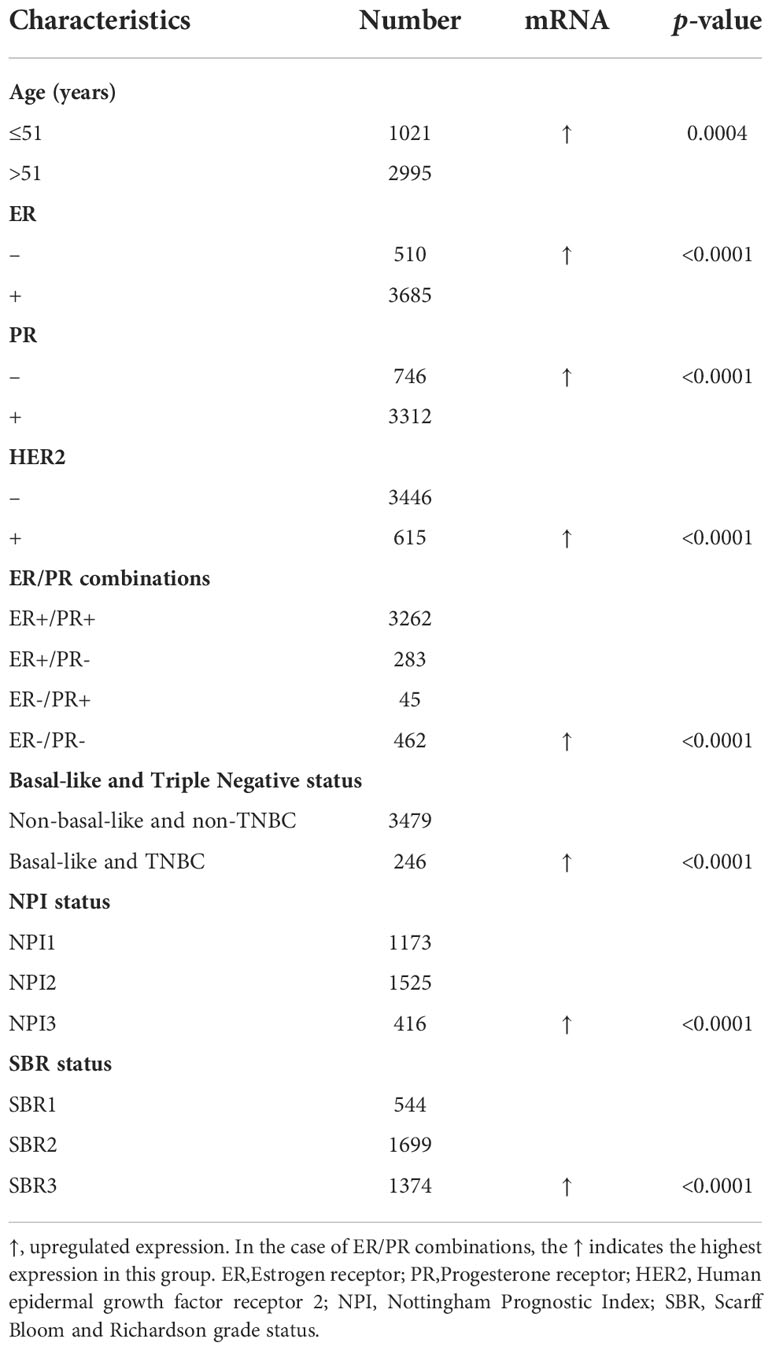
Table 1 The relationship between CHAC2 mRNA expression and clinicopathological features of breast cancer from bc-GenExMiner v4.8 database.
Since mutant p53 induces the expression of several genes that enhances carcinogenesis (32–34), we extended our analysis to see if CHAC2 levels were enhanced in the “p53 mutant” group compared to the “p53 non-mutant” or “wild-type” group. The analysis showed that CHAC2 levels were high in the former category as evidenced by UALCAN (Figure 3A) and bcGenexminer (Figure 3B) (p-value<0.0001) databases.
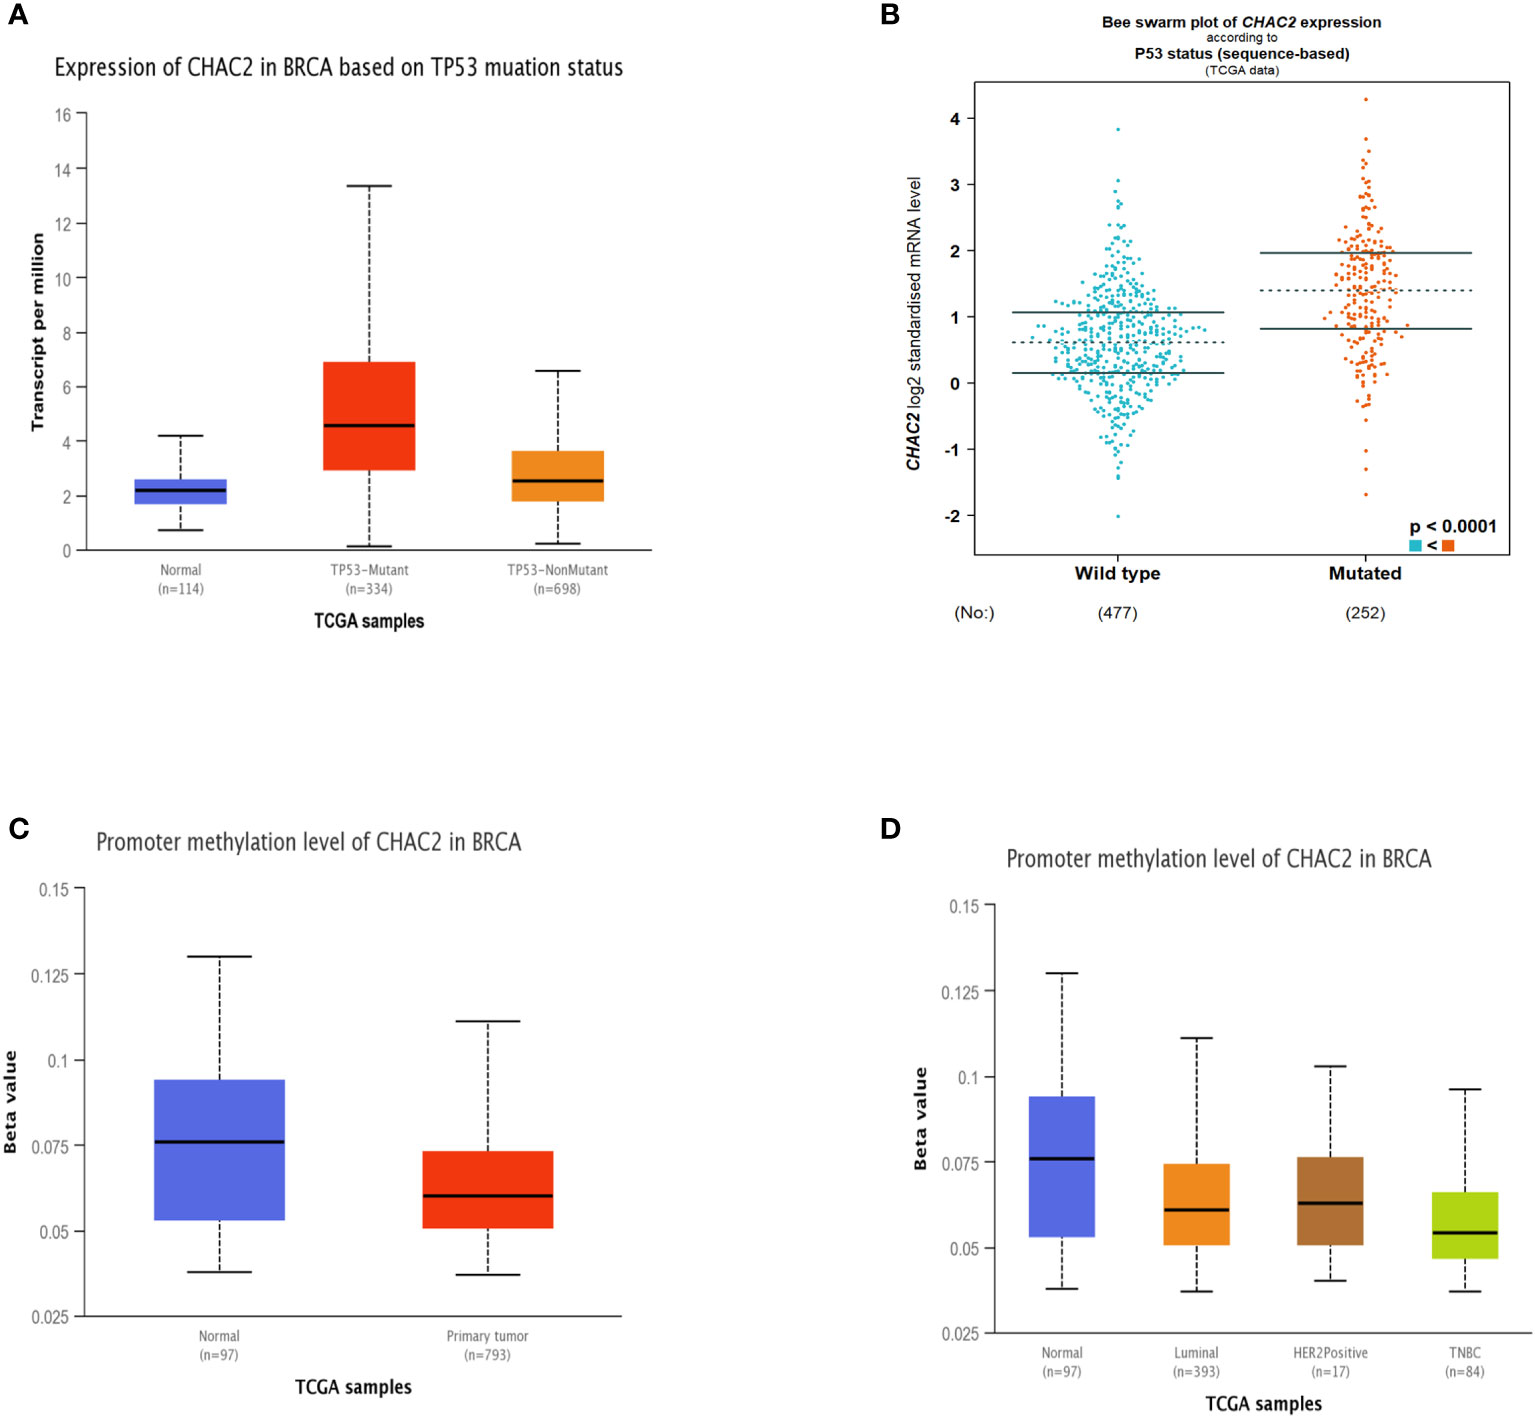
Figure 3 Impact of p53 mutation and promoter methylation on CHAC2 expression in breast cancer patients and normal samples. CHAC2 levels in mutant p53 vs non-mutant or wild-type p53 patients as per (A) UALCAN, (B) bcGenExminer v4.8. Promoter methylation of CHAC2 and its expression from UALCAN database as per (C) normal vs tumor samples and (D) normal vs molecular subtypes of breast cancer.
Additionally, we analyzed the promoter methylation levels of CHAC2 as changes in the methylation status of various oncogenes and tumor suppressors are linked with cancer progression (35). Our analysis showed that the CHAC2 promoter was significantly hypomethylated in breast tumor cases (Figure 3C). Moreover, the analysis of methylation in terms of breast cancer subtypes showed that among all the molecular subtypes, TNBC had the most down-regulated methylation levels (Figure 3D).
Since we found that expression of CHAC2 enhanced with p53 mutation, therefore, we extended our analysis to see if the CHAC2 levels correlated with the mutations in other key genes. muTarget tool was used to identify these genes. The top ten most strongly associated genes with CHAC2 expression have been described (Table 2) while expression of CHAC2 with wild-type or mutant forms of indicated genes have been shown (Table 2). As results indicate, mutations in the TP53 are most prevalent (mutation rate: 34.3%) followed by CDH1 (mutation rate: 14.1%), BIRC6 (mutation rate: 3.47%), DYNC2H1 (mutation rate: 3.26%), and UTRN (mutation rate: 2.96%). These findings suggest that CHAC2 expression is closely linked to gene mutations in breast cancer.
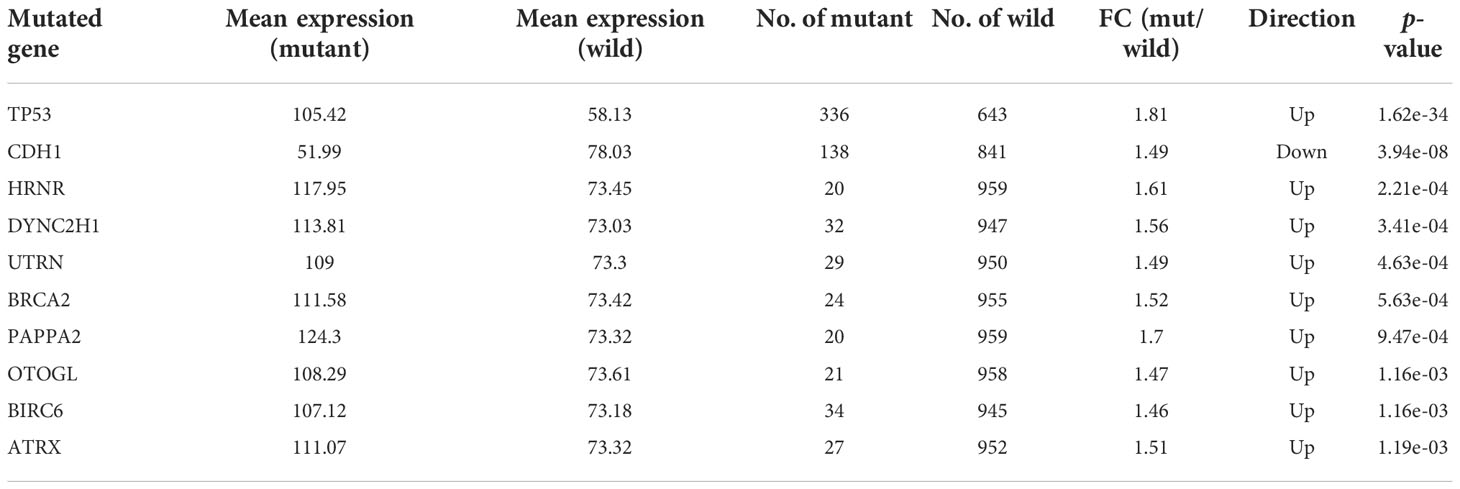
Table 2 The top ten mutant genes most closely associated with CHAC2 expression and their features. (FC, Fold change).
We found high expression of CHAC2 in breast tumor samples and in aggressive subtypes like HER and TNBC compared to luminal subtypes. Therefore, we examined if high CHAC2 levels correlated with survival probability and prognosis with the help of a Kaplan-Meier plotter. The survival plots obtained from Km plotter (Figures 4A-C) indicated that high CHAC2 expression correlated significantly with shorter survival indicating that elevated CHAC2 expression negatively associated with the prognosis of breast cancer patients (Figures 4A-C).
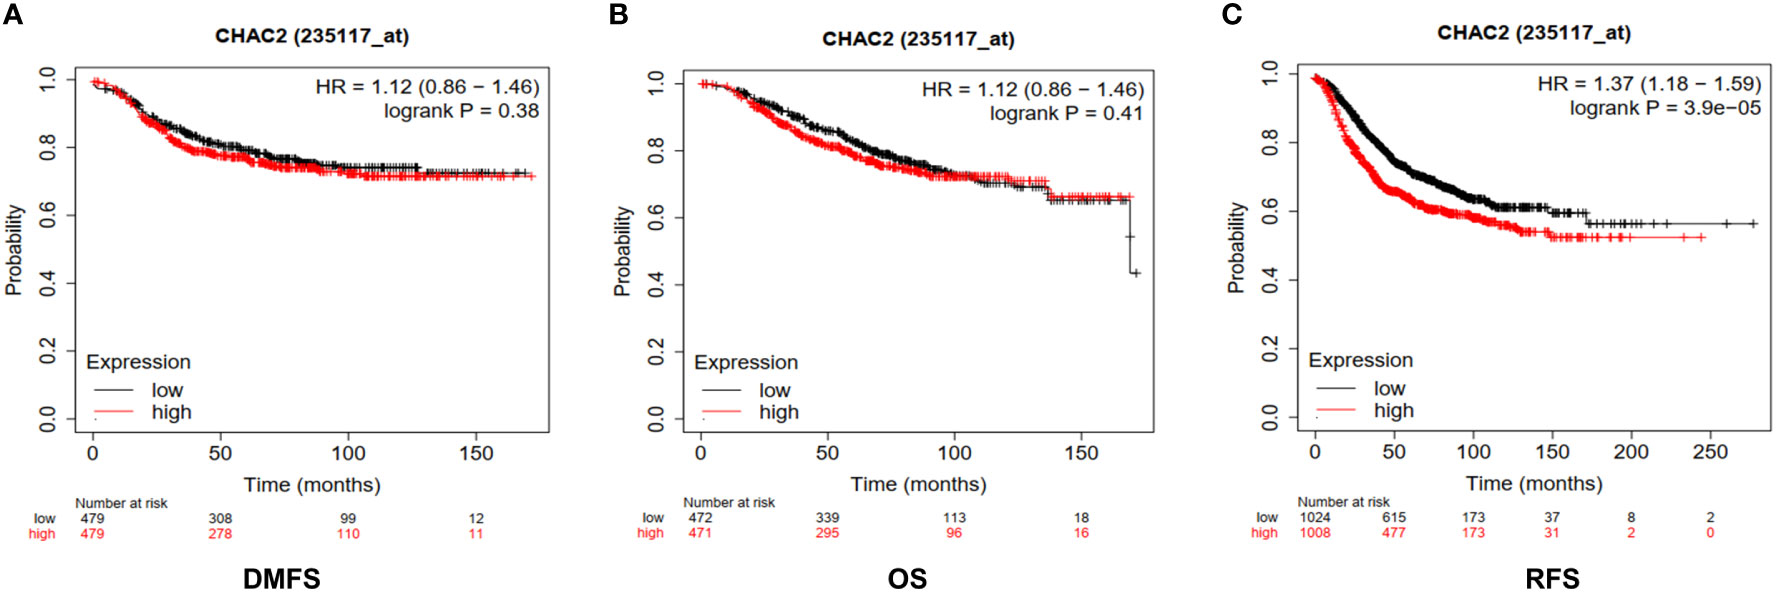
Figure 4 Prognostic significance of CHAC2 in the survival of breast cancer patients. Kaplan-Meier survival plots were obtained from Km plotter indicating lower survival of breast cancer patients in terms of (A) DMFS, (B) OS, and (C) RFS. DMFS, Distant metastasis-free survival; OS, Overall Survival; RFS, Relapse-free survival.
Immune cells constitute an important component of the tumor microenvironment that has been implicated in facilitating breast cancer progression and invasion (36). Moreover, immune cells have been reported to be an independent predictor of patient survival and response to drug therapy (37, 38). We initially did a Pan-cancer analysis of CHAC2 expression with immune cell infiltration using TISIDB (Supplementary Figure S2). We then selected “Breast Invasive Carcinoma” and analyzed the correlation of various immune cells with CHAC2 expression (Figure 5A). We found a significant positive correlation of activated B cells (Spearman: rho=0.103, p=0.00062), CD4+ (Spearman: rho=0.494, p<2.2e-16) and CD8+ T cells (Spearman: rho=0.234, p=4.06e-15), and dendritic cells (Spearman: rho=0.309, p<2.2e-16). Conversely, a negative correlation was observed with neutrophil infiltration (Spearman: rho=-0.151, p=4.85e-07) while a weakly positive and non-significant correlation of macrophages was observed (Spearman: rho=0.019, p=0.532). Additionally, we used the TIMER database to corroborate the immune filtration analysis (Figure 5B). The result of immune filtration analysis shows that CHAC2 expression may be involved in the regulation of immune cells in breast cancer.
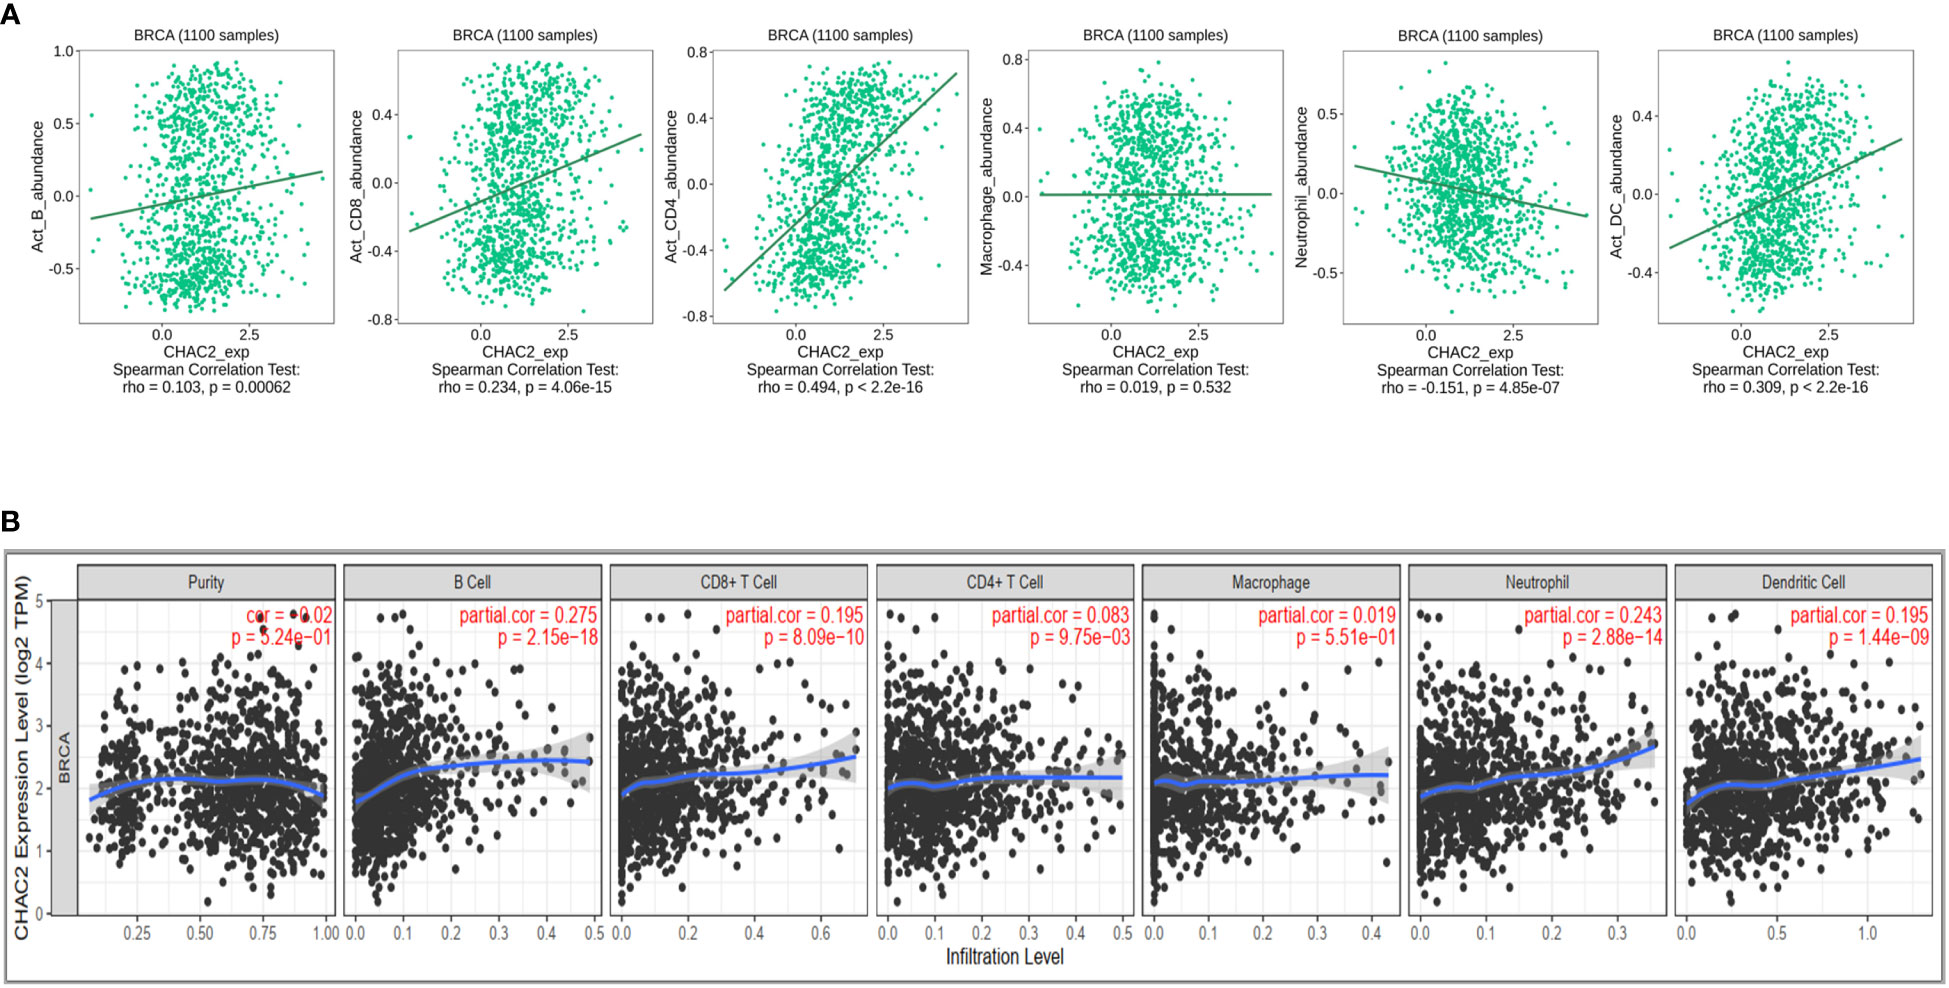
Figure 5 Correlation of CHAC2 expression and immune filtration in BC. (A) Spearman correlation from TISIDB between CHAC2 and B cells, CD4+ T cells, CD8+ T cells, macrophage, neutrophil, and dendritic cells. (B) Analysis of correlation between CHAC2 and immune cells from TIMER database.
The top 10 most closely correlated genes with CHAC2 were obtained from GEPIA2 using the TCGA dataset. The heat map was then generated using bcGenExMiner v4.8 (Figure 6A). Among all, the most closely correlated gene was TTK as obtained from UALCAN (Pearson correlation coefficient = 0.66) (Figure 6B), and GEPIA2 (Pearson correlation coefficient = 0.65) (Figure 6C). TTK/hMPS1 gene is known to play a role in centrosome duplication, and mitotic checkpoint signaling and is known to play a role in the progression of breast cancer (39, 40). Further, we did a correlation analysis of CHAC2 with the TTK gene using UCSCxena (Figure S3A). TIMER database was used to obtain the plots of top 10 closely related genes (Figure S3B).
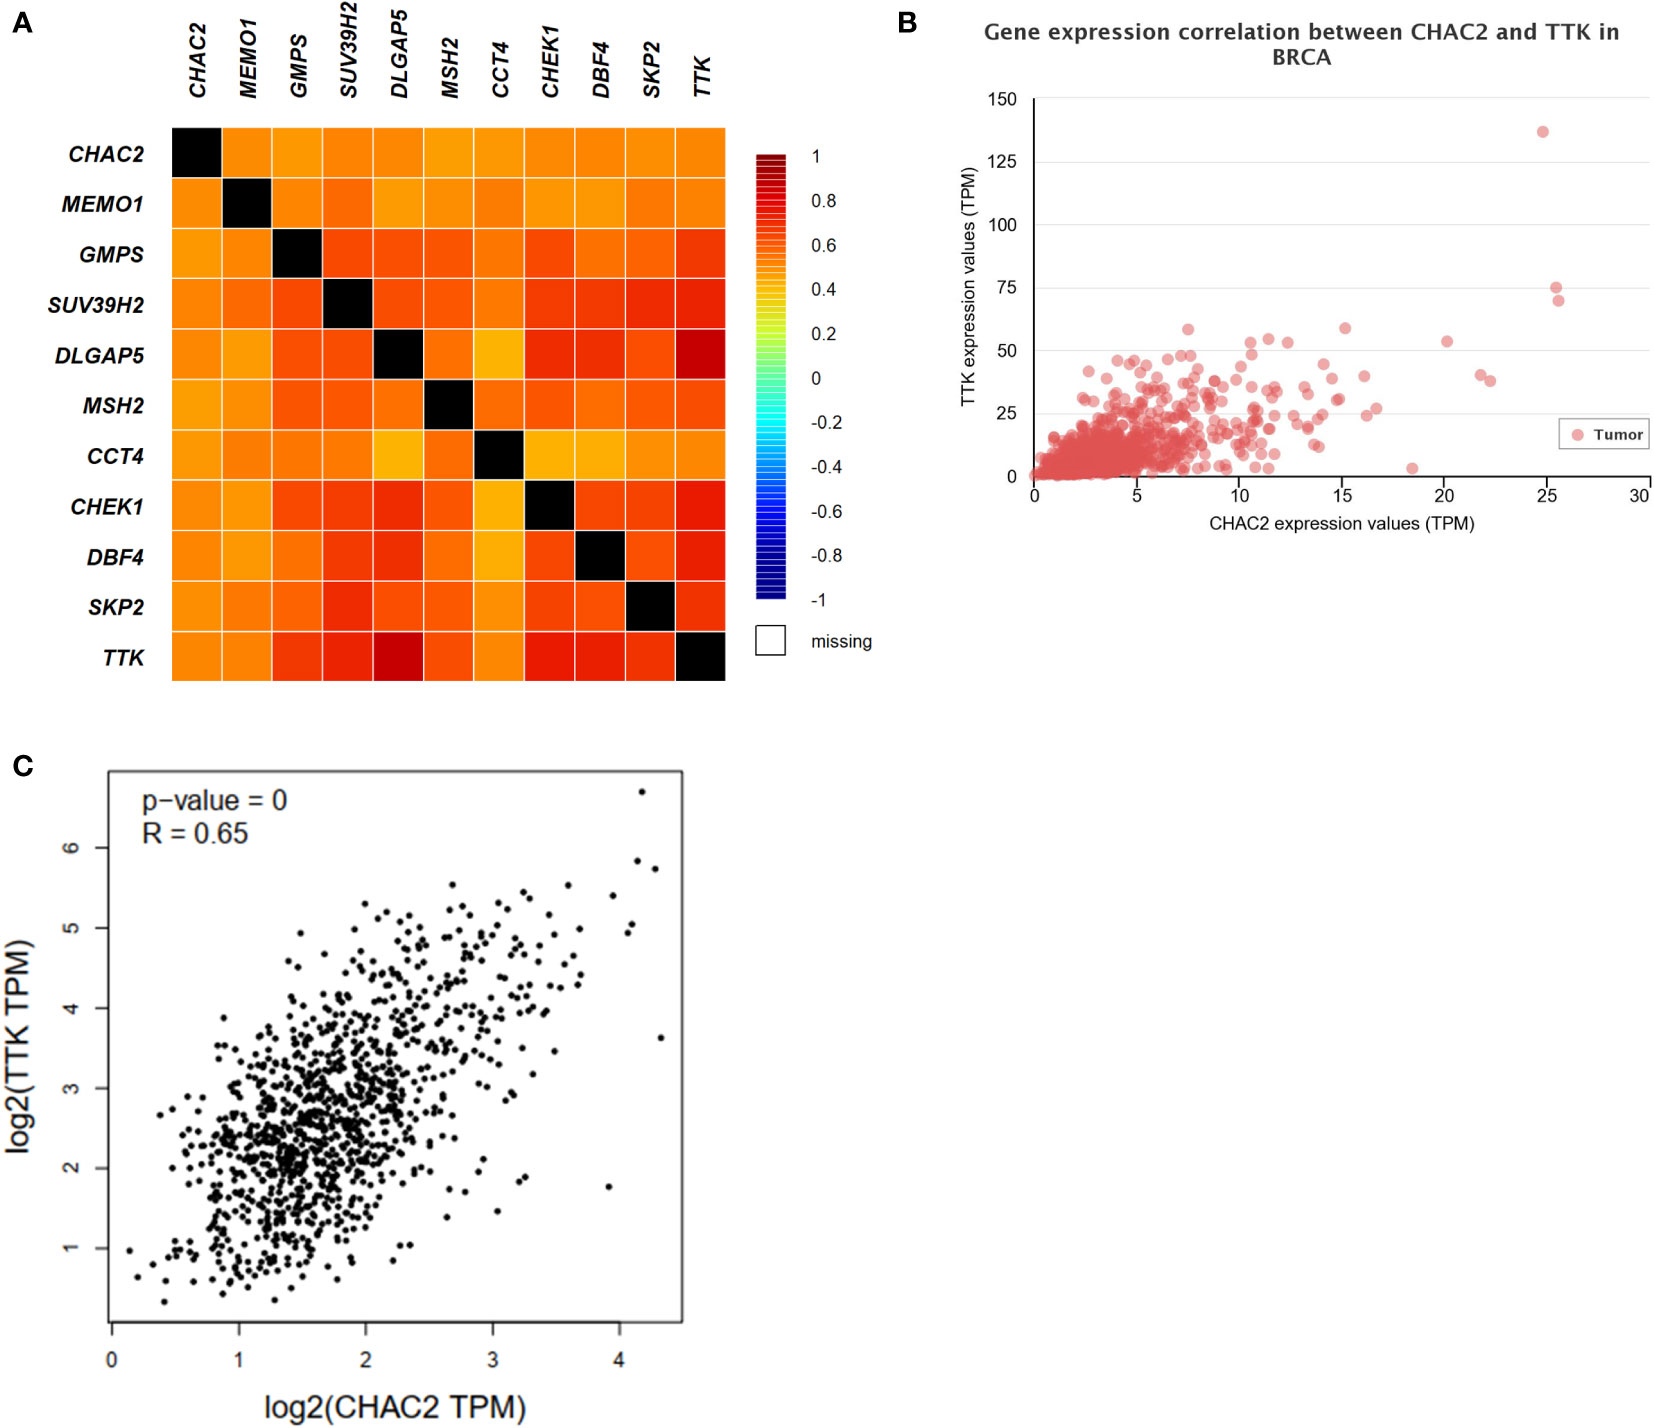
Figure 6 Analysis of CHAC1 correlations and top 10 correlated genes. (A) Heat map depicting the CHAC2 correlation with top 10 closely related genes. Correlation between CHAC2 and TTK from (B) UALCAN, (C) GEPIA2.
We chose the top 100 related genes that expressed with CHAC2 through the Enrichr database. To further understand the gene ontological features and signaling pathways related to the CHAC2 gene, we did enrichment analysis from various gene set libraries including GO biological process (Figure S4A), GO molecular function (Figure S4B), GO cellular component (Figure S4C), KEGG 2021 (Figure S4D), and Bioplanet 2019 (Figure S4E). The results of cluster analysis showed that CHAC2 and its correlated genes are significantly enriched in various pathways and cellular processes associated with DNA replication, damaged DNA binding, cell cycle, oocyte meiosis, etc.
We constructed a protein-protein interaction (PPI) network for CHAC2 and its 20 related genes as obtained from the GeneMANIA database (Figure S4F). These genes included CHAC1, UBL5, DPYD, DPH5, ATP13A3, AC005154.5, GGACT, GGCT, POLR3A, CDKN2AIP, HAPLN3, SH3GLB1, CRK, FSD1, SAP18, UBA1, TIPIN, CNBP, DEPDC1B, and DHX29. Another PPI network for the top 10 correlated genes of CHAC2 as obtained previously from GEPIA2 was constructed (Figure S4G).
Breast cancer is a heterogeneous disease that progresses due to various factors including genetic mutations, over-expression of various receptors, cytoskeletal rearrangement, and epithelial-mesenchymal transition that ultimately transcends into metastatic disease (41–43). Owing to its high incidence and mortality rate, early detection of breast cancer, advancement in precision medicine, and identification of new biomarkers are highly necessary. Both the members of the CHAC family are UPR genes and have been implicated in cancer progression (14, 16). While several studies have reported a dual role for CHAC1 in cancer progression, studies depicting the association of CHAC2 in carcinogenesis are sparse. To the best of our knowledge, this is the first study that reports the expression of CHAC2 in breast cancer. Previously, CHAC2 has been shown to behave as a tumor suppressor in gastric cancer cells transfected with CHAC2 led to enhanced ROS levels, mitochondrial apoptosis, and autophagy through the UPR pathway (14).
From the pan-cancer analysis it is clear that CHAC2 has a different expression in different tumor tissue and therefore, mechanistic studies are warranted to conclude the factors behind the differential expression. Based on the results of the present study, we showed that CHAC2 is highly expressed in breast cancer and seems to be associated with node metastasis, and stage of breast cancer through various databases. We found that CHAC2 mRNA expression enhanced with increasing tumor grading according to NPI and SBR grading (44). Moreover, CHAC2 over-expression in the HER2 and TNBC is indicative of the fact that high CHAC2 may serve as a biomarker for these aggressive subtypes. Another member of the CHAC family, CHAC1 has been previously reported to be highly expressed in these subtypes, and on similar lines, CHAC2 also showed a prognostic significance as per survival curves obtained from the Kaplan-Meier plotter (15).
p53 also known as the “guardian of the genome” is mutated in more than 50% of human tumors (34). Due to its highly important role in cell cycle regulation, mutations in p53 seem to be a prerequisite for tumors with high grade, invasion, and metastatic capability (45, 46). Mutations in key genes such as p53 have been highly implicated in various human malignancies and its mutations have been reported to escalate carcinogenesis (34, 47). From various databases like UALCAN, bcGenexminer, and muTarget, the analysis showed that tumor samples with mutant p53 showed high CHAC2 expression. Moreover, epigenetic changes such as DNA methylation have been linked with progression of cancer including breast tumorigenesis (35, 48). Our analysis showed that hypo methylation of CHAC2 was prevalent in tumor samples. Furthermore, the analysis of gene mutations associated with CHAC2 using muTarget revealed important genes associated with CHAC2 expression. Among them, the most significant genes turned out to be tp53 which encodes p53, and CDH1 which encodes E-cadherin. The loss of E-cadherin enhances the epithelial-mesenchymal transition (EMT), lymph node metastasis, and associates with poor differentiation of breast cancer (49, 50). The present work found low expression of CHAC2 in CDH1 mutant samples while high CHAC2 expression was observed in the samples with mutations in genes such as HRNR, UTRN, and DYNC2H1. This paves a way for future therapies targeting CHAC2 in breast cancer.
With the advent of immunotherapy-like treatments in the last decade for cancer, it is now clear that immune response toward cancer cells has important implications for disease progression and response to therapy. Thus, we investigated the correlation between CHAC2 and immune cell infiltration from different databases and found that a positive correlation of CHAC2 existed with the infiltration of activated CD8+, CD4+ T cells, and activated dendritic cells indicating that CHAC2 may have an important role to play in the infiltration of these immune cells and ultimately of the breast tumor microenvironment. Apart from this, the correlation analysis revealed a strong correlation of CHAC2 with TTK which is a tyrosine kinase. In the past, several reports have suggested an oncogenic role for TTK in breast cancer (40, 51). For example, TTK regulates the EMT in triple-negative breast cancer cells and its knockdown led to reduced viability and colony formation ability in MDA-MB-231 and Hs578t cells (51). Moreover, Morrison et al. (52) showed that TTK knockdown in MDA-MB-231 cells correlated with reduced organoid growth in 3-D cultures. From the correlation analysis, it can therefore be inferred that both CHAC2 and TTK may be potential candidate for future therapeutic targets in breast cancer. The gene function and enrichment studies showed that CHAC2 and its correlated genes may be involved in DNA replication, DNA repair, cell cycle, RNA binding, damaged DNA binding, oocyte meiosis and maturation. Taken together, our study explored the CHAC2 expression in breast cancer datasets and aimed to establish its clinical significance in breast cancer. Therefore, considering the totality of the evidence reported in this study, it is clear that high CHAC2 expression associates with more progressive disease suggesting a novel therapeutic target for breast cancer as well as a biomarker for the aggressiveness of the breast tumor. Our study warrants further preclinical research with various in vitro and in vivo models to ascertain the molecular mechanisms that regulates CHAC2 expression which may be beneficial in breast cancer diagnosis and treatment.
The original contributions presented in the study are included in the article/Supplementary Material. Further inquiries can be directed to the corresponding author.
SC: Analysed the data, prepared figures in part, and wrote the manuscript. VM: Analysed the data, designed the study, prepared figures, and wrote the manuscript. RS: Designed the study in part. AA: Design and analysis of the study in part, manuscript editing. HC: Design of study, funding acquisition, review, and editing of the manuscript. All authors contributed to the article and approved the submitted version.
This study was supported by the internal funding of NIB.
The authors are thankful to the National Institute of Biologicals (NIB) for providing the necessary infrastructure. V.M. acknowledges ICMR, New Delhi for providing Senior Research Fellowship (SRF) (No.3/1/3 JRF-2016 LS/HRD-78).
The authors declare that the research was conducted in the absence of any commercial or financial relationships that could be construed as a potential conflict of interest.
All claims expressed in this article are solely those of the authors and do not necessarily represent those of their affiliated organizations, or those of the publisher, the editors and the reviewers. Any product that may be evaluated in this article, or claim that may be made by its manufacturer, is not guaranteed or endorsed by the publisher.
The Supplementary Material for this article can be found online at: https://www.frontiersin.org/articles/10.3389/fonc.2022.1058931/full#supplementary-material
Supplementary Figure 1 | Pan-cancer analysis of CHAC2 gene expression according to (A) UALCAN, (B) TNMplot, (C) GENT2, and (D) TIMER2.0. Breast cancer has been indicated in a red rectangular box.
Supplementary Figure 2 | Heat map depicting the correlation of CHAC2 with 28 different immune cells. Red color indicates more positive while blue color indicated more negative correlation.
Supplementary Figure 3 | (A) Heat map of CHAC2 and TTK mRNA expression using UCSCXena database. (B) Correlation of CHAC2 and top 10 correlated genes from TIMER database.
Supplementary Figure 4 | Protein-protein interaction network and Gene ontology study of CHAC2. Gene ontology (GO) from Enrichr database according to (A) GO biological process 2021, (B) GO molecular function 2021, (C) GO Cellular component 2021, (D) KEGG 2021 Human, and (E) Bioplanet 2019. The length and intensity of the color of the bar indicate the level of significance (a more intense color indicates high significance). (F) Protein-protein interaction network of CHAC2 and its top 20 interactive genes was obtained from GeneMANIA. (G) Protein-protein interaction network of top 10 CHAC2 correlated genes.
Supplementary Figure 5 | Schematic outline of the methodology for cancer informatics analysis of CHAC2 expression.
BC, Breast Cancer; CHAC, Cation Transport Regulator Homolog; DMFS, Disease Mean Free Survival; EMT, Epithelial-Mesenchymal Transition; ER, Estrogen Receptor; GENT2, Gene Expression database of Normal and Tumor tissues 2; GEPIA, Gene Expression Profiling Interactive Analysis; GO, Gene Ontology; HER2, Human Epidermal Growth Factor Receptor 2; NPI, Nottingham Prognostic Index; OS, Overall Survival; PR, Progestrogen Receptor; RFS, Relapse Free Survival; SBR, Scarff Bloom and Richardson; TCGA, The Cancer Genome Atlas; TIMER, Tumor Immune Estimation Resource; TNBC, Triple Negative Breast Cancer; TPM, Transcript per Million; UALCAN, University of Alabama at Birmingham Cancer Data Analysis Portal; UPR, Unfolded Protein Response.
1. Sung H, Ferlay J, Siegel RL, Laversanne M, Soerjomataram I, Jemal A, et al. Global cancer statistics 2020: GLOBOCAN estimates of incidence and mortality worldwide for 36 cancers in 185 countries. CA Cancer J Clin (2021) 71(3):209–49. doi: 10.3322/caac.21660
2. Polyak K. Heterogeneity in breast cancer. J Clin Investig (2011) 121(10):3786–8. doi: 10.1172/JCI60534
3. Weigelt B, Peterse JL, Van't Veer LJ. Breast cancer metastasis: markers and models. Nat Rev Cancer (2005) 5(8):591–602. doi: 10.1038/nrc1670
4. Waks AG, Winer EP. Breast cancer treatment: a review. Jama (2019) 321(3):288–300. doi: 10.1001/jama.2018.19323
5. Dai X, Xiang L, Li T, Bai Z. Cancer hallmarks, biomarkers and breast cancer molecular subtypes. J Cancer (2016) 7(10):1281–94. doi: 10.7150/jca.13141
6. van Gool AJ, Bietrix F, Caldenhoven E, Zatloukal K, Scherer A, Litton J-E, et al. Bridging the translational innovation gap through good biomarker practice. Nat Rev Drug Discovery (2017) 16(9):587–8. doi: 10.1038/nrd.2017.72
7. Kaur A, Gautam R, Srivastava R, Chandel A, Kumar A, Karthikeyan S, et al. ChaC2, an enzyme for slow turnover of cytosolic glutathione. J Biol Chem (2017) 292(2):638–51. doi: 10.1074/jbc.M116.727479
8. Mungrue IN, Pagnon J, Kohannim O, Gargalovic PS, Lusis AJ. CHAC1/MGC4504 is a novel proapoptotic component of the unfolded protein response, downstream of the ATF4-ATF3-CHOP cascade. J Immunol (2009) 182(1):466–76. doi: 10.4049/jimmunol.182.1.466
9. Goebel G, Berger R, Strasak A, Egle D, Müller-Holzner E, Schmidt S, et al. Elevated mRNA expression of CHAC1 splicing variants is associated with poor outcome for breast and ovarian cancer patients. Br J Cancer (2012) 106(1):189–98. doi: 10.1038/bjc.2011.510
10. Liu Y, Li M, Shi D, Zhu Y. Higher expression of cation transport regulator-like protein 1 (CHAC1) predicts of poor outcomes in uveal melanoma (UM) patients. Int Opthalmol (2019) 39(12):2825–32. doi: 10.1007/s10792-019-01129-1
11. Li D, Liu S, Xu J, Chen L, Xu C, Chen F, et al. Ferroptosis-related gene CHAC1 is a valid indicator for the poor prognosis of kidney renal clear cell carcinoma. J Cell Mol Med (2021) 25(7):3610–21. doi: 10.1111/jcmm.16458
12. Tseng H-H, Chen Y-Z, Chou N-H, Chen Y-C, Wu C-C, Liu L-F, et al. Metformin inhibits gastric cancer cell proliferation by regulation of a novel Loc100506691-CHAC1 axis. Mol Ther Oncolytics (2021) 22:180–94. doi: 10.1016/j.omto.2021.08.006
13. Xiao R, Wang S, Guo J, Liu S, Ding A, Wang G, et al. Ferroptosis-related gene NOX4, CHAC1 and HIF1A are valid biomarkers for stomach adenocarcinoma. J Cell Mol Med (2022) 26(4):1183–93. doi: 10.1111/jcmm.17171
14. Liu S, Fei W, Shi Q, Li Q, Kuang Y, Wang C, et al. CHAC2, downregulated in gastric and colorectal cancers, acted as a tumor suppressor inducing apoptosis and autophagy through unfolded protein response. Cell Death Dis (2017) 8(8):e3009–e. doi: 10.1038/cddis.2017.405
15. Mehta V, Meena J, Kasana H, Munshi A, Chander H. Prognostic significance of CHAC1 expression in breast cancer. Mol Biol Rep (2022) 49(9):8517–26. doi: 10.1007/s11033-022-07673-x
16. Mehta V, Suman P, Chander H. High levels of unfolded protein response component CHAC1 associates with cancer progression signatures in malignant breast cancer tissues. Clin Trans Oncol (2022) 24:1–15. doi: 10.1007/s12094-022-02889-6
17. Chandrashekar DS, Bashel B, Balasubramanya SAH, Creighton CJ, Ponce-Rodriguez I, Chakravarthi BV, et al. UALCAN: a portal for facilitating tumor subgroup gene expression and survival analyses. Neoplasia (2017) 19(8):649–58. doi: 10.1016/j.neo.2017.05.002
18. Tang Z, Kang B, Li C, Chen T, Zhang Z. GEPIA2: an enhanced web server for large-scale expression profiling and interactive analysis. Nucleic Acids Res (2019) 47(W1):W556–W60. doi: 10.1093/nar/gkz430
19. Jézéquel P, Gouraud W, Ben Azzouz F, Guérin-Charbonnel C, Juin PP, Lasla H, et al. Bc-GenExMiner 4.5: new mining module computes breast cancer differential gene expression analyses. Database (2021) 2021:1–10. doi: 10.1093/database/baab007
20. Park S-J, Yoon B-H, Kim S-K, Kim S-Y. GENT2: an updated gene expression database for normal and tumor tissues. BMC Med Genom (2019) 12(5):1–8. doi: 10.1186/s12920-019-0514-7
21. Bartha Á, Győrffy B. TNMplot. com: a web tool for the comparison of gene expression in normal, tumor and metastatic tissues. Int J Mol Sci (2021) 22(5):2622. doi: 10.3390/ijms22052622
22. Li T, Fu J, Zeng Z, Cohen D, Li J, Chen Q, et al. TIMER2. 0 for analysis of tumor-infiltrating immune cells. Nucleic Acids Res (2020) 48(W1):W509–W14. doi: 10.1093/nar/gkaa407
23. Nagy Á, Győrffy B. muTarget: A platform linking gene expression changes and mutation status in solid tumors. Int J Cancer (2021) 148(2):502–11. doi: 10.1002/ijc.33283
24. Győrffy B. Survival analysis across the entire transcriptome identifies biomarkers with the highest prognostic power in breast cancer. Comput Struct Biotechnol J (2021) 19:4101–9. doi: 10.1016/j.csbj.2021.07.014
25. Li T, Fan J, Wang B, Traugh N, Chen Q, Liu JS, et al. TIMER: a web server for comprehensive analysis of tumor-infiltrating immune cells. Cancer Res (2017) 77(21):e108–e10. doi: 10.1158/0008-5472.CAN-17-0307
26. Ru B, Wong CN, Tong Y, Zhong JY, Zhong SSW, Wu WC, et al. TISIDB: an integrated repository portal for tumor–immune system interactions. Bioinformatics (2019) 35(20):4200–2. doi: 10.1093/bioinformatics/btz210
27. Goldman M, Craft B, Hastie M, Repečka K, McDade F, Kamath A, et al. The UCSC xena platform for public and private cancer genomics data visualization and interpretation. biorxiv (2019), 326470. doi: 10.1101/326470
28. Chen EY, Tan CM, Kou Y, Duan Q, Wang Z, Meirelles GV, et al. Enrichr: interactive and collaborative HTML5 gene list enrichment analysis tool. BMC Bioinform (2013) 14(1):1–14. doi: 10.1186/1471-2105-14-128
29. Kuleshov MV, Jones MR, Rouillard AD, Fernandez NF, Duan Q, Wang Z, et al. Enrichr: a comprehensive gene set enrichment analysis web server 2016 update. Nucleic Acids Res (2016) 44(W1):W90–W7. doi: 10.1093/nar/gkw377
30. Franz M, Rodriguez H, Lopes C, Zuberi K, Montojo J, Bader GD, et al. GeneMANIA update 2018. Nucleic Acids Res (2018) 46(W1):W60–W4. doi: 10.1093/nar/gky311
31. Schnitt SJ. Classification and prognosis of invasive breast cancer: from morphology to molecular taxonomy. Mod Pathol (2010) 23(2):S60–S4. doi: 10.1038/modpathol.2010.33
32. Suman P, Mehta V, Craig AW, Chander H. Wild-type p53 suppresses formin-binding protein-17 (FBP17) to reduce invasion. Carcinogenesis (2022) 43(5):494–503. doi: 10.1093/carcin/bgac015
33. Chander H, Brien CD, Truesdell P, Watt K, Meens J, Schick C, et al. Toca-1 is suppressed by p53 to limit breast cancer cell invasion and tumor metastasis. Breast Cancer Res (2014) 16(6):1–16. doi: 10.1186/s13058-014-0503-x
34. Mantovani F, Collavin L, Del Sal G. Mutant p53 as a guardian of the cancer cell. Cell Death Differ (2019) 26(2):199–212. doi: 10.1038/s41418-018-0246-9
35. McMahon KW, Karunasena E, Ahuja N. The roles of DNA methylation in the stages of cancer. Cancer J (Sudbury Mass) (2017) 23(5):257. doi: 10.1097/PPO.0000000000000279
36. Steven A, Seliger B. The role of immune escape and immune cell infiltration in breast cancer. Breast Care (2018) 13(1):16–21. doi: 10.1159/000486585
37. Sui S, An X, Xu C, Li Z, Hua Y, Huang G, et al. An immune cell infiltration-based immune score model predicts prognosis and chemotherapy effects in breast cancer. Theranostics (2020) 10(26):11938. doi: 10.7150/thno.49451
38. Bense RD, Sotiriou C, Piccart-Gebhart MJ, Haanen JB, van Vugt MA, de Vries EG, et al. Relevance of tumor-infiltrating immune cell composition and functionality for disease outcome in breast cancer. J Natl Cancer Inst (2017) 109(1). doi: 10.1093/jnci/djw192
39. Ji W, Luo Y, Ahmad E, Liu S-T. Direct interactions of mitotic arrest deficient 1 (MAD1) domains with each other and MAD2 conformers are required for mitotic checkpoint signaling. J Biol Chem (2018) 293(2):484–96. doi: 10.1074/jbc.RA117.000555
40. Maire V, Baldeyron C, Richardson M, Tesson B, Vincent-Salomon A, Gravier E, et al. TTK/hMPS1 is an attractive therapeutic target for triple-negative breast cancer. PloS One (2013) 8(5):e63712. doi: 10.1371/journal.pone.0063712
41. Angus L, Smid M, Wilting SM, van Riet J, Van Hoeck A, Nguyen L, et al. The genomic landscape of metastatic breast cancer highlights changes in mutation and signature frequencies. Nat Genet (2019) 51(10):1450–8. doi: 10.1038/s41588-019-0507-7
42. Mehta V, Chander H, Munshi A. Complex roles of discoidin domain receptor tyrosine kinases in cancer. Clin Trans Oncol (2021) 23(8):1497–510. doi: 10.1007/s12094-021-02552-6
43. Datta A, Deng S, Gopal V, Yap KC-H, Halim CE, Lye ML, et al. Cytoskeletal dynamics in epithelial-mesenchymal transition: insights into therapeutic targets for cancer metastasis. Cancers (2021) 13(8):1882. doi: 10.3390/cancers13081882
44. Fong Y, Evans J, Brook D, Kenkre J, Jarvis P, Gower-Thomas K. The Nottingham prognostic index: five-and ten-year data for all-cause survival within a screened population. Ann R Coll Surg Engl (2015) 97(2):137–9. doi: 10.1308/003588414X14055925060514
45. Silwal-Pandit L, Langerød A, Børresen-Dale A-L. TP53 mutations in breast and ovarian cancer. Cold Spring Harb Perspect Med (2017) 7(1):a026252. doi: 10.1101/cshperspect.a026252
46. Duffy MJ, Synnott NC, Crown J. Mutant p53 in breast cancer: potential as a therapeutic target and biomarker. Breast Cancer Res Treat (2018) 170(2):213–9. doi: 10.1007/s10549-018-4753-7
47. Alvarado-Ortiz E, de la Cruz-López KG, Becerril-Rico J, Sarabia-Sánchez MA, Ortiz-Sánchez E, García-Carrancá A. Mutant p53 gain-of-function: role in cancer development, progression, and therapeutic approaches. Front Cell Dev Biol (2021) 8:607670. doi: 10.3389/fcell.2020.607670
48. Hon GC, Hawkins RD, Caballero OL, Lo C, Lister R, Pelizzola M, et al. Global DNA hypomethylation coupled to repressive chromatin domain formation and gene silencing in breast cancer. Genome Res (2012) 22(2):246–58. doi: 10.1101/gr.125872.111
49. Yang L, Wang XW, Zhu LP, Wang HL, Wang B, Zhao Q, et al. Significance and prognosis of epithelial−cadherin expression in invasive breast carcinoma. Oncol Lett (2018) 16(2):1659–65. doi: 10.3892/ol.2018.8836
50. Singhai R, Patil VW, Jaiswal SR, Patil SD, Tayade MB, Patil AV. E-cadherin as a diagnostic biomarker in breast cancer. . N Am J Med Sci (2011) 3(5):227–33. doi: 10.4297/najms.2011.3227
51. King JL, Zhang B, Li Y, Li KP, Ni JJ, Saavedra HI, et al. TTK promotes mesenchymal signaling via multiple mechanisms in triple negative breast cancer. Oncogenesis (2018) 7(9):1–13. doi: 10.1038/s41389-018-0077-z
Keywords: ChaC2, breast cancer, biomarker, glutathione, prognosis, bioinformatics
Citation: Chand S, Mehta V, Sharma RK, Anvikar AR and Chander H (2022) Cancer informatics analysis indicates high CHAC2 associated with unfavorable prognosis in breast cancer. Front. Oncol. 12:1058931. doi: 10.3389/fonc.2022.1058931
Received: 30 September 2022; Accepted: 23 November 2022;
Published: 09 December 2022.
Edited by:
Nosheen Masood, Fatima Jinnah Women University, PakistanReviewed by:
Jia Li, University of North Carolina at Charlotte, United StatesCopyright © 2022 Chand, Mehta, Sharma, Anvikar and Chander. This is an open-access article distributed under the terms of the Creative Commons Attribution License (CC BY). The use, distribution or reproduction in other forums is permitted, provided the original author(s) and the copyright owner(s) are credited and that the original publication in this journal is cited, in accordance with accepted academic practice. No use, distribution or reproduction is permitted which does not comply with these terms.
*Correspondence: Harish Chander, ZHJoYXJpc2guY2hhbmRlckBuaWIuZ292Lmlu
†These authors have contributed equally to this work and share the first authorship
Disclaimer: All claims expressed in this article are solely those of the authors and do not necessarily represent those of their affiliated organizations, or those of the publisher, the editors and the reviewers. Any product that may be evaluated in this article or claim that may be made by its manufacturer is not guaranteed or endorsed by the publisher.
Research integrity at Frontiers
Learn more about the work of our research integrity team to safeguard the quality of each article we publish.