 Yuanzhi He1†
 Sanyang Tan
- 1Department of Neurosurgery, Wuhan Children’s Hospital (Wuhan Maternal and Child Healthcare Hospital), Tongji Medical College, Huazhong University of Science & Technology, Wuhan, Hubei, China
- 2Clinical Laboratory, Hainan Women and Children’s Medical Center, Haikou, Hainan, China
- 3Clinical Laboratory, Haikou Hospital of, The Maternal and Child Health, Haikou, Hainan, China
Low-grade gliomas (LGG) are commonly seen in clinical practice, and the prognosis is often poor. Therefore, the determination of immune-related risk scores and immune-related targets for predicting prognoses in patients with LGG is crucial. A single-sample gene set enrichment analysis (ssGSEA) was performed on 22 immune gene sets to calculate immune-based prognostic scores. The prognostic value of the 22 immune cells for predicting overall survival (OS) was assessed using the least absolute shrinkage and selection operator (LASSO) and univariate and multivariate Cox analyses. Subsequently, we constructed a validated effector T-cell risk score (TCRS) to identify the immune subtypes and inflammatory immune features of LGG patients. We divided an LGG patient into a high-risk–score group and a low-risk–score group based on the optimal cutoff value. Kaplan–Meier survival curve showed that patients in the low-risk–score group had higher OS. We then identified the differentially expressed genes (DEGs) between the high-risk–score group and low-risk-score group and obtained 799 upregulated genes and 348 downregulated genes. The analysis of the Kyoto Encyclopedia of Genes and Genomes (KEGG) and Gene Ontology (GO) show that DEGs were mainly concentrated in immune-related processes. In order to further explore the immune-related genes related to prognosis, we constructed a protein–protein interaction (PPI) network using Cytoscape and then identified the 50 most crucial genes. Subsequently, nine DEGs were found to be significantly associated with OS based on univariate and multivariate Cox analyses. It was further confirmed that CD2, SPN, IL18, PTPRC, GZMA, and TLR7 were independent prognostic factors for LGG through batch survival analysis and a nomogram prediction model. In addition, we used an RT-qPCR assay to validate the bioinformatics results. The results showed that CD2, SPN, IL18, PTPRC, GZMA, and TLR7 were highly expressed in LGG. Our study can provide a reference value for the prediction of prognosis in LGG patients and may help in the clinical development of effective therapeutic agents.
Introduction
A glioma is a tumor arising from the carcinogenesis of glial cells in the brain and spinal cord and is characterized by a high incidence, a low cure rate, aggressive growth, a high malignancy, and a significantly higher incidence in men than in women. Gliomas are commonly found in clinical practice, accounting for approximately 81% of intracranial malignancies (1). Most types of gliomas have a poor prognosis due to their malignant biological behavior (2). Low-grade gliomas (LGG) are gliomas of low malignancy, and even though the prognosis is better than that of glioblastoma, many LGG progress to high-grade gliomas due to the great heterogeneity between different LGG, and thus the prognosis of LGG patients is poor (3, 4). Currently, clinical treatment for LGG includes surgical resection, radiotherapy, chemotherapy, electric field therapy, and supportive therapy, all of which help to prolong survival time and improve quality of life (5). However, reliable biomarkers that can predict poor prognoses in patients with LGG are uncommon in the diagnosis and treatment of LGG. Therefore, a search for effective prognostic predictors and therapeutic targets for LGG is necessary.
The development of LGG is closely related to immunity, and LGG cells can secrete a large number of cytokines that promote the entry of various immune cells into the tumor, which in turn creates a tumor microenvironment (6). The tumor microenvironment is involved in LGG growth, recurrence, invasion, and response to therapy, and immune cells are closely associated with poor prognoses in LGG patients (7). Currently, immuno-oncology is of great clinical interest due to its specific benefits in the treatment of a variety of cancers. Immune-related genes and immune-infiltrating cells play an integral role in the tumor microenvironment, helping to determine prognosis and providing an impetus for immunotherapy (8). Therefore, it is crucial to find immune-related risk scores and immune-related targets for predicting prognosis.
Currently, there is no report on the bioinformatics analysis of immune-related targets for predicting LGG prognosis based on single-sample gene set enrichment analysis (ssGSEA) and constructing T-cell risk score (TCRS), as described in the previous articles. In the present study, immune cell abundance in LGG samples was explored using ssGSEA to construct an effector TCRS. The prognostic value of immune cells for overall survival (OS) time prediction was assessed to elucidate functional differences between high- and low-risk groups distinguished by TCRS. Subsequently, a protein–protein interaction (PPI) network, univariate and multivariate Cox analyses, batch survival analysis, and nomogram prediction model can identify the crucial genes related to LGG prognosis and resolve the mode of action of crucial genes in LGG, providing a reference for improving the prognosis of LGG patients.
Data
Data sources
RNA-seq data from the LGG patient sample (n = 512) and corresponding clinical information can be obtained from The Cancer Genome Atlas (TCGA) for inclusion in subsequent analyses.
Prognostic value of immune cells for predicting overall survival
The ssGSEA algorithm is based on a set of 22 immune genes, including genes associated with different immune cell types, functions, pathways, and checkpoints. The ssGSEA results were analyzed using the R package “GSVA” to identify different levels of infiltration of immune cell types, immune-related functions, and immune-related pathways in LGG expression profiles. The image clustering heat map was drawn using the R package “Pheatmap.”
The prognostic value of 22 immune cells for predicting OS was assessed using least absolute shrinkage and selection operator (LASSO) and univariate and multivariate Cox analyses. The TCRS was determined based on the most prognostically significant immune cells, and the optimal cutoff value of the TCRS was calculated using the R package “ggrisk.” The LGG samples were divided into a high-risk–score group and a low-risk–score group based on the optimal cutoff value. Kaplan–Meier and ROC analyses were used to compare the survival of patients in both groups. Based on the ESTIMATE algorithm, the R package “ESTIMATE” was used to calculate the stroma score, immune score, and ESTIMATE score of LGG samples in different risk score groups. The box plot was drawn using the R package “ggpubr.” The relationship between different risk scores and changes in the expression of each immune gene was analyzed.
Differential analysis
Differential analysis was performed on the high-risk–score group and a low-risk–score group using the R package “limma” according to the screening threshold of |Log2FC|>1, adj.p < 0.05. The R package “clusterProfiler” was used to select datasets from the Kyoto Encyclopedia of Genes and Genomes (KEGG) and Gene Ontology (GO).
Protein–protein interaction networks
PPI networks were identified using the STRING database, and the biomolecular interaction networks of related genes were visualized using Cytoscape. A modular analysis of the network was performed using the MCODE plugin to screen the crucial genes in the PPI network. The prognostic value of the differentially expressed genes (DEGs) was analyzed using univariate and multivariate Cox analyses to obtain the genes related to the prognosis of the LGG patient sample, and p < 0.05 was considered to be significant.
Identification of low-grade glioma prognosis-associated genes
A univariate Cox regression analysis was performed on the LGG patient sample DEGs to screen for genes associated with prognosis using the log-rank test. The prognostic differences between the high gene expression group and low gene expression group were analyzed using the R package “Kaplan–Meier,” and p < 0.05 was considered to be significant.
Nomogram construction
Independent prognostic factors were determined based on univariate and multivariate Cox regression models. Column plots were constructed using the R packages “rms” and “survival.” A calibration curve was used to assess the accuracy of the line graphs, and p < 0.05 was considered to be significant.
Cell culture
Human glioma cell lines HS683 and the normal human glial cell line HEB were selected and provided by Xiangya Medical College of Changsha Central South University (China). The cells were cultured in DMEM supplemented with 1% streptomycin/penicillin and 10% FBS under saturated humidity, 37°C, and 5% CO2.
Real-time quantitative polymerase chain reaction
RNA was extracted using a TRIzol kit (Invitrogen, USA), and cDNA was synthesized using a reverse transcription kit. Real-time quantitative polymerase chain reaction (RT-qPCR) was performed using a SYBR Premix Ex Taq kit (TaKaRa, Japan). The primer sequences used are listed in Table 1. Gene expression levels were quantified using the 2−ΔΔCT method. The experiment was repeated three times.
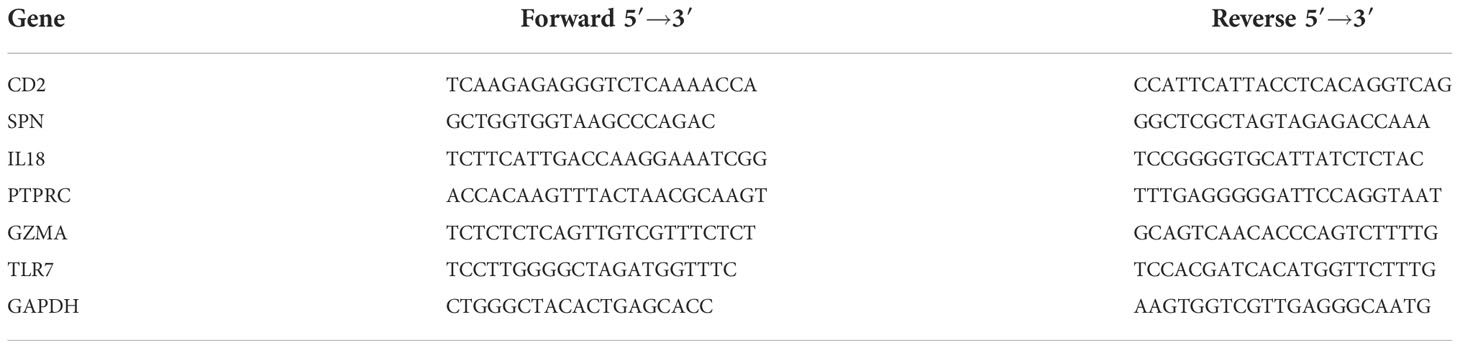
Table 1 RT-qPCR primer sequence.
Results
Prognostic value of immune cells for predicting overall survival
The ssGSEA method was applied to the transcriptome of LGG samples to find the distribution of 22 immune cell types (Figure 1A). Based on the LASSO model, the TCRS can be calculated as follows when lambda.min = 0.0257: RiskScore = 6.74934179805055 * CD4_naive + 6.83207575533917 * Tr1 − 1.22576340775653 * Th1 + 1.31766352136828 * NKT + 2.38814433064296 * B_cell + 3.26414059327394 * Monocyte + 3.2630292767646 * CD4_T (Figure 1B). Furthermore, using univariate and multivariate Cox analyses, the optimal cutoff value of 2.649 was obtained, and the results showed that Tr1, CD4_naive, and B_cell were related to the OS of patients with LGG (Figure 1C). The LGG patient sample was divided into a high-risk–score group and a low-risk–score group based on the optimal cutoff value (Figure 1D). Kaplan–Meier survival curves figured out that patients in the low-risk–score group had greater OS than those in the high-risk–score group (Figure 1E, p < 0.05). The ROC curves showed that TCRS had a better predictive value for 1-, 3-, and 5-year OS (Figure 1F). To verify the validity of the above model, the ESTIMATE algorithm was used to calculate the stromal score, immune score, and ESTIMATE score of LGG samples. The results showed that the stromal score, immune score, and ESTIMATE score were higher in the high-risk–score group than in the low-risk–score group (Figure 1G, p < 0.05). There was a significant difference in the expression of immune genes between the high-risk–score group and the low-risk–score group (Figure 1H, p < 0.05).
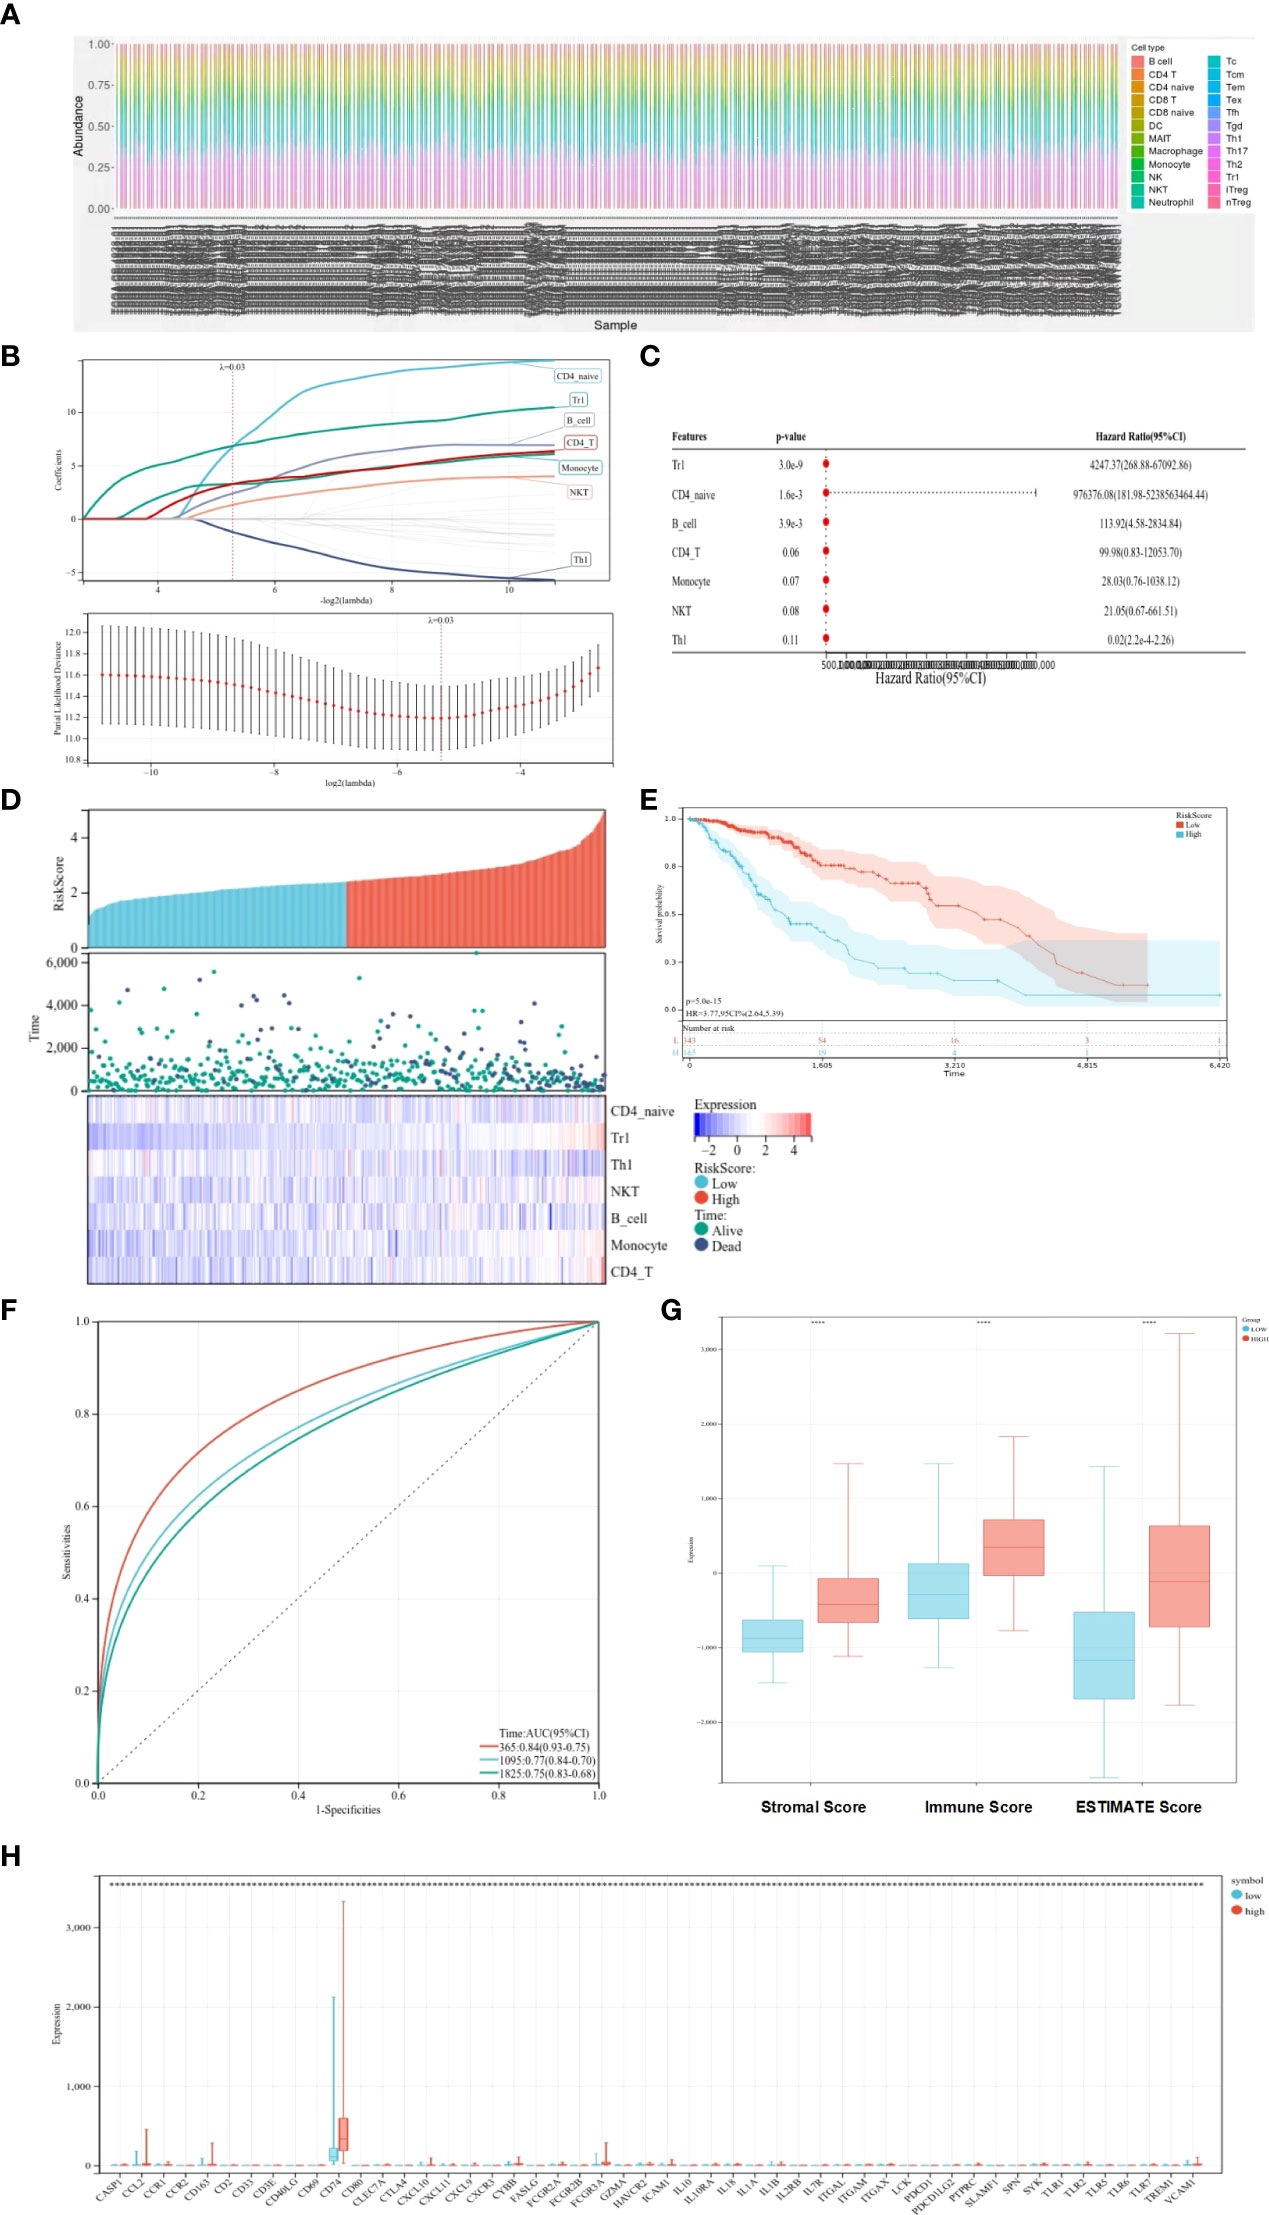
Figure 1 Prognostic value of immune cells for predicting OS. (A) Distribution of immune cell types. (B) LASSO coefficient profiles. (C) Univariate and multifactorial Cox analyses used to identify OS-related immune cells. (D) Heat map of survival status and expression in different risk score groups. (E) Kaplan–Meier survival curves showing survival in the different risk score groups. (F) ROC curve showing the predictive value of TCRS for 1-, 3-, and 5-year OS. (G) Box plots showing differences in the stromal score, immune score, and ESTIMATE score between different risk score groups. (H) Expression of immune genes in different risk-score groups compared with low group. *p < 0.05; **p < 0.01; ***p < 0.001; ****p < 0.0001.
Analysis of differences
Differential analysis was performed on the high-risk–score group and the low-risk–score group, and 799 upregulated genes and 348 downregulated genes were identified (Figures 2A, B). KEGG analysis showed that DEGs were enriched mainly in Staphylococcus aureus infection, complement and coagulation cascades, tuberculosis, and other pathways (Figure 2C). GO analysis showed that DEGs were enriched mainly in the immune system process, immune response, and other terms (Figure 2D).
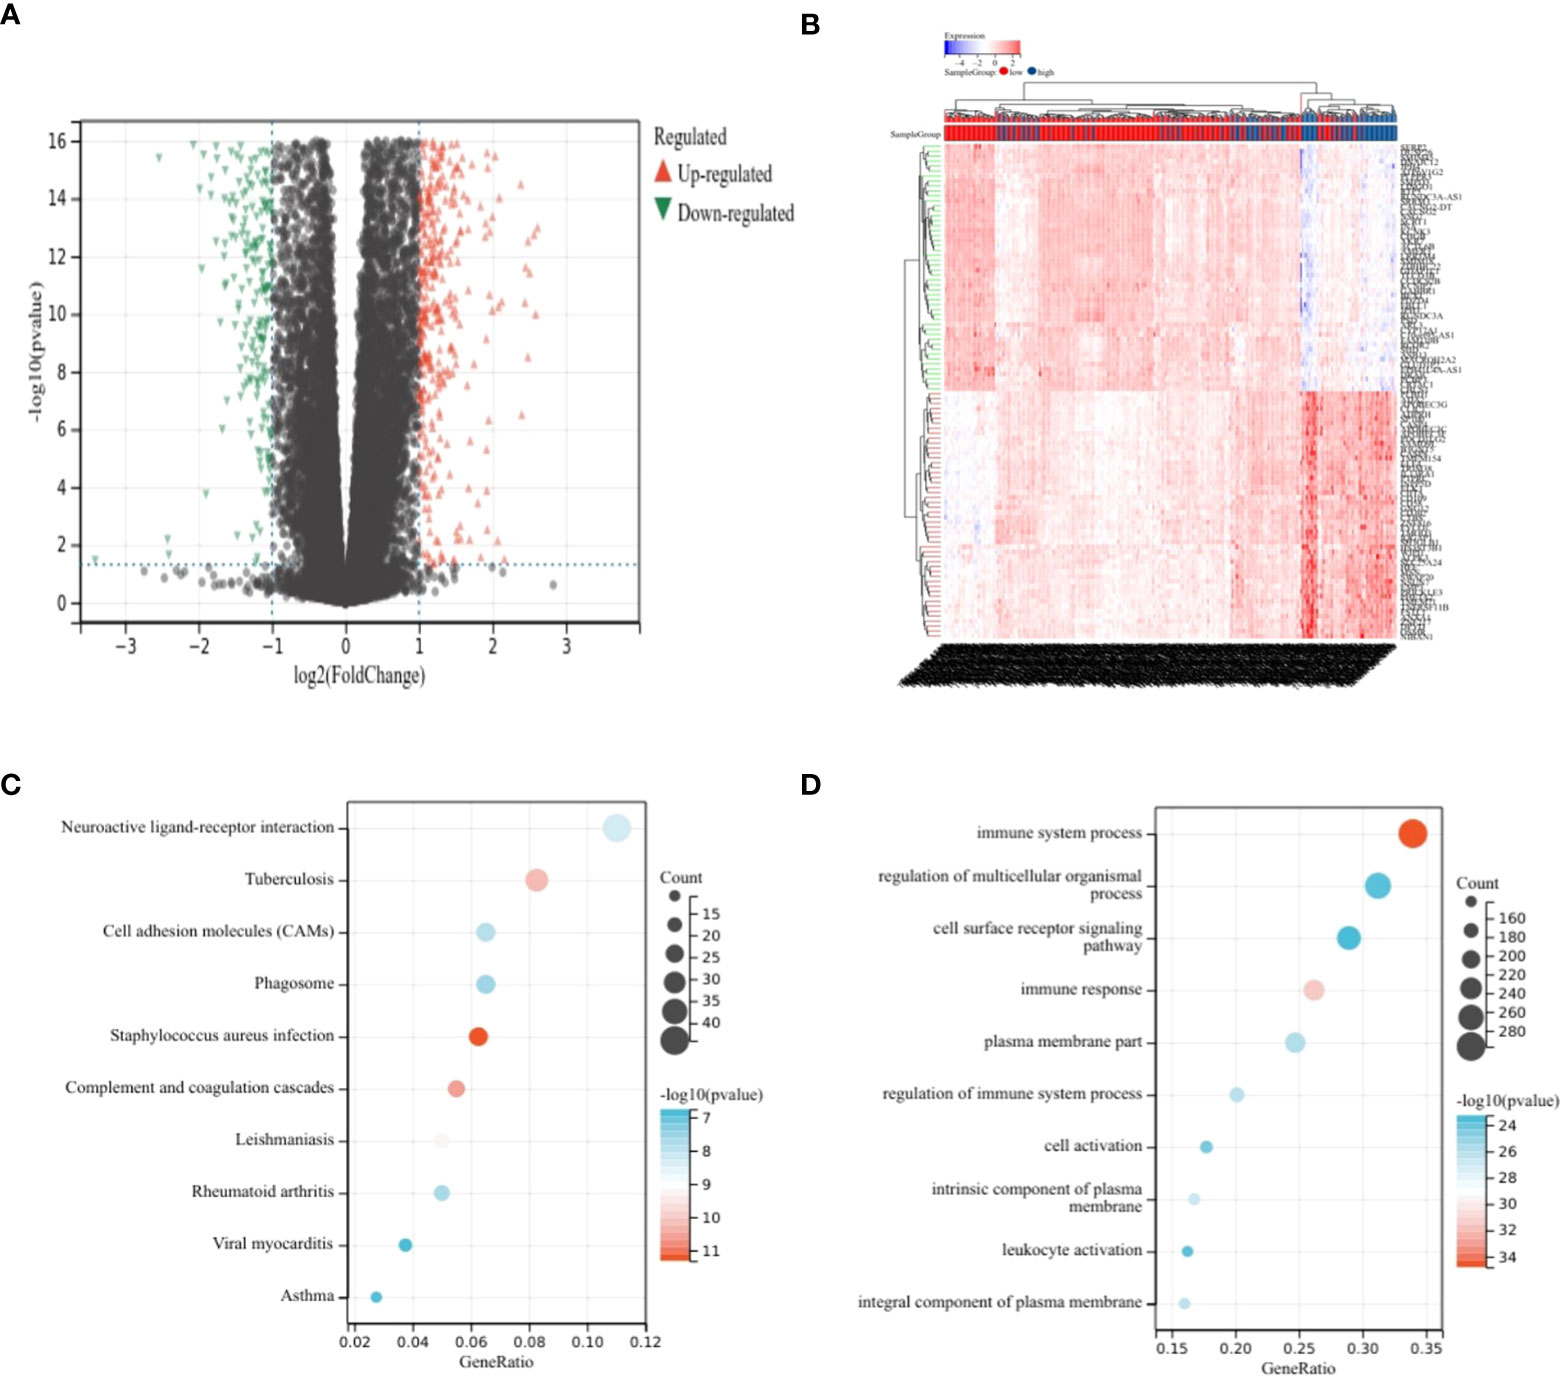
Figure 2 Analysis of differences. (A, B) Volcano plot showing DEGs in different risk score groups. (C) Bubble plot from KEGG analysis showing major enrichment of DEGs. (D) Bubble plot from GO analysis showing major enrichment of DEGs.
Establishment of protein–protein interaction network
The most important module in the PPI network consisted of 50 nodes and 868 edges (Figures 3A, B). The prognostic value of the 50 DEGs was analyzed using univariate and multivariate Cox analyses, and a total of nine prognostic-related genes were obtained, including CD2, SPN, IL18, CLEC7A, PTPRC, TLR2, GZMA, CD163, and TLR7 (Tables 2, 3). The expression of all nine genes was different in the different risk-score groups (Figure 3C, p < 0.05).
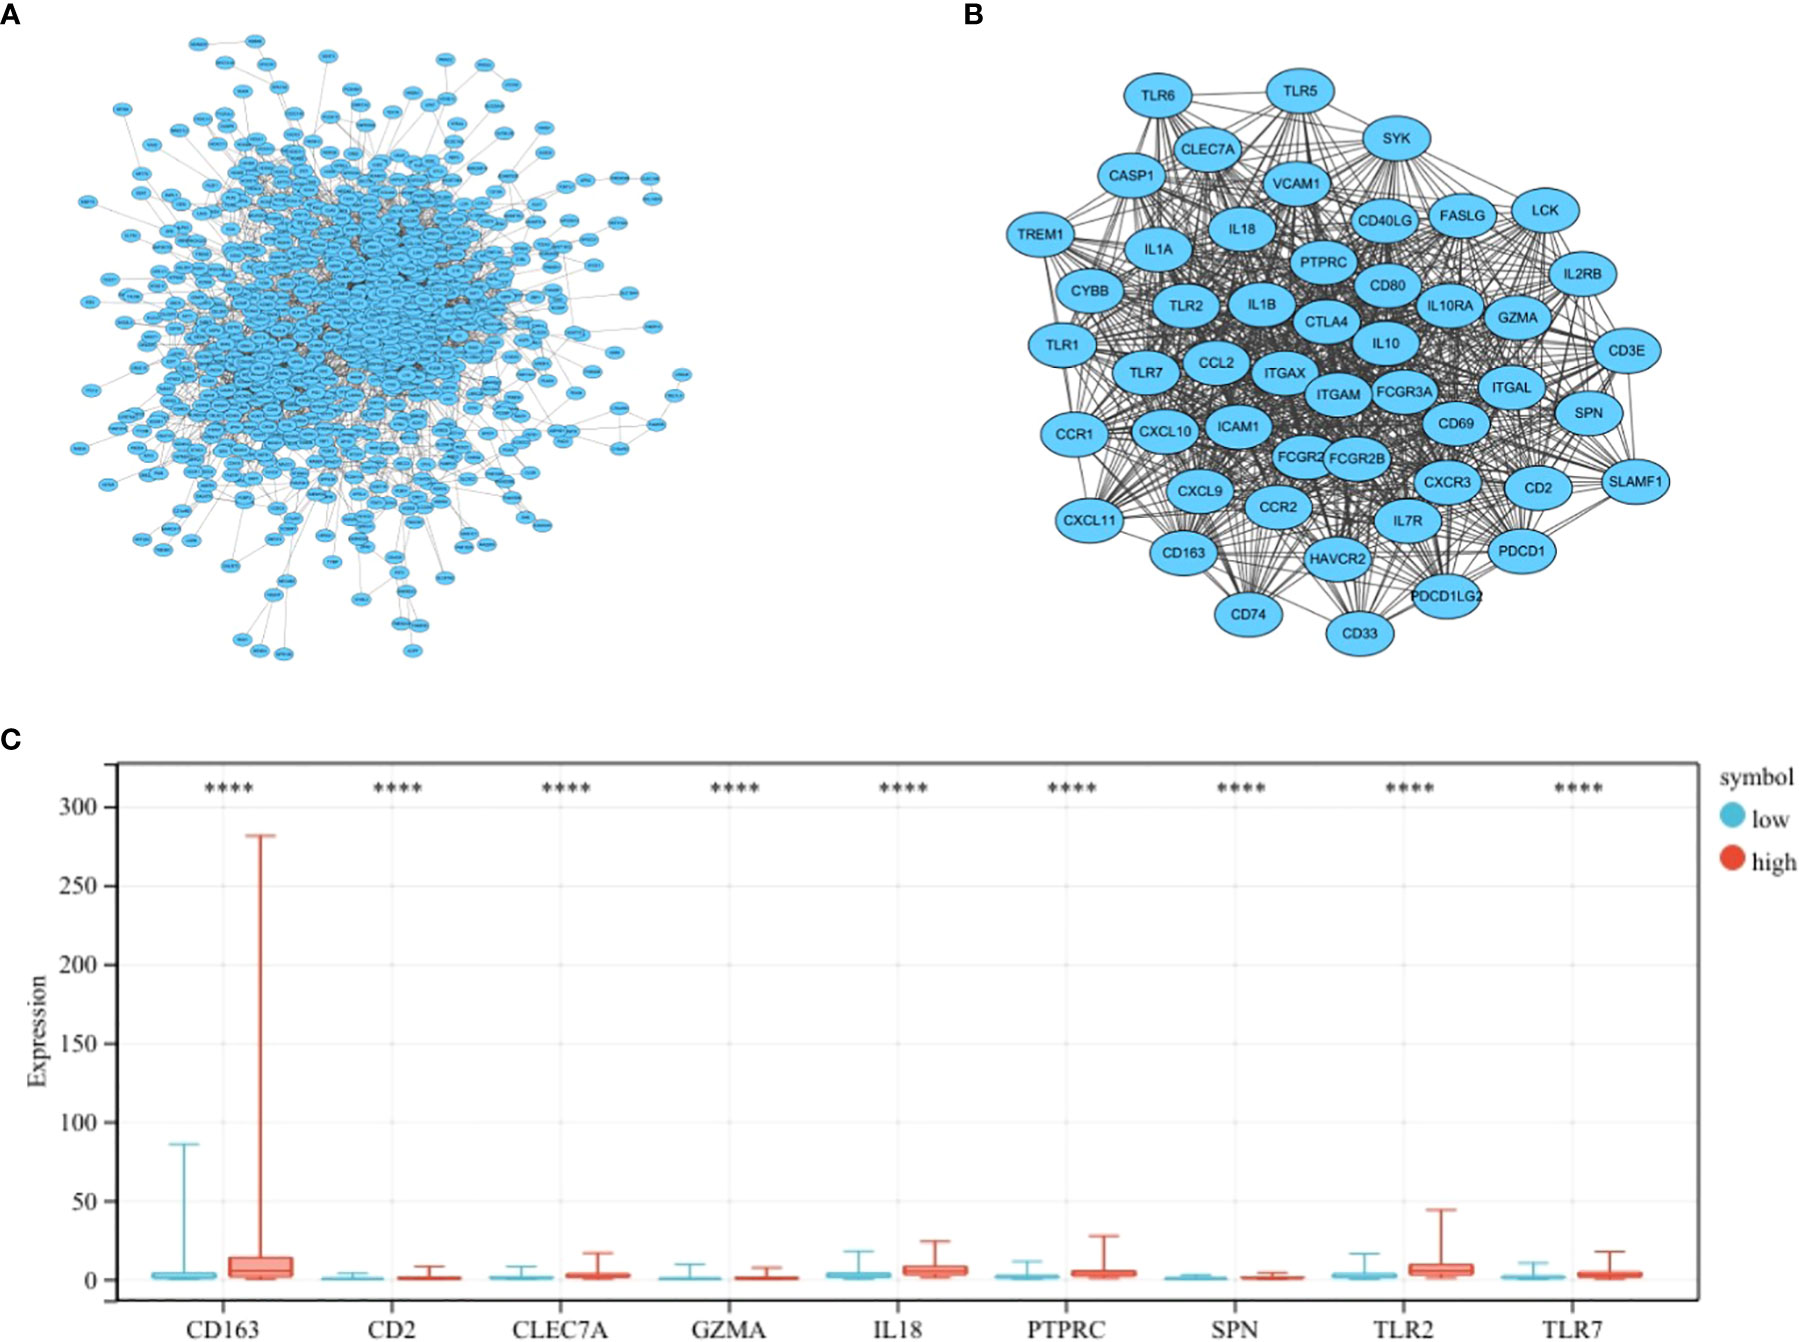
Figure 3 Establishment of the PPI network. (A) PPI network showing protein interactions between nodes. (B) Most important modules in the PPI network. (C) Expression of nine prognosis-related genes in the different risk-score groups compared to low group. ****p < 0.0001.
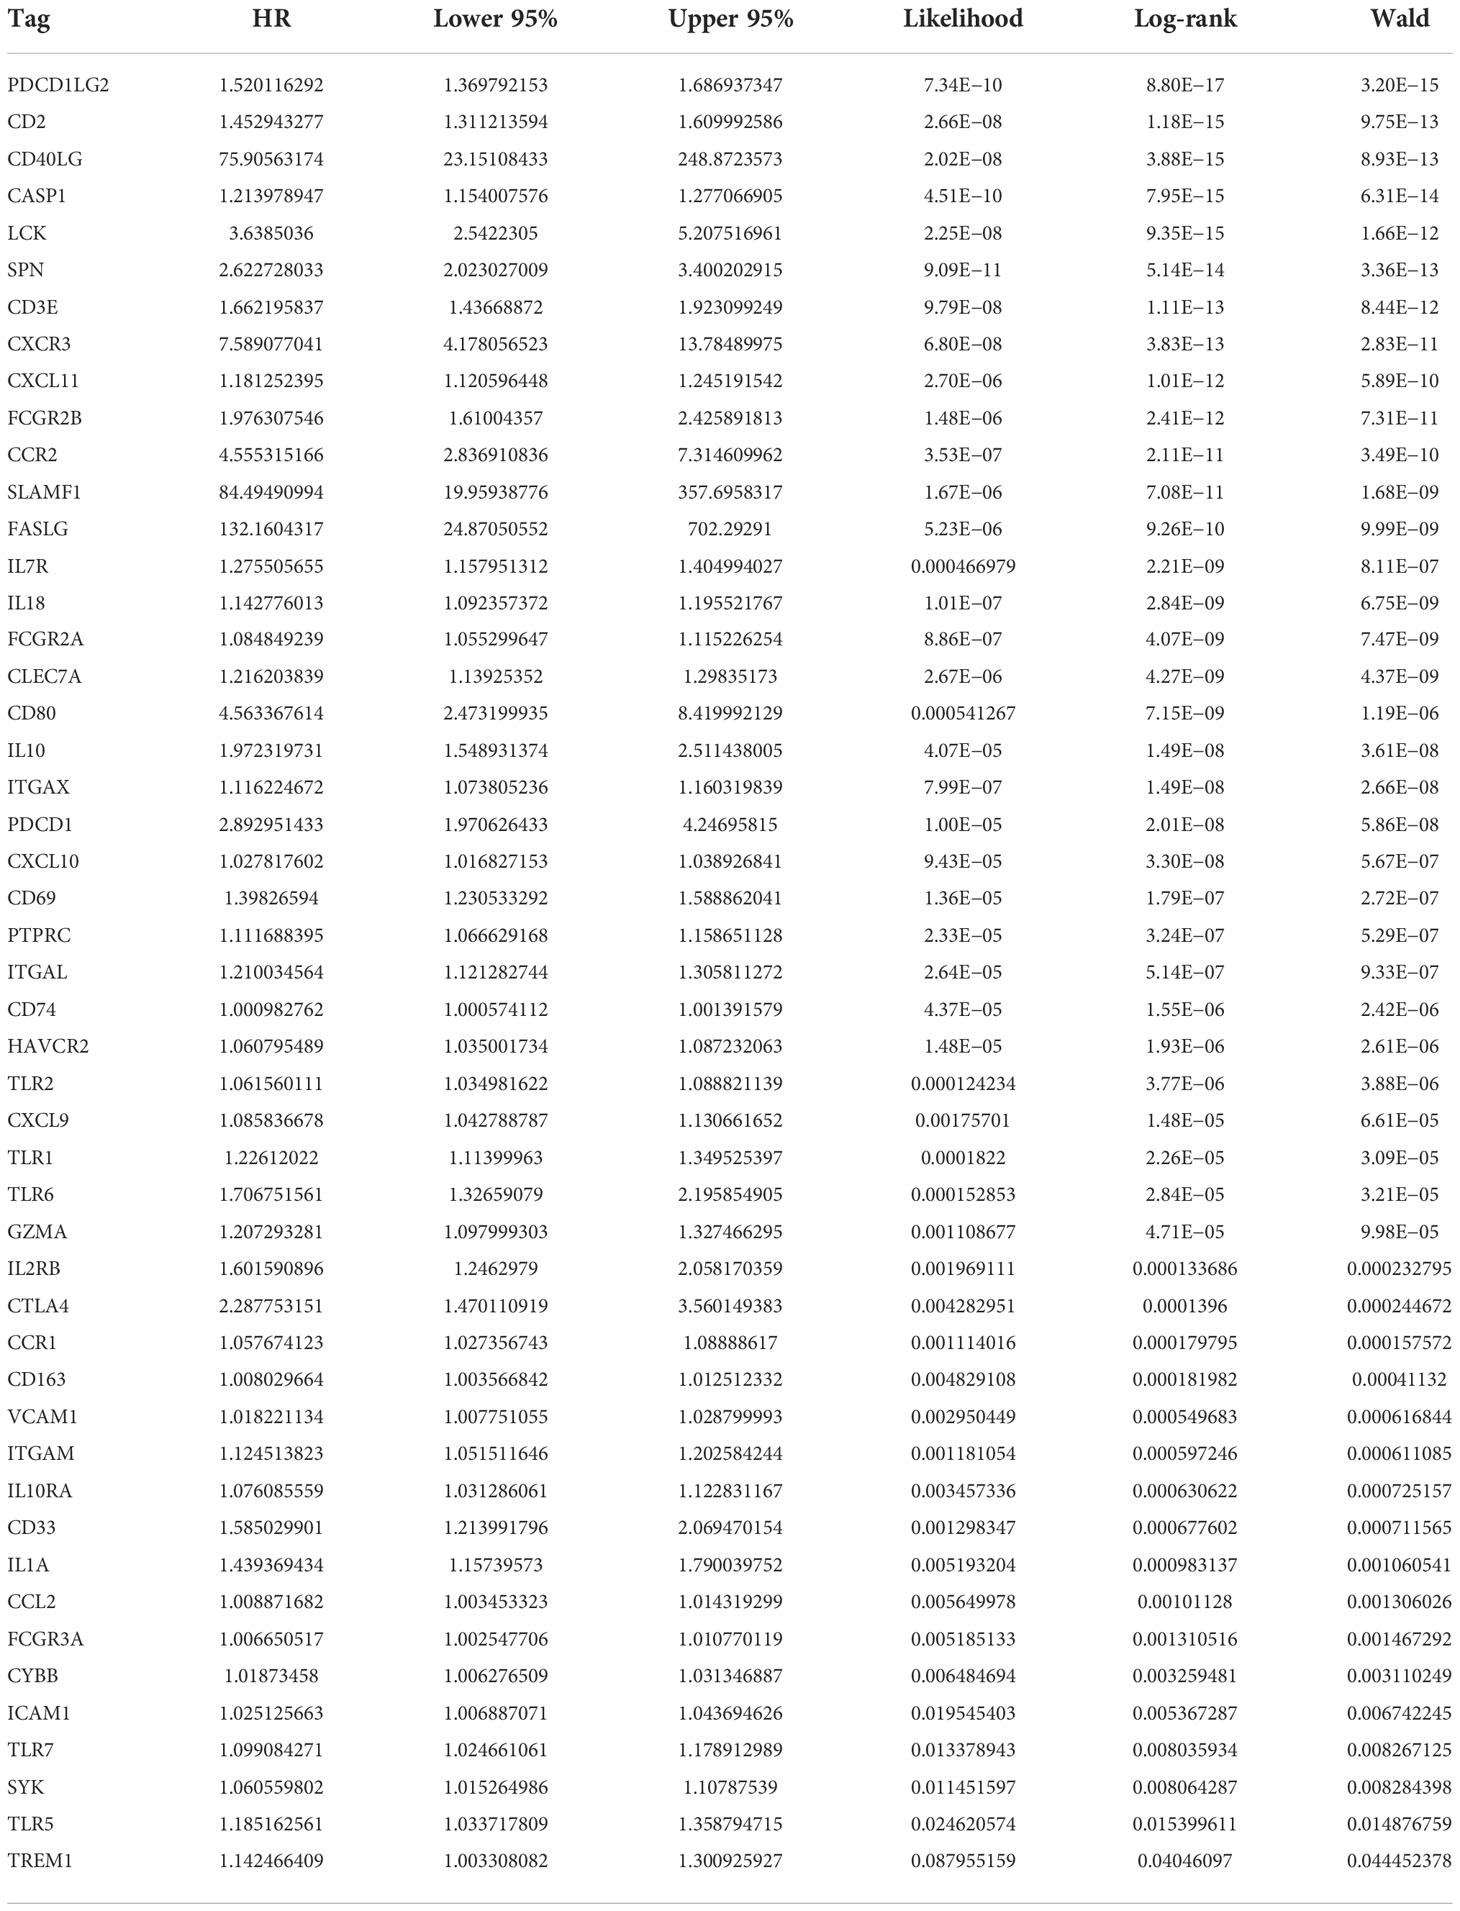
Table 2 Univariate Cox regression analysis.
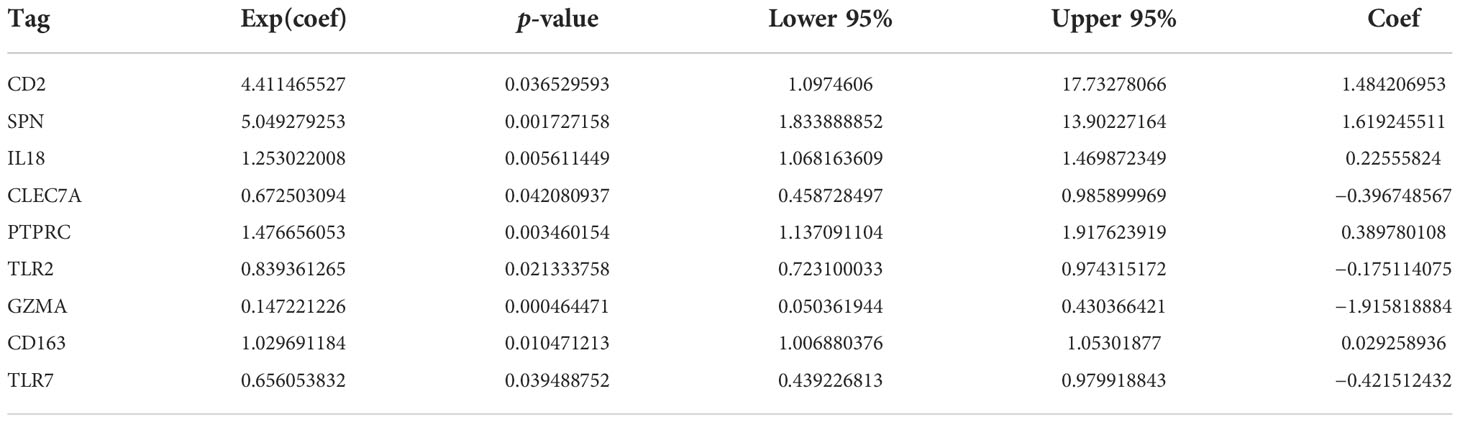
Table 3 Multivariate Cox regression analysis.
Batch survival analysis to identify low-grade glioma prognosis-related genes
Kaplan–Meier survival curves showed that OS was significantly worse in the group with a high expression of CD2, SPN, IL18, CLEC7A, PTPRC, TLR2, GZMA, CD163, and TLR7 (Figure 4, p < 0.05).
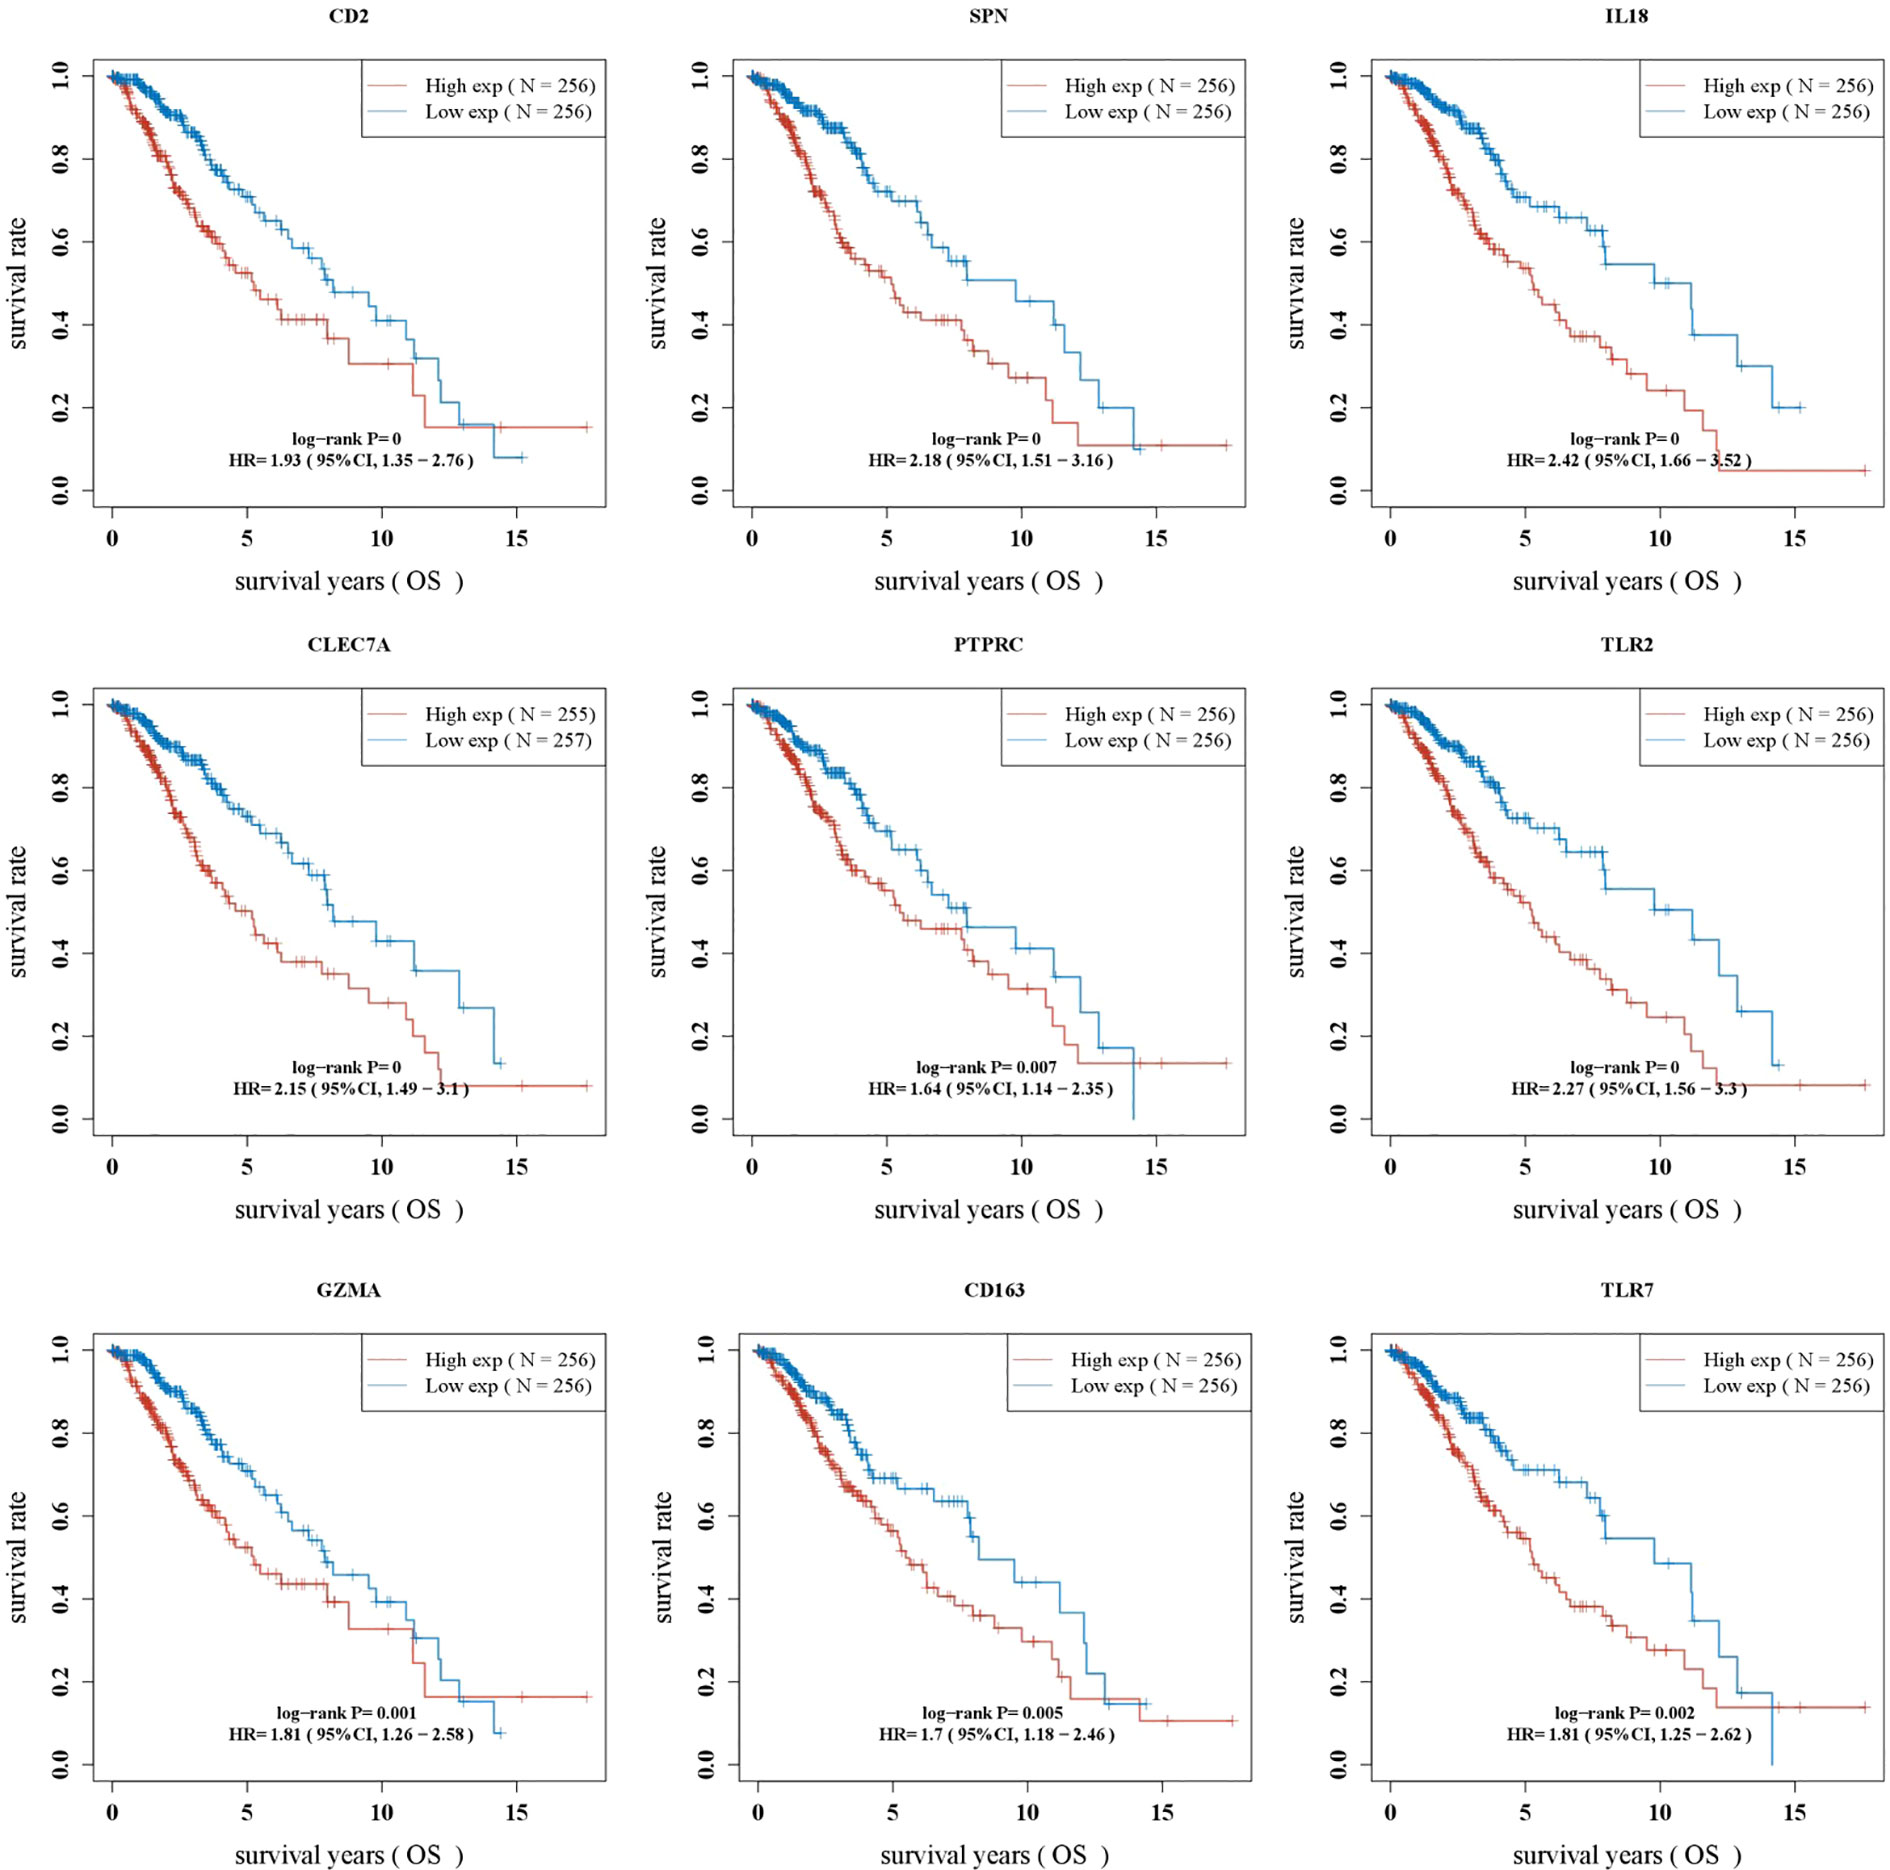
Figure 4 Batch survival analysis identifying LGG prognosis-related genes.
Construction of nomogram prognostic model
A total of nine prognosis-related genes, age, sex, and race were used as variables, and univariate and multivariate Cox analyses showed that CD2, SPN, IL18, PTPRC, GZMA, and TLR7 were independent prognostic factors for LGG (Figures 5A, B, p < 0.05). The nomogram prediction model had good predictive power for 1-, 3-, and 5-year prognoses in LGG patients (Figures 5C, D).
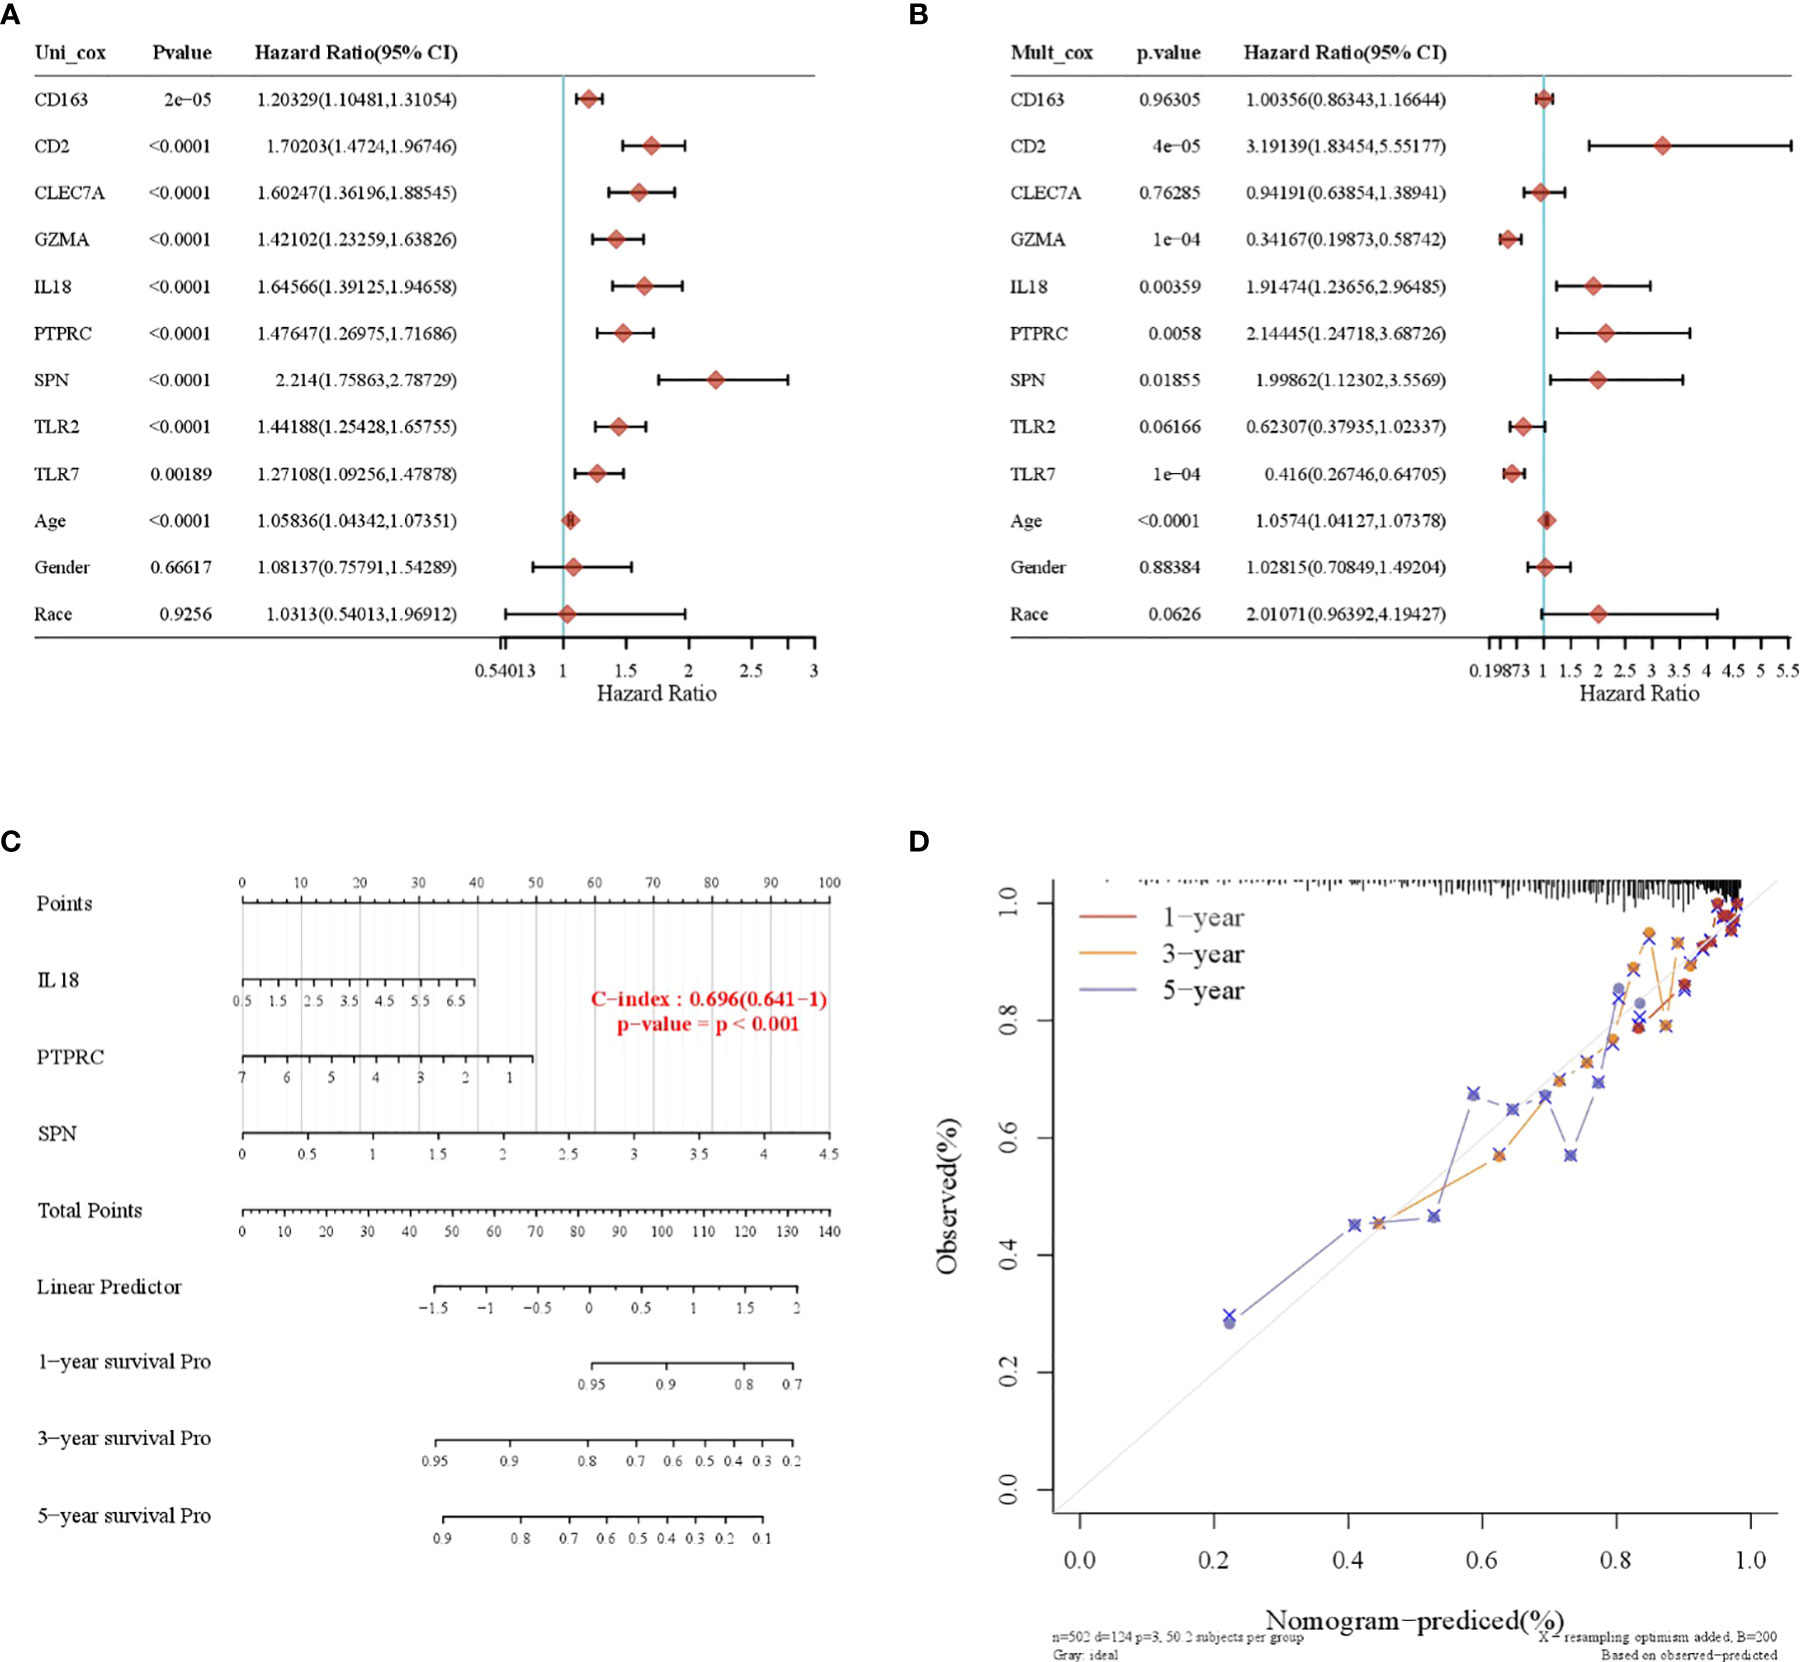
Figure 5 Construction of a nomogram prognostic model. (A) Univariate Cox regression model. (B) Multivariate Cox regression model. (C) Column-line plot for predicting survival time. (D) Calibration curve for predicting a 1-, 3-, and 5-year prognosis.
Expression validation of crucial genes
CD2, SPN, IL18, PTPRC, GZMA, and TLR7 genes were validated using an RT-qPCR assay. The results showed that the expression of CD2, SPN, IL18, PTPRC, GZMA, and TLR7 was upregulated in the tumor group compared with the normal group (Figure 6, p < 0.05).
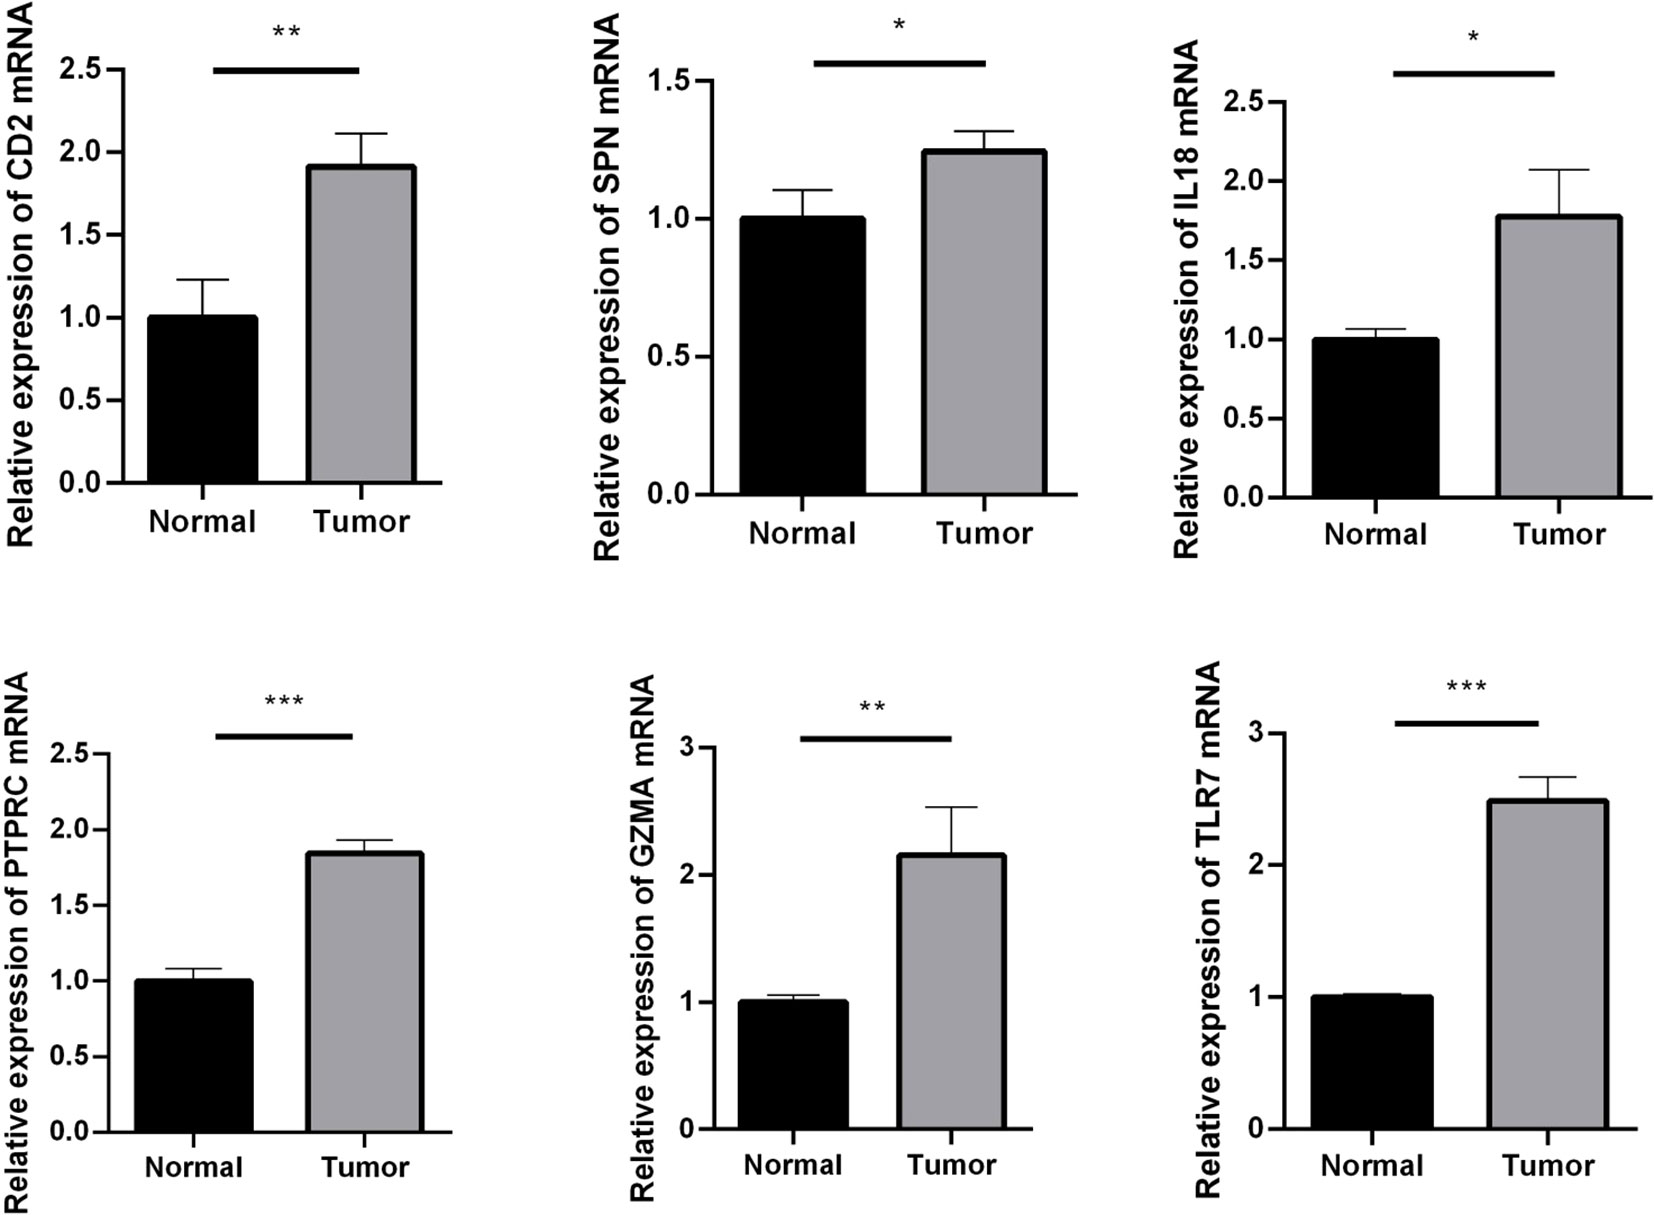
Figure 6 RT-qPCR assay used to verify the expression of crucial genes. Compared with the normal group. *p < 0.05; **p < 0.01; ***p < 0.001.
Discussion
LGG have become a focus of brain tumor research. Surgical resection is currently the main treatment modality for LGG, but because LGG frequently presents with infiltrative growth and is mostly found in functional areas of the brain, extended resection by surgery is greatly limited, and the LGG patients still do not have an ideal prognosis (9, 10). As a result, there is a need to construct effective prognostic prediction models for LGG. Immune infiltration plays a role in the development of LGG (11). Because LGG survive in a complex tumor microenvironment, it brings a serious challenge for clinical assessment and treatment of LGG.
Wu et al. constructed an immune risk score signature (IRSS) using the LASSO model, and the IRSS included six relevant immune genes that were good predictors of prognosis in LGG patients. Moreover, the immune infiltration results showed that the genetic profile correlated with innate immune cytopenia (12). Zhang et al. found that using LASSO and multivariate Cox regression analyses, they were able to obtain six immune genes that comprise a risk model and may be involved in the process of neoantigen presence and triggering immune responses (13). The present study differs from previous LGG-related literature in that we obtained crucial genes that may be associated with LGG prognosis based on ssGSEA and by constructing TCRS. In this study, ssGSEA was performed on 22 immune gene sets to calculate immune-based prognostic scores. The prognostic value of the 22 immune cells for predicting OS was assessed using LASSO and univariate and multivariate Cox analyses. Subsequently, we constructed a validated TCRS to identify immune subtypes and inflammatory immune features in LGG patients. Trl, CD4_naive, and B_cells were found to be related to OS in LGG patients by LASSO and by univariate and multifactorial Cox analyses. We divided the LGG patient sample into a high-risk–score and low-risk–score group according to the optimal cutoff value. Kaplan–Meier survival curves displayed that patients in the low-risk–score group had higher OS. The ROC curve showed that TCRS was able to identify the immune subtype of LGG and had a better predictive value for 1-, 3-, and 5-year OS. We then identified DEGs in the high-risk–score and low-risk–score groups and obtained 799 upregulated genes and 348 downregulated genes. KEGG and GO analyses showed that DEGs were enriched mainly in immune-related processes. We constructed a PPI network using Cytoscape and then identified the top 50 crucial genes. Subsequently, nine DEGs were found to be significantly related to OS based on univariate and multivariate Cox analyses. OS was significantly worse in the high-expression group of CD2, SPN, IL18, CLEC7A, PTPRC, TLR2, GZMA, CD163, and TLR7 compared to the low-expression group. This indicates that these nine crucial genes may be related to the process of immune cells affecting OS. Finally, we constructed a prognostic nomogram model that revealed CD2, SPN, IL18, PTPRC, GZMA, and TLR7 to be independent prognostic factors for LGG. Columnar plots and ROC curves were used to verify that the model was reasonably accurate in predicting the prognosis of LGG patients at 1, 3, and 5 years. In addition, this study used an RT-qPCR assay to verify the bioinformatics results, revealing that CD2, SPN, IL18, PTPRC, GZMA, and TLR7 were highly expressed in LGG.
CD2 is expressed on the surface of all peripheral blood T cells, more than 95% of human thymocytes, most NK cells, and some malignant B cells and may indirectly reflect the immune function of the body’s cells (14). Chen’s team found that CD2 was upregulated in breast cancer samples and that CD2 immunomodulation contributed to the mitigation of disease progression and could be used as an immunomodulatory agent in clinical treatment (15). SPN, alias CD43, encodes a glycoprotein that is expressed on the membrane surface of normal and tumorigenic T cells. SPN can regulate intercellular adhesion, intracellular signaling, cell proliferation, and apoptosis (16). Gao’s team found that miR-129-5p was beneficial in delaying the malignant progression of clear cell renal carcinoma by targeting the downregulation of SPN (17). IL18 is a proinflammatory cytokine with important functions, such as induction of angiogenesis and regulation of immune function, and is involved in the progress of many inflammatory diseases, immune disorders, and tumors (18). Park’s team speculated that IL18 contributes to the poor prognosis of triple-negative breast cancer patients by inducing immunosuppression of PD-1 expression on NK cells (19). PTPRC, alias CD45, is an antigen of leukocytes that is common on their surface. PTPRC acts as a key molecule of signal transduction on cell membranes and positively regulates T-cell antigen receptor signaling (20, 21). PTPRC can affect the processes of cell growth, differentiation, and mitosis, and it has been suggested that PTPRC may have a role in regulating the MAPK/ERK signaling pathway, with implications for cervical carcinogenesis and patient prognosis (22). GZMA is a serine protease that is mainly secreted by NK cells and cytotoxic T lymphocytes and delivered to bacterial or virally infected target cells (23). GZMA mediates apoptosis and cell scorching, induces the release of inflammatory factors, is involved in the body’s defense against pathogenic bacterial infections, and is associated with the development of certain autoimmune diseases (24). Santiago’s team showed that GZMA can be involved in tumor development and is a potential prognostic target for various cancers; this may be due to the ability of extracellular GZMA to promote the production of NF-κB-dependent IL6 in macrophages (25). TLR7 is an important pattern recognition receptor in natural immunity, playing a vital role in the body’s resistance to pathogenic infections and acting as a key line of defense for the immune system (26). Studies have shown that TLR7 can be used as a reliable marker of poor prognosis, which reveals the high expression of TLR7 in patients with non-small cell lung cancer, which is related to the inflammatory process of TLR7 signaling (27).
In summary, CD2, SPN, IL18, PTPRC, GZMA, and TLR7 were identified as independent prognostic factors for LGG, and these genes may be potential indicators of the regulation of the immune microenvironment. This may contribute to the clinical development of more effective therapeutic agents. To ensure the accuracy of the results, a larger sample is needed, and other datasets should be used for validation. In addition, the mechanisms of action of CD2, SPN, IL18, PTPRC, GZMA, and TLR7 in LGG require further exploration.
Data availability statement
Publicly available datasets were analyzed in this study. These data can be found in the TCGA database (https://tcga-data.nci.nih.gov/tcga/).
Author contributions
YH: Conceptualization, Methodology, Formal analysis, Writing - Original Draft. ZL: Methodology, Formal analysis, Writing - Review & Editing. ST: Conceptualization, Validation, Data Curation, Writing - Original Draft. All authors contributed to the article and approved the submitted version.
Funding
This project is supported by Hainan Province Clinical Medical Center (QWYH202175).
Conflict of interest
The authors declare that the research was conducted in the absence of any commercial or financial relationships that could be construed as a potential conflict of interest.
Publisher’s note
All claims expressed in this article are solely those of the authors and do not necessarily represent those of their affiliated organizations, or those of the publisher, the editors and the reviewers. Any product that may be evaluated in this article, or claim that may be made by its manufacturer, is not guaranteed or endorsed by the publisher.
References
1. Ostrom QT, Bauchet L, Davis FG, Deltour I, Fisher JL, Langer CE, et al. The epidemiology of glioma in adults: a “state of the science” review. Neuro-oncology (2014) 16(7):896–913. doi: 10.1093/neuonc/nou087
2. Molinaro AM, Taylor JW, Wiencke JK, Wrensch MR. Genetic and molecular epidemiology of adult diffuse glioma. Nat Rev Neurol (2019) 15(7):405–17. doi: 10.1038/s41582-019-0220-2
3. Tom MC, Cahill DP, Buckner JC, Dietrich J, Parsons MW, Yu JS. Management for different glioma subtypes: are all low-grade gliomas created equal? Am Soc Clin Oncol Educ Book (2019) 39:133–45. doi: 10.1200/EDBK_238353
4. Brown TJ, Bota DA, van Den Bent MJ, Brown PD, Maher E, Aregawi D, et al. Management of low-grade glioma: a systematic review and meta-analysis. Neuro-oncol practice. (2019) 6(4):249–58. doi: 10.1093/nop/npy034
5. Morshed RA, Young JS, Hervey-Jumper SL, Berger MS. The management of low-grade gliomas in adults. J Neurosurg Sci (2019) 63(4):450–7. doi: 10.23736/S0390-5616.19.04701-5
6. Gieryng A, Pszczolkowska D, Walentynowicz KA, Rajan WD, Kaminska B. Immune microenvironment of gliomas. Lab Invest (2017) 97(5):498–518. doi: 10.1038/labinvest.2017.19
7. Miyauchi JT, Tsirka SE. Advances in immunotherapeutic research for glioma therapy. J neurology. (2018) 265(4):741–56. doi: 10.1007/s00415-017-8695-5
8. Lim M, Xia Y, Bettegowda C, Weller M. Current state of immunotherapy for glioblastoma. Nat Rev Clin Oncol (2018) 15(7):422–42. doi: 10.1038/s41571-018-0003-5
9. Delgado-López P, Corrales-García E, Martino J, Lastra-Aras E, Dueñas-Polo M. Diffuse low-grade glioma: a review on the new molecular classification, natural history and current management strategies. Clin Trans Oncol (2017) 19(8):931–44. doi: 10.1007/s12094-017-1631-4
10. Jooma R, Waqas M, Khan I. Diffuse low-grade glioma–changing concepts in diagnosis and management: a review. Asian J neurosurg (2019) 14(02):356–63. doi: 10.4103/ajns.AJNS_24_18
11. Haddad AF, Young JS, Oh JY, Okada H, Aghi MK. The immunology of low-grade gliomas. Neurosurg Focus. (2022) 52(2):E2. doi: 10.3171/2021.11.FOCUS21587
12. Wu Y, Peng Z, Gu S, Wang H, Xiang W. A risk score signature consisting of six immune genes predicts overall survival in patients with lower-grade gliomas. Comput Math Methods Med (2022) 2022:2558548. doi: 10.1155/2022/2558548
13. Zhang M, Wang X, Chen X, Zhang Q, Hong J. Novel immune-related gene signature for risk stratification and prognosis of survival in lower-grade glioma. Front Genet (2020) 11:363. doi: 10.3389/fgene.2020.00363
14. Demetriou P, Abu-Shah E, Valvo S, McCuaig S, Mayya V, Kvalvaag A, et al. A dynamic CD2-rich compartment at the outer edge of the immunological synapse boosts and integrates signals. Nat Immunol (2020) 21(10):1232–43. doi: 10.1038/s41590-020-0770-x
15. Chen Y, Meng Z, Zhang L, Liu F. CD2 is a novel immune-related prognostic biomarker of invasive breast carcinoma that modulates the tumor microenvironment. Front Immunol (2021) 12:664845. doi: 10.3389/fimmu.2021.664845
16. Tuccillo FM, de Laurentiis A, Palmieri C, Fiume G, Bonelli P, Borrelli A, et al. Aberrant glycosylation as biomarker for cancer: Focus on CD43. BioMed Res Int (2014) 2014:742831. doi: 10.1155/2014/742831
17. Gao B, Wang L, Zhang N, Han M, Zhang Y, Liu H, et al. miR-129-5p inhibits clear cell renal cell carcinoma cell proliferation, migration and invasion by targeting SPN. Cancer Cell Int (2021) 21(1):1–9. doi: 10.1186/s12935-021-01820-3
18. Haghshenas MR, Saffarian A, Khademolhosseini A, Dehghanian AR, Ghaderi A, Jahromi AS. Simultaneous increase in serum levels of IL-37 and IL-18 binding protein in low-grade and high-grade brain tumors. Asian Pacific J Cancer Prev (2022) 23(8):2851–6. doi: 10.31557/APJCP.2022.23.8.2851
19. Park IH, Yang HN, Lee KJ, Kim T-S, Lee ES, Jung S-Y, et al. Tumor-derived IL-18 induces PD-1 expression on immunosuppressive NK cells in triple-negative breast cancer. Oncotarget (2017) 8(20):32722. doi: 10.18632/oncotarget.16281
20. Junghans V, Santos AM, Lui Y, Davis SJ, Jönsson P. Dimensions and interactions of large T-cell surface proteins. Front Immunol (2018) 9:2215. doi: 10.3389/fimmu.2018.02215
21. Courtney AH, Shvets AA, Lu W, Griffante G, Mollenauer M, Horkova V, et al. CD45 functions as a signaling gatekeeper in T cells. Sci Signaling (2019) 12(604):eaaw8151. doi: 10.1126/scisignal.aaw8151
22. Chen S, Gao C, Wu Y, Huang Z. Identification of prognostic miRNA signature and lymph node metastasis-related key genes in cervical cancer. Front Pharmacol (2020) 11:544. doi: 10.3389/fphar.2020.00544
23. Shimizu K, Yamasaki S, Sakurai M, Yumoto N, Ikeda M, Mishima-Tsumagari C, et al. Granzyme a stimulates pDCs to promote adaptive immunity via induction of type I IFN. Front Immunol (2019) 10:1450. doi: 10.3389/fimmu.2019.01450
24. Velaga S, Ukena SN, Dringenberg U, Alter C, Pardo J, Kershaw O, et al. Granzyme a is required for regulatory T-cell mediated prevention of gastrointestinal graft-versus-host disease. PloS One (2015) 10(4):e0124927. doi: 10.1371/journal.pone.0124927
25. Santiago L, Castro M, Sanz-Pamplona R, Garzón M, Ramirez-Labrada A, Tapia E, et al. Extracellular granzyme a promotes colorectal cancer development by enhancing gut inflammation. Cell Rep (2020) 32(1):107847. doi: 10.1016/j.celrep.2020.107847
26. Schön M, Schön M. TLR7 and TLR8 as targets in cancer therapy. Oncogene (2008) 27(2):190–9. doi: 10.1038/sj.onc.1210913
27. Chatterjee S, Crozet L, Damotte D, Iribarren K, Schramm C, Alifano M, et al. TLR7 promotes tumor progression, chemotherapy resistance, and poor clinical outcomes in non–small cell lung CancerRole of TLR7 in physiopathology of lung cancer. Cancer Res (2014) 74(18):5008–18. doi: 10.1158/0008-5472.CAN-13-2698
Keywords: low-grade glioma, immune infiltration, T-cell risk score, crucial gene, prognosis
Citation: He Y, Lin Z and Tan S (2022) Identification of prognosis-related gene features in low-grade glioma based on ssGSEA. Front. Oncol. 12:1056623. doi: 10.3389/fonc.2022.1056623
Received: 29 September 2022; Accepted: 23 November 2022;
Published: 14 December 2022.
Edited by:
Ye Wang, The Second Affiliated Hospital of Medical College of Qingdao University, ChinaReviewed by:
Li Qiu, Tianjin Medical University Cancer Institute and Hospital, ChinaLi Youkong, Jingzhou Central Hospital, China
Copyright © 2022 He, Lin and Tan. This is an open-access article distributed under the terms of the Creative Commons Attribution License (CC BY). The use, distribution or reproduction in other forums is permitted, provided the original author(s) and the copyright owner(s) are credited and that the original publication in this journal is cited, in accordance with accepted academic practice. No use, distribution or reproduction is permitted which does not comply with these terms.
*Correspondence: Sanyang Tan, dGFuc2FueWFuZ2xvdmVAMTYzLmNvbQ==
†These authors have contributed equally to this work and share first authorship