 Jihui Li
 Bin Zhang
 Shushan Ge1†
 Shengming Deng
 Chunhong Hu
94% of researchers rate our articles as excellent or good
Learn more about the work of our research integrity team to safeguard the quality of each article we publish.
Find out more
ORIGINAL RESEARCH article
Front. Oncol. , 17 November 2022
Sec. Radiation Oncology
Volume 12 - 2022 | https://doi.org/10.3389/fonc.2022.1047905
Objectives: In the present study, we aimed to determine the prognostic value of the 18F-FDG PET/CT-based radiomics model when predicting progression-free survival (PFS) and overall survival (OS) in patients with non-small cell lung cancer (NSCLC).
Methods: A total of 368 NSCLC patients who underwent 18F-FDG PET/CT before treatment were randomly assigned to the training (n = 257) and validation (n = 111) cohorts. Radiomics signatures from PET and CT images were obtained using LIFEx software, and then clinical and complex models were constructed and validated by selecting optimal parameters based on PFS and OS to construct radiomics signatures.
Results: In the training cohort, the C-index of the clinical model for predicting PFS and OS in NSCLC patients was 0.748 and 0.834, respectively, and the AUC values were 0.758 and 0.846, respectively. The C-index of the complex model for predicting PFS and OS was 0.775 and 0.881, respectively, and the AUC values were 0.780 and 0.891, respectively. The C-index of the clinical model for predicting PFS and OS in the validation group was 0.729 and 0.832, respectively, and the AUC values were 0.776 and 0.850, respectively. The C-index of the complex model for predicting PFS and OS was 0.755 and 0.867, respectively, and the AUC values were 0.791 and 0.874, respectively. Moreover, decision curve analysis showed that the complex model had a higher net benefit than the clinical model.
Conclusions: 18F-FDG PET/CT radiomics before treatment could predict PFS and OS in NSCLC patients, and the predictive power was higher when combined with clinical factors.
Lung cancer is one of the most predominant malignancies worldwide, with a high incidence and mortality rate. Non-small cell lung cancer (NSCLC) is the most common pathological type of lung cancer, accounting for 85% of all lung cancer cases (1). Lymph node metastases or distant metastases often occur before diagnosis due to the lack of early and specific clinical signs, significantly affecting treatment and prognosis. The 5-year survival rate for lung cancer is less than 20% (2), while the availability of new drugs or treatments has improved survival rates for lung cancer patients. Even with the same treatment, the patients reflect a vast difference. Identifying the risk of recurrence at the time of diagnosis allows the patient’s treatment to be adjusted, thus enhancing the patient’s survival.
Preoperative conventional imaging methods are essential for determining TNM staging, which is traditionally used to assess treatment response or survival. However, it has some limitations, which produce a significant variation in survival durations for patients with the same tumor stage. The prognosis of NSCLC remains uncertain, mainly at the time of diagnosis (3). Genomic studies have shown that intra-tumor heterogeneity is a common feature of solid tumors, such as NSCLC (4, 5). However, because this procedure is invasive and sampling tissue is limited, it does not provide a complete characterization of tumor heterogeneity. Therefore, robust biomarkers that can provide a complete characterization of tumor heterogeneity may be of great value. Radiomics studies have shown promising results in revealing intra-tumor heterogeneity and predicting prognosis and treatment response in cancer patients (6–8). Radiomics is the high-throughput extraction of a large number of quantitative image features from medical images. It can capture information on the intensity, texture, and shape of lesions, which can be used to develop predictive models based on screened features to support personalized decision-making and treatment (9).
18F-FDG PET/CT has been used by clinicians to diagnose and evaluate NSCLC patients (8). Several studies have focused on tumor radiomic analysis of NSCLC patients to predict recurrence (10–12). The combination of radiomic features (RSs) and TNM staging or other clinicopathology (CP) data performs better than TNM staging alone in estimating disease-free survival in patients with early-stage NSCLC.
Recently, although radiomics has made significant progress in various malignancies (13–15), the radiomics literature for predicting prognosis in NSCLC is relatively sparse. A multimodality radiomics approach has great potential to address the limitations of unimodality models, as it can extract more meaningful features and thus provide a more robust description of the underlying tumor. In the present study, we retrospectively analyzed the data of NSCLC patients and screened feature parameters with predictive significance for prognosis by radiomics methods, aiming to construct a non-invasive deep learning model based on RSs of pretreatment PET/CT images to predict the survival prognosis of NSCLC patients.
This retrospective study was approved by the institutional review board of the First Affiliated Hospital of Soochow University, and the informed consent was waived due to the retrospective nature of the study (ChiCTR2200062555).
NSCLC patients who underwent a combined imaging protocol of 18F-FDG PET/CT between January 2019 and June 2021 were recruited in our present retrospective study. Inclusion criteria were as follows: (a) patients who underwent biopsy or surgery of lung tumor; (b) patients with immunohistochemistry (IHC) examination of PD-L1 performed; (c) histological type and grade were pathologically proven; (d) standard 18F-FDG PET/CT was performed before biopsy or surgery; and (e) complete clinical profile. Exclusion criteria were as follows: (a) therapy (radiotherapy, chemotherapy, or chemoradiotherapy) was performed before 18F-FDG PET/CT and IHC; (b) patients with unknown histological grade; (c) the size of the primary lesion was too small for segmentation; (d) multi-center primary lung cancer; and (e) patients with other types of cancers or with incomplete clinical and imaging datasets. A total of 368 patients were enrolled in the present study, and they were randomly divided into the training (n = 257) and validation (n = 111) cohorts at a ratio of 7:3 (16).
The 18F-FDG PET/CT examination was performed after 6 h of fasting with blood glucose lower than 11.1 mmol/L. Approximately 40-60 min after the injection of 18F-FDG (4.07- 5.55 MBq/kg), PET/CT was performed from the base of the skull to the midthigh with 2-3 min per bed position (reconstructed by ordered subset expectation-maximization algorithm) using a Discovery PET/CT (General Electric Medical Systems, Milwaukee WI, USA) with low-dose CT parameters (140 kV, 120 mA, trans axial FOV of 70 cm, slice thickness 3.75 mm).
The region of interest (ROI) of the lesion was outlined layer by layer on the image cross-section using LIFEx freeware (17) (v6.30 https://www.lifexsoft.org/) two experienced nuclear medicine physicians who were blinded to the clinical and pathological information of patients. Areas with abnormal uptake of 18F-FDG on PET and abnormal density on CT were defined as lesions. The volume of interest (VOI) in three-dimensional coordinates was automatically defined on PET images with the SUVmax threshold of 41%. The RSs were summarized across all VOIs. Spatial resampling had a voxel size of 2 × 2 × 2 mm. Intensity discretization for CT data was performed with the number of gray levels of 400 bins and absolute scale bounds from -1,000 and 3,000 HU, while it was conducted with 64 bins between 0 and 20 for PET data. The RSs were extracted from PET and CT images within the same VOI due to the excellent matching of PET and CT images. If the respiratory motion caused a mismatch between the PET and CT images, it could be adjusted manually. The RSs of PET and CT images were selected by the following procedure. Intra-class correlation coefficients (ICCs) were calculated to evaluate the repeatability of all the features, of which ICCs > 0.75 were selected for model construction (18, 19). Subsequently, the retained features were further selected by the least absolute shrinkage and selection operator (LASSO) regression algorithm. In addition, 10-fold cross-validation was applied to select the parameter of Lambda (l) to avoid overfitting.
Patients were followed up from the first diagnosis of NSCLC by surgery or puncture pathology to June 30, 2021 (the last follow-up date), in conjunction with outpatient review data or by telephone. Progression-free survival (PFS) was defined as the time from the first diagnosis of NSCLC by surgery or puncture pathology to the date of tumor progression, death, or the follow-up cut-off date. Overall survival (OS) was defined as the time from the first diagnosis of NSCLC by surgery or puncture pathology to the date of death or the follow-up cut-off date. Receiver operating characteristic (ROC) curves and Harrell’s consistency index (C-index) were used to assess the model’s capability to predict outcomes in both training and validation cohorts. Moreover, calibration curves were produced to assess the model’s calibration. In order to evaluate the clinical value of various models, decision curve analysis (DCA) was employed to calculate the net benefit at various threshold probabilities.
IBM SPSS statistics version 26.0, Python version 3.0 (https://www.python.org), MedCalc software (MedCalc Software, Ostend, Belgium), and R 3.6.3 software package were used for statistical analyses. P < 0.05 was considered statistically significant. The continuous variables were transformed into dichotomous variables for further statistical analysis. The Kaplan⁃Meier (KM) curve was used for survival analysis, the log⁃rank test was used for univariate survival analysis, Cox proportional risk regression model was used for the multifactor prognostic analysis of significant influencing factors, and the hazard ratio (HR) and its 95% CI were estimated.
A total of 368 patients were enrolled in this study. Table 1 summarizes the clinical characteristics of patients in the training and validation cohorts. Of these patients, there were not any statistically significant differences in the clinical characteristics between the training and validation cohorts. Of the 368 patients, 20.92% (77/368) had disease progression, and 4.62% (17/368) died. Of the 257 patients in the training group, 21.4% (55/257) had disease progression, and 3.5% (9/257) died, with a median OS and PFS of 16 and 14 months, respectively. Of the 111 patients in the validation group, 19.82% (22/111) had disease progression, 5.41% (6/111) died, and the median OS and PFS were 17 and 14 months, respectively.
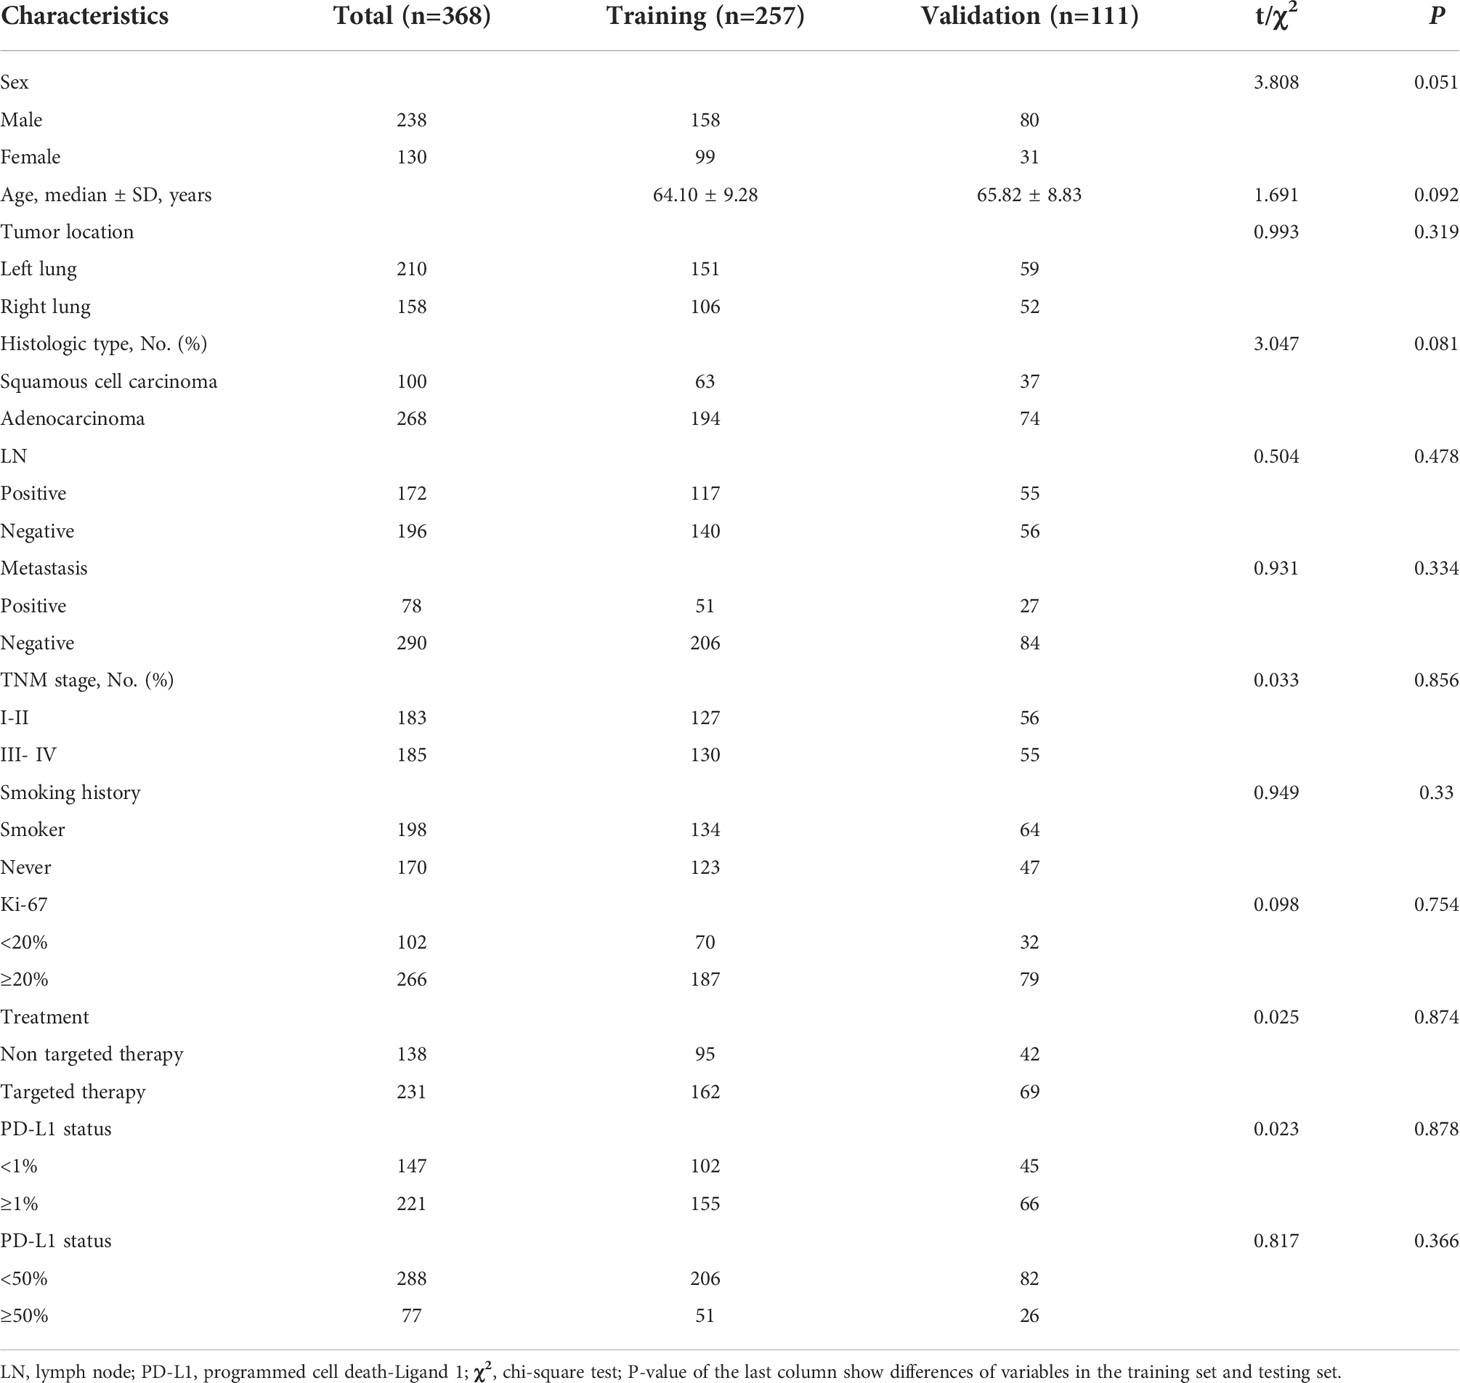
Table 1 Clinical characteristics of patients in the training and validation cohorts.
Prognosis-related features were selected from the LASSO regression in the training cohort. Three PET RSs (DISCRETIZED_HISTO_Entropy_log2, CONVENTIONAL_SUVbwmin, and CONVENTIONAL_SUVbwmax) and two CT RSs (NGLDM_Contrast and GLZLM_SZLGE) were selected for predicting PFS. Three PET RSs (DISCRETIZED_SUVbwmin, GLRLM_RLNU, and GLRLM_RP) and three CT RSs (CONVENTIONAL_Humax, GLCM_Entropy_log10, and GLZLM_ZLNU) were selected for predicting OS. Rad-score (PFS) = DISCRETIZED_HISTO_Entropy_log2 × 0.3397+CONVENTIONAL_SUVbwmin × 0.1288 - GLRLM_SRHGE × 0.3009 -NGLDM_Contrast × 0.3187 + GLZLM_SZLGE × 0.2147. Rad-score (OS) = CONVENTIONAL_Humax × 0.7139 - GLCM_Entropy_log10 × 0.8292 + GLZLM_ZLNU × 0.3407 + DISCRETIZED_SUVbwmin × 0.2364 + GLRLM_RLNU × 0.6754 - GLRLM_RP × 1.4249. Besides, the Rad-score was calculated for predicting PFS (AUC = 0.739) and OS (AUC = 0.696) based on the above-selected RSs. The optimal cut-off values of the Rad-score generated by the ROC analysis were 0.375 for PFS and 0.508 for OS in the training cohort. Accordingly, patients were classified into the low-risk and high-risk groups. The radiomic workflow is presented in Figure 1.
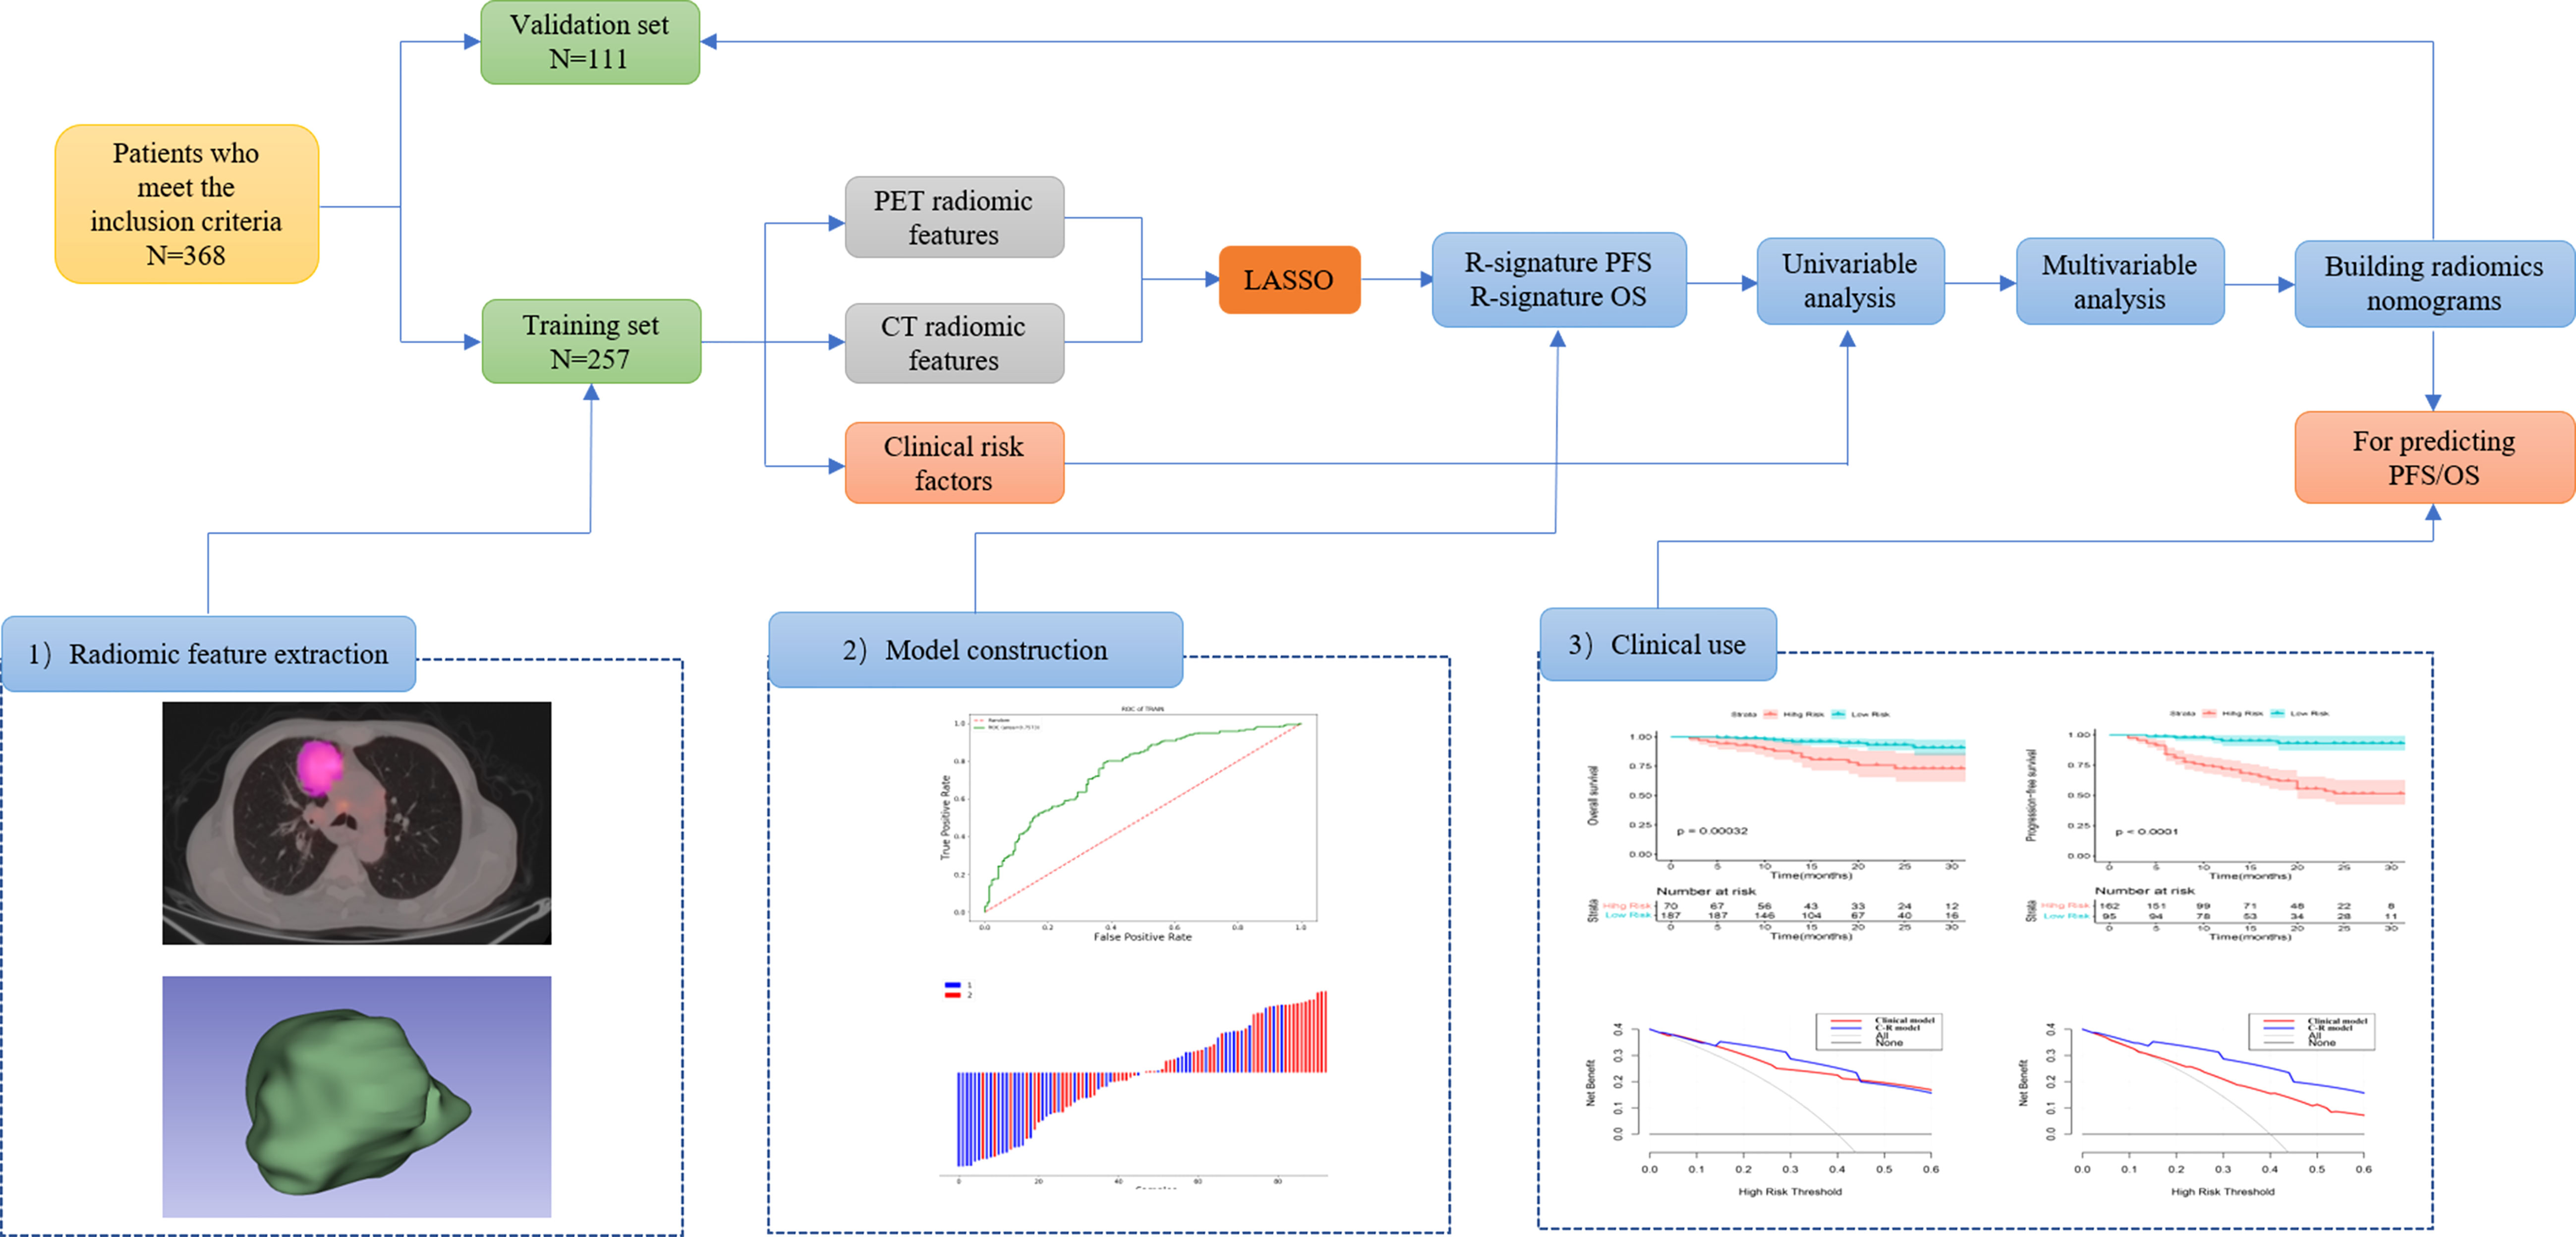
Figure 1 Workflow of the radiomics analysis. 1) tumor masking and feature extraction; 2) model construction; 3) clinical use.
Univariate and multivariate Cox regression analyses were used to determine the relationship between clinical features and imaging indicators with survival (Table 2 and Table 3; Figure 2). Using PFS as the study endpoint, KM univariate analysis showed that gender, TNM staging, pathology, smoking history, treatment modality, distant metastasis, Ki-67, lymph node metastasis, SUVmax, MTV, TLG, and Rad-score were factors influencing the PFS of patients (all P < 0.05). Cox multifactorial analysis showed that gender, smoking history, lymph node metastasis, distant metastasis, and Rad-score were independent prognostic factors affecting PFS (all P < 0.05). With OS as the study endpoint, KM univariate analysis showed that gender, PD-L1 50%, smoking history, distant metastasis, lymph node metastasis, SUVmax, MTV, TLG, and Rad-score were factors influencing the OS of patients (all P < 0.05). Cox multivariate analysis showed that smoking history, distant metastasis, and Rad-score were factors influencing the OS of patients (all P < 0.05). Furthermore, Rad-score and clinical factors were significantly correlated with PFS and OS in the training cohort and validation cohort (Figure 3 and Figure 4).
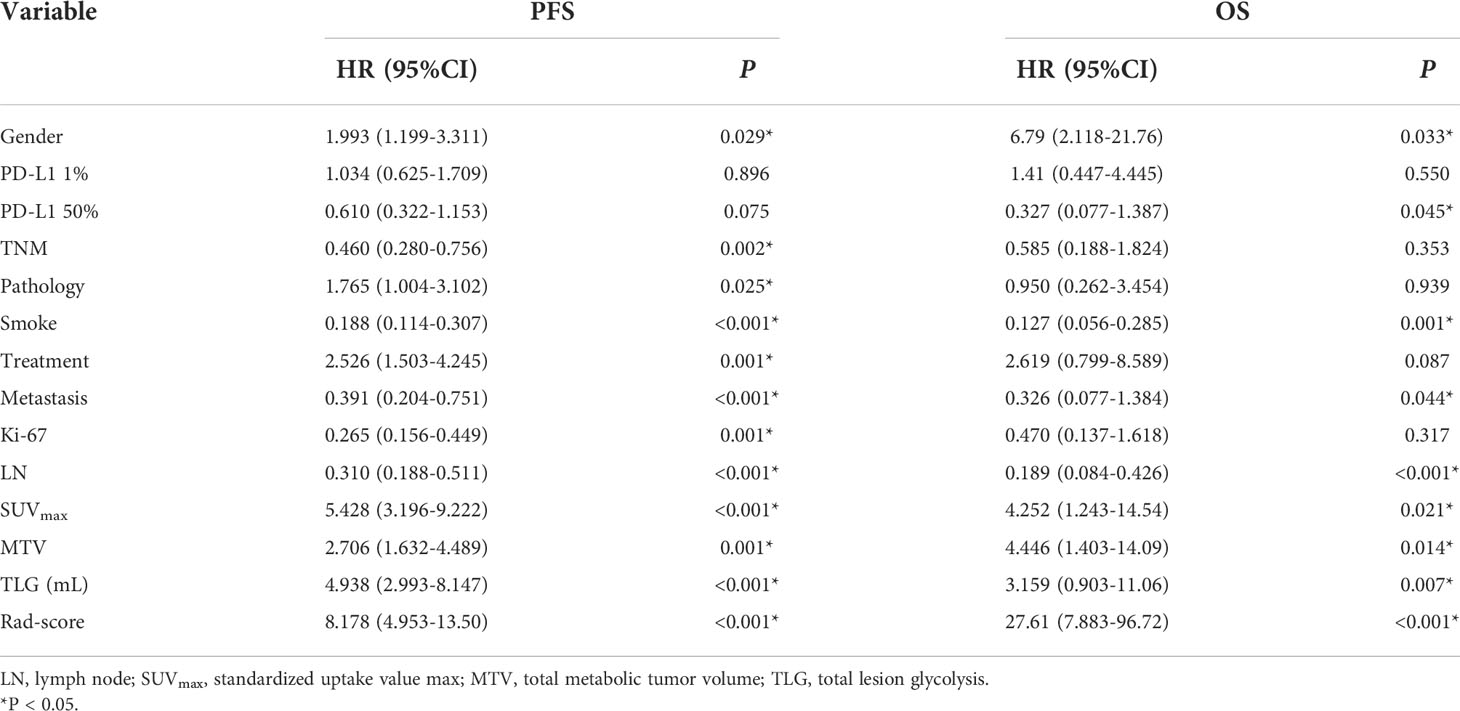
Table 2 The results of the univariate Cox regression analysis.
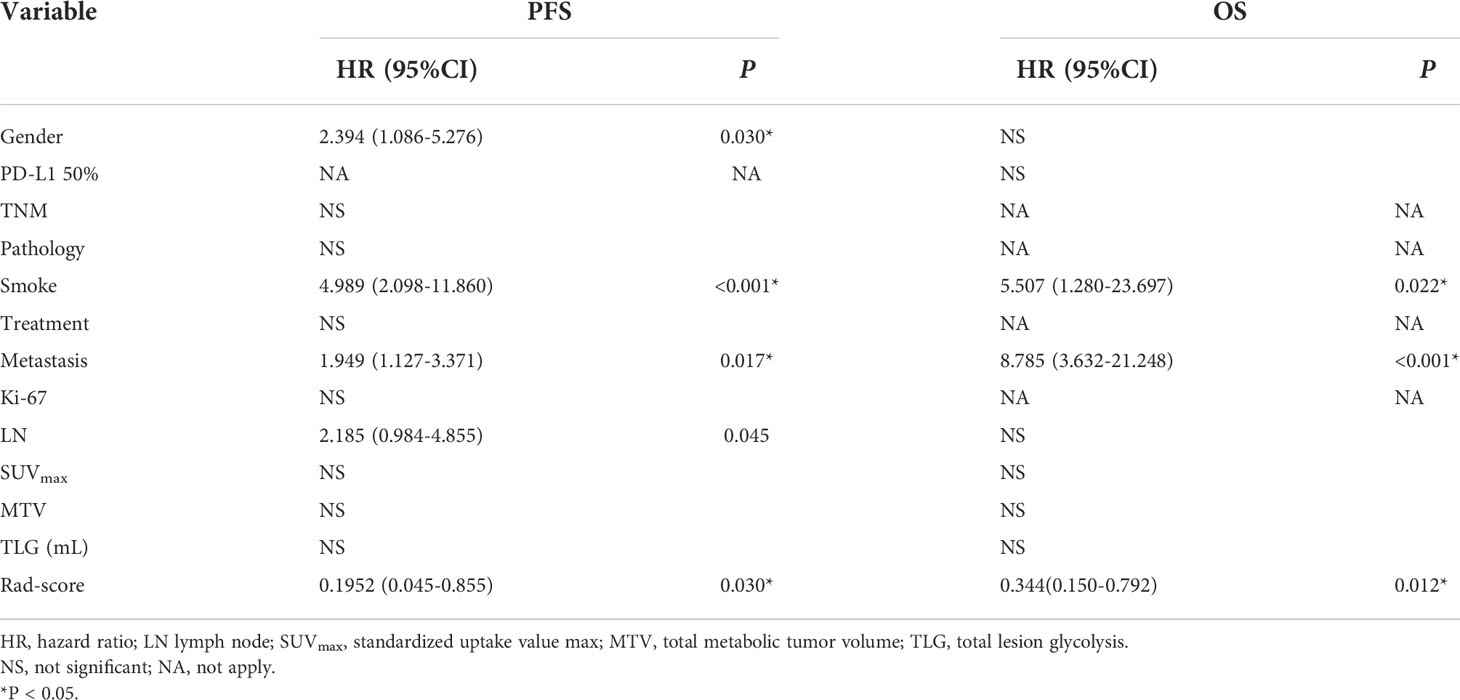
Table 3 The results of the multivariate Cox regression analysis.
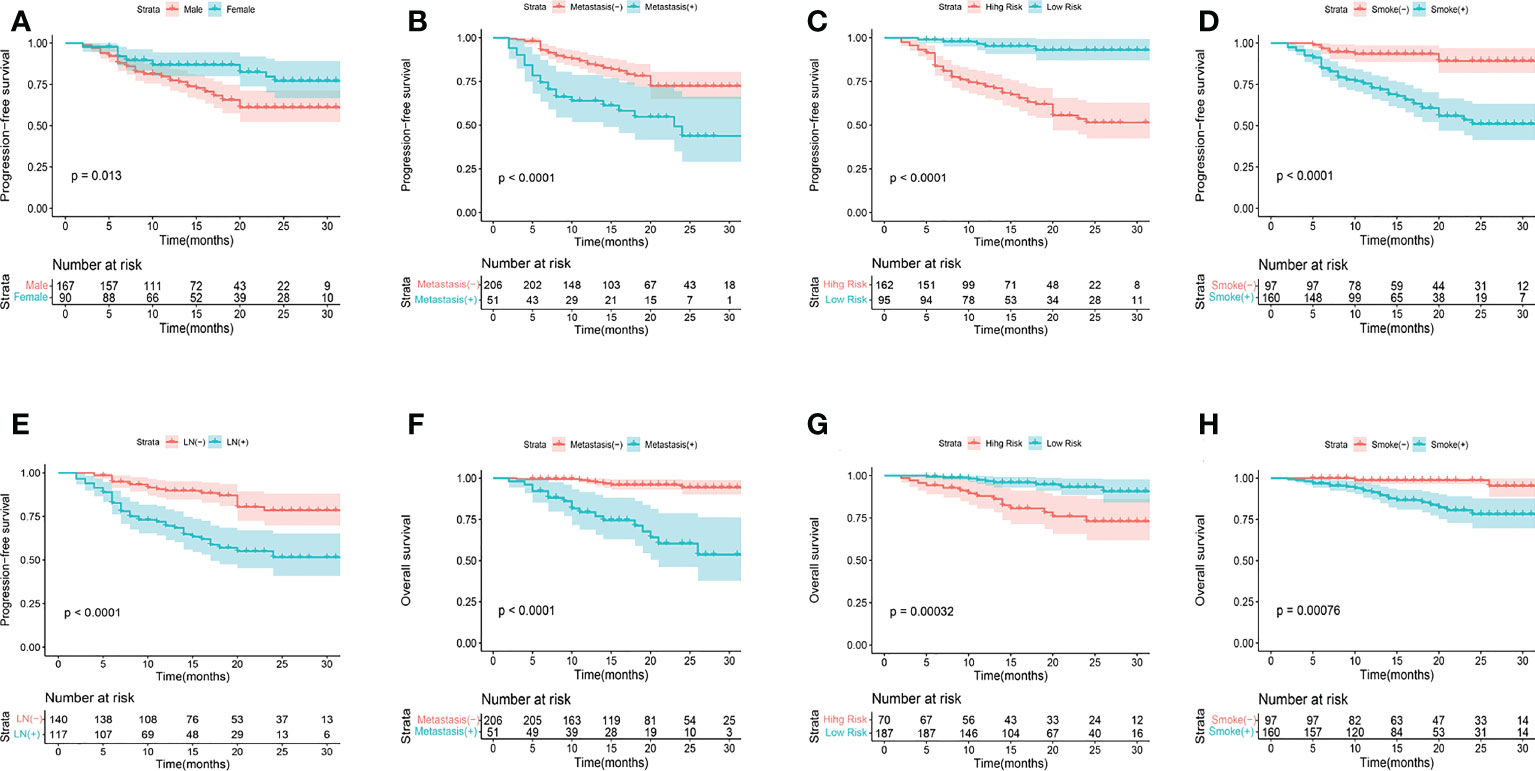
Figure 2 KM analyses for PFS (A-E) and OS (F-H) according to gender, metastasis, smoking history, R-signatures, and lymph node metastasis in the training cohort.
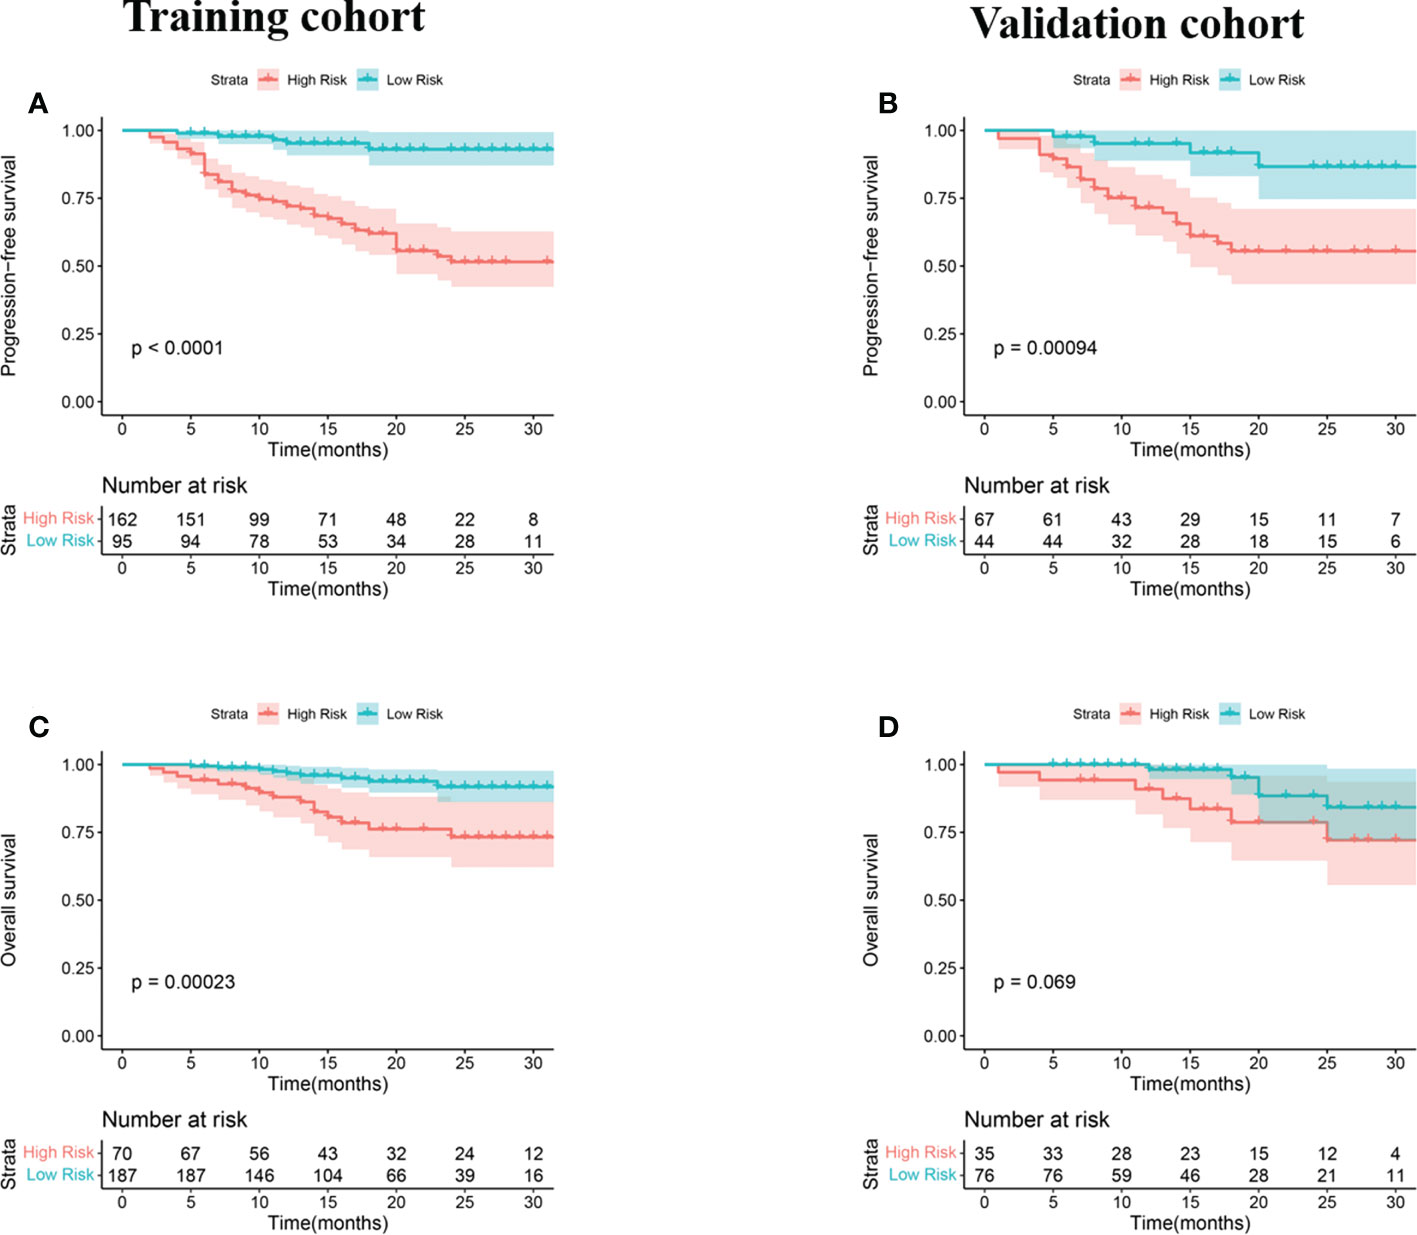
Figure 3 KM analyses for patients stratified by risk classification according to R-signatures for patients in the training (A, C) and validation (B, D) cohorts.
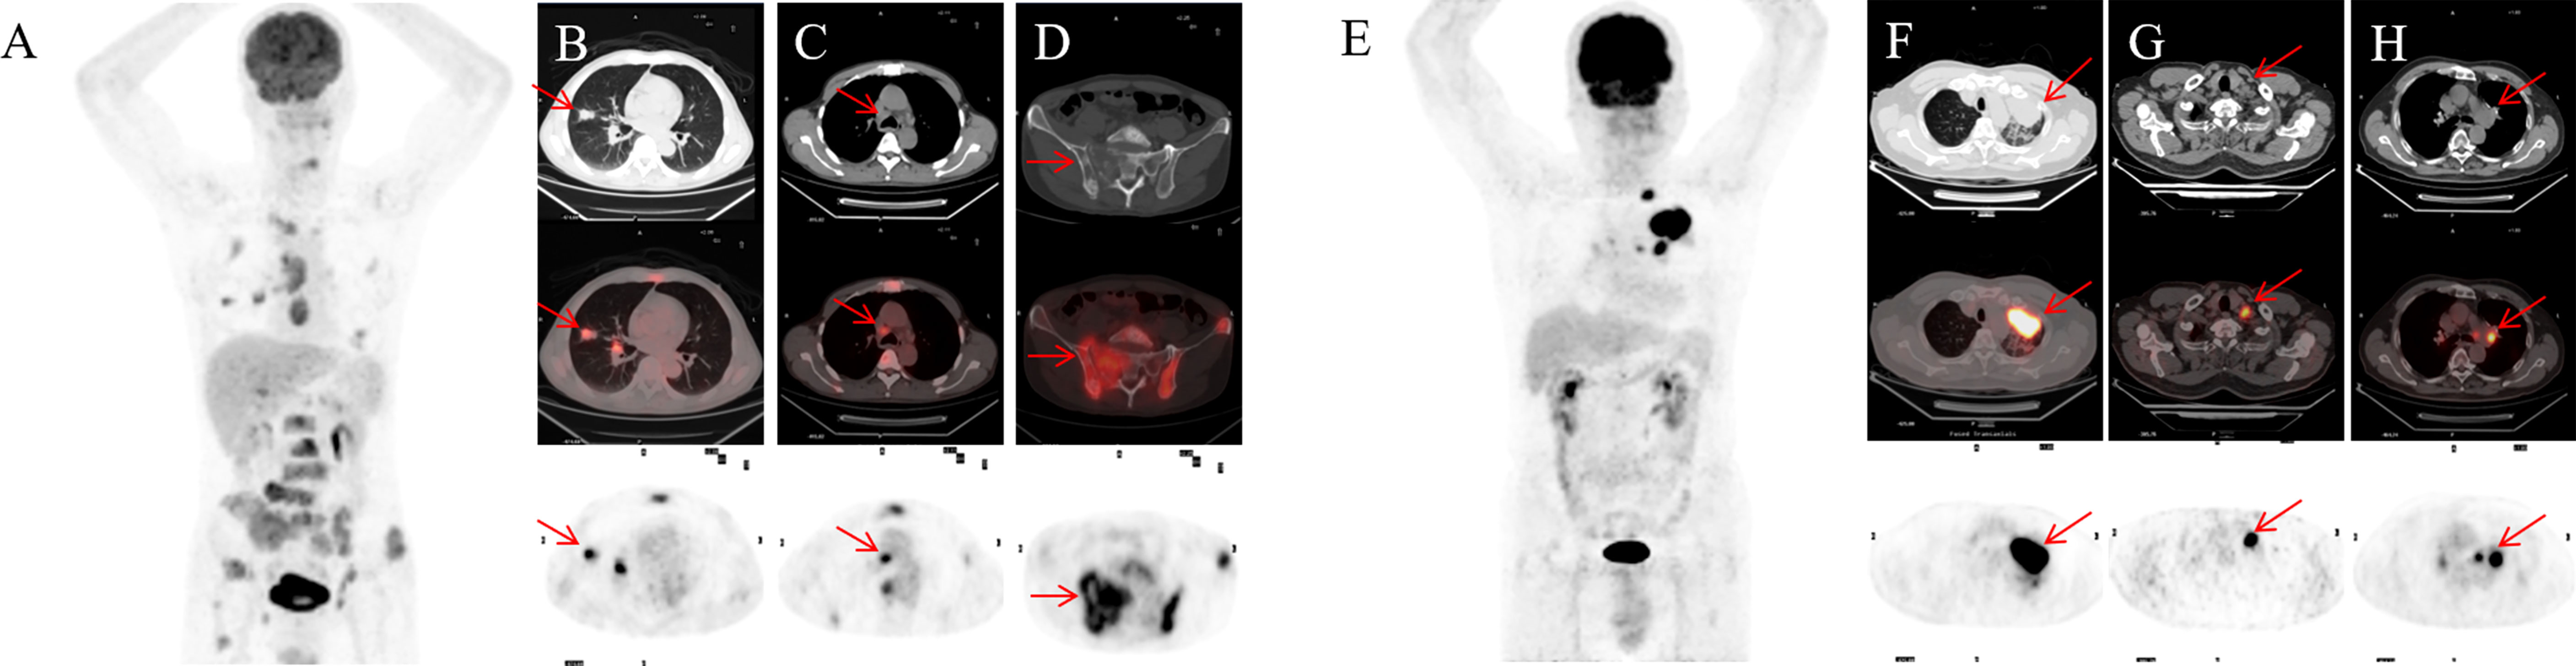
Figure 4 A 55-year-old male NSCLC patient with a history of smoking (A). Before treatment, 18F-FDG PET-CT revealed lesions in the right upper lobe and lymph node and pelvic bone metastases (B-D). After 4 months of targeted therapy, the patient died. A 67-year-old male NSCLC patient with a smoking history (E). Before treatment, 18F-FDG PET-CT found lesions in the upper lobe of the left lung, mediastinal and hilar lymph node metastasis (F-H). At 11 months after targeted therapy, the patient’s disease progresses.
To provide a quantitative method to predict patients’ probability of 1-, 2-, and 3-year PFS and OS, a radiomics nomogram combining clinical factors was established (Figure 5).
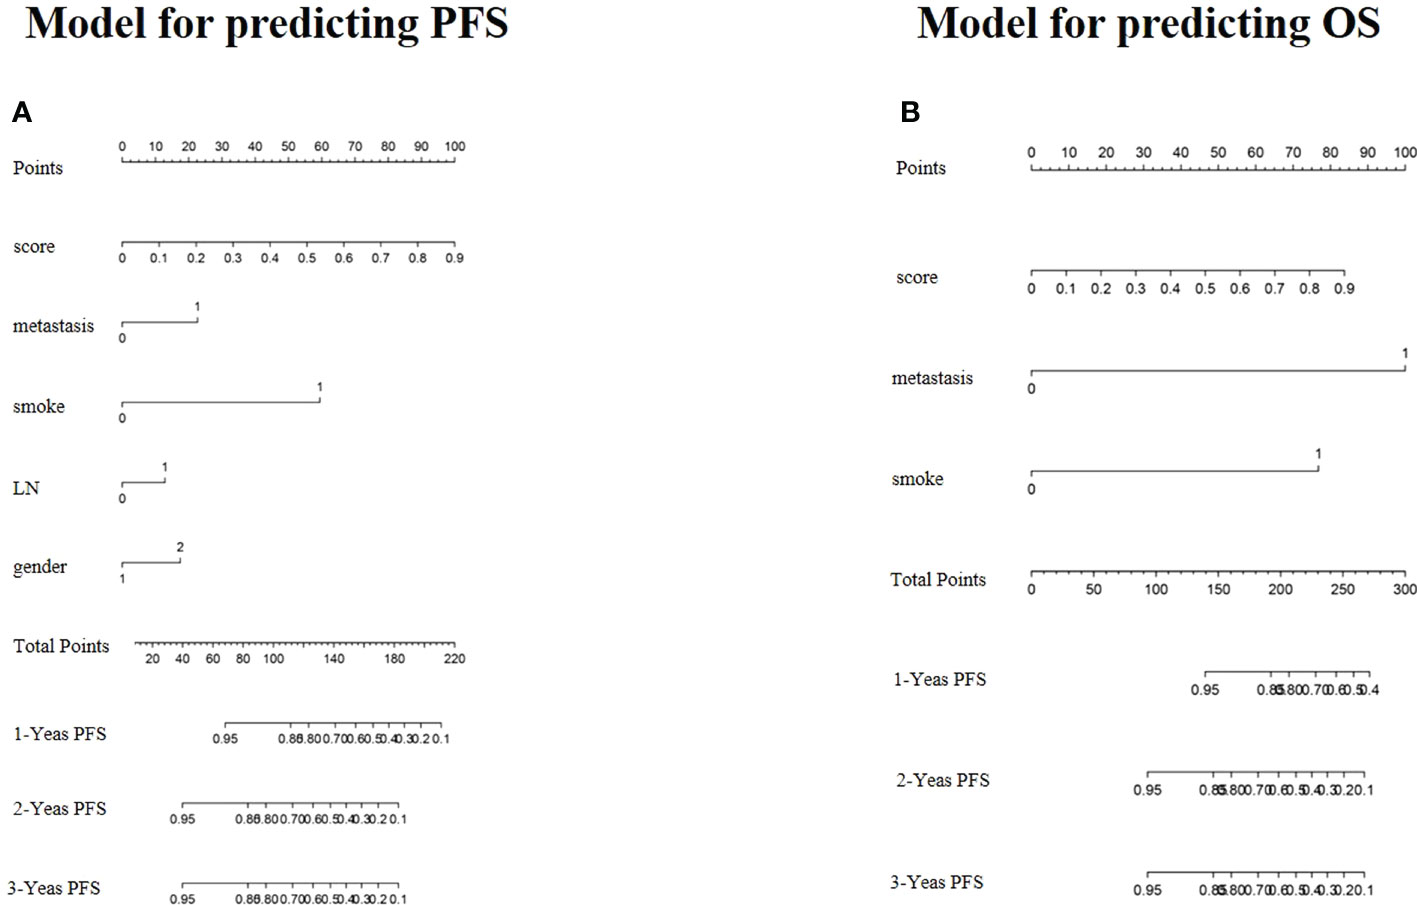
Figure 5 Radiomics nomogram for predicting PFS (A) and OS (B) of NSCLC.
For the training cohort, the C-index and AUC of the C-R model were 0.775 (95% CI: 0.722-0.828) and 0.780 (95% CI: 0.724-0.829) for PFS prediction, respectively. These values were superior to those of the clinical model (C-index: 0.748, 95% CI: 0.686-0.810, and AUC: 0.758, 95% CI: 0.701-0.809). For OS prediction, the C-index and AUC of the C-R model were 0.881 (95% CI: 0.829-0.933) and 0.891 (95% CI: 0.846-0.926), respectively, and these values were superior to those of the clinical model (C-index: 0.834, 95% CI: 0.768-0.899, and AUC: 0.846, 95% CI: 0.796-0.888) (Table 4).
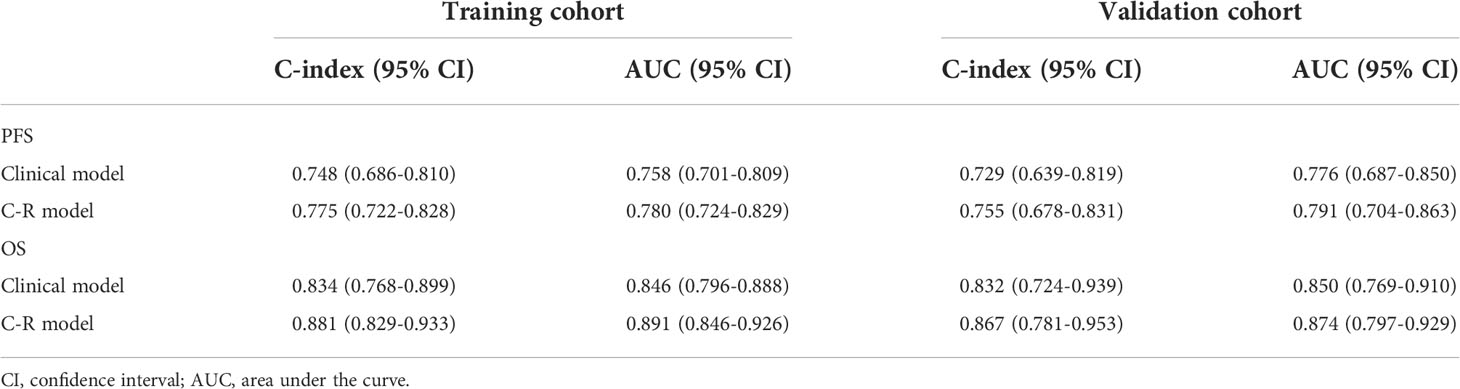
Table 4 The Harrell’s C-index and AUC results in the training and validation cohorts.
For the validation cohort, the C-index of the two models was 0.729 (95% CI: 0.639-0.819) and 0.755 (95% CI: 0.678-0.831) for predicting PFS, and 0.832 (95% CI: 0.724-0.939) and 0.867 (95% CI: 0.781-0.953) for predicting OS. Using ROC curve analysis, we found that the C-R model had a higher AUC compared with the clinical model for predicting PFS (AUC = 0.791 VS. 0.776) and OS (AUC = 0.874 VS. 0.850) (Table 4).
Figure 6 presents the DCA for the radiomics model and clinical model. DCA indicated that the net benefit of the radiomics nomogram was faintly higher compared with the clinical nomogram for both PFS and OS.
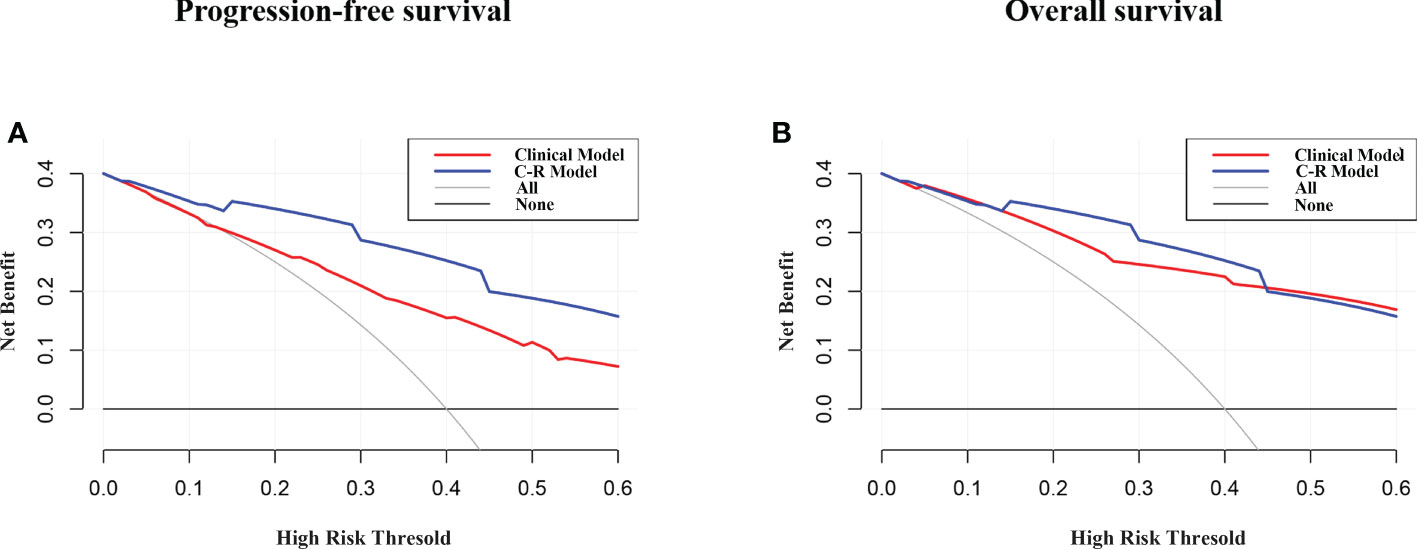
Figure 6 DCA of PFS (A) and OS (B) for the model. The y-axis measures the net benefit. The net benefit was calculated by summing the benefits (true positive results) and subtracting the harms (false-positive results), weighting the latter by a factor related to the relative harm of undetected cancer compared with the harm of unnecessary treatment. The C-R model had the highest net benefit compared with the clinical model.
Currently, lung cancer remains the leading cause of cancer-related deaths worldwide (1). The survival of NSCLC patients varies greatly among individuals, and the survival prognosis is affected by many factors. Our study found that Rad-scores on 18F-FDG PET/CT in cox regression analysis were independent predictors of PFS and OS. For better application in clinical practice, we constructed a clinical model for predicting disease progression and a complex model combining clinical factors and Rad-scores. The complex model showed superior predictive performance in both training and validation cohorts compared with the clinical model. In the training group, the C⁃index of the clinical model for predicting PFS and OS was 0.748 and 0.834, respectively, and the C⁃index of the complex model for predicting PFS and OS was increased to 0.775 and 0.881 after the addition of imaging histological features, respectively, suggesting that the complex model was the best model for predicting survival prognosis of NSCLC.
Traditional prognostic assessment methods, such as TNM staging, are important in guiding the formulation of rational treatment plans and prognosis assessments for lung cancer patients (20–22). However, even at the same TNM stage, the individual differences between patients make the prognosis significantly different, and the differences are magnified as the stage increases. Therefore, it is difficult to accurately assess the survival of NSCLC patients based on the TNM staging system alone. 18F-FDG PET/CT is a whole-body imaging examination that is widely used for the staging of malignant tumors. Previous studies have found that tumor FDG uptake can be used as a prognostic marker in patients with advanced and inoperable early-stage NSCLC (23, 24). Meta-analysis of IASLC shows that patients with higher preoperative primary tumor SUVmax have lower survival rates and shorter survival times (25). Konings R et al. have shown that the primary tumor SUVmax has a predictive value for the prognosis of NSCLC (26, 27). As the SUV-based approach is influenced by many physiological and technical factors, such as patient preparation, coordination of image acquisition, reconstruction, and analysis (28, 29), other features derived from PET/CT images are currently being explored.
Radiomics is the comprehensive quantification of tumor phenotypes through the application of numerous quantitative imaging features, which may reflect changes in human tissues at the cellular and genetic levels and offer more thorough details on tumor biology and the microenvironment in addition to visual features (30, 31). Radiomics has been used for the diagnosis, response assessment, and survival prognosis of various cancers (32–34). Currently, there are few studies on PET/CT imaging histology to predict the prognosis of NSCLC. It has been reported that imaging features are an independent prognostic factor for NSCLC and are associated with multiple clinical endpoints (35, 36). Therefore, we attempted to establish a complex model to assess the potential prognostic value of NSCLC patients by combining PET/CT-based radiomics features with clinical features.
Our study investigated the potential prognostic value of imaging histological features derived from pretreatment 18F-FDG PET/CT images in NSCLC patients. In this study, a complex model combining radiomics and clinical factors was found to be more effective in predicting PFS and OS, improving the efficacy of traditional clinical parameters in assessing the prognosis of NSCLC and aiding the prognosis of NSCLC patients. These findings were consistent with previous studies showing that RSs extracted from PET/CT images have potential implications for assessing disease status and risk stratification in NSCLC (37, 38).
The present study has a number of limitations. Firstly, although the patients included in this study were the largest patient group compared with previous studies, the sample size was relatively small, and it was a retrospective study. Secondly, the model was developed and validated based on a single institution dataset. The relationship between clinicopathological parameters and prognosis might have been influenced by the sample size. Future prospective multi-center studies with large data are required to obtain more accurate and reproducible imaging histological features. Finally, the effectiveness of adjuvant therapy for patients with high Rad-scores according to 18F-FDG PET/CT nomograms should also be evaluated in the future.
In conclusion, a complex model combining clinicopathological factors and radiomic features extracted from 18F-FDG PET/CT images had the potential to predict PFS and OS, and the nomogram analyses could provide more accurate individualized predictions of PFS and OS for patients, which in turn had the potential to help clinicians make more informed decisions in clinical practice.
The raw data supporting the conclusions of this article will be made available by the authors, without undue reservation.
This retrospective study was approved by the institutional review board of the First Affiliated Hospital of Soochow University, and the informed consent was waived due to the retrospective nature of the study (ChiCTR2200062555). The ethics committee waived the requirement of written informed consent for participation.
JL: data curation and writing- original draft preparation. BZ: conceptualization, methodology, and software. SG: visualization and investigation. SD: supervision. CH: software and validation. SS: writing- reviewing and editing. All authors contributed to the article and approved the submitted version.
This research was funded by the National Natural Science Foundation of China (No. 81601522), Medical Youth Talent Project of Jiangsu Province (No. QNRC2016749), Gusu Health Talent Program (No. GSWS2020013), Suzhou People’s Livelihood Science and Technology Project (No. SYS2019038), Project of State Key Laboratory of Radiation Medicine and Protection, Soochow University (No. GZK1202127), and the Open Foundation of Nuclear Medicine Laboratory of Mianyang Central Hospital, (No. 2021HYX023 and 2021HYX029).
The authors declare that the research was conducted in the absence of any commercial or financial relationships that could be construed as a potential conflict of interest.
All claims expressed in this article are solely those of the authors and do not necessarily represent those of their affiliated organizations, or those of the publisher, the editors and the reviewers. Any product that may be evaluated in this article, or claim that may be made by its manufacturer, is not guaranteed or endorsed by the publisher.
1. Oser MG, Niederst MJ, Sequist LV, Engelman JA. Transformation from non-small-cell lung cancer to small-cell lung cancer: molecular drivers and cells of origin. Lancet Oncol (2015) 16(4):e165–72. doi: 10.1016/S1470-2045(14)71180-5
2. Bray F, Ferlay J, Soerjomataram I, Siegel RL, Torre LA, Jemal A. Global cancer statistics 2018: GLOBOCAN estimates of incidence and mortality worldwide for 36 cancers in 185 countries. CA Cancer J Clin (2018) 68 (6):394–424. doi: 10.3322/caac.21492
3. Postmus PE, Kerr KM, Oudkerk M, Senan S, Waller DA, Vansteenkiste J, et al. Early and locally advanced non-small-cell lung cancer (NSCLC): ESMO clinical practice guidelines for diagnosis, treatment and follow-up. Ann Oncol (2017) 28(suppl_4):iv1–iv21. doi: 10.1093/annonc/mdx222
4. Fang W, Jin H, Zhou H, Hong S, Ma Y, Zhang Y, et al. Intratumoral heterogeneity as a predictive biomarker in anti-PD-(L)1 therapies for non-small cell lung cancer. Mol Cancer (2021) 20(1):37. doi: 10.1186/s12943-021-01331-9
5. Xue Y, Hou S, Ji H, Han X. Evolution from genetics to phenotype: reinterpretation of NSCLC plasticity, heterogeneity, and drug resistance. Protein Cell (2017) 8(3):178–90. doi: 10.1007/s13238-016-0330-1
6. Li J, Wu J, Zhao Z, Zhang Q, Shao J, Wang C, et al. Artificial intelligence-assisted decision making for prognosis and drug efficacy prediction in lung cancer patients: a narrative review. J Thorac Dis (2021) 13(12):7021–33. doi: 10.21037/jtd-21-864
7. Tran KA, Kondrashova O, Bradley A, Williams ED, Pearson JV, Waddell N. Deep learning in cancer diagnosis, prognosis and treatment selection. Genome Med (2021) 13(1):152. doi: 10.1186/s13073-021-00968-x
8. Squarcina L, Villa FM, Nobile M, Grisan E, Brambilla P. Deep learning for the prediction of treatment response in depression. J Affect Disord (2021) 281:618–22. doi: 10.1016/j.jad.2020.11.104
9. Lambin P, Rios-Velazquez E, Leijenaar R, Carvalho S, van Stiphout RG, Granton P, et al. Radiomics: extracting more information from medical images using advanced feature analysis. Eur J Cancer (2012) 48(4):441–6. doi: 10.1016/j.ejca.2011.11.036
10. Huang Y, Liu Z, He L, Chen X, Pan D, Ma Z, et al. Radiomics signature: A potential biomarker for the prediction of disease-free survival in early-stage (I or II) non-small cell lung cancer. Radiology (2016) 281(3):947–57. doi: 10.1148/radiol.2016152234
11. Coroller TP, Agrawal V, Huynh E, Narayan V, Lee SW, Mak RH, et al. Radiomic-based pathological response prediction from primary tumors and lymph nodes in NSCLC. J Thorac Oncol (2017) 12(3):467–76. doi: 10.1016/j.jtho.2016.11.2226
12. Coroller TP, Grossmann P, Hou Y, Rios Velazquez E, Leijenaar RT, Hermann G, et al. CT-based radiomic signature predicts distant metastasis in lung adenocarcinoma. Radiother Oncol (2015) 114(3):345–50. doi: 10.1016/j.radonc.2015.02.015
13. Kemppainen J, Hynninen J, Virtanen J, Seppänen M. PET/CT for evaluation of ovarian cancer. Semin Nucl Med (2019) 49(6):484–92. doi: 10.1053/j.semnuclmed.2019.06.010
14. Groheux D, Cochet A, Humbert O, Alberini JL, Hindié E, Mankoff D. 18F-FDG PET/CT for staging and restaging of breast cancer. J Nucl Med (2016) 57 Suppl 1:17S–26S. doi: 10.2967/jnumed.115.157859
15. Lee S, Choi Y, Park G, Jo S, Lee SS, Park J, et al. 18F-FDG PET/CT parameters for predicting prognosis in esophageal cancer patients treated with concurrent chemoradiotherapy. Technol Cancer Res Treat (2021) 20:15330338211024655. doi: 10.1177/15330338211024655
16. Gillies RJ, Kinahan PE, Hricak H. Radiomics: Images are more than pictures, they are data. Radiology (2016) 278(2):563–77. doi: 10.1148/radiol.2015151169
17. Nioche C, Orlhac F, Boughdad S, Reuzé S, Goya-Outi J, Robert C, et al. LIFEx: A freeware for radiomic feature calculation in multimodality imaging to accelerate advances in the characterization of tumor heterogeneity. Cancer Res (2018) 78(16):4786–9. doi: 10.1158/0008-5472.CAN-18-0125
18. Zwanenburg A. Radiomics in nuclear medicine: robustness, reproducibility, standardization, and how to avoid data analysis traps and replication crisis. Eur J Nucl Med Mol Imaging (2019) 46:2638–55. doi: 10.1007/s00259-019-04391-8
19. Jha AK, Mithun S, Jaiswar V, Sherkhane UB, Purandare NC, Prabhash K, et al. Repeatability and reproducibility study of radiomic features on a phantom and human cohort. Sci Rep (2021) 11(1):2055. doi: 10.1038/s41598-021-81526-8
20. Kandathil A, Kay FU, Butt YM, Wachsmann JW, Subramaniam RM. Role of FDG PET/CT in the eighth edition of TNM staging of non-small cell lung cancer. Radiographics (2018) 38(7):2134–49. doi: 10.1148/rg.2018180060
21. Chen J, Xia J, Huang J, Xu R. Effect of aspirin on PET parameters in primary non-small cell lung cancer and its relationship with prognosis. BMC Cancer (2020) 20(1):510. doi: 10.1186/s12885-020-06983-2
22. Huellner MW, de Galiza Barbosa F, Husmann L, Pietsch CM, Mader CE, Burger IA, et al. TNM staging of non-small cell lung cancer: Comparison of PET/MR and PET/CT. J Nucl Med (2016) 57(1):21–6. doi: 10.2967/jnumed.115.162040
23. Berghmans T, Paesmans M, Sculier JP. Prognostic factors in stage III non-small cell lung cancer: a review of conventional, metabolic and new biological variables. Ther Adv Med Oncol (2011) 3(3):127–38. doi: 10.1177/1758834011401951
24. Abelson JA, Murphy JD, Trakul N, Bazan JG, Maxim PG, Graves EE, et al. Metabolic imaging metrics correlate with survival in early stage lung cancer treated with stereotactic ablative radiotherapy. Lung Cancer (2012) 78(3):219–24. doi: 10.1016/j.lungcan.2012.08.016
25. Paesmans M, Berghmans T, Dusart M, Garcia C, Hossein-Foucher C, Lafitte JJ, et al. Primary tumor standardized uptake value measured on fluorodeoxyglucose positron emission tomography is of prognostic value for survival in non-small cell lung cancer: update of a systematic review and meta-analysis by the European lung cancer working party for the international association for the study of lung cancer staging project. J Thorac Oncol (2010) 5(5):612–9. doi: 10.1097/JTO.0b013e3181d0a4f5
26. Zhu X, Liao C, Penney BC, Li F, Ferguson MK, Simon CA, et al. Prognostic value of quantitative PET/CT in patients with a non-small cell lung cancer and another primary cancer. Nucl Med Commun (2017) 38(2):185–92. doi: 10.1097/MNM.0000000000000627
27. Konings R, van Gool MH, Bard MP, Zwijnenburg A, Titulaer BM, Aukema TS, et al. Prognostic value of preoperative glucose-corrected maximum standardized uptake value in patients with non-small cell lung cancer after complete surgical resection and 5-year follow-up. Ann Nucl Med (2016) 30(5):362–8. doi: 10.1007/s12149-016-1070-2
28. Schöder H, Moskowitz C. Metabolic tumor volume in lymphoma: Hype or hope? J Clin Oncol (2016) 34(30):3591–4. doi: 10.1200/JCO.2016.69.3747
29. Zaucha JM, Chauvie S, Zaucha R, Biggii A, Gallamini A. The role of PET/CT in the modern treatment of Hodgkin lymphoma. Cancer Treat Rev (2019) 77:44–56. doi: 10.1016/j.ctrv.2019.06.002
30. Aerts HJ, Velazquez ER, Leijenaar RT, Parmar C, Grossmann P, Carvalho S, et al. Decoding tumour phenotype by non-invasive imaging using a quantitative radiomics approach. Nat Commun (2014) 5:4644. doi: 10.1038/ncomms5006
31. Jiang Y, Yuan Q, Lv W, Xi S, Huang W, Sun Z, et al. Radiomic signature of 18F fluorodeoxyglucose PET/CT for prediction of gastric cancer survival and chemotherapeutic benefits. Theranostics (2018) 8(21):5915–28. doi: 10.7150/thno.28018
32. Peng H, Dong D, Fang MJ, Li L, Tang LL, Chen L, et al. Prognostic value of deep learning PET/CT-based radiomics: Potential role for future individual induction chemotherapy in advanced nasopharyngeal carcinoma. Clin Cancer Res (2019) 25(14):4271–9. doi: 10.1158/1078-0432.CCR-18-3065
33. Chetan MR, Gleeson FV. Radiomics in predicting treatment response in non-small-cell lung cancer: current status, challenges and future perspectives. Eur Radiol (2021) 31(2):1049–58. doi: 10.1007/s00330-020-07141-9
34. Li Y, Zhang Y, Fang Q, Zhang X, Hou P, Wu H, et al. Radiomics analysis of [18F] FDG PET/CT for microvascular invasion and prognosis prediction in very-early- and early-stage hepatocellular carcinoma. Eur J Nucl Med Mol Imaging (2021) 48(8):2599–614. doi: 10.1007/s00259-020-05119-9
35. Khorrami M, Prasanna P, Gupta A, Patil P, Velu PD, Thawani R, et al. Changes in CT radiomic features associated with lymphocyte distribution predict overall survival and response to immunotherapy in non-small cell lung cancer. Cancer Immunol Res (2020) 8(1):108–19. doi: 10.1158/2326-6066.CIR-19-0476
36. Fave X, Zhang L, Yang J, Mackin D, Balter P, Gomez D, et al. Delta-radiomics features for the prediction of patient outcomes in non-small cell lung cancer. Sci Rep (2017) 7(1):588. doi: 10.1038/s41598-017-00665-z
37. Mu W, Jiang L, Zhang J, Shi Y, Gray JE, Tunali I, et al. Non-invasive decision support for NSCLC treatment using PET/CT radiomics. Nat Commun (2020) 11(1):5228. doi: 10.1038/s41467-020-19116-x
Keywords: NSCLC, carcinoma, radiomics, PET/CT, prognosis
Citation: Li J, Zhang B, Ge S, Deng S, Hu C and Sang S (2022) Prognostic value of 18F-FDG PET/CT radiomic model based on primary tumor in patients with non-small cell lung cancer: A large single-center cohort study. Front. Oncol. 12:1047905. doi: 10.3389/fonc.2022.1047905
Received: 19 September 2022; Accepted: 02 November 2022;
Published: 17 November 2022.
Edited by:
Wei Zhao, Beihang University, ChinaCopyright © 2022 Li, Zhang, Ge, Deng, Hu and Sang. This is an open-access article distributed under the terms of the Creative Commons Attribution License (CC BY). The use, distribution or reproduction in other forums is permitted, provided the original author(s) and the copyright owner(s) are credited and that the original publication in this journal is cited, in accordance with accepted academic practice. No use, distribution or reproduction is permitted which does not comply with these terms.
*Correspondence: Chunhong Hu, c2RodWNodW5ob25nQHNpbmEuY29t; Shibiao Sang, Z29sZjEzMTcwMUBzaW5hLmNvbQ==; Shengming Deng, ZHNobWluZ0AxNjMuY29t
†These authors have contributed equally to this work
Disclaimer: All claims expressed in this article are solely those of the authors and do not necessarily represent those of their affiliated organizations, or those of the publisher, the editors and the reviewers. Any product that may be evaluated in this article or claim that may be made by its manufacturer is not guaranteed or endorsed by the publisher.
Research integrity at Frontiers
Learn more about the work of our research integrity team to safeguard the quality of each article we publish.