
94% of researchers rate our articles as excellent or good
Learn more about the work of our research integrity team to safeguard the quality of each article we publish.
Find out more
REVIEW article
Front. Oncol. , 22 December 2022
Sec. Skin Cancer
Volume 12 - 2022 | https://doi.org/10.3389/fonc.2022.1046102
This article is part of the Research Topic Tumor Metabolic Microenvironment: One Man’s Meat is Another Man’s Poison View all 8 articles
 Xinyue Zhang1,2,3†
 Zongguang Tai1†
 Fengze Miao1
 Hao Huang1,2
 Quangang Zhu1
 Leilei Bao2,3*
 Zhongjian Chen1*
Malignant melanoma is widely acknowledged as the most lethal skin malignancy. The metabolic reprogramming in melanoma leads to alterations in glycolysis and oxidative phosphorylation (OXPHOS), forming a hypoxic, glucose-deficient and acidic tumor microenvironment which inhibits the function of immune cells, resulting in a low response rate to immunotherapy. Therefore, improving the tumor microenvironment by regulating the metabolism can be used to improve the efficacy of immunotherapy. However, the tumor microenvironment (TME) and the metabolism of malignant melanoma are highly heterogeneous. Therefore, understanding and predicting how melanoma regulates metabolism is important to improve the local immune microenvironment of the tumor, and metabolism regulators are expected to increase treatment efficacy in combination with immunotherapy. This article reviews the energy metabolism in melanoma and its regulation and prediction, the integration of immunotherapy and metabolism regulators, and provides a comprehensive overview of future research focal points in this field and their potential application in clinical treatment.
In 2020, 325,000 new cases of melanoma were reported worldwide with 57, 000 deaths (1). Melanoma, a skin-derived malignancy, is the highest mortality-associated skin disease and one of the tumors with the fastest growing incidence (2).
Melanoma exhibits distinct biosynthesis and energy metabolism that can accelerate its proliferation, promote metastasis, and eventually leads to drug resistance and ineffectiveness of treatment (2). Over the past decade, tumor cells have been established to promote their growth by reprogramming their energy metabolism (3). The Warburg effect provided the initial clue that tumor cells depended more on glycolytic reactions for energy production and reduced mitochondrial oxidative phosphorylation than normal cells (4). Glycolysis and oxidative phosphorylation have become a research hotspot in tumor metabolism since then. Glycolysis is a metabolic process whereby cells rapidly produce adenosine triphosphate (ATP) (Figure 1), with one molecule of glucose producing 2 ATP while three carbon atoms turn into lactate. Mitochondrial oxidation is a slow ATP-producing reaction, with one molecule of glucose producing 28 ATP (10 ATP from the tricarboxylic acid cycle and 18 ATP from oxidative phosphorylation). Therefore, glycolysis consumes more glucose to produce equal ATP. Nonetheless, unused carbon can be used for growth and proliferation through the cellular carbon metabolic pathway to satisfy the strong proliferation demand. Therefore, glycolysis (anaerobic glycolysis) is more suitable for rapidly proliferating cells than mitochondrial oxidation (9).
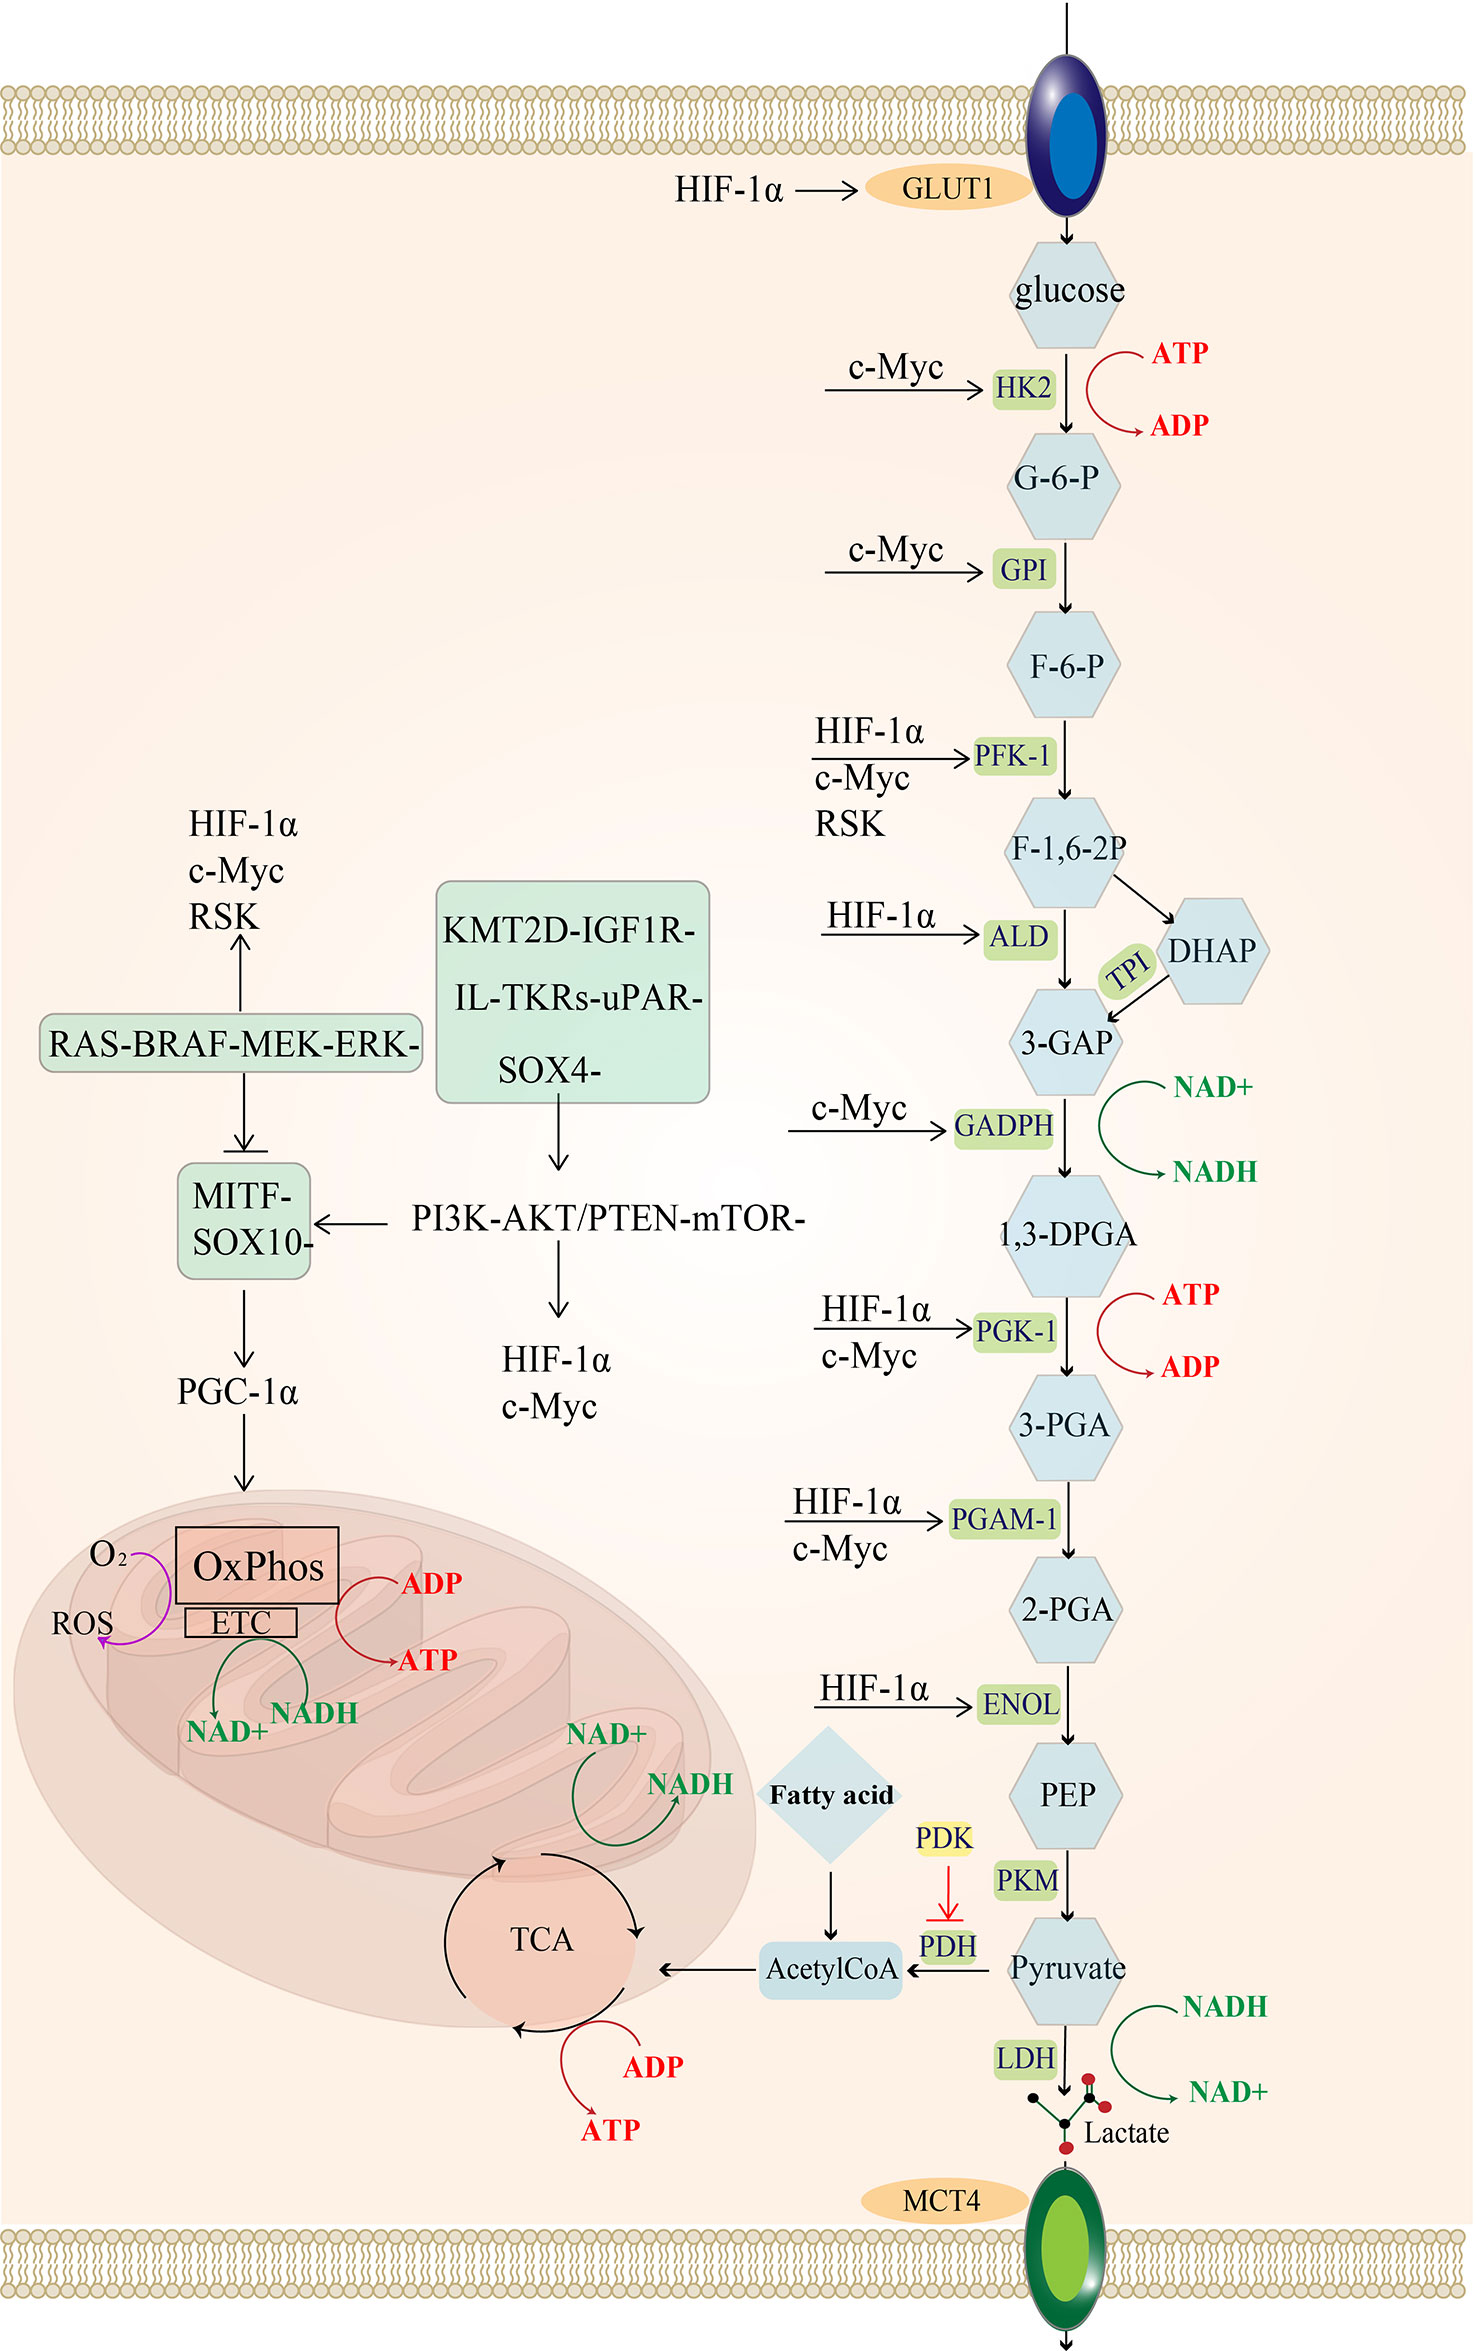
Figure 1 Regulatory pathways of energy metabolism in melanoma: MAPK/RAS pathway and PI3K pathway activate downstream MYC and HIF-1a. In melanoma, the urokinase-type fibrinogen activator receptor (uPAR) is a major factor in the fibrinolytic system and induces a decrease in the MAPK/p38 activity ratio, leading to tumor proliferation and consequently to tumorigenesis and even metastasis (5). uPAR coupled to the integral protein-linked tyrosine kinase receptor IL-TKRs induces the PI3K/pAKT/mTOR/HIF-1α pathway (6), promoting the Warburg effect of melanoma and increasing glycolysis (7). KMT2D is a histone H3 lysine 4 (H3K4) methyltransferase, and H3K4 methylation reprogramming has an important role in BRAFV600E melanogenesis. KMT2D-deficient tumors have been reported to show substantial reprogramming of metabolism, such as the IGF1R-PI3K-AKT pathway, which activates the downstream HIF- 1a and Myc, leading to the upregulation of glycolysis (8). uPAR and the KMT2D pathway can activate the PI3K pathway. The MITF pathway is blocked by MAPK and can also be activated by mTOR and the SOX-10 transcription factor, suppressing HIF-1a expression. Importantly, the SOX-2 transcription factor can directly suppress HIF-1a. glucose transporter 1 (GLUT-1); hexokinase 2 (HK-2); glucose 6-phosphate (G-6-P); glucose hexose isomerase (GPI); fructose 6-phosphate (F-6-P); phosphofructokinase 1 (PFK-1); 1,6 fructose diphosphate (F-1,6-BP); aldolase (ALDOA); 3-phosphoglyceraldehyde (3-GAP); Dihydroxyacetone phosphate (DHAP); Triose-phosphateisomerase (TPI); 3-phosphoglycerol dehydrogenase (GADPH); Coenzyme I (NAD+);1,3-diphosphoglycerate phosphoglycerate kinase (PGK); 3-Phosphoglyceric acid (3-PGA); adenosine diphosphate (ADP); phosphoglycerol isomerase 1 (PGAM-1); 2-phosphoglyceric acid (2-PGA); enolase (ENOL); Phosphoenolpyruvate (PEP); pyruvate kinase (PKM); lactate dehydrogenase (LDH); monocarboxylate transporter protein 4 (MCT-4); tricarboxylic acid cycle (TCA); pyruvate dehydrogenase (PDH).
However, contrasting studies suggest that glycolysis and oxidative phosphorylation can be simultaneously upregulated in melanoma based on the metabolic demands of the tumor. These studies draw our attention to the metabolic heterogeneity in melanoma. Due to the heterogeneity of tumor vascular and intratumoral structures, the nutrient and oxygen contents in different parts of the tumor may fluctuate, and the tumor cells can flexibly change their metabolism according to their own energy requirements and the nutrient supply of the tumor microenvironment, which is called metabolic heterogeneity (10, 11).. Therefore, the flux of glycolysis and mitochondrial oxidative phosphorylation exhibit differential regulation in melanoma and can reflect the state of the tumor cells to some extent. Overall, understanding the growth status of melanoma via its energy metabolism for application in targeted therapy may be a potential solution for melanoma patients (12–14).
However, the high energy metabolic demand of melanoma leads to local glucose deficiency and lactate accumulation in the tumor microenvironment. This type of TME inhibits T cell activation and recruits immunosuppressive cells, such as tumor-associated macrophage (TAM), regulatory (Treg) cells and myeloid-derived suppressor cells (MDSCs) (15), which models the immunosuppressive tumor microenvironment, and is one of the reasons why immune checkpoint inhibitors are ineffective in the treatment of melanoma (16, 17).
The interaction between the immune regulation and energy metabolism of melanoma has triggered interest in a synergistic approach involving immunotherapy and metabolic therapy. Regulating the tumor immune microenvironment based on the metabolic characteristics of melanoma may be a potential method to improve immunotherapy’s efficacy and achieve synergistic treatment goals (18). This article will review the metabolic characteristics of melanoma and its regulation, present an overview of the mechanism of local immunosuppression and introduce the biomarkers reflecting the tumor metabolism to provide new insights for targeted treatment through the combination of energy metabolism regulators and immunotherapy.
Altered amino acid metabolism such as glutamic acid and alanine would accelerate melanoma proliferation; up-regulated fatty acid oxidation boosts melanoma to gain resistance to therapy. Nonetheless, the alteration of glycolysis and oxidative phosphorylation cover both. In melanoma, glucose metabolic alterations are high plasticity, and highly associated with metastasis. Hence, an insight into the mechanisms of glucose metabolic dysregulation of melanoma is necessary (19, 20).
Major drivers of melanomagenesis include the activation of NRAS/BRAF or the loss of Phosphatase tensin homologue (PTEN) or cyclin dependent kinase inhibitor 2A (CDKN2A) (21). Among them, BRAF variations occur in 66% of melanomas (22), which can lead to metabolic reprogramming (23).The most frequent BRAF mutation is BRAFV600E, where the 600th valine position of the BRAF mutation is replaced by glutamate (BRAFV600E), leading to constitutive activation of its serine/threonine kinase activity (24). It has been established that BRAFV600E mainly affects glycolytic flux. PTEN, a tumor suppressor gene, synergistic altered of a metabolic pathway with BRAF mutations (25). The protein encoded by PTEN affects the PI3K/AKT/mTOR signaling pathway activation and downstream metabolism-related pathway (26, 27). CDKN2A regulates mitochondrial function to induce melanoma (28).
Additionally, Microphthalmia-associated transcription factor (MITF) is also expressed in 10%–20% of human melanomas, which induce pigmentation thereby product melanin (29). MITF is upregulated by the PI3K pathway and downregulated by the MAPK pathway (30, 31). Current evidence suggests that MITF is closely related to mitochondrial energy metabolism in melanoma (32–34).
The MAPK (RAF-MEK-ERK) signaling pathway is frequently activated in melanoma (35), and it can phosphorylate the downstream p90 ribosomal S6 kinase (RSK) (36), which activates fructose-2,6-bisphosphatase 2 (PFKFB2), an isoform of phosphofructokinase, increasing fructose-2,6-bisphosphate synthesis (a glycolytic intermediate) (37). Additionally, RSK phosphorylates fructose-2,6-bisphosphatase 1-4 (PFKFB1-4), an isoform of phosphofructokinase, to upregulate phosphofructokinase 1 (PFK-1), a significant rate-limiting enzyme of glycolysis, which ultimately increases glycolytic flux (38, 39).The hypoxia-inducible factor (HIF1α) is a regulator of glycolysis, and its production is promoted by the activation of PI3K-PTEN/AKT and MAPK signaling pathways (40–42). The MAPK signaling pathway can inhibit the MITF-PGC1α axis, and the PI3K-PTEN/AKT signaling pathway indirectly stimulates the mammalian target of rapamycin (mTOR) protein. Both can increase downstream HIF-1α activity (43). Moreover, increased HIF-1α activity promotes the expression of enzymes involved in glycolysis, such as PFK, aldolase (ALD), 1,3-diphosphoglycerate phosphoglycerate kinase 1 (PGK1), enolase (ENOL) (44), as well as glucose transporter 1 (GLUT-1,GLUT-1 is one of the GLUT family of membrane transport proteins dedicated to intracellular glucose uptake) (45), ultimately increasing glucose uptake and glycolysis flux.
Additionally, HIF-1α can limit OXPHOS in mitochondria by regulating the expression of PDK, an enzyme that phosphorylates and inactivates pyruvate dehydrogenase (PDH). It has been established that PDH converts pyruvate to acetyl coenzyme A (14) and promotes mitochondrial oxidation. In other words, the presence of HIF-1α in advanced melanoma suggests that melanoma is less dependent on oxidative phosphorylation and more on glycolysis for ATP production during hypoxia (46, 47).
Another crucial element influencing melanoma glycolysis is c-Myc (40), which is a member of the MYC proto-oncogene family (c-Myc, L-Myc, and N-Myc are collectively known as MYC) that encodes the helix-loop-helix leucine zipper (bHLHZip) transcription factor (48, 49). It has been shown that the c-Myc protein is regulated by the PI3K and MAPK pathways; c-myc induces the expression of almost all glycolytic enzyme genes, including HK, GPI, PFK-1, 3-phosphoglycerol dehydrogenase (GADPH), 1,3-diphosphoglycerate phosphoglycerate kinase (PGK) and ENOL (50).
High levels of c-Myc inhibit MondoA, a key downstream negative regulator of glucose uptake, and then indirectly increase glucose uptake and enhance glycolytic flux by inducing thioredoxin-interacting protein (TXNIP) and inhibiting GLUT1 expression (40).
Interestingly, c-Myc exerts different functionsdepending on the state of the tumor microenvironment (TME) (51). Unlike HIF1α, c-Myc mainly regulates oxygen-enriched tumor cells by upregulating aerobic glycolysis and mitochondrial activity since c-Myc directly promotes glycolysis and reduces pyruvate kinase 2(PKM2) activity (52), thereby limiting PKM2-mediated phosphoenolpyruvate-pyruvate conversion (i.e., the last irreversible step of glycolysis). These changes result in the accumulation of upstream glycolytic intermediates, while the increased carbon during glycolysis is used for mitochondrial biosynthesis processes, such as manufacturing fatty acids, amino acids and other substances required for proliferation (53–55).
Meanwhile, both c-Myc and HIF-1α promote the expression of lactate dehydrogenase A (LDHA), which encodes the production of the five isoforms of LDH when combined with lactate dehydrogenase B (LDHB). Lactate dehydrogenase (LDH) is a crucial enzyme in the utilization of lactate, and LDHA encodes lactate dehydrogenase 3-5(LDH3-5), which completes the Pasteur effect by catalyzing the conversion of pyruvate to lactate (56). During the conversion of pyruvate to lactate, LDH can reduce NADH to NAD+. The reduction product NAD+ is then used as an electron acceptor by the glycolytic enzyme GAPDH, which leads to the conversion of NAD+ to NADH, thus forming an intracellular NAD+ cycle (57, 58). Sustained high levels of glycolysis consume a large amount of NAD+, and the promotion of LDHA expression induced by c-Myc and HIF-1α directly increases the LDH content, which can supplement the NAD+ and ensure sustained glycolysis (Figure 1).
High serum lactate levels in patients with melanoma are associated with increased glycolytic flux (59). However, many glycolysis inhibitors (e.g., 2-deoxyglucose) do not yield satisfactory inhibitory effects on tumor growth since glycolysis is not the only energy metabolic pathway in melanoma, and energy metabolism can be flexibly regulated based on the tumor microenvironment.
In addition to glycolysis (60), OXPHOS flux has been reported to be higher in metastatic melanoma cells cultured in vitro compared to melanocytes. Besides, OXPHOS is reportedly elevated in clinical stage IV melanoma (61). OXPHOS, the last reaction in cellular respiration, produces the most ATP by transporting electrons via proton complexes embedded in the inner mitochondrial membrane. Oxygen is necessary for OXPHOS, acting as the terminal electron acceptor in the electron transport chain. OXPHOS produces 90% of the ATP cells need in the presence of oxygen. Therefore, an increase in oxidative phosphorylation is associated with increased mitochondrial energy production (62), mitochondrial biosynthesis, and cell proliferation (63–65).
Deletion of CDKN2A is a common feature in melanoma (66), which leads to down-regulation of downstream p14ARF expression. p14ARF inactivates melanocyte mitochondria by interacting with B-cell lymphoma-extra large (BCL-XL), translocating to dysfunctional mitochondria and inducing loss of membrane potential (67). Whereas down-regulation of p14ARF results in sustained activity of dysfunctional mitochondria with higher metabolic plasticity (23).Melanoma exhibits increased mitochondrial respiration, mainly related to MITF expression. As a specific transcription factor in melanoma cells, MITF is a key regulator and promoter of mitochondrial respiration (65, 68). MITF promotes mitochondrial respiratory gene transcription driven by downstream activation of peroxisome proliferators activated receptor gamma co-activator 1-alpha (PGC1α) (69, 70). PGC1α, a well-known peroxisome proliferator-activated receptor γ coactivator 1 (PGC-1) family member, is one of the first genes upregulated for increased mitochondrial biogenesis and OXPHOS (65, 66).
PGC-1α levels and mitochondrial quality heterogeneity is associated with transitions between proliferative and metastatic phenotypes of melanoma cells (71). It has been shown that PGC-1α increases the expression of antioxidant genes (72) and tolerance to the deleterious effects of mitochondrial oxidative respiration, enabling melanoma cells to survive under oxidative stress (65, 72, 73). In this respect, during electron transfer in the mitochondrial respiratory complex, a small fraction of oxygen undergoes incomplete reduction and becomes reactive oxygen species (ROS) (74). At low ROS concentrations, genomic instability is induced, and cell proliferation is stimulated, while at high ROS concentrations, ROS result in oxidative stress cytotoxicity (75). As mitochondria continuously produce ROS, tumor cells exhibit the ability to detoxify ROS by expressing PGC1α (72) to regulate mitochondrial ROS production (76) and to increase intracellular ROS-consuming proteins, such as SCARA3 (77).
What’s more, the inhibition of oxidative metabolism by BRAF in melanoma is an independent process. For instance, the reduction of cytochrome oxidase subunit expression via HIF-1α (78, 79) does not affect the PI3K-mTOR pathway promoting the transcription of MITF-PGC1α and OXPHOS-related genes (Figure 1).
Thus, the response of PGC1α to MITF is the main regulatory factor of mitochondrial respiration in melanoma. The expression of MITF leads to the upregulation of PGC-1α (80), which promotes mitochondrial oxidative respiration and reduces its detrimental effects, which underlie melanoma’s recurrence and metastasis (81).
Tumor heterogeneity is the terminology used to indicate that there are subclones of tumor cells with distinct molecular variations in one patient. Like many other tumors, melanoma is highly genetically heterogeneous (82), highlighting that different melanoma cells have diverse and unstable genetic backgrounds. It has been established that genetic heterogeneity underlies metabolic heterogeneity (83). Genetic pathways can regulate glycolysis as well as oxidative phosphorylation. In turn, metabolic heterogeneity can affect genetic heterogeneity, and the tumor microenvironment shaped by various metabolic patterns can induce the corresponding gene expression.
The Sex-determining region Y-related high mobility group-box (SOX) family is a typical example. The SOX gene family has been reported to play an important role in melanoma development and progression. SOX10 is essential for melanocytes and highly expressed in melanoma (84); it directly binds to the MITF promoter to upregulate MITF expression and activates PGC-1α to promote mitochondrial oxidative phosphorylation (85). Moreover, overexpression of SOX4 in melanoma leads to phosphorylation of AKT and activation of downstream HIF-1α and c-Myc to promote glycolysis in tumor cells (86). Meanwhile, SOX4 promotes OXPHOS by increasing the expression of MITF (87), which is not always antagonistic to glycolysis, allowing for a more flexible metabolism of tumor cells (65).
It has been shown that melanoma cells with high glycolytic flux accumulate lactate, resulting in an acidic environment that enhances SOX2 expression. When SOX2 protein expression exceeds HIF1α, SOX2 can directly bind to the HIF1α promoter to reduce HIF1α activity, thereby inhibiting glycolysis and promoting mitochondrial oxidative respiration via PGC-1α (88). When SOX2 is silenced, the metabolic phenotype of the cells switches back to a glycolytic-dominant mode. Thus, SOX2 expression prevents cell damage induced by excessive glycolytic acidification of the tumor microenvironment (45, 89).
Overall, the interaction between the SOX family and metabolic modalities reflects the metabolic flexibility of melanoma (45, 90, 91). Glycolysis and mitochondrial respiration, the two major energy production pathways in tumor cells, are activated to varying extents based on genetic backgrounds, reflecting the metabolic heterogeneity of melanoma (73, 92–94).
Excessive lactate concentrations in melanoma lead to growth arrest (95), and lactate efflux is an important mechanism for maintaining cellular glycolysis levels and preventing oxidative stress (96–98). Since lactate in tumor cells is transported by a family of monocarboxylate transporters (MCT), HIF-mediated upregulation of MCT is essential to prevent intracellular acidification (99). Interestingly, monocarboxylate transporter 4(MCT4) transfers lactate produced by glycolysis to TME, while monocarboxylate transporter 1(MCT1) transports lactate from TME to tumor cells.
Upregulated MCT4 expression has been associated with poor prognosis (100). Elevated MCT4 promotes lactate export to produce an immunosuppressive microenvironment (99, 101), and the excretion of H+ ions help to unblock its inhibitory effect on glycolytic enzymes (98, 102). Therefore, elevated MCT4 expression indicates that cells adopt glycolysis-based metabolism.
In metastatic melanoma, the expression of MCT1 is often upregulated, and the lactate transported into melanoma cells through MCT1 is converted into pyruvate for mitochondrial oxidative respiration (53, 103). Therefore, lactate does not accumulate or damage cells. Recent research reveals that increased MCT1 expression indicates the vulnerability of tumor cells to mitochondrial bioenergetics (98). However, MCT1 expression in melanoma metastases is reportedly correlated with the primary tumor size (100).
The expression of LDHA and LDHB is determined by the oxygen content of the tumor microenvironment, representing the glycolysis and oxidative phosphorylation levels, respectively. LDHA gene expression is increased under hypoxia; LDH3-5 catalyze pyruvate to lactate and promote glycolysis. LDHB encodes lactate dehydrogenase 1-2 (LDH1-2), which catalyze the conversion of lactate to pyruvate. The pyruvate supply providing the substrate for mitochondrial respiration and promoting oxidative phosphorylation (61). Therefore, LDHA and LDHB expression reflects the energy metabolism mode in tumors.
Melanoma cells expressing high or low levels of PGC-1 represent different phenotypic subgroups of energy metabolism (76). High levels of PGC1α are associated with a poorer prognosis in metastatic melanoma (65, 76) since melanoma with high PGC-1α expression has a higher mitochondrial biosynthetic capacity (71, 104). Therefore, high-PGC-1α-expressing melanoma depends more on OXPHOS for ATP and can also survive under oxidative stress conditions (65, 73, 94). A study found that low-PGC-1α-expression melanoma exhibited downregulated mitochondrial oxidative respiration (71) and was more dependent on glycolytic metabolism, which reduced ATP production but metabolized more glucose (105). Despite the high sensitivity of low-PGC-1α-expression melanoma to ROS-induced apoptosis, this cell subgroup exhibits a higher expression of pro-metastatic genes, including integrins, transforming growth factor β (TGFβ) and Wnt (71, 76, 106).
In summary, melanoma cells with high levels of PGC-1α produce ATP mainly through OXPHOS and have a stronger ability to proliferate (71), while those with low levels of PGC-1α are more dependent on glycolysis (76) and show greater metastatic capacity. However, Grant et al. found that melanoma brain metastases depended more on OXPHOS (11) (in contrast with melanoma lung metastases and primary melanoma). Although it may seem contradictory, it is widely thought that the predominant metabolic mode of metastatic melanoma may depend on the local tumor microenvironment (e.g., intracranial or extracranial melanoma metastases).
Both glycolysis and OXPHOS are reportedly upregulated in advanced melanoma. Tumor cells in the hypoxic microenvironment rely mainly on glycolysis, while the remaining melanoma cells can take up the glycolytic product lactate and convert it to pyruvate via LDH. This phenomenon provides the substrate for mitochondrial oxidative respiration (61) and prevents lactate accumulation in hypoxic regions (91), which is known as metabolic symbiosis (14, 101). Melanoma cells in different regions have different metabolic patterns, and melanoma cells with different metabolic patterns can feed each other, providing sufficient metabolic substrates and a suitable environmental pH (Figure 2) (107, 108).
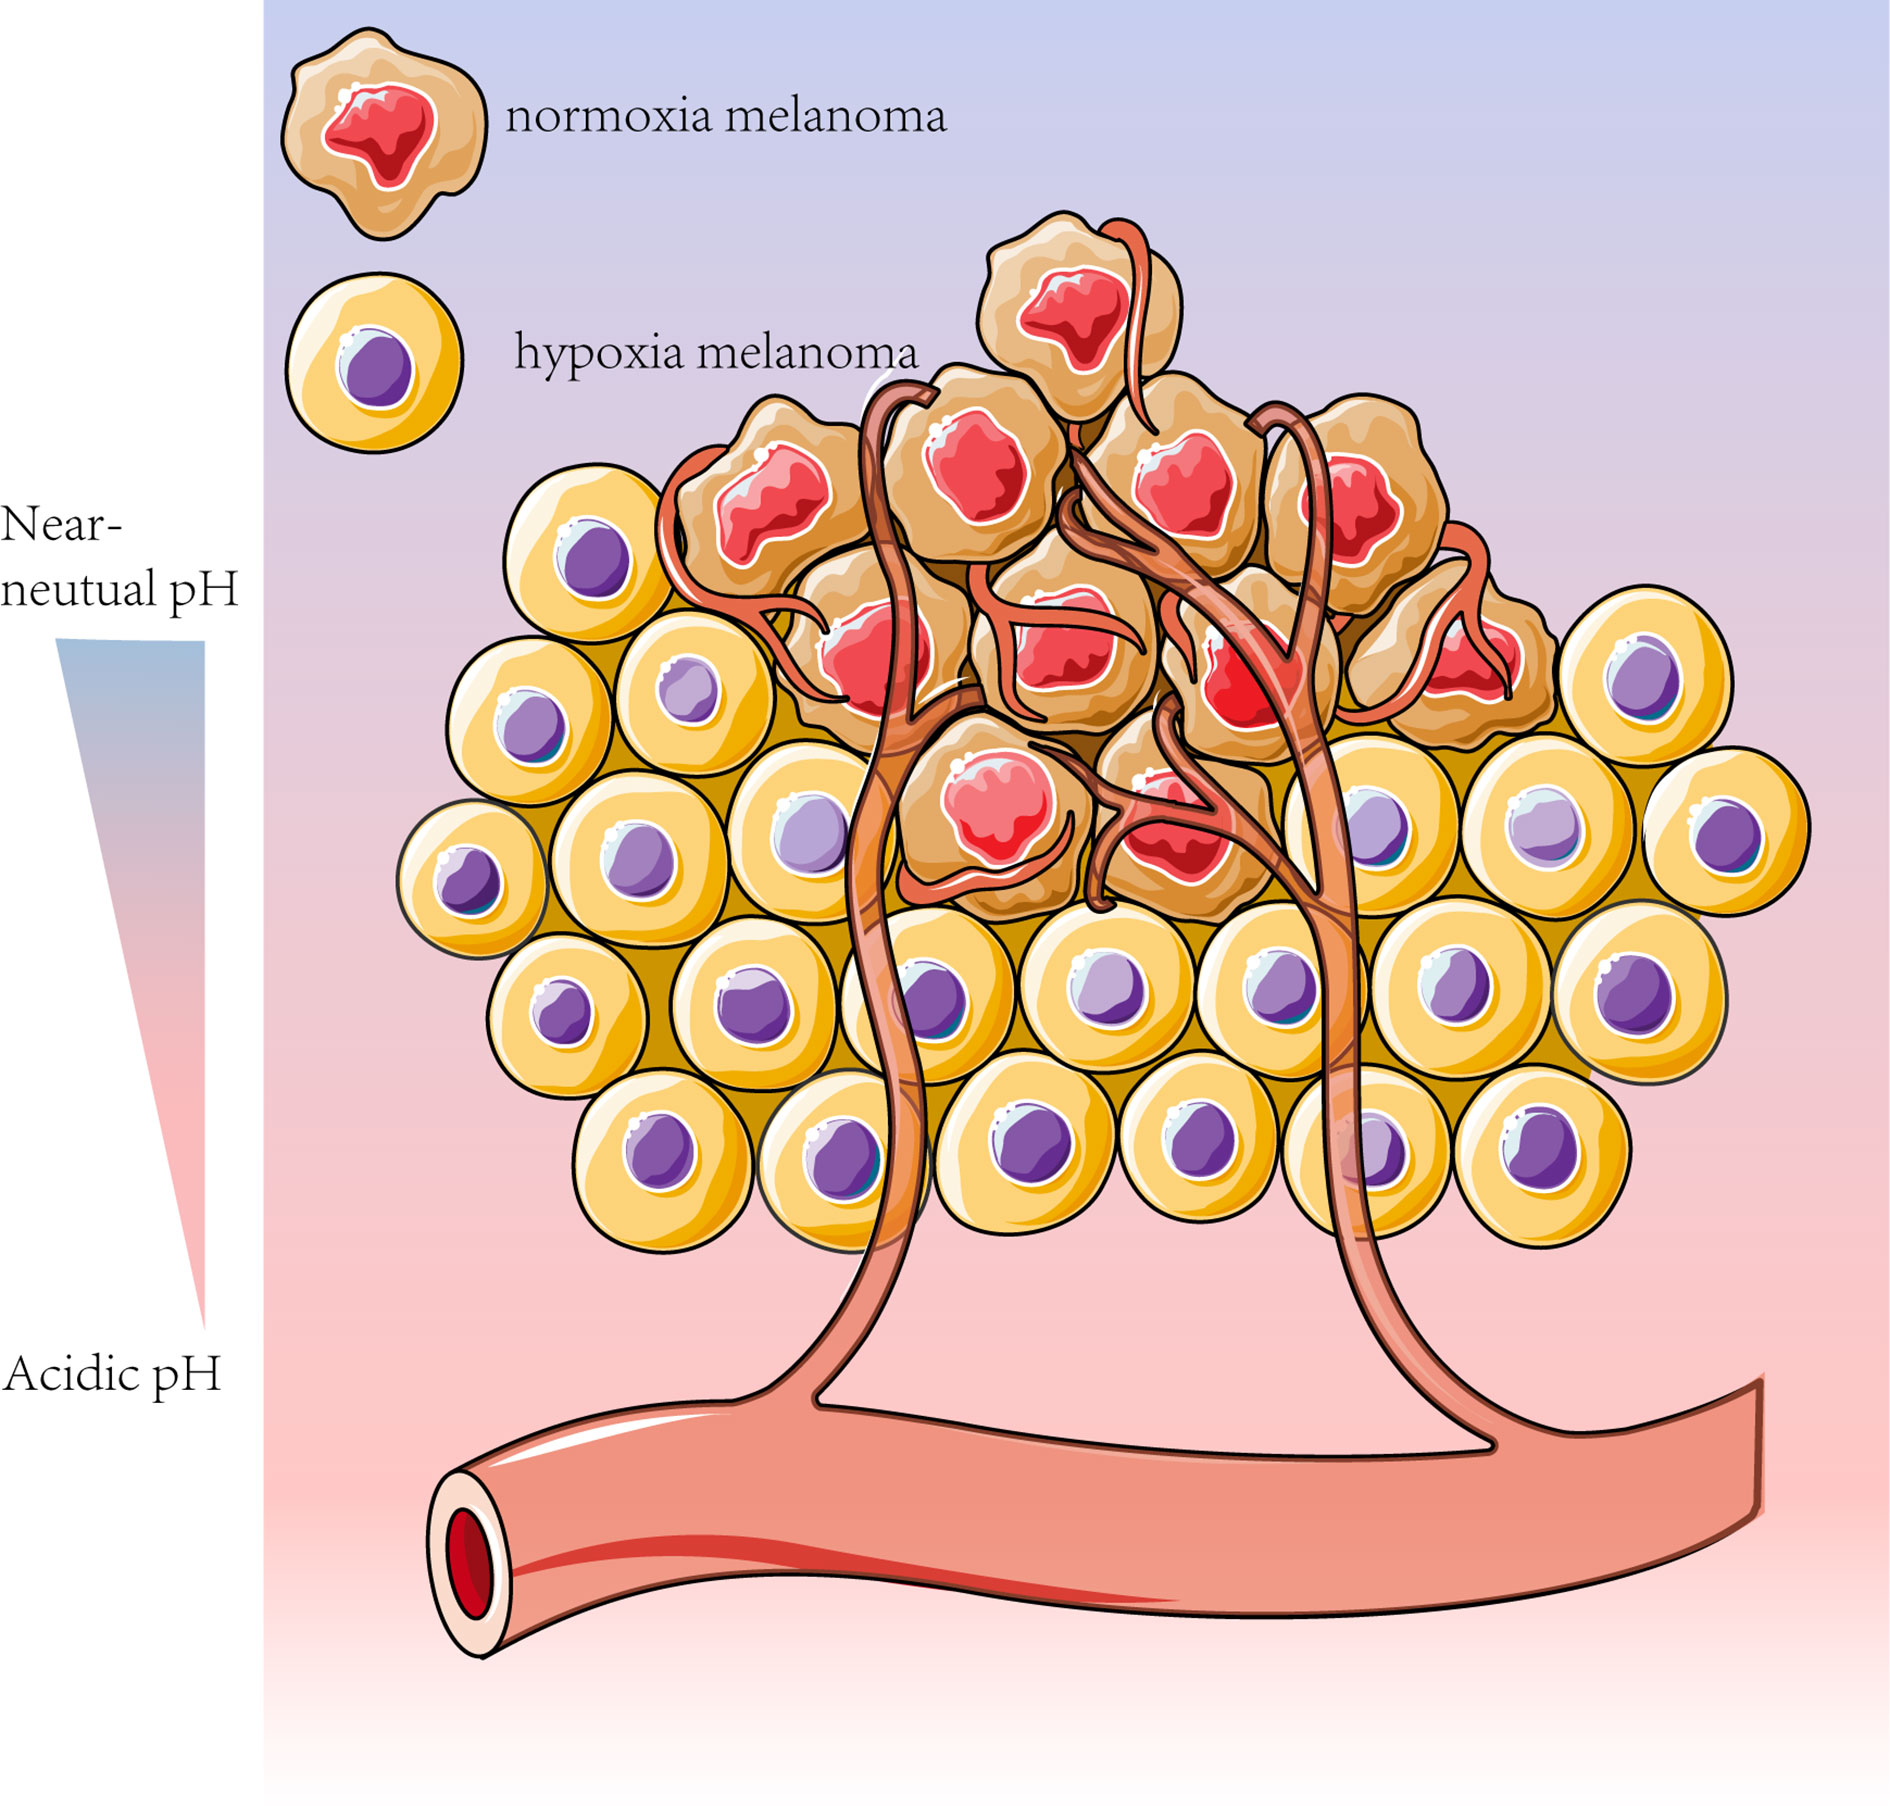
Figure 2 Melanoma cells can adapt their metabolism to the tumor microenvironment conditions, such as pH and oxygen content. To meet the high metabolic “demand” associated with melanoma dormancy, homeostasis and escape, the less oxygenated sites rely mainly on glycolysis, whereas the more vascularized tumors are more contingent on OXPHOS for energy production (14, 61). Based on this metabolic feature, melanoma cells can be divided into cells with enhanced glycolysis and inhibited OXPHOS under hypoxic conditions and other cells with adequate oxygen levels more dependent on OXPHOS (14).
Various factors can contribute to the metabolic heterogeneity of melanoma, including oncogenes, tumor stage, intra-tumor vascular structure, and oxygen and glucose levels (100, 109, 110). This spatial and temporal metabolic heterogeneity promotes melanoma development, resulting in poor patient prognosis.
An increasing body of evidence suggests that the activation of the PI3K pathway and overexpression of MYC (111) and HIF1α promote glycolysis and programmed cell death protein-1 ligand (PD-L1) expression (112, 113). Therefore, increased glycolytic flux indirectly implies increased PD-L1 expression, making melanoma relatively sensitive to programmed cell death protein-1 (PD-1) or its ligand PD-L1 blockade (114). However, a sustained high glycolytic flux causes an acidic and nutrient-limited immunosuppressive microenvironment, which leads to poor immunotherapy efficacy (115–117).
Hypoxia in the tumor microenvironment can impair immune cell functions, resulting from OXPHOS (113). In addition, gene pathways inducing oxidative phosphorylation do not overlap with those inducing PD-L1. Therefore, melanoma with high oxidative phosphorylation flux exhibits less PD-L1 expression and is less sensitive to immune checkpoint blockade.
It is well established that the metabolism of melanoma can result in an immunosuppressive tumor microenvironment. Moreover, the metabolic heterogeneity of melanoma will inevitably affect the metabolism of infiltrating immune cells at the tumor site (Table 1). This leads to the heterogeneous sensitivity the tumor to immune checkpoint inhibitors and is the reason for the lack of response to immune checkpoint therapy in some patients.
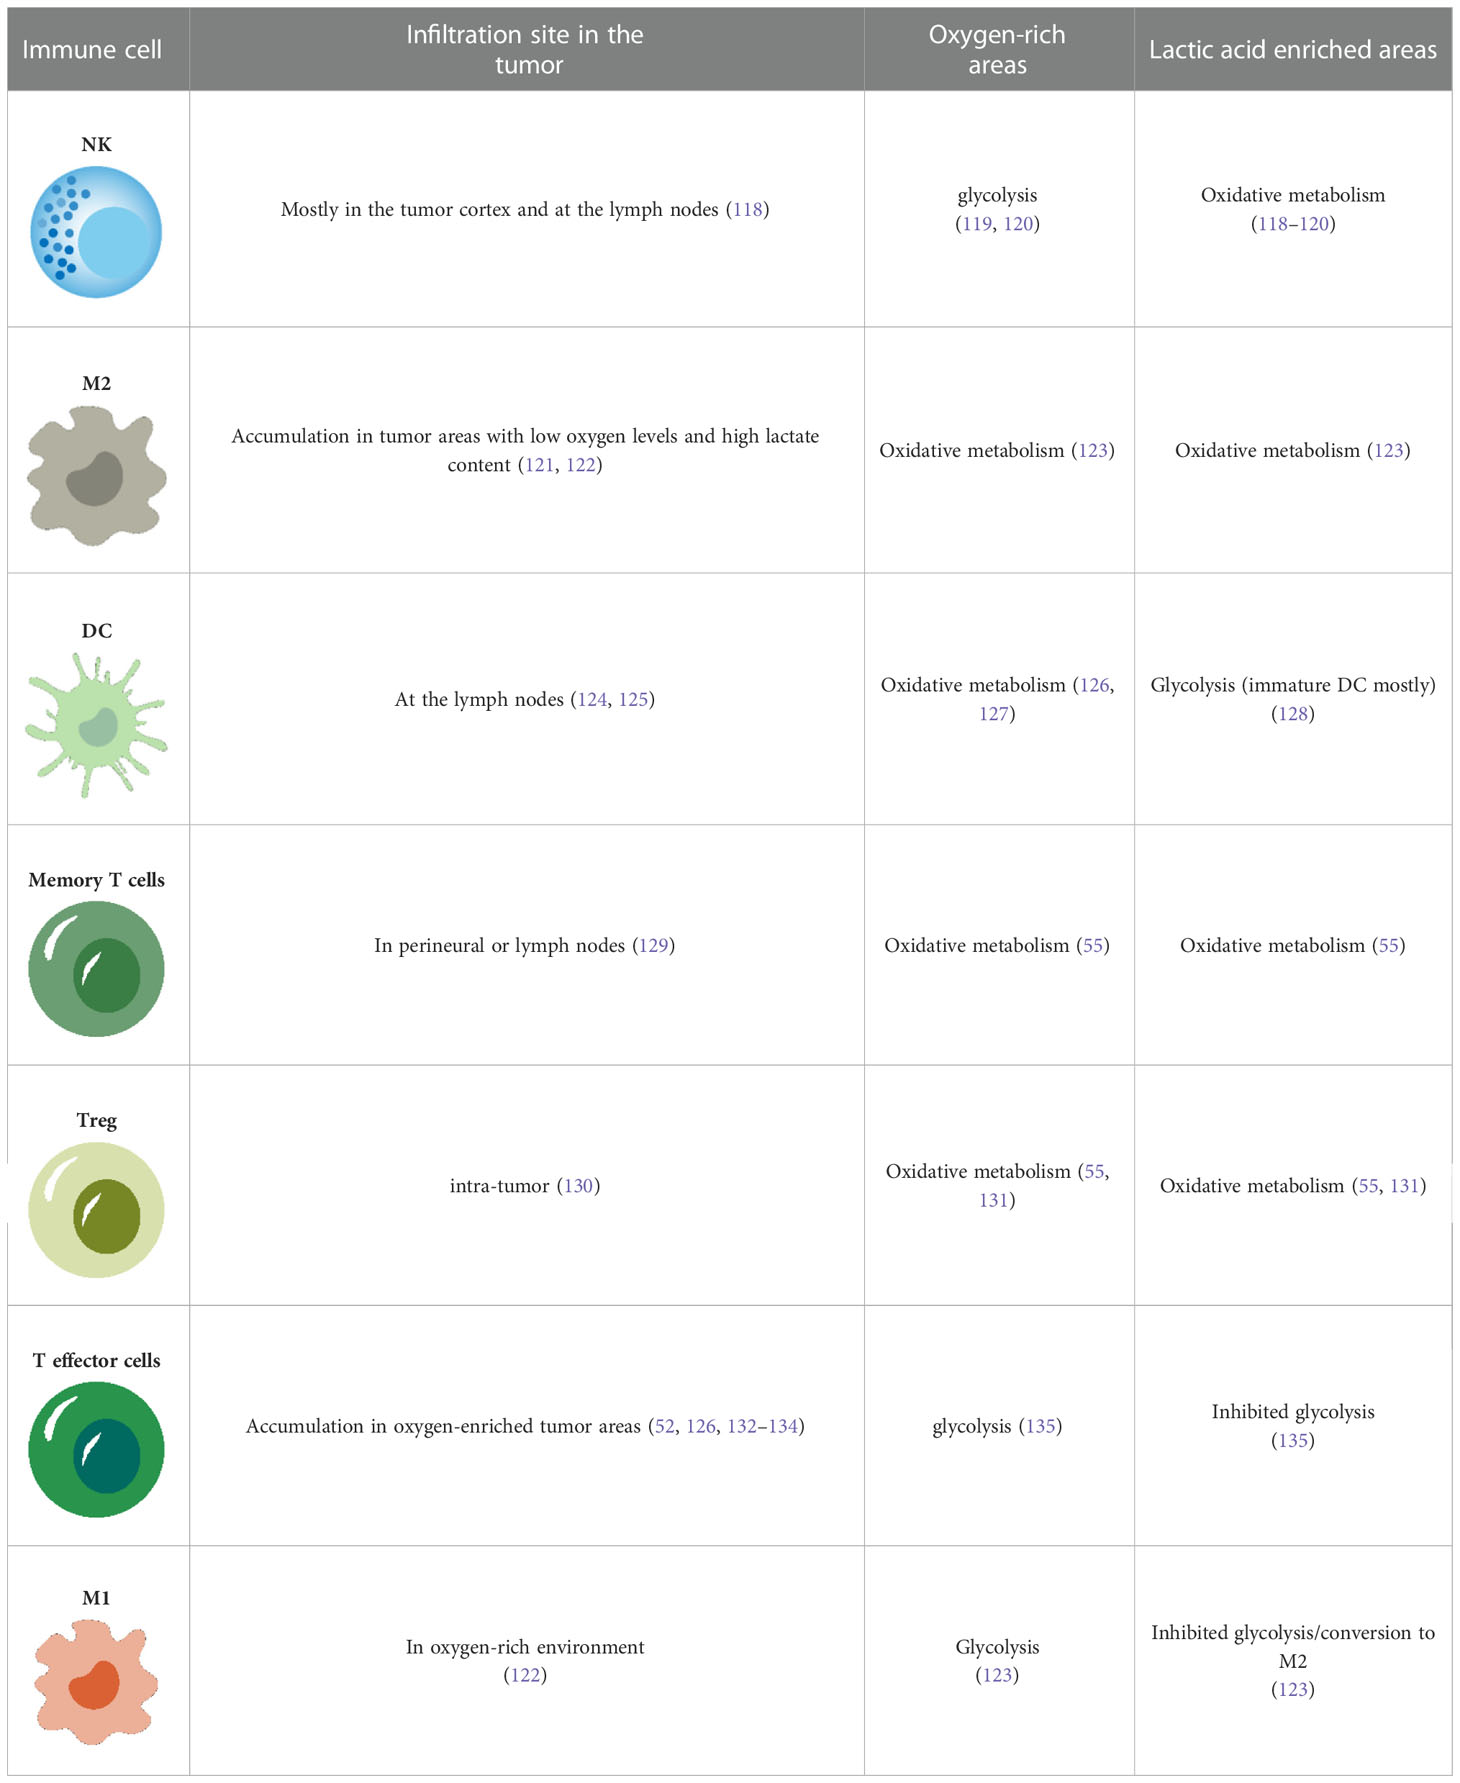
Table 1 Metabolism of immune cells in melanoma.
the metabolic heterogeneity of melanoma will inevitably affect the metabolism of infiltrating immune cells at the tumor site, which leads to heterogeneous sensitivity to immune checkpoint inhibitors, accounting for the lack of response to immune checkpoint therapy in some patients.
Growing evidence suggests that melanoma cells in high glycolysis regions require high glucose consumption, leading to glucose deprivation in TME (119, 136, 137), which promotes the AMPK pathway in T cells, thereby inhibiting mTORC1 activity (mTORC1 and mTORC2 are the two distinct complexes of functional enzyme mTOR). As a result, T cell glycolysis is restrained (138). However, T cells require glycolysis for activation. Inhibition of glycolysis in T cells causes impaired T cell energy production and macromolecular synthesis (137, 139), leading to the failure to translate some mRNAs like interferon γ (IFN-γ) mRNA. IFN-γ is a pro-inflammatory cytokine produced by T cells that enhances the immune surveillance capacity of cytotoxic T lymphocytes (CTL) in TME (140). Therefore, melanoma limits T-cells function by glucose depletion.
Moreover, acidity and lack of glucose in highly glycolytic melanoma can upregulate PD-1 expression in T cells (141, 142). In this respect, PD-1 can block the T-cell receptor (TCR)-mediated signaling pathway or PI3K pathway (143, 144), thus reducing glycolysis (45, 145) in T cells and inactivating them (Figure 3) (150).
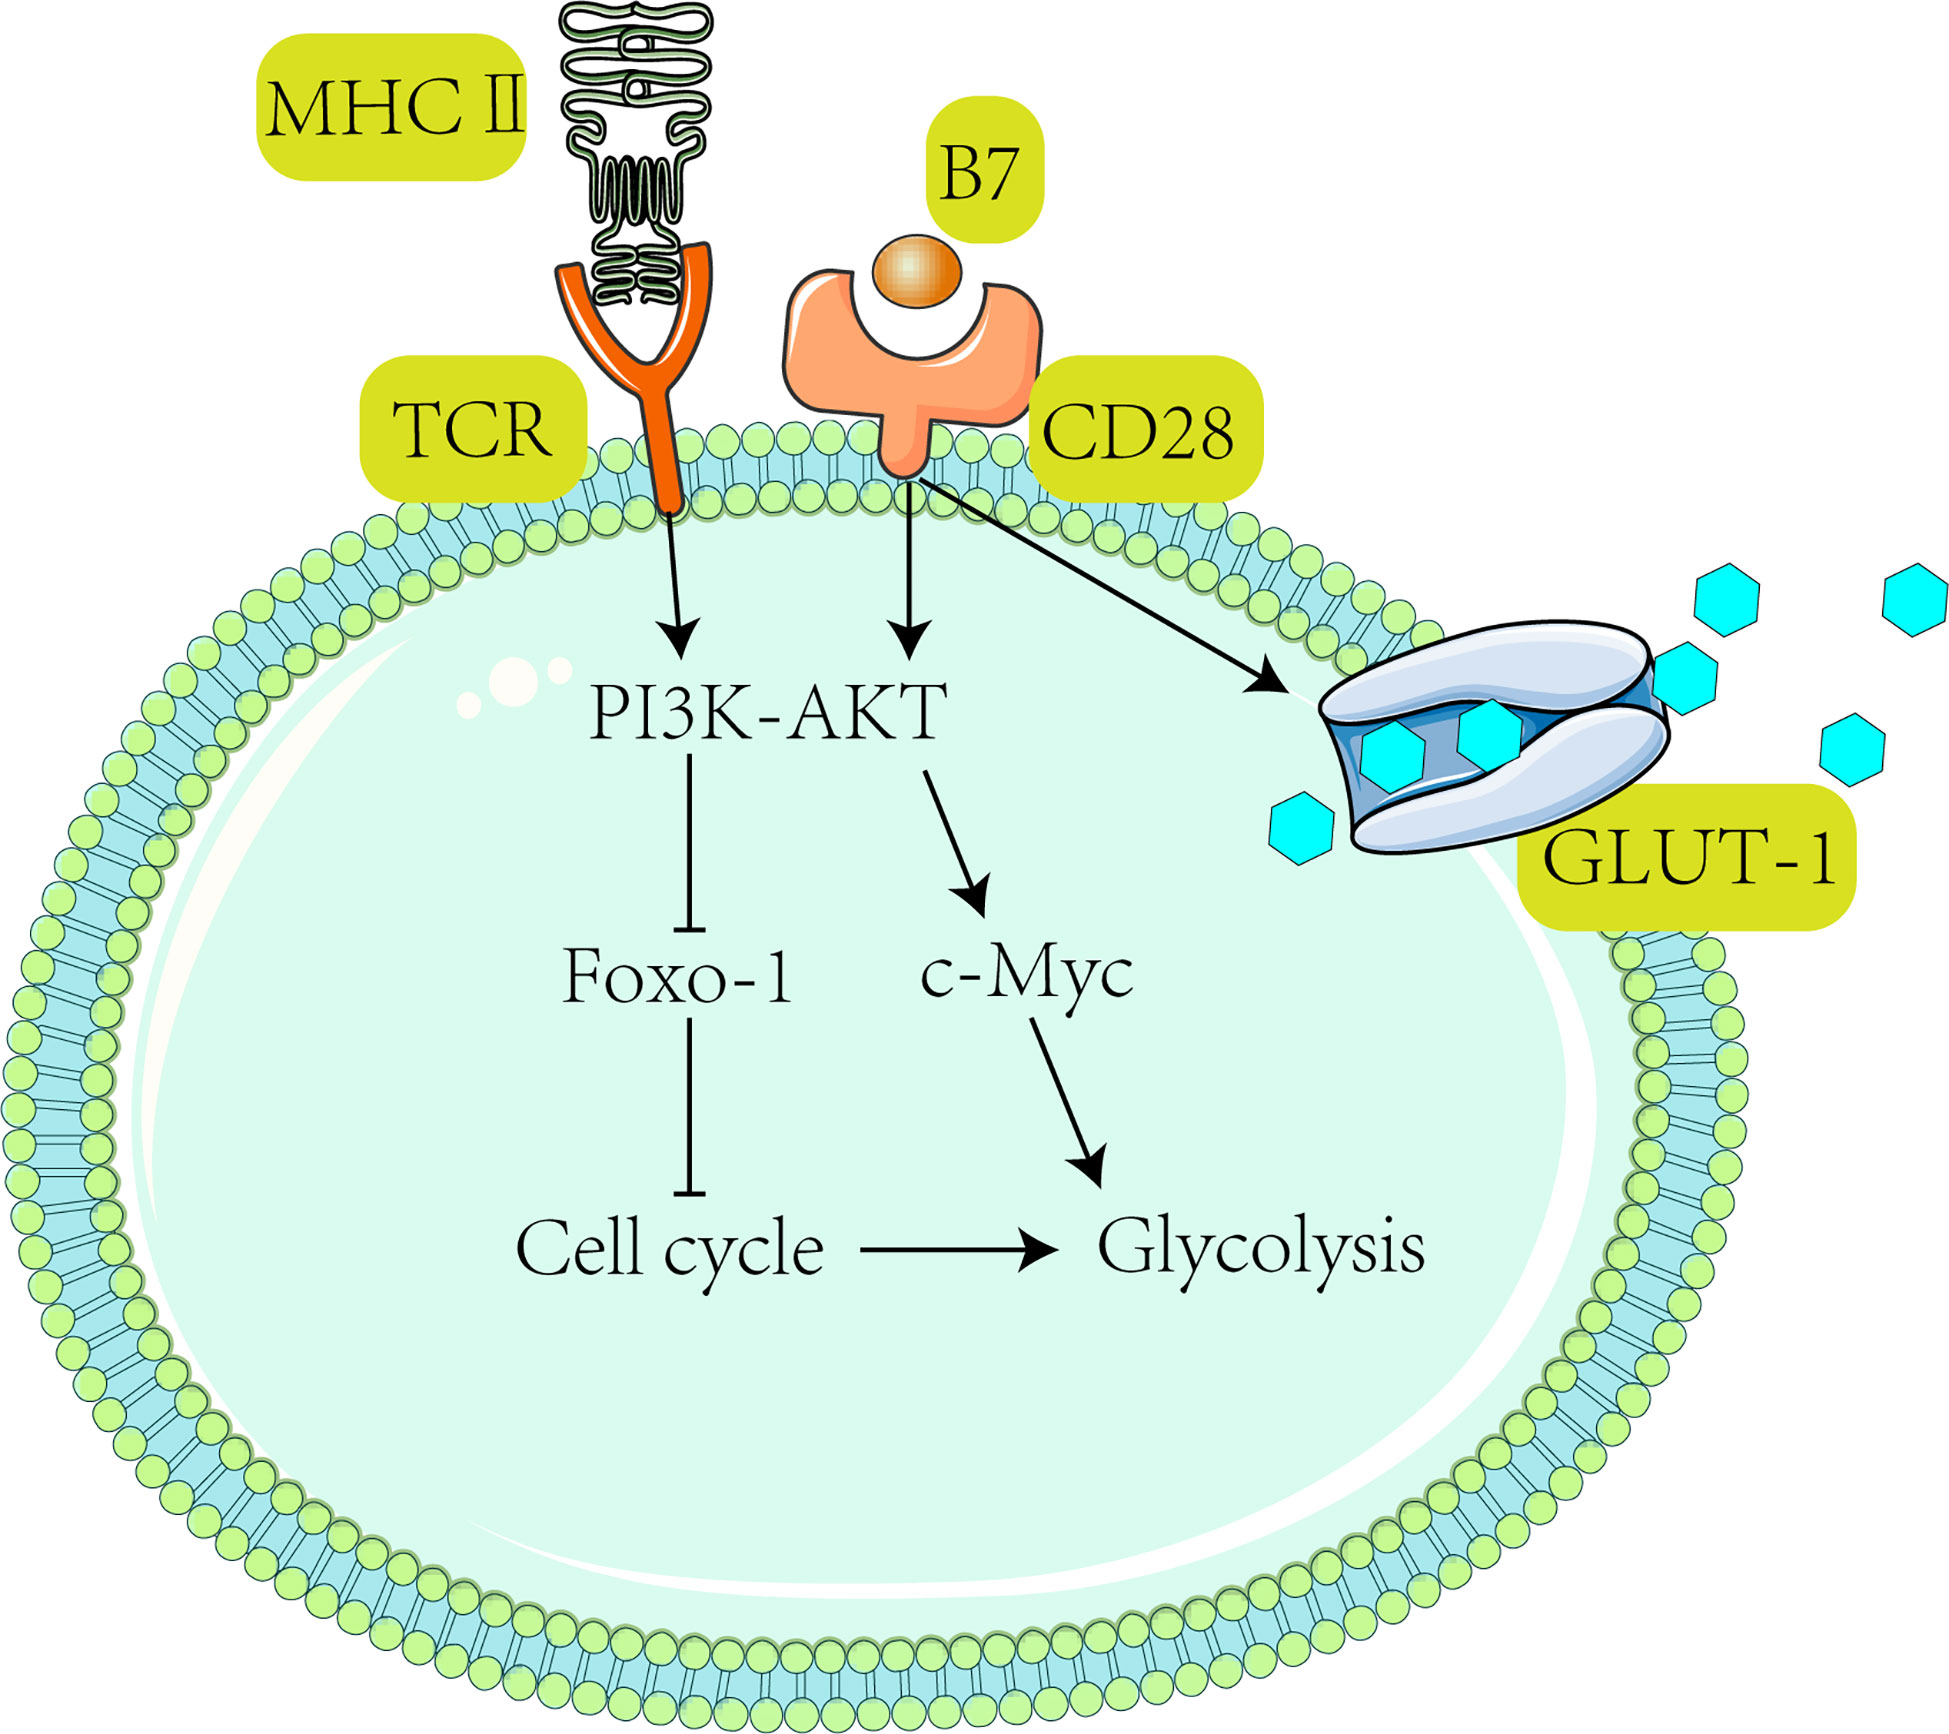
Figure 3 Activation of T cells requires receiving TCR and CD28-mediated co-stimulation, subsequently activating the PI3K-Akt pathway (47). After the PI3K-Akt pathway activates c-Myc, downstream Glut1 expression is stimulated to promote glycolysis (139) and T cell proliferation (146). It has been shown that activated T cells drive the PI3K-Akt-Foxo1 regulatory circuit (147, 148). Foxo1 (Forkhead box P1) is a transcriptional repressor of the T cell activation (147). Activation of AKT suppresses Foxo1 expression (149) and ultimately promotes T cell activation (47).
The decrease in CTL leads to an increase in the proportion of Treg in tumor microenvironments (52, 151, 152). Intriguingly, PD-1 does not restrain Treg metabolism (144, 153, 154) since Treg expresses forkhead box P3 (Foxp3); Foxp3+ Tregs inhibit glycolysis and promote OXPHOS (155, 156) (Figure 4), which both reduces NAD+ consumption (inhibits glycolysis) and increases NAD+ production (promotes OXPHOS). Therefore, Treg has more NAD+ for electron transfer, even when glycolysis is restricted (157). Tregs can take up lactate through MCT1 and convert it to pyruvate in the mitochondria for oxidative phosphorylation in a low-glucose tumor microenvironment.
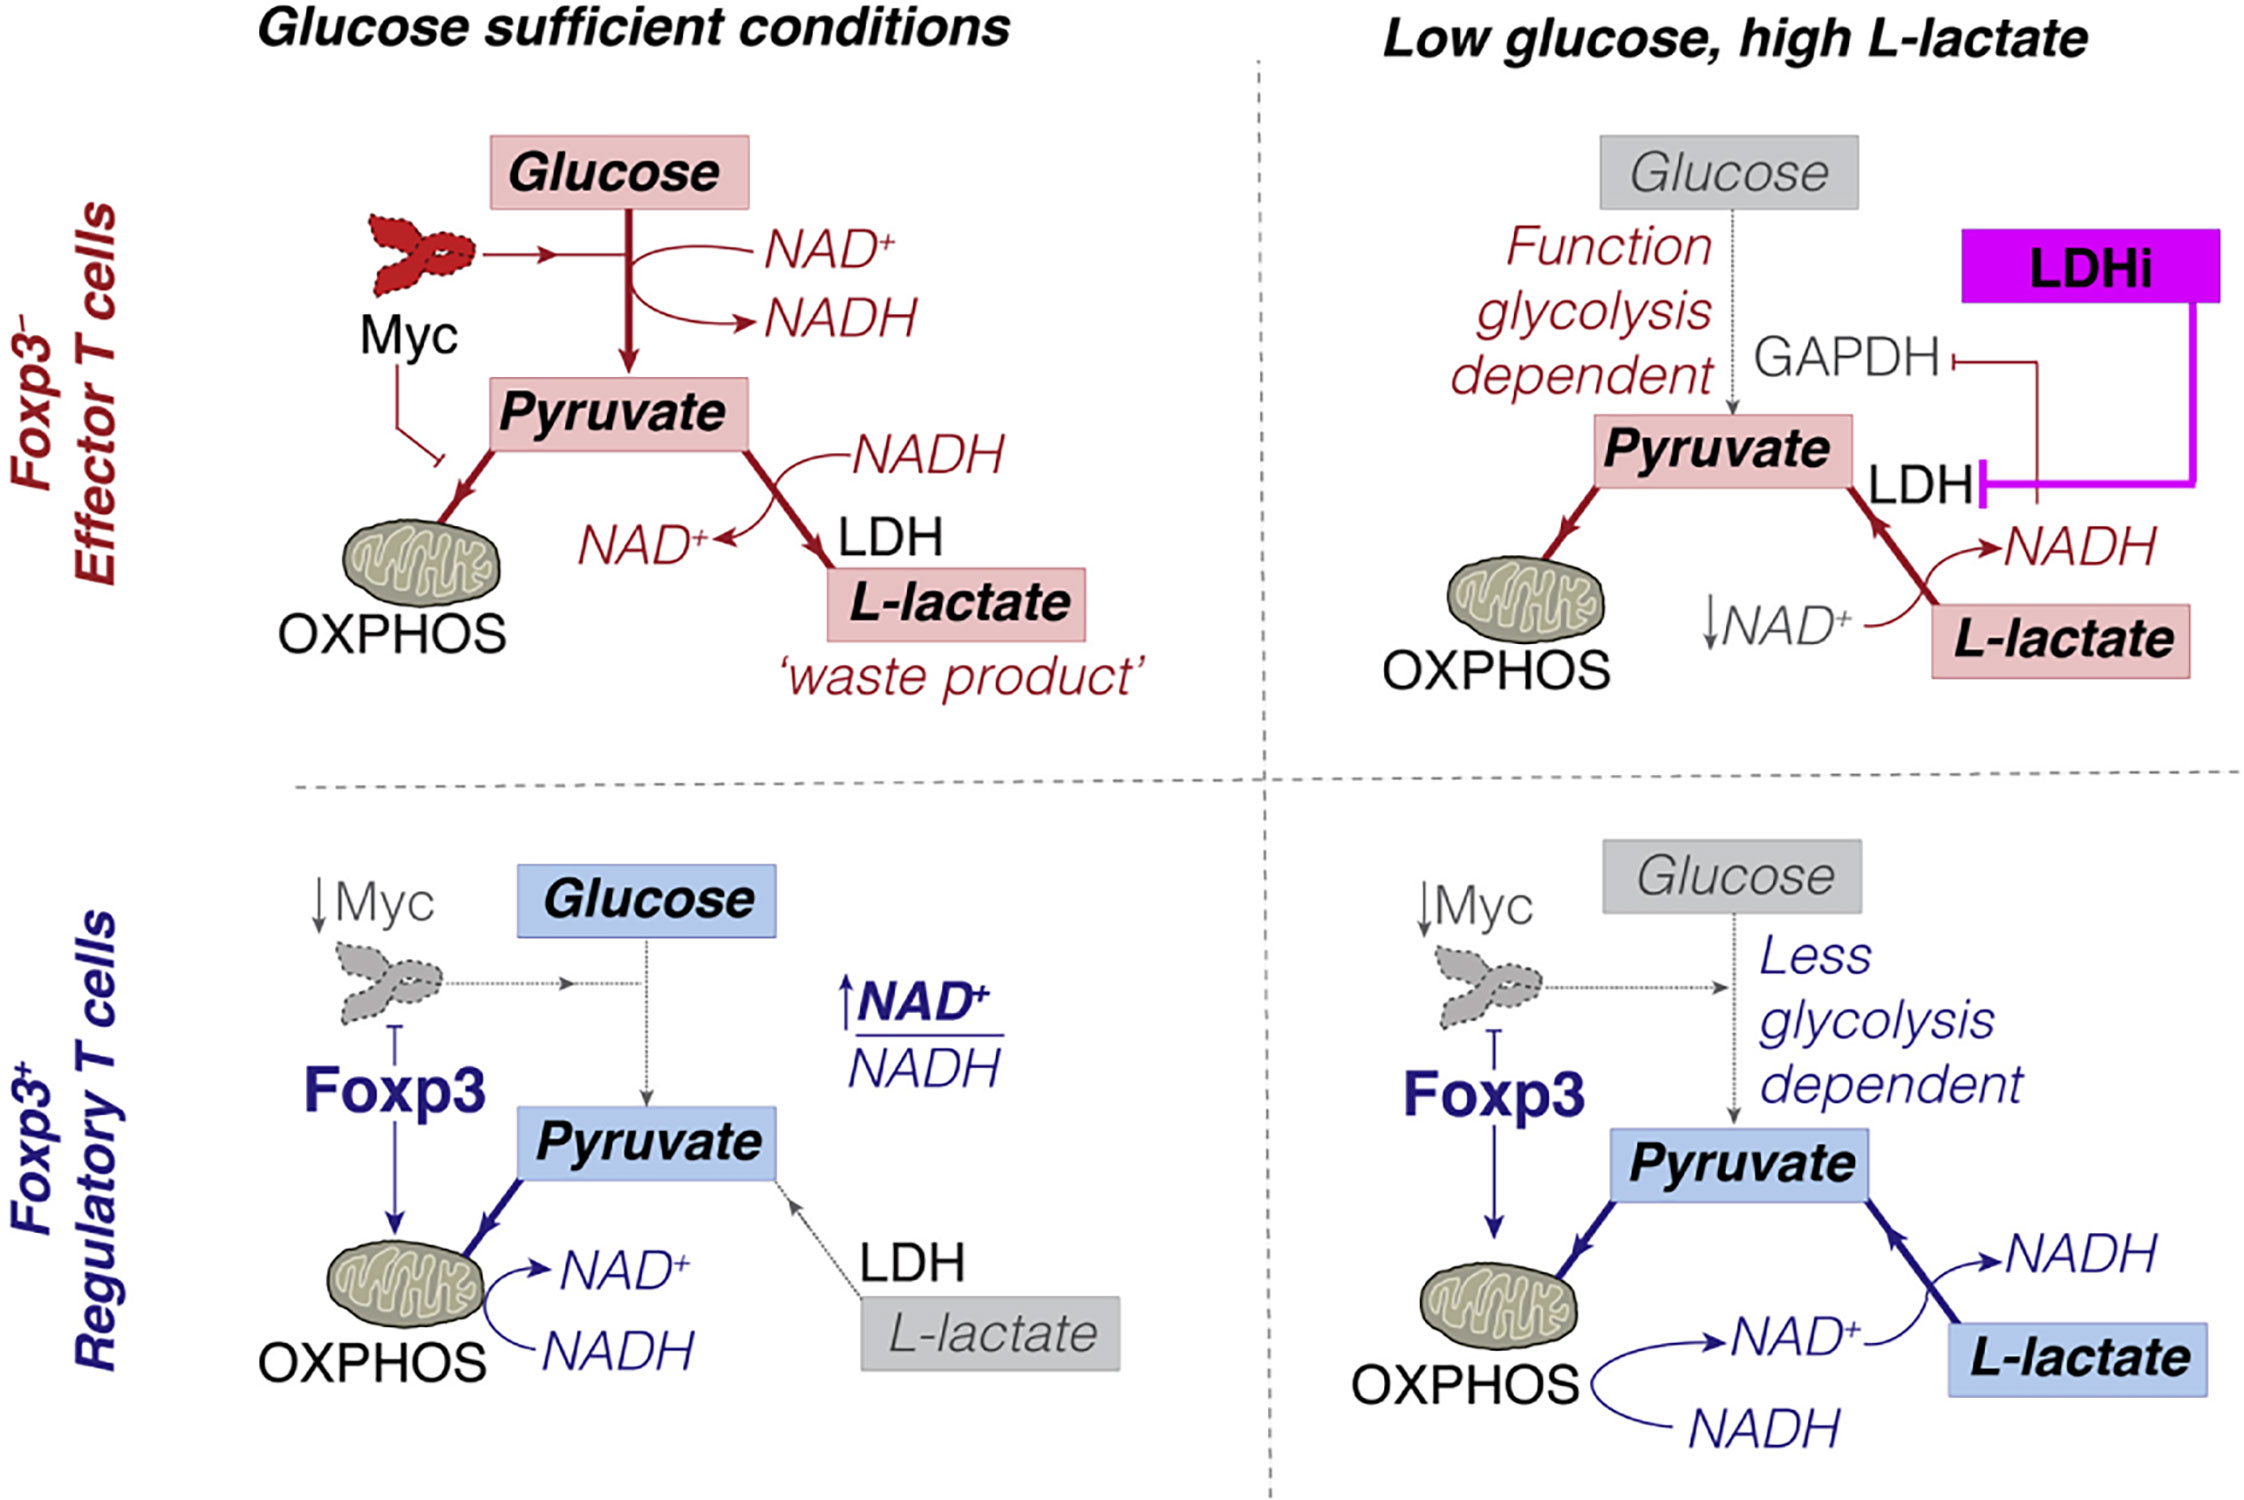
Figure 4 Conceptual model of how Foxp3+ Treg can escape the suppressive effects of low glucose, high L-lactate environments. Copyright © 2016 Elsevier Inc.
However, it should be borne in mind that PD-1 is not always harmful to the immune system, given that PD-1 inhibits T cell glycolysis, which facilitates the formation of resting amnesic T cell populations (158). PD-1 stimulates T cells to reduce mitochondrial cristae and increase respiratory chain complexes (159). Accordingly, T cells have a substantial spare respiratory capacity (i.e., additional mitochondrial capacity for energy production in response to increased work or stress) (149, 160, 161). Glycolysis required in T cell activation can be replaced by mitochondrial oxidation (162–164), which contributes to the formation of memory T cells. Differentiation into memory T cells could prolong T cell survival (7, 165, 166) and preserve the potential for subsequent immunity. These changes may contribute to the response of melanoma to immune checkpoint blockade (ICB). However, PD-1 inhibits mTOR, which inhibits downstream PGC-1α, leading to increased mitochondrial oxidation and impairing the ability of T cells to alleviate oxidative stress (144).
Both glucose-restricted TME and PD-1 impair the immune effect of T cells. Although T cells may differentiate into memory T cells through metabolic transformation, this tumor environment can eventually inhibit cytotoxicity to tumor cells and induce immune quiescence (154, 165, 167).
T cells in high-glycolytic-flux melanoma areas express cytotoxic T lymphocyte-associated protein 4 (CTLA-4). Current evidence suggests that CTLA-4 downregulates CD28 and blocks all TCR signaling (168), inhibits AKT via protein phosphatase 2A (PP2A) (169), and downregulates T cell glycolysis (121). Moreover, inhibition of glycolysis induced by CTLA-4 does not promote mitochondrial oxidation, which avoids differentiation into memory T cells (143, 144). This phenomenon leads to the desensitization of T cells to tumor antigens and causes immune dysfunction (142).
In addition, lactic acid produced by glycolysis prevents the maturation of dendritic cells (DC), increases immunosuppressive cytokines such as IL-10 (121), and induces TAM polarization to an M2 phenotype (122). M2 releases vascular endothelial growth factor (VEGF) and indoleamine 2,3-dioxygenase (IDO), which promotes Treg migration to the tumor and inhibits natural killer (NK) cell function (122, 170, 171).
T cell infiltration is a prerequisite for response to immunotherapy (172). Although CD8+ T cells in glycolytic regions are significantly reduced (Figure 5) compared to oxidative phosphorylation regions, the glycolysis-dominated melanoma does not compete with tumor-infiltrating lymphocytes (TILs) for oxygen. As a result, TILs are more fully metabolized and have higher cell mass despite reduced numbers (113). In contrast, although OXPHOS-dependent melanomas have more glucose, melanoma cells with high oxidative phosphorylation flux consume more oxygen, and the hypoxic microenvironment is more likely to cause T cell dysfunction (113), accounting for the shorter overall survival of patients with high oxidative phosphorylation flux than those with high glycolytic flux after PD-1 monoclonal antibody treatment. Therefore, targeting oxidative metabolism in melanoma is key to improving immunotherapy effects (113, 173).
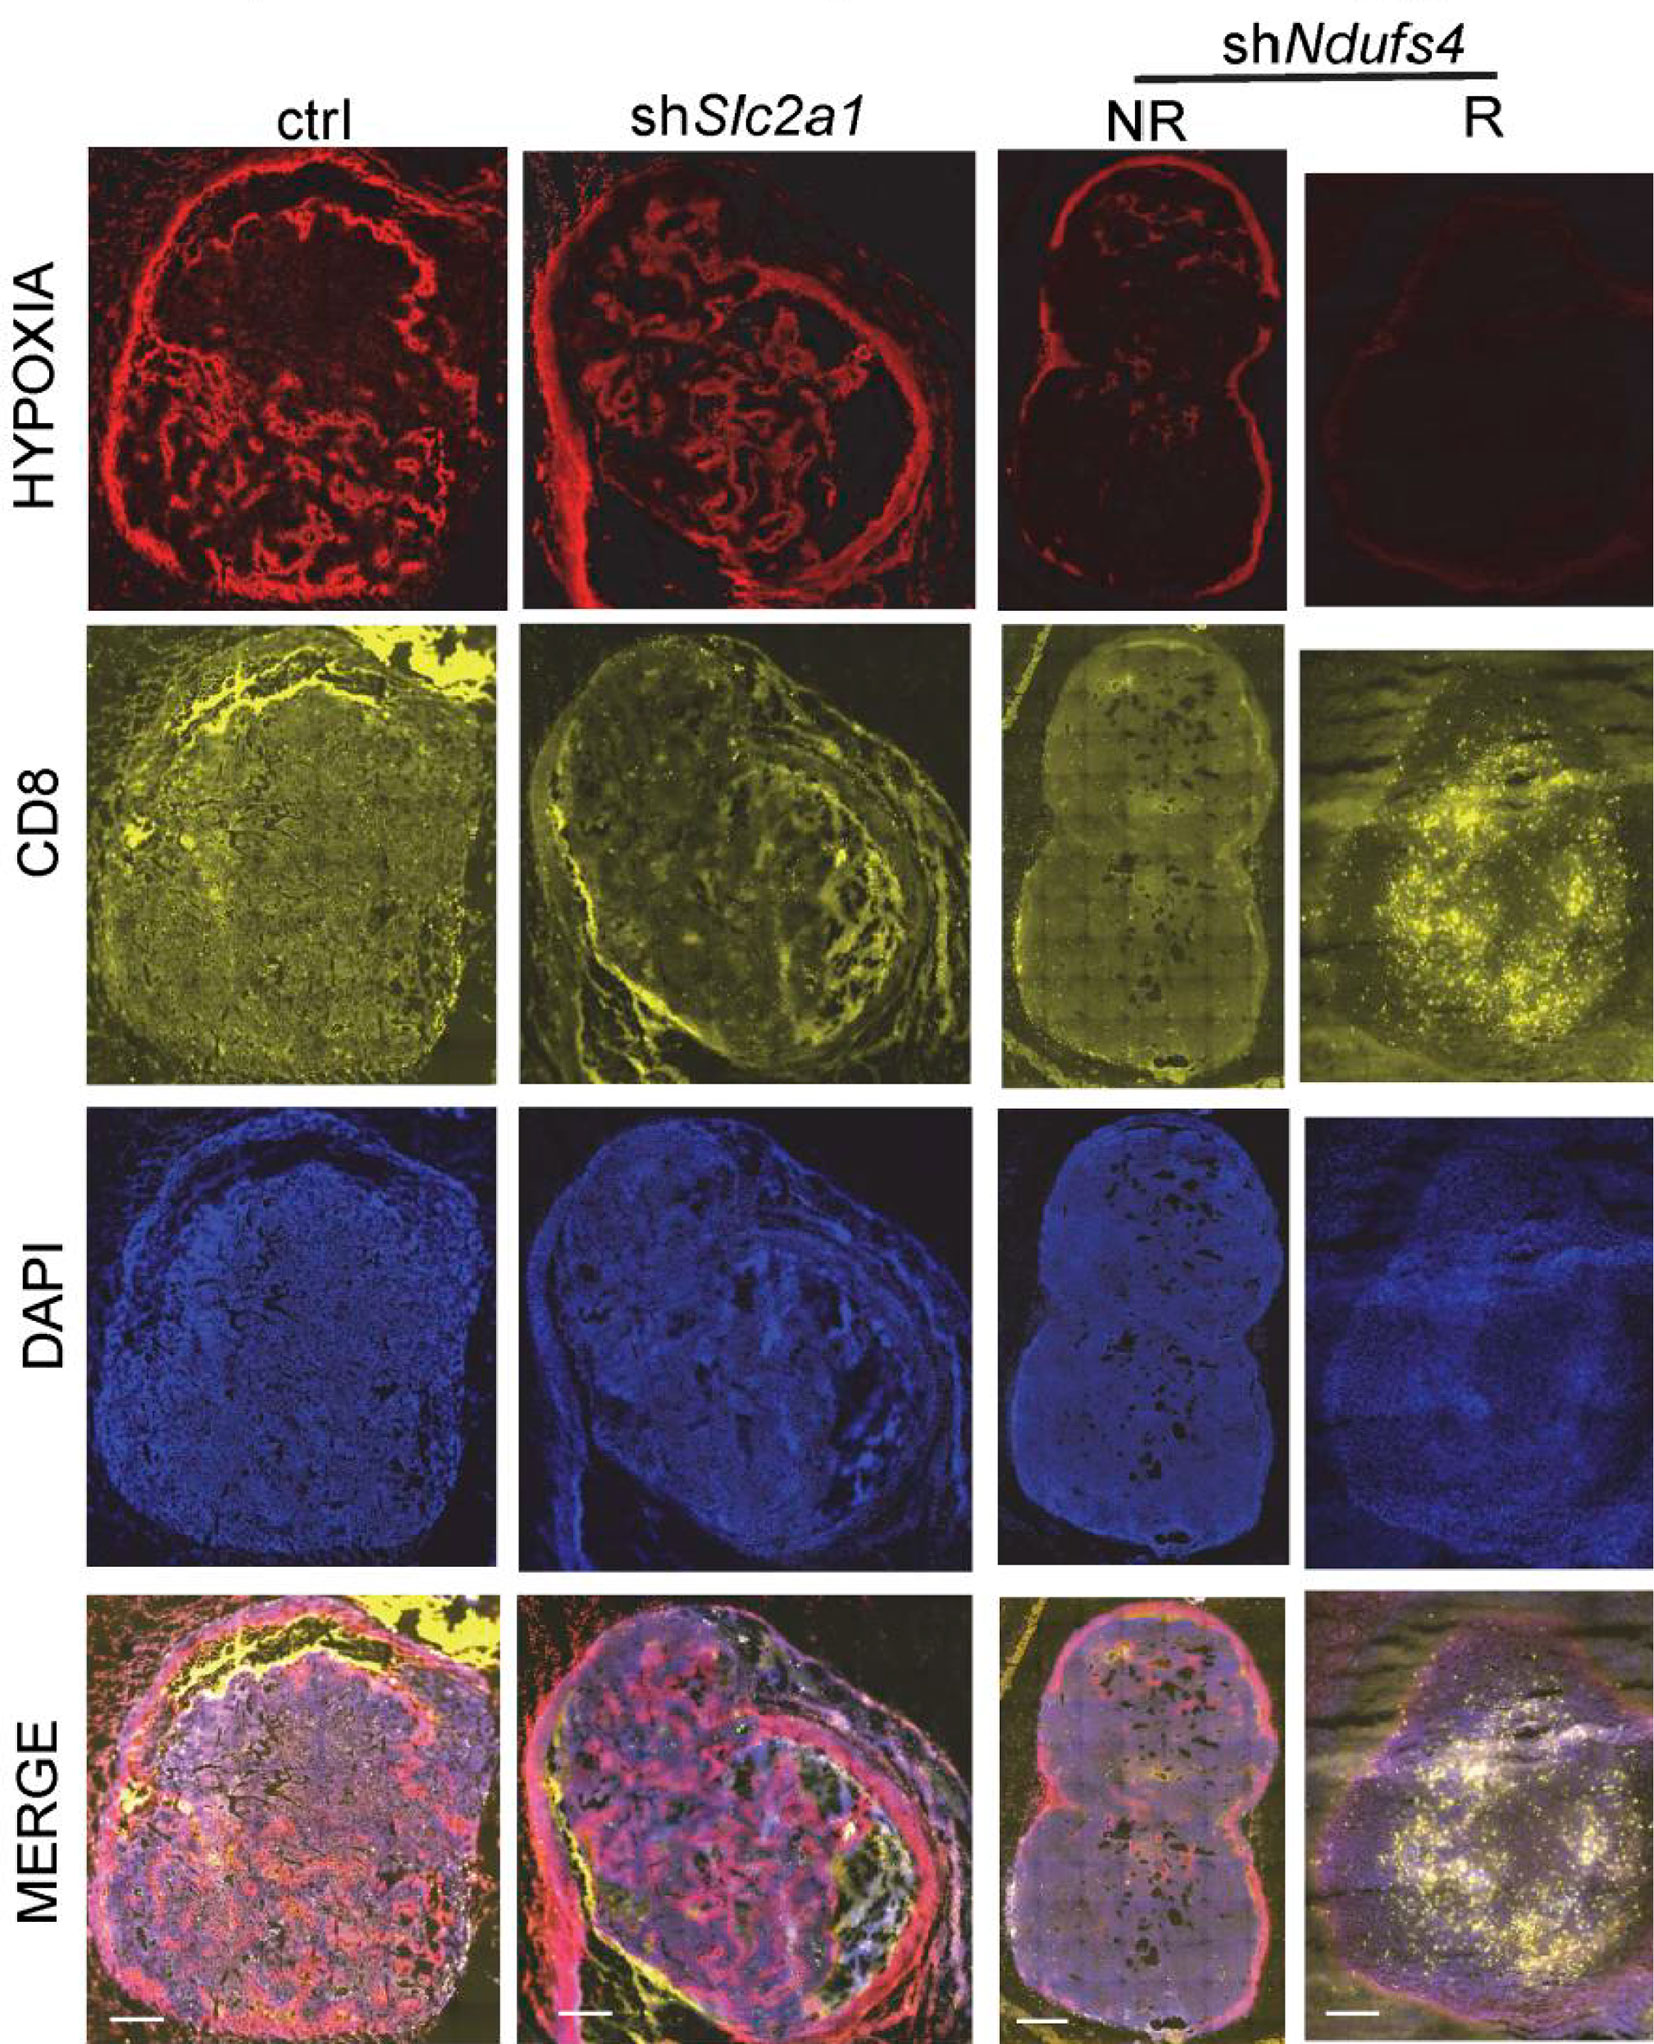
Figure 5 Hypoxia is present in the control group (elevated glycolysis, elevated oxidative phosphorylation) and the shSlc2a1 group (reduced glycolysis, elevated oxidative phosphorylation), while T cell accumulation in melanoma is low. The shNdufs4 group (glycolysis only) is less hypoxic, and the T-cell status is significantly improved. Copyright © 2019, American Society for Clinical Investigation.
The above phenomenon may be caused by the following reasons: (1) high oxidative phosphorylation flux induces hypoxia TME, which increases the expression of PD-L1 in melanoma and TAM (174). PD-L1 can recruit myeloid-derived suppressor cells to the tumor hypoxic region (175), thus forming an immunosuppressive microenvironmental barrier; (2) weak tolerance of T cells to hypoxia, causing T cell impairment or even failure; (3) decreased quantity and quality of T cell infiltration.
However, direct inhibition of mitochondrial oxidative phosphorylation leads to T-cell failure since TCR and CD28 co-stimulation promotes mitochondrial OXPHOS (176) and the activated mitochondria biosynthesize (177) as well as regulate T cell growth and proliferation (141, 163, 177, 178). Therefore, co-stimulation is required to avoid T-cell failure.
Since immune checkpoints are the primary cause of the progressive dysfunction of immune cells in TME (179), Jim Allison introduced the concept of ICB for cancer therapy in 1996 (180). In 2010, the CTLA-4 blocking antibody (Ipilimumab) became the first ICB treatment for metastatic melanoma (181). PD-1 is another T-cell immune checkpoint, and PD-1 or PD-L1 blocking antibodies were found to enhance control of a variety of tumors. Subsequently, PD-1 blocking antibodies (pembrolizumab and nivolumab) were approved for metastatic melanoma in 2014 (182). Given the effect of melanoma metabolism on immune cells, the combination of metabolic regulators and ICB therapy may be a promising approach (Table 2).
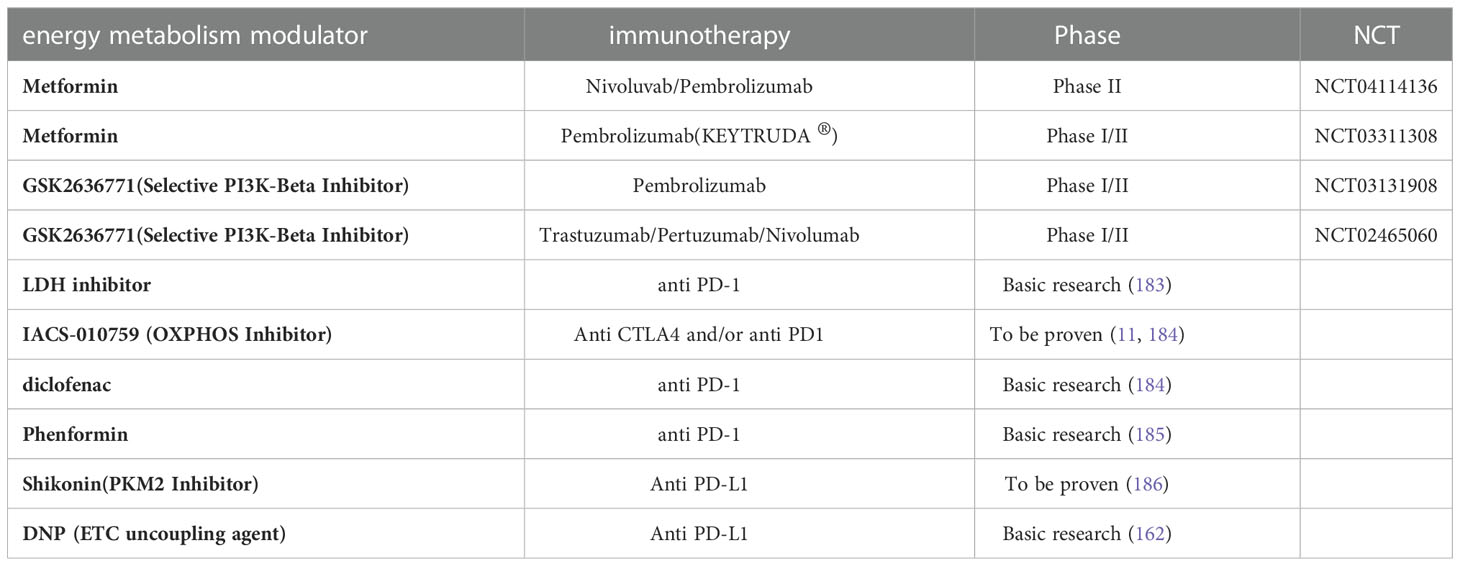
Table 2 Combinations of energy metabolism modulators with immunotherapy.
It has been established that clinically used checkpoint blocking antibodies against CTLA-4, PD-1 and PD-L1 can partially restore T cell function (137). For example, anti-PD-L1 antibodies downregulated Akt/mTOR pathway, significantly inhibiting the glycolysis of melanoma (113) and correcting glucose restriction induced by tumors. Anti-PD-1 antibodies can directly promote the glycolysis and activation of T cells, while the blockade of CTLA-4 not only restores the glycolytic of T cells but also inhibits the function of Treg and increases the glucose content in the microenvironment (187).
Although glycolysis is an ideal target for melanoma treatment (188), immune checkpoint blockade exhibits limited ability to transform the metabolic mode of tumors (184). Drugs targeting metabolism can inhibit tumor activity and improve the ability of T cells (94) to provide an anti-tumor immune microenvironment and improve the response of patients to checkpoint therapy (113, 184). For instance, PKM2, a tumor-specific glycolytic enzyme (189), is often overexpressed in melanoma tissues (190). Since PKM2 also interacts with cytokines regulating mitochondrial fusion, it can regulate glycolysis and oxidative phosphorylation to promote the growth of tumors (191). Pharmacological targeting of PKM2 by expressing PKM2 as a tetramer or silencing its mRNA leads to inhibition of the metabolism of melanoma cells and reduced expression of PD-L1 (186). The addition of immunotherapy agents is widely thought to yield a synergistic effect.
Despite the metabolic heterogeneity induced by individual differences in melanoma patients (such as genetics, tumor vascularization, tumor stage or other factors), the dominant metabolic mode in the tumor tissue can be predicted by specific biomarkers, such as LDH (53, 103), MCT (100), PGC-1α (65, 76), etc. Importantly, therapeutic efficacy can be significantly improved by combining metabolic regulators with immunotherapy based on such biomarkers.
It has been reported that the anti-CTLA-4 monoclonal antibody is not effective in melanoma with high glycolytic flux. However, in melanoma with glycolytic deficiency, blockade of CTLA-4 promotes infiltration and metabolic adaptation of immune cells, increases peripheral Tregs and induces its production of IFN-γ, ultimately improving the immune effect. Therefore, inhibiting tumor glycolysis in melanoma with high glycolytic flux is necessary to promote the anti-CTLA-4 effect (192–194).
Interestingly, lactic acid in melanoma is an immunosuppressive metabolite (195). It is widely thought that since Treg expresses more PD-1 than CTL, an anti-PD-1 monoclonal antibody in the environment with high lactic acid concentration will preferentially increase the flux of Treg glycolysis and enhance the immunosuppressive effect of Treg cells (16, 184). Therefore, inhibiting lactate secretion in melanoma with high glycolytic flux can improve the efficacy of immune checkpoint therapy.
Overwhelming evidence suggests that the monocarboxylic acid transporters represent a promising therapeutic target (196, 197). MCT1/2 inhibitors targeting lactate transporters are currently under investigation in clinical trials (NCT01791595). In vitro studies substantiated that diclofenac enhanced the killing of melanoma cells by T cells induced by anti-PD-1 and anti-CTLA-4 monoclonal antibodies (184). Diclofenac is a monocarboxylic acid salt that can directly inhibit MCT function and has recently been used as an effective inhibitor of MCT1 and MCT4. It was found that diclofenac could inhibit glycolysis in melanoma by reducing lactate transport. Although it could inhibit glycolysis in T cells (7), the secretion of IFN-γ in T cells was not blocked, possibly because T cells changed their energy metabolism mode to mitochondrial oxidation (184, 198).
LDH is an important marker in patients with advanced melanoma. Among malignant melanoma patients receiving PD-1 blockade therapy, patients with high LDHA expression show more significant ICB resistance and shorter progression-free survival (PFS) (117). Inhibition of LDH induced by oxalate and dichloroacetic acid can inhibit the growth of melanoma (96), and inhibition of LDHA improves the efficacy of anti-PD-1 treatment since the downregulation of tumor LDHA inhibits lactate production and saves glucose, and then improves the tumor microenvironment, resulting in increased T cell infiltration. The downregulation of LDHA limits the function of Tregs and contributes to a sustainable anti-tumor response during anti-CTLA-4 treatment (183). Therefore, LDH inhibition can improve the function of T cells under the immunosuppressive tumor microenvironment, making LDH an ideal target for the treatment of melanoma (52).
Inhibition of glycolysis may inhibit the activity of T cells. Since T cells cannot absorb and utilize lactate, inhibiting glycolysis enables targeting melanoma cells based on the metabolic difference between tumor and T cells.
In melanoma cells with oxidative phosphorylation as the dominant metabolic mode, the highly immunosuppressive microenvironment and the ability of mitochondria to utilize lactate caused by hypoxia account for the poor efficacy of immunotherapy in this type of melanoma patients
The OXPHOS inhibitor metformin can reportedly alleviate the hypoxic microenvironment, which is highly harmful to the function of effector CD8+ T cells (199), and then reactivate the exhausted CD8+ T cells in melanoma (200). Moreover, pharmacological inhibition against OXPHOS cannot impair the function of effector T cells (57). Metformin alone can make the tumor regress, and metformin combined with PD-1 monoclonal antibody exhibit synergistic effects during the treatment of melanoma (185, 199, 201).
It has been established that the expression of PD-1 leads to an increase in the oxidative respiratory flux of T cells, while the ROS produced by cell respiration promotes T cell apoptosis (7, 57). Current evidence suggests that anti-PD-1/PD-L1 therapy decreases the mitochondrial respiratory flux of some T cells and inhibits the mitochondrial function of T cells, although it reduces the generation of ROS (202). Intriguingly, electron transport chain (ETC) uncoupling agents can increase the production of mitochondrial ROS and enhance mitochondrial activity through the feedback mechanisms of mild mitochondrial damage (203). The joint use of ETC uncoupling agents and PD-1 antibodies can activate mTOR and AMPK pathways. Although these two pathways are antagonistic, they yield a synergistic anti-tumor effect (162). Moreover, mTOR activity can determine whether T cells transform into cells with effector or memory phenotypes after TCR stimulation and cell division (204, 205). Furthermore, low mTORC1 expression cells showed higher mitochondrial content, higher SRC (standby respiratory capacity) and more anti-apoptotic molecules, while the high mTORC1 expression showed increased glycolysis and expression of effector molecules. The AMPK pathway can act as a regulator of mTOR signaling, inhibiting glycolysis and promoting oxidative metabolism. Direct blockade of glycolysis allows T cells to preferentially migrate to lymphoid tissues and infiltrate tumors (119, 154, 157, 206). Compared with PD-1 blockade alone, the joint use of PD-1 blockade and mTOR or AMPK activation can synergistically contribute to longer patient survival (7, 162, 207). This method harnesses the effect of PD-1 monoclonal antibodies to simultaneously enhance the function of effector and memory T cells in the tumor and increase anti-tumor activity. In T cells with activated mTOR and AMPK, PGC-1α is also activated as a downstream factor, indicating that the activation of PGC-1α may also play an anti-tumor role (162).
Interestingly, Zhang et al. altered the metabolic mode of CD8+ T cells from glycolysis to mitochondrial oxidation through activating peroxisome proliferator-activated receptors α (PPAR- α) and promoting fatty acid oxidation metabolism in low glucose and the hypoxic tumor microenvironment in mice melanoma model (162). It not only delays the depletion of T cells but also maintains its anti-tumor function and promotes the formation of memory CD8+ T cells (208). In addition, OXPHOS induction of TIL can improve the efficacy of PD-1 blockade therapy in mice mode (162, 209). Etomoxir can block ROS produced by the fatty acid oxidation pathway while retaining ROS from other internal sources, thus maintaining ROS physiological levels to activate T cells and reducing apoptosis (210).
In conclusion, increasing glycolytic or OXPHOS brings different advantages for T cells. Increasing glycolysis to promote immune effects is a better choice when glucose or glutamine is abundant in the tumor microenvironment. In the absence of glucose, it is more suitable to increase OXPHOS to maintain the number of immune cells.
Energy metabolism in melanoma is influenced by melanoma gene mutations, oxygen, lactate, and degree of vascularization. The TME in advanced melanoma contains both hypoxic and normoxia regions, which simultaneously elevated both glycolysis and OXPHOS. This heterogenous metabolic pattern not only suppresses immune function but also leading to poor immunotherapy efficacy. Importantly, the main metabolic pattern of melanoma can be predicted by relevant proteins. Clinical data are available on metabolism-related protein levels as biomarkers to determine the metabolic status of tumors, such as LDH, MCT1/4, PGC-1α, etc. Therefore, harnessing metabolic modulators to improve the tumor microenvironment based on the predicted results of metabolic modality will improve the efficacy of immunotherapy.
However, the pathways affecting heterogeneous metabolism in melanoma have been largely understudied, and metabolic heterogeneity in the tumor microenvironment cannot be accurately quantified. Moreover, much uncertainty surrounds screening biomarkers associated with tumor metabolic heterogeneity, such as the location of metastases and individual patient differences. More studies with large sample sizes are warranted in the future to validate metabolism-related biomarkers and explore the mechanisms of biomarker effects on melanoma cells.
XZ and ZT wrote the draft and revised it. FM, HH, LB, ZC, QZ designed the article and helped revise it. All authors contributed to the article and approved the submitted version. XZ and ZT contributed equally to this work.
This article is funded by National Natural ScienceFoundation of China (No.82073385 and No. 82172706) and the Natural Science Foundation of Shanghai(19ZR1456500)
The authors would like to thank Dr. Zhiyu Qian for the drawing ofthe figures and Miss XX Chen for her suggestions on the initial structure of the manuscript.
The authors declare that the research was conducted in the absence of any commercial or financial relationships that could be construed as a potential conflict of interest.
All claims expressed in this article are solely those of the authors and do not necessarily represent those of their affiliated organizations, or those of the publisher, the editors and the reviewers. Any product that may be evaluated in this article, or claim that may be made by its manufacturer, is not guaranteed or endorsed by the publisher.
1. Arnold M, Singh D, Laversanne M, Vignat J, Vaccarella S, Meheus F, et al. Global burden of cutaneous melanoma in 2020 and projections to 2040. JAMA Dermatol (2022) 158(5):495–503. doi: 10.1001/jamadermatol.2022.0160
2. Abbas O, Miller DD, Bhawan J. Cutaneous malignant melanoma: Update on diagnostic and prognostic biomarkers. Am J Dermatopathol (2014) 36(5):363–79. doi: 10.1097/DAD.0b013e31828a2ec5
3. Hanahan D, Weinberg RA. Hallmarks of cancer: The next generation. Cell (2011) 144(5):646–74. doi: 10.1016/j.cell.2011.02.013
4. Warburg O. Iron, the oxygen-carrier of respiration-ferment. Science (1925) 61(1588):575–82. doi: 10.1126/science.61.1588.575
5. Porcelli L, Guida M, De Summa S, Di Fonte R, De Risi I, Garofoli M, et al. Upar(+) extracellular vesicles: A robust biomarker of resistance to checkpoint inhibitor immunotherapy in metastatic melanoma patients. J Immunother Cancer (2021) 9(5):e002372. doi: 10.1136/jitc-2021-002372
6. Laurenzana A, Chilla A, Luciani C, Peppicelli S, Biagioni A, Bianchini F, et al. Upa/Upar system activation drives a glycolytic phenotype in melanoma cells. Int J Cancer (2017) 141(6):1190–200. doi: 10.1002/ijc.30817
7. Beckermann KE, Dudzinski SO, Rathmell JC. Dysfunctional T cell metabolism in the tumor microenvironment. Cytokine Growth Factor Rev (2017) 35:7–14. doi: 10.1016/j.cytogfr.2017.04.003
8. Maitituoheti M, Keung EZ, Tang M, Yan L, Alam H, Han G, et al. Enhancer reprogramming confers dependence on glycolysis and igf signaling in Kmt2d mutant melanoma. Cell Rep (2020) 33(3):108293. doi: 10.1016/j.celrep.2020.108293
9. Vander Heiden MG, Cantley LC, Thompson CB. Understanding the warburg effect: The metabolic requirements of cell proliferation. Science (2009) 324(5930):1029–33. doi: 10.1126/science.1160809
10. Pavlova NN, Thompson CB. The emerging hallmarks of cancer metabolism. Cell Metab (2016) 23(1):27–47. doi: 10.1016/j.cmet.2015.12.006
11. Fischer GM, Jalali A, Kircher DA, Lee WC, McQuade JL, Haydu LE, et al. Molecular profiling reveals unique immune and metabolic features of melanoma brain metastases. Cancer Discovery (2019) 9(5):628–45. doi: 10.1158/2159-8290.CD-18-1489
12. Bonuccelli G, Tsirigos A, Whitaker-Menezes D, Pavlides S, Pestell RG, Chiavarina B, et al. Ketones and lactate "Fuel" tumor growth and metastasis: Evidence that epithelial cancer cells use oxidative mitochondrial metabolism. Cell Cycle (2010) 9(17):3506–14. doi: 10.4161/cc.9.17.12731
13. Migneco G, Whitaker-Menezes D, Chiavarina B, Castello-Cros R, Pavlides S, Pestell RG, et al. Glycolytic cancer associated fibroblasts promote breast cancer tumor growth, without a measurable increase in angiogenesis: Evidence for stromal-epithelial metabolic coupling. Cell Cycle (2010) 9(12):2412–22. doi: 10.4161/cc.9.12.11989
14. Nakajima EC, Van Houten B. Metabolic symbiosis in cancer: Refocusing the warburg lens. Mol Carcinog (2013) 52(5):329–37. doi: 10.1002/mc.21863
15. Warburg O, Gawehn K, Geissler AW. Metabolism of leukocytes. Z Naturforsch B (1958) 13B(8):515–6. Available at: https://www.degruyter.com/document/doi/10.1515/znb-1958-0806/html
16. Kumagai S, Koyama S, Itahashi K, Tanegashima T, Lin YT, Togashi Y, et al. Lactic acid promotes pd-1 expression in regulatory T cells in highly glycolytic tumor microenvironments. Cancer Cell (2022) 40(2):201–18.e9. doi: 10.1016/j.ccell.2022.01.001
17. Spain L, Larkin J, Turajlic S. New survival standards for advanced melanoma. Br J Cancer (2020) 122(9):1275–6. doi: 10.1038/s41416-020-0738-5
18. DeBerardinis RJ, Chandel NS. We need to talk about the warburg effect. Nat Metab (2020) 2(2):127–9. doi: 10.1038/s42255-020-0172-2
19. Alicea GM, Rebecca VW, Goldman AR, Fane ME, Douglass SM, Behera R, et al. Changes in aged fibroblast lipid metabolism induce age-dependent melanoma cell resistance to targeted therapy Via the fatty acid transporter Fatp2. Cancer Discovery (2020) 10(9):1282–95. doi: 10.1158/2159-8290.CD-20-0329
20. Sun N, Tian Y, Chen Y, Guo W, Li C. Metabolic rewiring directs melanoma immunology. Front Immunol (2022) 13:909580. doi: 10.3389/fimmu.2022.909580
21. Hamm M, Sohier P, Petit V, Raymond JH, Delmas V, Le Coz M, et al. Brn2 is a non-canonical melanoma tumor-suppressor. Nat Commun (2021) 12(1):3707. doi: 10.1038/s41467-021-23973-5
22. Levine AJ, Puzio-Kuter AM. The control of the metabolic switch in cancers by oncogenes and tumor suppressor genes. Science (2010) 330(6009):1340–4. doi: 10.1126/science.1193494
23. Silva JM, Bulman C, McMahon M. Brafv600e cooperates with Pi3k signaling, independent of akt, to regulate melanoma cell proliferation. Mol Cancer Res (2014) 12(3):447–63. doi: 10.1158/1541-7786.MCR-13-0224-T
24. Davies H, Bignell GR, Cox C, Stephens P, Edkins S, Clegg S, et al. Mutations of the braf gene in human cancer. Nature (2002) 417(6892):949–54. doi: 10.1038/nature00766
25. Nemejcova K, Dundr P, Jaksa R, Bartu M, Struzinska I, Hojny J, et al. Comprehensive analysis of pten in primary cutaneous melanoma. Folia Biol (Praha) (2020) 66(1):7–16. Available at: http://fb.cuni.cz/file/5916/fb2020a0002.pdf
26. Lee YR, Chen M, Pandolfi PP. The functions and regulation of the pten tumour suppressor: New modes and prospects. Nat Rev Mol Cell Biol (2018) 19(9):547–62. doi: 10.1038/s41580-018-0015-0
27. Torres-Cabala C, Li-Ning-Tapia E, Hwu WJ. Pathology-based biomarkers useful for clinical decisions in melanoma. Arch Med Res (2020) 51(8):827–38. doi: 10.1016/j.arcmed.2020.09.008
28. Hayward NK, Wilmott JS, Waddell N, Johansson PA, Field MA, Nones K, et al. Whole-genome landscapes of major melanoma subtypes. Nature (2017) 545(7653):175–80. doi: 10.1038/nature22071
29. Schadendorf D, Fisher DE, Garbe C, Gershenwald JE, Grob JJ, Halpern A, et al. Melanoma. Nat Rev Dis Primers (2015) 1:15003. doi: 10.1038/nrdp.2015.3
30. Han S, Ren Y, He W, Liu H, Zhi Z, Zhu X, et al. Erk-mediated phosphorylation regulates Sox10 sumoylation and targets expression in mutant braf melanoma. Nat Commun (2018) 9(1):28. doi: 10.1038/s41467-017-02354-x
31. Haq R, Fisher DE. Biology and clinical relevance of the micropthalmia family of transcription factors in human cancer. J Clin Oncol (2011) 29(25):3474–82. doi: 10.1200/JCO.2010.32.6223
32. Ratnikov BI, Scott DA, Osterman AL, Smith JW, Ronai ZA. Metabolic rewiring in melanoma. Oncogene (2017) 36(2):147–57. doi: 10.1038/onc.2016.198
33. Lister JA, Capper A, Zeng Z, Mathers ME, Richardson J, Paranthaman K, et al. A conditional zebrafish mitf mutation reveals mitf levels are critical for melanoma promotion vs. Regression Vivo J Invest Dermatol (2014) 134(1):133–40. doi: 10.1038/jid.2013.293
34. Ngeow KC, Friedrichsen HJ, Li L, Zeng Z, Andrews S, Volpon L, et al. Braf/Mapk and Gsk3 signaling converges to control mitf nuclear export. Proc Natl Acad Sci U.S.A. (2018) 115(37):E8668–E77. doi: 10.1073/pnas.1810498115
35. Wan PT, Garnett MJ, Roe SM, Lee S, Niculescu-Duvaz D, Good VM, et al. Mechanism of activation of the raf-erk signaling pathway by oncogenic mutations of b-raf. Cell (2004) 116(6):855–67. doi: 10.1016/s0092-8674(04)00215-6
36. Cargnello M, Roux PP. Activation and function of the mapks and their substrates, the mapk-activated protein kinases. Microbiol Mol Biol Rev (2011) 75(1):50–83. doi: 10.1128/MMBR.00031-10
37. Houles T, Gravel SP, Lavoie G, Shin S, Savall M, Meant A, et al. Rsk regulates pfk-2 activity to promote metabolic rewiring in melanoma. Cancer Res (2018) 78(9):2191–204. doi: 10.1158/0008-5472.CAN-17-2215
38. Mor I, Cheung EC, Vousden KH. Control of glycolysis through regulation of Pfk1: Old friends and recent additions. Cold Spring Harb Symp Quant Biol (2011) 76:211–6. doi: 10.1101/sqb.2011.76.010868
39. Galan JA, Geraghty KM, Lavoie G, Kanshin E, Tcherkezian J, Calabrese V, et al. Phosphoproteomic analysis identifies the tumor suppressor Pdcd4 as a rsk substrate negatively regulated by 14-3-3. Proc Natl Acad Sci U.S.A. (2014) 111(29):E2918–27. doi: 10.1073/pnas.1405601111
40. Parmenter TJ, Kleinschmidt M, Kinross KM, Bond ST, Li J, Kaadige MR, et al. Response of braf-mutant melanoma to braf inhibition is mediated by a network of transcriptional regulators of glycolysis. Cancer Discovery (2014) 4(4):423–33. doi: 10.1158/2159-8290.CD-13-0440
41. Mills CN, Joshi SS, Niles RM. Expression and function of hypoxia inducible factor-1 alpha in human melanoma under non-hypoxic conditions. Mol Cancer (2009) 8:104. doi: 10.1186/1476-4598-8-104
42. Tsai WB, Aiba I, Long Y, Lin HK, Feun L, Savaraj N, et al. Activation of Ras/Pi3k/Erk pathway induces c-myc stabilization to upregulate argininosuccinate synthetase, leading to arginine deiminase resistance in melanoma cells. Cancer Res (2012) 72(10):2622–33. doi: 10.1158/0008-5472.CAN-11-3605
43. Abildgaard C, Guldberg P. Molecular drivers of cellular metabolic reprogramming in melanoma. Trends Mol Med (2015) 21(3):164–71. doi: 10.1016/j.molmed.2014.12.007
44. Kierans SJ, Taylor CT. Regulation of glycolysis by the hypoxia-inducible factor (Hif): Implications for cellular physiology. J Physiol (2021) 599(1):23–37. doi: 10.1113/JP280572
45. Ruocco MR, Avagliano A, Granato G, Vigliar E, Masone S, Montagnani S, et al. Metabolic flexibility in melanoma: A potential therapeutic target. Semin Cancer Biol (2019) 59:187–207. doi: 10.1016/j.semcancer.2019.07.016
46. Hulse M, Caruso LB, Madzo J, Tan Y, Johnson S, Tempera I. Poly(Adp-ribose) polymerase 1 is necessary for coactivating hypoxia-inducible factor-1-Dependent gene expression by Epstein-Barr virus latent membrane protein 1. PloS Pathog (2018) 14(11):e1007394. doi: 10.1371/journal.ppat.1007394
47. Marti-Diaz R, Montenegro MF, Cabezas-Herrera J, Goding CR, Rodriguez-Lopez JN, Sanchez-Del-Campo L. Acriflavine, a potent inhibitor of hif-1alpha, disturbs glucose metabolism and suppresses Atf4-protective pathways in melanoma under non-hypoxic conditions. Cancers (Basel) (2020) 13(1):102. doi: 10.3390/cancers13010102
48. Eilers M, Eisenman RN. Myc's broad reach. Genes Dev (2008) 22(20):2755–66. doi: 10.1101/gad.1712408
49. Wilde BR, Ayer DE. Interactions between myc and mondoa transcription factors in metabolism and tumourigenesis. Br J Cancer (2015) 113(11):1529–33. doi: 10.1038/bjc.2015.360
50. Hsieh AL, Walton ZE, Altman BJ, Stine ZE, Dang CV. Myc and metabolism on the path to cancer. Semin Cell Dev Biol (2015) 43:11–21. doi: 10.1016/j.semcdb.2015.08.003
51. Granados K, Poelchen J, Novak D, Utikal J. Cellular reprogramming-a model for melanoma cellular plasticity. Int J Mol Sci (2020) 21(21):8274. doi: 10.3390/ijms21218274
52. Allison KE, Coomber BL, Bridle BW. Metabolic reprogramming in the tumour microenvironment: A hallmark shared by cancer cells and T lymphocytes. Immunology (2017) 152(2):175–84. doi: 10.1111/imm.12777
53. Luo S, Li Y, Ma R, Liu J, Xu P, Zhang H, et al. Downregulation of Pck2 remodels tricarboxylic acid cycle in tumor-repopulating cells of melanoma. Oncogene (2017) 36(25):3609–17. doi: 10.1038/onc.2016.520
54. Alquraishi M, Puckett DL, Alani DS, Humidat AS, Frankel VD, Donohoe DR, et al. Pyruvate kinase M2: A simple molecule with complex functions. Free Radic Biol Med (2019) 143:176–92. doi: 10.1016/j.freeradbiomed.2019.08.007
55. Vaupel P, Multhoff G. Revisiting the warburg effect: Historical dogma versus current understanding. J Physiol (2021) 599(6):1745–57. doi: 10.1113/JP278810
56. Maciolek JA, Pasternak JA, Wilson HL. Metabolism of activated T lymphocytes. Curr Opin Immunol (2014) 27:60–74. doi: 10.1016/j.coi.2014.01.006
57. Xu K, Yin N, Peng M, Stamatiades EG, Shyu A, Li P, et al. Glycolysis fuels phosphoinositide 3-kinase signaling to bolster T cell immunity. Science (2021) 371(6527):405–10. doi: 10.1126/science.abb2683
58. Lu J, Tan M, Cai Q. The warburg effect in tumor progression: Mitochondrial oxidative metabolism as an anti-metastasis mechanism. Cancer Lett (2015) 356(2 Pt A):156–64. doi: 10.1016/j.canlet.2014.04.001
59. Board RE, Ellison G, Orr MC, Kemsley KR, McWalter G, Blockley LY, et al. Detection of braf mutations in the tumour and serum of patients enrolled in the Azd6244 (Arry-142886) advanced melanoma phase ii study. Br J Cancer (2009) 101(10):1724–30. doi: 10.1038/sj.bjc.6605371
60. Barbi de Moura M, Vincent G, Fayewicz SL, Bateman NW, Hood BL, Sun M, et al. Mitochondrial respiration–an important therapeutic target in melanoma. PloS One (2012) 7(8):e40690. doi: 10.1371/journal.pone.0040690
61. Ho J, de Moura MB, Lin Y, Vincent G, Thorne S, Duncan LM, et al. Importance of glycolysis and oxidative phosphorylation in advanced melanoma. Mol Cancer (2012) 11:76. doi: 10.1186/1476-4598-11-76
62. Koch A, Ebert EV, Seitz T, Dietrich P, Berneburg M, Bosserhoff A, et al. Characterization of glycolysis-related gene expression in malignant melanoma. Pathol Res Pract (2020) 216(1):152752. doi: 10.1016/j.prp.2019.152752
63. Wise DR, Thompson CB. Glutamine addiction: A new therapeutic target in cancer. Trends Biochem Sci (2010) 35(8):427–33. doi: 10.1016/j.tibs.2010.05.003
64. Dang CV. Links between metabolism and cancer. Genes Dev (2012) 26(9):877–90. doi: 10.1101/gad.189365.112
65. Haq R, Shoag J, Andreu-Perez P, Yokoyama S, Edelman H, Rowe GC, et al. Oncogenic braf regulates oxidative metabolism Via Pgc1alpha and mitf. Cancer Cell (2013) 23(3):302–15. doi: 10.1016/j.ccr.2013.02.003
66. Zeng H, Jorapur A, Shain AH, Lang UE, Torres R, Zhang Y, et al. Bi-allelic loss of Cdkn2a initiates melanoma invasion Via Brn2 activation. Cancer Cell (2018) 34(1):56–68.e9. doi: 10.1016/j.ccell.2018.05.014
67. Christensen C, Bartkova J, Mistrik M, Hall A, Lange MK, Ralfkiaer U, et al. A short acidic motif in arf guards against mitochondrial dysfunction and melanoma susceptibility. Nat Commun (2014) 5:5348. doi: 10.1038/ncomms6348
68. Garraway LA, Widlund HR, Rubin MA, Getz G, Berger AJ, Ramaswamy S, et al. Integrative genomic analyses identify mitf as a lineage survival oncogene amplified in malignant melanoma. Nature (2005) 436(7047):117–22. doi: 10.1038/nature03664
69. Gopal YN, Rizos H, Chen G, Deng W, Frederick DT, Cooper ZA, et al. Inhibition of Mtorc1/2 overcomes resistance to mapk pathway inhibitors mediated by Pgc1alpha and oxidative phosphorylation in melanoma. Cancer Res (2014) 74(23):7037–47. doi: 10.1158/0008-5472.CAN-14-1392
70. McQuade JL, Vashisht Gopal Y. Counteracting oxidative phosphorylation-mediated resistance of melanomas to mapk pathway inhibition. Mol Cell Oncol (2015) 2(3):e991610. doi: 10.4161/23723556.2014.991610
71. Luo C, Lim JH, Lee Y, Granter SR, Thomas A, Vazquez F, et al. A Pgc1alpha-mediated transcriptional axis suppresses melanoma metastasis. Nature (2016) 537(7620):422–6. doi: 10.1038/nature19347
72. Gravel SP. Deciphering the dichotomous effects of pgc-1alpha on tumorigenesis and metastasis. Front Oncol (2018) 8:75. doi: 10.3389/fonc.2018.00075
73. Kumar PR, Moore JA, Bowles KM, Rushworth SA, Moncrieff MD. Mitochondrial oxidative phosphorylation in cutaneous melanoma. Br J Cancer (2021) 124(1):115–23. doi: 10.1038/s41416-020-01159-y
74. Murphy MP. How mitochondria produce reactive oxygen species. Biochem J (2009) 417(1):1–13. doi: 10.1042/BJ20081386
75. Schieber M, Chandel NS. Ros function in redox signaling and oxidative stress. Curr Biol (2014) 24(10):R453–62. doi: 10.1016/j.cub.2014.03.034
76. Vazquez F, Lim JH, Chim H, Bhalla K, Girnun G, Pierce K, et al. Pgc1alpha expression defines a subset of human melanoma tumors with increased mitochondrial capacity and resistance to oxidative stress. Cancer Cell (2013) 23(3):287–301. doi: 10.1016/j.ccr.2012.11.020
77. Salhi A, Jordan AC, Bochaca II, Izsak A, Darvishian F, Houvras Y, et al. Oxidative phosphorylation promotes primary melanoma invasion. Am J Pathol (2020) 190(5):1108–17. doi: 10.1016/j.ajpath.2020.01.012
78. Colombi M, Molle KD, Benjamin D, Rattenbacher-Kiser K, Schaefer C, Betz C, et al. Genome-wide shrna screen reveals increased mitochondrial dependence upon Mtorc2 addiction. Oncogene (2011) 30(13):1551–65. doi: 10.1038/onc.2010.539
79. Weinberg F, Hamanaka R, Wheaton WW, Weinberg S, Joseph J, Lopez M, et al. Mitochondrial metabolism and ros generation are essential for kras-mediated tumorigenicity. Proc Natl Acad Sci U.S.A. (2010) 107(19):8788–93. doi: 10.1073/pnas.1003428107
80. Snyder V, Reed-Newman TC, Arnold L, Thomas SM, Anant S. Cancer stem cell metabolism and potential therapeutic targets. Front Oncol (2018) 8:203. doi: 10.3389/fonc.2018.00203
81. Bogunovic D, O'Neill DW, Belitskaya-Levy I, Vacic V, Yu YL, Adams S, et al. Immune profile and mitotic index of metastatic melanoma lesions enhance clinical staging in predicting patient survival. Proc Natl Acad Sci U.S.A. (2009) 106(48):20429–34. doi: 10.1073/pnas.0905139106
82. Sakaizawa K, Ashida A, Kiniwa Y, Okuyama R. Braf mutation heterogeneity in melanoma lesions. Acta Derm Venereol (2020) 100(1):adv00045. doi: 10.2340/00015555-3394
83. Tong Y, Gao WQ, Liu Y. Metabolic heterogeneity in cancer: An overview and therapeutic implications. Biochim Biophys Acta Rev Cancer (2020) 1874(2):188421. doi: 10.1016/j.bbcan.2020.188421
84. Huang YH, Jankowski A, Cheah KS, Prabhakar S, Jauch R. Soxe transcription factors form selective dimers on non-compact DNA motifs through multifaceted interactions between dimerization and high-mobility group domains. Sci Rep (2015) 5:10398. doi: 10.1038/srep10398
85. Yokoyama S, Takahashi A, Kikuchi R, Nishibu S, Lo JA, Hejna M, et al. Sox10 regulates melanoma immunogenicity through an Irf4-Irf1 axis. Cancer Res (2021) 81(24):6131–41. doi: 10.1158/0008-5472.CAN-21-2078
86. Saxton RA, Sabatini DM. Mtor signaling in growth, metabolism, and disease. Cell (2017) 168(6):960–76. doi: 10.1016/j.cell.2017.02.004
87. Dai W, Xu X, Li S, Ma J, Shi Q, Guo S, et al. Sox4 promotes proliferative signals by regulating glycolysis through akt activation in melanoma cells. J Invest Dermatol (2017) 137(11):2407–16. doi: 10.1016/j.jid.2017.06.026
88. Andreucci E, Pietrobono S, Peppicelli S, Ruzzolini J, Bianchini F, Biagioni A, et al. Sox2 as a novel contributor of oxidative metabolism in melanoma cells. Cell Commun Signal (2018) 16(1):87. doi: 10.1186/s12964-018-0297-z
89. Peppicelli S, Toti A, Giannoni E, Bianchini F, Margheri F, Del Rosso M, et al. Metformin is also effective on lactic acidosis-exposed melanoma cells switched to oxidative phosphorylation. Cell Cycle (2016) 15(14):1908–18. doi: 10.1080/15384101.2016.1191706
90. Huang C, Radi RH, Arbiser JL. Mitochondrial metabolism in melanoma. Cells (2021) 10(11):3197. doi: 10.3390/cells10113197
91. Lee M, Yoon JH. Metabolic interplay between glycolysis and mitochondrial oxidation: The reverse warburg effect and its therapeutic implication. World J Biol Chem (2015) 6(3):148–61. doi: 10.4331/wjbc.v6.i3.148
92. Scott DA, Richardson AD, Filipp FV, Knutzen CA, Chiang GG, Ronai ZA, et al. Comparative metabolic flux profiling of melanoma cell lines: Beyond the warburg effect. J Biol Chem (2011) 286(49):42626–34. doi: 10.1074/jbc.M111.282046
93. Jia D, Park JH, Jung KH, Levine H, Kaipparettu BA. Elucidating the metabolic plasticity of cancer: Mitochondrial reprogramming and hybrid metabolic states. Cells (2018) 7(3):21. doi: 10.3390/cells7030021
94. Indini A, Grossi F, Mandala M, Taverna D, Audrito V. Metabolic interplay between the immune system and melanoma cells: Therapeutic implications. Biomedicines (2021) 9(6):607. doi: 10.3390/biomedicines9060607
95. Parks SK, Cormerais Y, Marchiq I, Pouyssegur J. Hypoxia optimises tumour growth by controlling nutrient import and acidic metabolite export. Mol Aspects Med (2016) 47-48:3–14. doi: 10.1016/j.mam.2015.12.001
96. Chaube B, Malvi P, Singh SV, Mohammad N, Meena AS, Bhat MK. Targeting metabolic flexibility by simultaneously inhibiting respiratory complex I and lactate generation retards melanoma progression. Oncotarget (2015) 6(35):37281–99. doi: 10.18632/oncotarget.6134
97. Wilde L, Roche M, Domingo-Vidal M, Tanson K, Philp N, Curry J, et al. Metabolic coupling and the reverse warburg effect in cancer: Implications for novel biomarker and anticancer agent development. Semin Oncol (2017) 44(3):198–203. doi: 10.1053/j.seminoncol.2017.10.004
98. Tasdogan A, Faubert B, Ramesh V, Ubellacker JM, Shen B, Solmonson A, et al. Metabolic heterogeneity confers differences in melanoma metastatic potential. Nature (2020) 577(7788):115–20. doi: 10.1038/s41586-019-1847-2
99. Hong CS, Graham NA, Gu W, Espindola Camacho C, Mah V, Maresh EL, et al. Mct1 modulates cancer cell pyruvate export and growth of tumors that Co-express Mct1 and Mct4. Cell Rep (2016) 14(7):1590–601. doi: 10.1016/j.celrep.2016.01.057
100. Pinheiro C, Miranda-Goncalves V, Longatto-Filho A, Vicente AL, Berardinelli GN, Scapulatempo-Neto C, et al. The metabolic microenvironment of melanomas: Prognostic value of Mct1 and Mct4. Cell Cycle (2016) 15(11):1462–70. doi: 10.1080/15384101.2016.1175258
101. Sonveaux P, Vegran F, Schroeder T, Wergin MC, Verrax J, Rabbani ZN, et al. Targeting lactate-fueled respiration selectively kills hypoxic tumor cells in mice. J Clin Invest (2008) 118(12):3930–42. doi: 10.1172/JCI36843
102. Caslin HL, Abebayehu D, Pinette JA, Ryan JJ. Lactate is a metabolic mediator that shapes immune cell fate and function. Front Physiol (2021) 12:688485. doi: 10.3389/fphys.2021.688485
103. Gonzalez CD, Alvarez S, Ropolo A, Rosenzvit C, Bagnes MF, Vaccaro MI. Autophagy, warburg, and warburg reverse effects in human cancer. BioMed Res Int (2014) 2014:926729. doi: 10.1155/2014/926729
104. Wen S, Zhu D, Huang P. Targeting cancer cell mitochondria as a therapeutic approach. Future Med Chem (2013) 5(1):53–67. doi: 10.4155/fmc.12.190
105. Bost F, Kaminski L. The metabolic modulator pgc-1alpha in cancer. Am J Cancer Res (2019) 9(2):198–211. Available at: https://www.ncbi.nlm.nih.gov/pmc/articles/PMC6405967/
106. Piskounova E, Agathocleous M, Murphy MM, Hu Z, Huddlestun SE, Zhao Z, et al. Oxidative stress inhibits distant metastasis by human melanoma cells. Nature (2015) 527(7577):186–91. doi: 10.1038/nature15726
107. Gaude E, Frezza C. Tissue-specific and convergent metabolic transformation of cancer correlates with metastatic potential and patient survival. Nat Commun (2016) 7:13041. doi: 10.1038/ncomms13041
108. Reznik E, Miller ML, Senbabaoglu Y, Riaz N, Sarungbam J, Tickoo SK, et al. Mitochondrial DNA copy number variation across human cancers. Elife (2016) 5:e10769. doi: 10.7554/eLife.10769
109. Nakazawa MS, Keith B, Simon MC. Oxygen availability and metabolic adaptations. Nat Rev Cancer (2016) 16(10):663–73. doi: 10.1038/nrc.2016.84
110. Goodwin ML, Gladden LB, Nijsten MW, Jones KB. Lactate and cancer: Revisiting the warburg effect in an era of lactate shuttling. Front Nutr (2014) 1:27. doi: 10.3389/fnut.2014.00027
111. Casey SC, Tong L, Li Y, Do R, Walz S, Fitzgerald KN, et al. Myc regulates the antitumor immune response through Cd47 and pd-L1. Science (2016) 352(6282):227–31. doi: 10.1126/science.aac9935
112. Atefi M, Avramis E, Lassen A, Wong DJ, Robert L, Foulad D, et al. Effects of mapk and Pi3k pathways on pd-L1 expression in melanoma. Clin Cancer Res (2014) 20(13):3446–57. doi: 10.1158/1078-0432.CCR-13-2797
113. Najjar YG, Menk AV, Sander C, Rao U, Karunamurthy A, Bhatia R, et al. Tumor cell oxidative metabolism as a barrier to pd-1 blockade immunotherapy in melanoma. JCI Insight (2019) 4(5):e124989. doi: 10.1172/jci.insight.124989
114. Jiang Z, Liu Z, Li M, Chen C, Wang X. Increased glycolysis correlates with elevated immune activity in tumor immune microenvironment. EBioMedicine (2019) 42:431–42. doi: 10.1016/j.ebiom.2019.03.068
115. Peng M, Yin N, Chhangawala S, Xu K, Leslie CS, Li MO. Aerobic glycolysis promotes T helper 1 cell differentiation through an epigenetic mechanism. Science (2016) 354(6311):481–4. doi: 10.1126/science.aaf6284
116. Keppel MP, Saucier N, Mah AY, Vogel TP, Cooper MA. Activation-specific metabolic requirements for nk cell ifn-gamma production. J Immunol (2015) 194(4):1954–62. doi: 10.4049/jimmunol.1402099
117. Brand A, Singer K, Koehl GE, Kolitzus M, Schoenhammer G, Thiel A, et al. LDHA-associated lactic acid production blunts tumor immunosurveillance by T and NK cells. Cell Metab (2016) 24(5):657–71. doi: 10.1016/j.cmet.2016.08.011
118. de Andrade LF, Lu Y, Luoma A, Ito Y, Pan D, Pyrdol JW, et al. Discovery of specialized nk cell populations infiltrating human melanoma metastases. JCI Insight (2019) 4(23):e133103. doi: 10.1172/jci.insight.133103
119. Xiao Z, Dai Z, Locasale JW. Metabolic landscape of the tumor microenvironment at single cell resolution. Nat Commun (2019) 10(1):3763. doi: 10.1038/s41467-019-11738-0
120. Sheppard S, Santosa EK, Lau CM, Violante S, Giovanelli P, Kim H, et al. Lactate dehydrogenase a-dependent aerobic glycolysis promotes natural killer cell anti-viral and anti-tumor function. Cell Rep (2021) 35(9):109210. doi: 10.1016/j.celrep.2021.109210
121. Romero-Garcia S, Moreno-Altamirano MM, Prado-Garcia H, Sanchez-Garcia FJ. Lactate contribution to the tumor microenvironment: Mechanisms, effects on immune cells and therapeutic relevance. Front Immunol (2016) 7:52. doi: 10.3389/fimmu.2016.00052
122. Colegio OR, Chu NQ, Szabo AL, Chu T, Rhebergen AM, Jairam V, et al. Functional polarization of tumour-associated macrophages by tumour-derived lactic acid. Nature (2014) 513(7519):559–63. doi: 10.1038/nature13490
123. Jeong H, Kim S, Hong BJ, Lee CJ, Kim YE, Bok S, et al. Tumor-associated macrophages enhance tumor hypoxia and aerobic glycolysis. Cancer Res (2019) 79(4):795–806. doi: 10.1158/0008-5472.CAN-18-2545
124. Roberts EW, Broz ML, Binnewies M, Headley MB, Nelson AE, Wolf DM, et al. Critical role for Cd103(+)/Cd141(+) dendritic cells bearing Ccr7 for tumor antigen trafficking and priming of T cell immunity in melanoma. Cancer Cell (2016) 30(2):324–36. doi: 10.1016/j.ccell.2016.06.003
125. Hussein MR. Dendritic cells and melanoma tumorigenesis: An insight. Cancer Biol Ther (2005) 4(5):501–5. doi: 10.4161/cbt.4.5.1780
126. Sukumar M, Liu J, Ji Y, Subramanian M, Crompton JG, Yu Z, et al. Inhibiting glycolytic metabolism enhances Cd8+ T cell memory and antitumor function. J Clin Invest (2013) 123(10):4479–88. doi: 10.1172/JCI69589
127. Klarquist JS, Janssen EM. Melanoma-infiltrating dendritic cells: Limitations and opportunities of mouse models. Oncoimmunology (2012) 1(9):1584–93. doi: 10.4161/onci.22660
128. Tran Janco JM, Lamichhane P, Karyampudi L, Knutson KL. Tumor-infiltrating dendritic cells in cancer pathogenesis. J Immunol (2015) 194(7):2985–91. doi: 10.4049/jimmunol.1403134
129. Park SL, Buzzai A, Rautela J, Hor JL, Hochheiser K, Effern M, et al. Tissue-resident memory Cd8(+) T cells promote melanoma-immune equilibrium in skin. Nature (2019) 565(7739):366–71. doi: 10.1038/s41586-018-0812-9
130. Huang L, Guo Y, Liu S, Wang H, Zhu J, Ou L, et al. Targeting regulatory T cells for immunotherapy in melanoma. Mol BioMed (2021) 2(1):11. doi: 10.1186/s43556-021-00038-z
131. Watson MJ, Vignali PDA, Mullett SJ, Overacre-Delgoffe AE, Peralta RM, Grebinoski S, et al. Metabolic support of tumour-infiltrating regulatory T cells by lactic acid. Nature (2021) 591(7851):645–51. doi: 10.1038/s41586-020-03045-2
132. Li L, Liu X, Sanders KL, Edwards JL, Ye J, Si F, et al. Tlr8-mediated metabolic control of human treg function: A mechanistic target for cancer immunotherapy. Cell Metab (2019) 29(1):103–23.e5. doi: 10.1016/j.cmet.2018.09.020
133. Michalek RD, Gerriets VA, Jacobs SR, Macintyre AN, MacIver NJ, Mason EF, et al. Cutting edge: Distinct glycolytic and lipid oxidative metabolic programs are essential for effector and regulatory Cd4+ T cell subsets. J Immunol (2011) 186(6):3299–303. doi: 10.4049/jimmunol.1003613
134. Macintyre AN, Gerriets VA, Nichols AG, Michalek RD, Rudolph MC, Deoliveira D, et al. The glucose transporter Glut1 is selectively essential for Cd4 T cell activation and effector function. Cell Metab (2014) 20(1):61–72. doi: 10.1016/j.cmet.2014.05.004
135. Palermo B, Franzese O, Donna CD, Panetta M, Quintarelli C, Sperduti I, et al. Antigen-specificity and dtic before peptide-vaccination differently shape immune-checkpoint expression pattern, anti-tumor functionality and tcr repertoire in melanoma patients. Oncoimmunology (2018) 7(12):e1465163. doi: 10.1080/2162402X.2018.1465163
136. Hsu PP, Sabatini DM. Cancer cell metabolism: Warburg and beyond. Cell (2008) 134(5):703–7. doi: 10.1016/j.cell.2008.08.021
137. Chang CH, Qiu J, O'Sullivan D, Buck MD, Noguchi T, Curtis JD, et al. Metabolic competition in the tumor microenvironment is a driver of cancer progression. Cell (2015) 162(6):1229–41. doi: 10.1016/j.cell.2015.08.016
138. Geiger R, Rieckmann JC, Wolf T, Basso C, Feng Y, Fuhrer T, et al. L-arginine modulates T cell metabolism and enhances survival and anti-tumor activity. Cell (2016) 167(3):829–42.e13. doi: 10.1016/j.cell.2016.09.031
139. Siska PJ, Rathmell JC. T Cell metabolic fitness in antitumor immunity. Trends Immunol (2015) 36(4):257–64. doi: 10.1016/j.it.2015.02.007
140. Cha JH, Chan LC, Li CW, Hsu JL, Hung MC. Mechanisms controlling pd-L1 expression in cancer. Mol Cell (2019) 76(3):359–70. doi: 10.1016/j.molcel.2019.09.030
141. Chang CH, Curtis JD, Maggi LB Jr., Faubert B, Villarino AV, O'Sullivan D, et al. Posttranscriptional control of T cell effector function by aerobic glycolysis. Cell (2013) 153(6):1239–51. doi: 10.1016/j.cell.2013.05.016
142. Wherry EJ, Kurachi M. Molecular and cellular insights into T cell exhaustion. Nat Rev Immunol (2015) 15(8):486–99. doi: 10.1038/nri3862
143. Patsoukis N, Brown J, Petkova V, Liu F, Li L, Boussiotis VA. Selective effects of pd-1 on akt and ras pathways regulate molecular components of the cell cycle and inhibit T cell proliferation. Sci Signal (2012) 5(230):ra46. doi: 10.1126/scisignal.2002796
144. Patsoukis N, Bardhan K, Chatterjee P, Sari D, Liu B, Bell LN, et al. Pd-1 alters T-cell metabolic reprogramming by inhibiting glycolysis and promoting lipolysis and fatty acid oxidation. Nat Commun (2015) 6:6692. doi: 10.1038/ncomms7692
145. Francisco LM, Salinas VH, Brown KE, Vanguri VK, Freeman GJ, Kuchroo VK, et al. Pd-L1 regulates the development, maintenance, and function of induced regulatory T cells. J Exp Med (2009) 206(13):3015–29. doi: 10.1084/jem.20090847
146. Icard P, Alifano M, Donnadieu E, Simula L. Fructose-1,6-Bisphosphate promotes Pi3k and glycolysis in T cells? Trends Endocrinol Metab (2021) 32(8):540–3. doi: 10.1016/j.tem.2021.04.013
147. Xu K, Yin N, Peng M, Stamatiades EG, Chhangawala S, Shyu A, et al. Glycolytic atp fuels phosphoinositide 3-kinase signaling to support effector T helper 17 cell responses. Immunity (2021) 54(5):976–87.e7. doi: 10.1016/j.immuni.2021.04.008
148. MacIver NJ, Michalek RD, Rathmell JC. Metabolic regulation of T lymphocytes. Annu Rev Immunol (2013) 31:259–83. doi: 10.1146/annurev-immunol-032712-095956
149. Marcel N, Hedrick SM. A key control point in the T cell response to chronic infection and neoplasia: Foxo1. Curr Opin Immunol (2020) 63:51–60. doi: 10.1016/j.coi.2020.02.001
150. Kamphorst AO, Wieland A, Nasti T, Yang S, Zhang R, Barber DL, et al. Rescue of exhausted Cd8 T cells by pd-1-Targeted therapies is Cd28-dependent. Science (2017) 355(6332):1423–7. doi: 10.1126/science.aaf0683
151. Barbi J, Pardoll D, Pan F. Treg functional stability and its responsiveness to the microenvironment. Immunol Rev (2014) 259(1):115–39. doi: 10.1111/imr.12172
152. Molon B, Cali B, Viola A. T Cells and cancer: How metabolism shapes immunity. Front Immunol (2016) 7:20. doi: 10.3389/fimmu.2016.00020
153. Bengsch B, Johnson AL, Kurachi M, Odorizzi PM, Pauken KE, Attanasio J, et al. Bioenergetic insufficiencies due to metabolic alterations regulated by the inhibitory receptor pd-1 are an early driver of Cd8(+) T cell exhaustion. Immunity (2016) 45(2):358–73. doi: 10.1016/j.immuni.2016.07.008
154. Buck MD, Sowell RT, Kaech SM, Pearce EL. Metabolic instruction of immunity. Cell (2017) 169(4):570–86. doi: 10.1016/j.cell.2017.04.004
155. Gerriets VA, Kishton RJ, Johnson MO, Cohen S, Siska PJ, Nichols AG, et al. Foxp3 and toll-like receptor signaling balance treg cell anabolic metabolism for suppression. Nat Immunol (2016) 17(12):1459–66. doi: 10.1038/ni.3577
156. Huynh A, DuPage M, Priyadharshini B, Sage PT, Quiros J, Borges CM, et al. Control of Pi(3) kinase in treg cells maintains homeostasis and lineage stability. Nat Immunol (2015) 16(2):188–96. doi: 10.1038/ni.3077
157. Angelin A, Gil-de-Gomez L, Dahiya S, Jiao J, Guo L, Levine MH, et al. Foxp3 reprograms T cell metabolism to function in low-glucose, high-lactate environments. Cell Metab (2017) 25(6):1282–93.e7. doi: 10.1016/j.cmet.2016.12.018
158. Ganeshan K, Chawla A. Metabolic regulation of immune responses. Annu Rev Immunol (2014) 32:609–34. doi: 10.1146/annurev-immunol-032713-120236
159. Ogando J, Saez ME, Santos J, Nuevo-Tapioles C, Gut M, Esteve-Codina A, et al. Pd-1 signaling affects cristae morphology and leads to mitochondrial dysfunction in human Cd8(+) T lymphocytes. J Immunother Cancer (2019) 7(1):151. doi: 10.1186/s40425-019-0628-7
160. Zaugg K, Yao Y, Reilly PT, Kannan K, Kiarash R, Mason J, et al. Carnitine palmitoyltransferase 1c promotes cell survival and tumor growth under conditions of metabolic stress. Genes Dev (2011) 25(10):1041–51. doi: 10.1101/gad.1987211
161. van der Windt GJ, Pearce EL. Metabolic switching and fuel choice during T-cell differentiation and memory development. Immunol Rev (2012) 249(1):27–42. doi: 10.1111/j.1600-065X.2012.01150.x
162. Chamoto K, Chowdhury PS, Kumar A, Sonomura K, Matsuda F, Fagarasan S, et al. Mitochondrial activation chemicals synergize with surface receptor pd-1 blockade for T cell-dependent antitumor activity. Proc Natl Acad Sci U.S.A. (2017) 114(5):E761–E70. doi: 10.1073/pnas.1620433114
163. Sena LA, Li S, Jairaman A, Prakriya M, Ezponda T, Hildeman DA, et al. Mitochondria are required for antigen-specific T cell activation through reactive oxygen species signaling. Immunity (2013) 38(2):225–36. doi: 10.1016/j.immuni.2012.10.020
164. Murphy MP, Siegel RM. Mitochondrial ros fire up T cell activation. Immunity (2013) 38(2):201–2. doi: 10.1016/j.immuni.2013.02.005
165. Scharping NE, Menk AV, Moreci RS, Whetstone RD, Dadey RE, Watkins SC, et al. The tumor microenvironment represses T cell mitochondrial biogenesis to drive intratumoral T cell metabolic insufficiency and dysfunction. Immunity (2016) 45(2):374–88. doi: 10.1016/j.immuni.2016.07.009
166. Buck MD, O'Sullivan D, Klein Geltink RI, Curtis JD, Chang CH, Sanin DE, et al. Mitochondrial dynamics controls T cell fate through metabolic programming. Cell (2016) 166(1):63–76. doi: 10.1016/j.cell.2016.05.035
167. van der Windt GJ, Everts B, Chang CH, Curtis JD, Freitas TC, Amiel E, et al. Mitochondrial respiratory capacity is a critical regulator of Cd8+ T cell memory development. Immunity (2012) 36(1):68–78. doi: 10.1016/j.immuni.2011.12.007
168. Wei SC, Duffy CR, Allison JP. Fundamental mechanisms of immune checkpoint blockade therapy. Cancer Discovery (2018) 8(9):1069–86. doi: 10.1158/2159-8290.CD-18-0367
169. Gide TN, Wilmott JS, Scolyer RA, Long GV. Primary and acquired resistance to immune checkpoint inhibitors in metastatic melanoma. Clin Cancer Res (2018) 24(6):1260–70. doi: 10.1158/1078-0432.CCR-17-2267
170. Georgescu SR, Tampa M, Mitran CI, Mitran MI, Caruntu C, Caruntu A, et al. Tumour microenvironment in skin carcinogenesis. Adv Exp Med Biol (2020) 1226:123–42. doi: 10.1007/978-3-030-36214-0_10
171. Pietra G, Manzini C, Rivara S, Vitale M, Cantoni C, Petretto A, et al. Melanoma cells inhibit natural killer cell function by modulating the expression of activating receptors and cytolytic activity. Cancer Res (2012) 72(6):1407–15. doi: 10.1158/0008-5472.CAN-11-2544
172. Mariathasan S, Turley SJ, Nickles D, Castiglioni A, Yuen K, Wang Y, et al. Tgfbeta attenuates tumour response to pd-L1 blockade by contributing to exclusion of T cells. Nature (2018) 554(7693):544–8. doi: 10.1038/nature25501
173. Jayaprakash P, Ai M, Liu A, Budhani P, Bartkowiak T, Sheng J, et al. Targeted hypoxia reduction restores T cell infiltration and sensitizes prostate cancer to immunotherapy. J Clin Invest (2018) 128(11):5137–49. doi: 10.1172/JCI96268
174. D'Aguanno S, Mallone F, Marenco M, Del Bufalo D, Moramarco A. Hypoxia-dependent drivers of melanoma progression. J Exp Clin Cancer Res (2021) 40(1):159. doi: 10.1186/s13046-021-01926-6
175. Tan H, Yang K, Li Y, Shaw TI, Wang Y, Blanco DB, et al. Integrative proteomics and phosphoproteomics profiling reveals dynamic signaling networks and bioenergetics pathways underlying T cell activation. Immunity (2017) 46(3):488–503. doi: 10.1016/j.immuni.2017.02.010
176. Ron-Harel N, Santos D, Ghergurovich JM, Sage PT, Reddy A, Lovitch SB, et al. Mitochondrial biogenesis and proteome remodeling promote one-carbon metabolism for T cell activation. Cell Metab (2016) 24(1):104–17. doi: 10.1016/j.cmet.2016.06.007
177. Blagih J, Coulombe F, Vincent EE, Dupuy F, Galicia-Vazquez G, Yurchenko E, et al. The energy sensor ampk regulates T cell metabolic adaptation and effector responses in vivo. Immunity (2015) 42(1):41–54. doi: 10.1016/j.immuni.2014.12.030
178. Fletcher M, Ramirez ME, Sierra RA, Raber P, Thevenot P, Al-Khami AA, et al. L-arginine depletion blunts antitumor T-cell responses by inducing myeloid-derived suppressor cells. Cancer Res (2015) 75(2):275–83. doi: 10.1158/0008-5472.CAN-14-1491
179. Marzagalli M, Ebelt ND, Manuel ER. Unraveling the crosstalk between melanoma and immune cells in the tumor microenvironment. Semin Cancer Biol (2019) 59:236–50. doi: 10.1016/j.semcancer.2019.08.002
180. Leach DR, Krummel MF, Allison JP. Enhancement of antitumor immunity by ctla-4 blockade. Science (1996) 271(5256):1734–6. doi: 10.1126/science.271.5256.1734
181. Hodi FS, O'Day SJ, McDermott DF, Weber RW, Sosman JA, Haanen JB, et al. Improved survival with ipilimumab in patients with metastatic melanoma. N Engl J Med (2010) 363(8):711–23. doi: 10.1056/NEJMoa1003466
182. Pauken KE, Torchia JA, Chaudhri A, Sharpe AH, Freeman GJ. Emerging concepts in pd-1 checkpoint biology. Semin Immunol (2021) 52:101480. doi: 10.1016/j.smim.2021.101480
183. Daneshmandi S, Wegiel B, Seth P. Blockade of lactate dehydrogenase-a (Ldh-a) improves efficacy of anti-programmed cell death-1 (Pd-1) therapy in melanoma. Cancers (Basel) (2019) 11(4):450. doi: 10.3390/cancers11040450
184. Renner K, Bruss C, Schnell A, Koehl G, Becker HM, Fante M, et al. Restricting glycolysis preserves T cell effector functions and augments checkpoint therapy. Cell Rep (2019) 29(1):135–50.e9. doi: 10.1016/j.celrep.2019.08.068
185. Kim SH, Li M, Trousil S, Zhang Y, Pasca di Magliano M, Swanson KD, et al. Phenformin inhibits myeloid-derived suppressor cells and enhances the anti-tumor activity of pd-1 blockade in melanoma. J Invest Dermatol (2017) 137(8):1740–8. doi: 10.1016/j.jid.2017.03.033
186. Chen M, Liu H, Li Z, Ming AL, Chen H. Mechanism of Pkm2 affecting cancer immunity and metabolism in tumor microenvironment. J Cancer (2021) 12(12):3566–74. doi: 10.7150/jca.54430
187. Simpson TR, Li F, Montalvo-Ortiz W, Sepulveda MA, Bergerhoff K, Arce F, et al. Fc-dependent depletion of tumor-infiltrating regulatory T cells Co-defines the efficacy of anti-Ctla-4 therapy against melanoma. J Exp Med (2013) 210(9):1695–710. doi: 10.1084/jem.20130579
188. Marchesi F, Vignali D, Manini B, Rigamonti A, Monti P. Manipulation of glucose availability to boost cancer immunotherapies. Cancers (Basel) (2020) 12(10):2940. doi: 10.3390/cancers12102940
189. Li L, Wang Y, Wang Q, Qu J, Wei X, Xu J, et al. High developmental pluripotencyassociated 4 expression promotes cell proliferation and glycolysis, and predicts poor prognosis in nonsmallcell lung cancer. Mol Med Rep (2019) 20(1):445–54. doi: 10.3892/mmr.2019.10272
190. Zhou Y, Huang Z, Su J, Li J, Zhao S, Wu L, et al. Benserazide is a novel inhibitor targeting Pkm2 for melanoma treatment. Int J Cancer (2020) 147(1):139–51. doi: 10.1002/ijc.32756
191. Shankar Babu M, Mahanta S, Lakhter AJ, Hato T, Paul S, Naidu SR. Lapachol inhibits glycolysis in cancer cells by targeting pyruvate kinase M2. PloS One (2018) 13(2):e0191419. doi: 10.1371/journal.pone.0191419
192. Boudreau A, Purkey HE, Hitz A, Robarge K, Peterson D, Labadie S, et al. Metabolic plasticity underpins innate and acquired resistance to ldha inhibition. Nat Chem Biol (2016) 12(10):779–86. doi: 10.1038/nchembio.2143
193. Luengo A, Gui DY, Vander Heiden MG. Targeting metabolism for cancer therapy. Cell Chem Biol (2017) 24(9):1161–80. doi: 10.1016/j.chembiol.2017.08.028
194. Yeung C, Gibson AE, Issaq SH, Oshima N, Baumgart JT, Edessa LD, et al. Targeting glycolysis through inhibition of lactate dehydrogenase impairs tumor growth in preclinical models of Ewing sarcoma. Cancer Res (2019) 79(19):5060–73. doi: 10.1158/0008-5472.CAN-19-0217
195. Spugnini EP, Sonveaux P, Stock C, Perez-Sayans M, De Milito A, Avnet S, et al. Proton channels and exchangers in cancer. Biochim Biophys Acta (2015) 1848(10 Pt B):2715–26. doi: 10.1016/j.bbamem.2014.10.015
196. Baek G, Tse YF, Hu Z, Cox D, Buboltz N, McCue P, et al. Mct4 defines a glycolytic subtype of pancreatic cancer with poor prognosis and unique metabolic dependencies. Cell Rep (2014) 9(6):2233–49. doi: 10.1016/j.celrep.2014.11.025
197. Doherty JR, Yang C, Scott KE, Cameron MD, Fallahi M, Li W, et al. Blocking lactate export by inhibiting the myc target Mct1 disables glycolysis and glutathione synthesis. Cancer Res (2014) 74(3):908–20. doi: 10.1158/0008-5472.CAN-13-2034
198. Renner K, Geiselhoringer AL, Fante M, Bruss C, Farber S, Schonhammer G, et al. Metabolic plasticity of human T cells: Preserved cytokine production under glucose deprivation or mitochondrial restriction, but 2-Deoxy-Glucose affects effector functions. Eur J Immunol (2015) 45(9):2504–16. doi: 10.1002/eji.201545473
199. Scharping NE, Menk AV, Whetstone RD, Zeng X, Delgoffe GM. Efficacy of pd-1 blockade is potentiated by metformin-induced reduction of tumor hypoxia. Cancer Immunol Res (2017) 5(1):9–16. doi: 10.1158/2326-6066.CIR-16-0103
200. Eikawa S, Nishida M, Mizukami S, Yamazaki C, Nakayama E, Udono H. Immune-mediated antitumor effect by type 2 diabetes drug, metformin. Proc Natl Acad Sci U.S.A. (2015) 112(6):1809–14. doi: 10.1073/pnas.1417636112
201. Afzal MZ, Mercado RR, Shirai K. Efficacy of metformin in combination with immune checkpoint inhibitors (Anti-Pd-1/Anti-Ctla-4) in metastatic malignant melanoma. J Immunother Cancer (2018) 6(1):64. doi: 10.1186/s40425-018-0375-1
202. Sun L, Wang X, Saredy J, Yuan Z, Yang X, Wang H. Innate-adaptive immunity interplay and redox regulation in immune response. Redox Biol (2020) 37:101759. doi: 10.1016/j.redox.2020.101759
203. Madden MZ, Rathmell JC. The complex integration of T-cell metabolism and immunotherapy. Cancer Discovery (2021) 11(7):1636–43. doi: 10.1158/2159-8290.CD-20-0569
204. Johnson MO, Wolf MM, Madden MZ, Andrejeva G, Sugiura A, Contreras DC, et al. Distinct regulation of Th17 and Th1 cell differentiation by glutaminase-dependent metabolism. Cell (2018) 175(7):1780–95.e19. doi: 10.1016/j.cell.2018.10.001
205. Almeida L, Lochner M, Berod L, Sparwasser T. Metabolic pathways in T cell activation and lineage differentiation. Semin Immunol (2016) 28(5):514–24. doi: 10.1016/j.smim.2016.10.009
206. Ma C, Kesarwala AH, Eggert T, Medina-Echeverz J, Kleiner DE, Jin P, et al. Nafld causes selective Cd4(+) T lymphocyte loss and promotes hepatocarcinogenesis. Nature (2016) 531(7593):253–7. doi: 10.1038/nature16969
207. Fisicaro P, Barili V, Montanini B, Acerbi G, Ferracin M, Guerrieri F, et al. Targeting mitochondrial dysfunction can restore antiviral activity of exhausted hbv-specific Cd8 T cells in chronic hepatitis b. Nat Med (2017) 23(3):327–36. doi: 10.1038/nm.4275
208. Scharping NE, Rivadeneira DB, Menk AV, Vignali PDA, Ford BR, Rittenhouse NL, et al. Mitochondrial stress induced by continuous stimulation under hypoxia rapidly drives T cell exhaustion. Nat Immunol (2021) 22(2):205–15. doi: 10.1038/s41590-020-00834-9
209. Zhang Y, Kurupati R, Liu L, Zhou XY, Zhang G, Hudaihed A, et al. Enhancing Cd8(+) T cell fatty acid catabolism within a metabolically challenging tumor microenvironment increases the efficacy of melanoma immunotherapy. Cancer Cell (2017) 32(3):377–91.e9. doi: 10.1016/j.ccell.2017.08.004
Keywords: melanoma, immunotherapy, metabolism heterogeneity, tumor microenvironment, combination therapy
Citation: Zhang X, Tai Z, Miao F, Huang H, Zhu Q, Bao L and Chen Z (2022) Metabolism heterogeneity in melanoma fuels deactivation of immunotherapy: Predict before protect. Front. Oncol. 12:1046102. doi: 10.3389/fonc.2022.1046102
Received: 16 September 2022; Accepted: 12 December 2022;
Published: 22 December 2022.
Edited by:
Suzie Chen, Rutgers, The State University of New Jersey, United StatesReviewed by:
Zehua Wang, First Affiliated Hospital of Zhengzhou University, ChinaCopyright © 2022 Zhang, Tai, Miao, Huang, Zhu, Bao and Chen. This is an open-access article distributed under the terms of the Creative Commons Attribution License (CC BY). The use, distribution or reproduction in other forums is permitted, provided the original author(s) and the copyright owner(s) are credited and that the original publication in this journal is cited, in accordance with accepted academic practice. No use, distribution or reproduction is permitted which does not comply with these terms.
*Correspondence: Zhongjian Chen, YWFqaWFuODE4QDE2My5jb20=; Leilei Bao, YW5uYWJhbzIxMkAxMjYuY29tcw==
†These authors have contributed equally to this work
Disclaimer: All claims expressed in this article are solely those of the authors and do not necessarily represent those of their affiliated organizations, or those of the publisher, the editors and the reviewers. Any product that may be evaluated in this article or claim that may be made by its manufacturer is not guaranteed or endorsed by the publisher.
Research integrity at Frontiers
Learn more about the work of our research integrity team to safeguard the quality of each article we publish.