 Soudeh Ghafouri-Fard1
 Arash Safarzadeh1
 Bashdar Mahmud Hussen2,3
 Mehdi Akhavan-Bahabadi4
 Mohammad Taheri5,6*
 Guive Sharifi7*
- 1Department of Medical Genetics, School of Medicine, Shahid Beheshti University of Medical Sciences, Tehran, Iran
- 2Department of Pharmacognosy, College of Pharmacy, Hawler Medical University, Erbil, Iraq
- 3Center of Research and Strategic Studies, Lebanese French University, Erbil, Iraq
- 4Electronic Engineering, University of Tehran, Tehran, Iran
- 5Men’s Health and Reproductive Health Research Center, Shahid Beheshti University of Medical Sciences, Tehran, Iran
- 6Institute of Human Genetics, Jena University Hospital, Jena, Germany
- 7Skull Base Research Center, Loghman Hakim Hospital, Shahid Beheshti University of Medical Sciences, Tehran, Iran
Glioblastoma multiforme (GBM) is the most frequent malignant type of primary brain cancers and is a malignancy with poor prognosis. Thus, it is necessary to find novel therapeutic modalities based on molecular events occur at different stages of tumor progression. We used expression profiles of GBM tissues that contained long non-coding RNA (lncRNA), microRNA (miRNA) and mRNA signatures to make putative ceRNA networks. Our strategy led to identification of 1080 DEmRNAs, including 777 downregulated DEmRNAs (such as GJB6 and SLC12A5) and 303 upregulated DEmRNAs (such as TOP2A and RRM2), 19 DElncRNAs, including 16 downregulated DElncRNAs (such as MIR7-3HG and MIR124-2HG) and 3 upregulated DElncRNAs (such as CRNDE and XIST) and 49 DEmiRNAs, including 10 downregulated DEmiRNAs (such as hsa-miR-10b-5p and hsa-miR-1290) and 39 upregulated DEmiRNAs (such as hsa-miR-219a-2-3p and hsa-miR-338-5p). We also identified DGCR5, MIAT, hsa-miR-129-5p, XIST, hsa-miR-128-3p, PART1, hsa-miR-10b-5p, LY86-AS1, CRNDE, and DLX6-AS1 as 10 hub genes in the ceRNA network. The current study provides novel insight into molecular events during GBM pathogenesis. The identified molecules can be used as therapeutic targets for GBM.
Introduction
Glioblastoma multiforme (GBM) is the most frequent malignant type of primary brain cancers (1). This type of cancer is classified into primary and secondary subtypes based on the presence of mutations in isocitrate dehydrogenase (IDH) genes (2). Moreover, the mutation status of IDH1 and IDH2 genes is considered as an important factor in defining prognosis of GBM (2). GBM is a highly invasive tumor with high tendency to diffuse all over the brain parenchyma. In addition, high level of vascularity of GBM makes it exceedingly recidivist, leading to a short survival time even after surgical resection and chemoradiotherapy (2). From an immunological point of view, GBM is regarded as a cold tumor with an extremely immunosuppressive tumor microenvironment that acts in favor of tumor progression, recurrence and poor prognosis (2). Therefore, it is necessary to find novel therapeutic modalities based on molecular events occur at different stages of tumor progression.
Recent studies have used expression data of differentially expressed RNAs in GBM to construct competitive endogenous RNA (ceRNA) networks with the potential to be used as prognostic factors (3–6). In one of the recent studies, one lncRNA with differential expression related to survival, IL10RB-AS1, was discovered using a combination of bioinformatic techniques. This may have predictive utility and present novel therapy options for GBM, along with a number of associated signaling pathways and ceRNA systems that were discovered in GBM (7). This strategy can also been used to identify subtype-specific modules with distinctive biological functions that influence patients’ prognosis in different GBM subtypes (8). Therefore, it is very important to look into probable genetic causes of GBM. One of the most urgent difficulties in cancer therapy is the creation of alternate and acceptable biomarkers to accurately identify and treat GBM (9).
In the current study, we used expression profiles of GBM tissues that contained long non-coding RNA (lncRNA), microRNA (miRNA) and mRNA signatures to make putative ceRNA networks. Then, we find the molecular pathways which are associated with these ceRNA networks.
Methods
Microarray data collection
Expression profiles of GSE50161 ([HG-U133_Plus_2] Affymetrix Human Genome U133 Plus 2.0 Array), GSE36245 ([HG-U133_Plus_2] Affymetrix Human Genome U133 Plus 2.0 Array), GSE83300 (Agilent-014850 Whole Human Genome Microarray 4x44K G4112F (Probe Name version)) and GSE65626 ([miRNA-4] Affymetrix Multispecies miRNA-4 Array), which included 130, 46, 50 and 6 samples, respectively, were acquired using the Gene Expression Omnibus (GEO; http://www.ncbi.nlm.nih.gov/geo/). We selected 34 GBM and 13 normal tissue samples from GSE50161, 46 GBM samples from GSE36245, 50 GBM samples from GSE83300 and 3 GBM and 3 normal samples from GSE65626 for further analysis (Table 1). The expression data contained lncRNAs, miRNAs and mRNAs expression signatures.
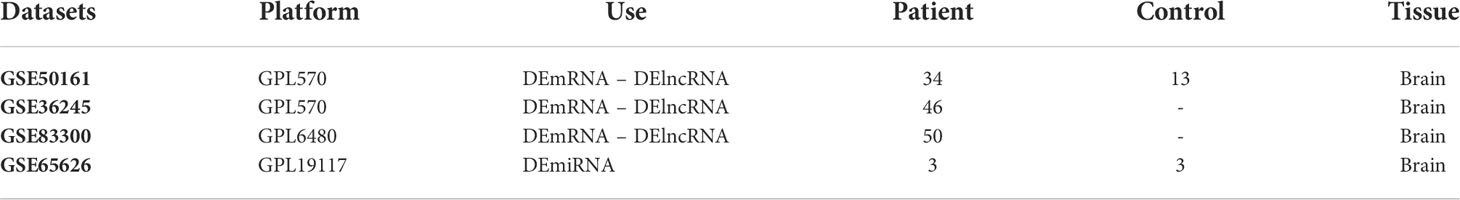
Table 1 Information of datasets.
Microarray data processing, integrative meta-analysis and assessment of data quality
The described datasets contain different and trendy platforms (Agilent and Affymetrix), and normalization is a critical step in the integration of heterogeneous data. All microarray data was processed and integrated using the statistical programming language R. For pre-processing, data from Affymetrix and Agilent was first normalized separately using the normalizeQuantiles function in the preprocessCore package (https://bioconductor.org/packages/release/bioc/html/preprocessCore.html). The program R was used to combine data from both platforms. In order to exclude batch effects (non-biological differences), the ComBat function from the R Package Surrogate Variable Analysis (SVA) was used (10). By using PCA and a boxplot, batch effect removal was evaluated. The result of the meta-analysis is a unit expression matrix (the combination of three datasets of this study).
Analysis of differentially expressed lncRNAs, miRNAs and mRNAs
We used the Limma package in R language (11) to screen differentially expressed mRNAs (DEmRNAs), lncRNAs (DElncRNAs), and miRNAs (DEmiRNAs) between GBM and normal samples. GSE50161, GSE36245 and GSE83300 were used to obtain DEmRNAs and DElncRNAs. GSE65626 was utilized to acquire DEmiRNAs. DEmRNAs and DElncRNAs were evaluated with the cut-off criteria of false discovery rate (FDR; adjusted p value) < 0.05 and |log2 fold Change (FC)| > 2 while the cut-off criteria of false discovery rate (FDR; adjusted p value) < 0.05 and |log2 fold Change (FC)| > 3.5 was considered for DEmiRNAs. Then, we identified DElncRNAs using HGNC (HUGO gene nomenclature) database.
Two-way clustering of DEGs
We determined gene expression levels of significant DEmRNAs, DElncRNAs, and DEmiRNAs. We used this data in the pheatmap package in R language (12) to perform two-way clustering based on the Euclidean distance.
Gene ontology enrichment analysis
We used the clusterProfiler R package (13) to perform gene ontology (GO) enrichment analysis to investigate the functions of the remarkably upregulated and downregulated DEGs that we discovered. The functional category criteria were established at an adjusted p-value of 0.05 or below.
Kyoto encyclopedia of genes and genomes pathway analysis
KEGG pathway analysis of considerably DEGs was carried out to discover the possible functions of these genes that participated in the pathways based on the KEGG database (14).
PPI network construction and hub genes identification
The STRING database (15) was utilized to create the PPI network for DEGs. Highest level of confidence was used to establish the interactions parameter (confidence score >0.9). The Cytoscape software v3.9 (16) was used to visualize the interactions between the proteins. The top 20 DEGs related to hub genes were ultimately found using the Cytohubba plugin (17) of Cytoscape using the betweenness approach.
Constructing the ceRNA network and hub genes identification
We built a ceRNA network through the following steps: 1) assessing the interactions between lncRNAs and miRNAs based on the GBM-related miRNAs using miRcode (http://www.mircode.org/); 2) Application of miRDB (http://www.mirdb.org/) (18), miRTarBase (https://mirtarbase.cuhk.edu.cn/) (19), TargetScan (http://www.targetscan.org/) (20) and miRWalk (http://129.206.7.150/) (21) for prediction of miRNAs-targeted mRNAs; 3) Finding the intersections of the differentially expressed lncRNAs and mRNAs, and establishment of lncRNA/mRNA/miRNA ceRNA network using Cytoscape v3.9 and 4) predicting hub genes using cytohubba plugin based on degree method.
Validation of hub genes via expression values
The expression value of hub genes was assessed using the ualcan database (22). The hub genes in the TCGA-GBM RNA-seq data were examined, and those were present in the PPI and ceRNA networks as well as in the TCGA-GBM were chosen for gene expression validation.
Expression of the hub genes in various GBM cell lines
We selected GBM and normal brain cell lines using cancer cell line encyclopedia (CCLE) (https://sites.broadinstitute.org/ccle/) and DepMap portal gene expression datasets (https://depmap.org/portal/). In order to determine how the hub genes are expressed, we finally employed the limma package of the R programming language to analyze this data.
Survival analysis
We used survival package (https://CRAN.R-project.org/package=survival) in R to define survival curves, which were grouped by the prognostic value of hub genes with highest degree in ceRNA network. The clinical data for patients with GBM derived from TCGA (PRAD-TCGA). Univariate survival analysis was evaluated using Kaplan-Meier curves. Statistics were considered significant for P-values under 0.05.
Results
Microarray data processing, integrative meta-analysis and assessment of data quality
Figure 1 shows the boxplot of raw data and normalized data after batch effect removal. These boxplots indicate that the quality of the expression data was reliable, and the boxplot of the preprocessed data presented the good normalization. In the PCA plot (Figure 2), 143 samples are shown in the 2D plane spanned by their first two principal components (PC1 and PC2). According to this plot, the samples had a good variation after batch effect removal.
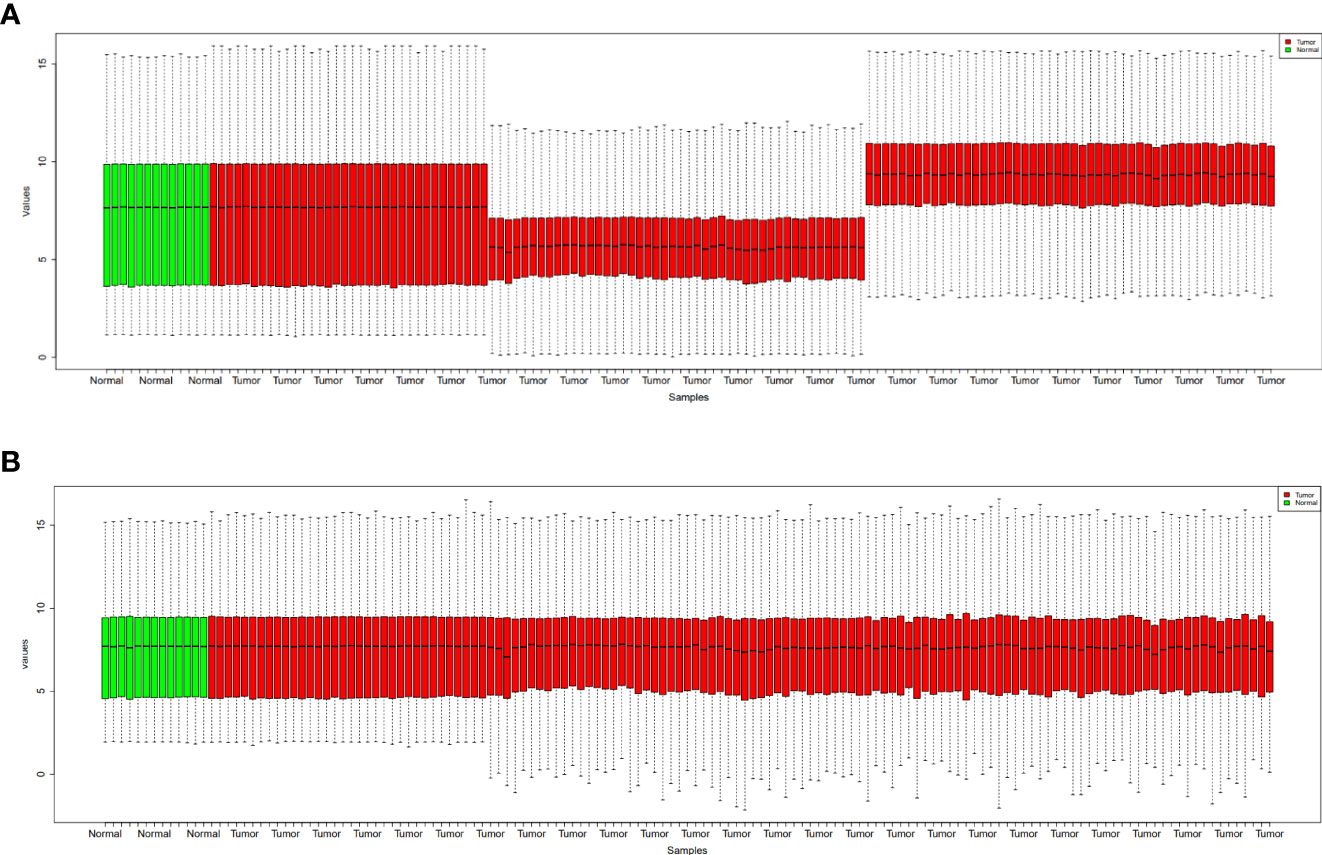
Figure 1 Boxplots for the raw data (A) and normalized data after batch effect removal (B). GBM samples are indicated by red boxes, whereas healthy samples are shown by green boxes.
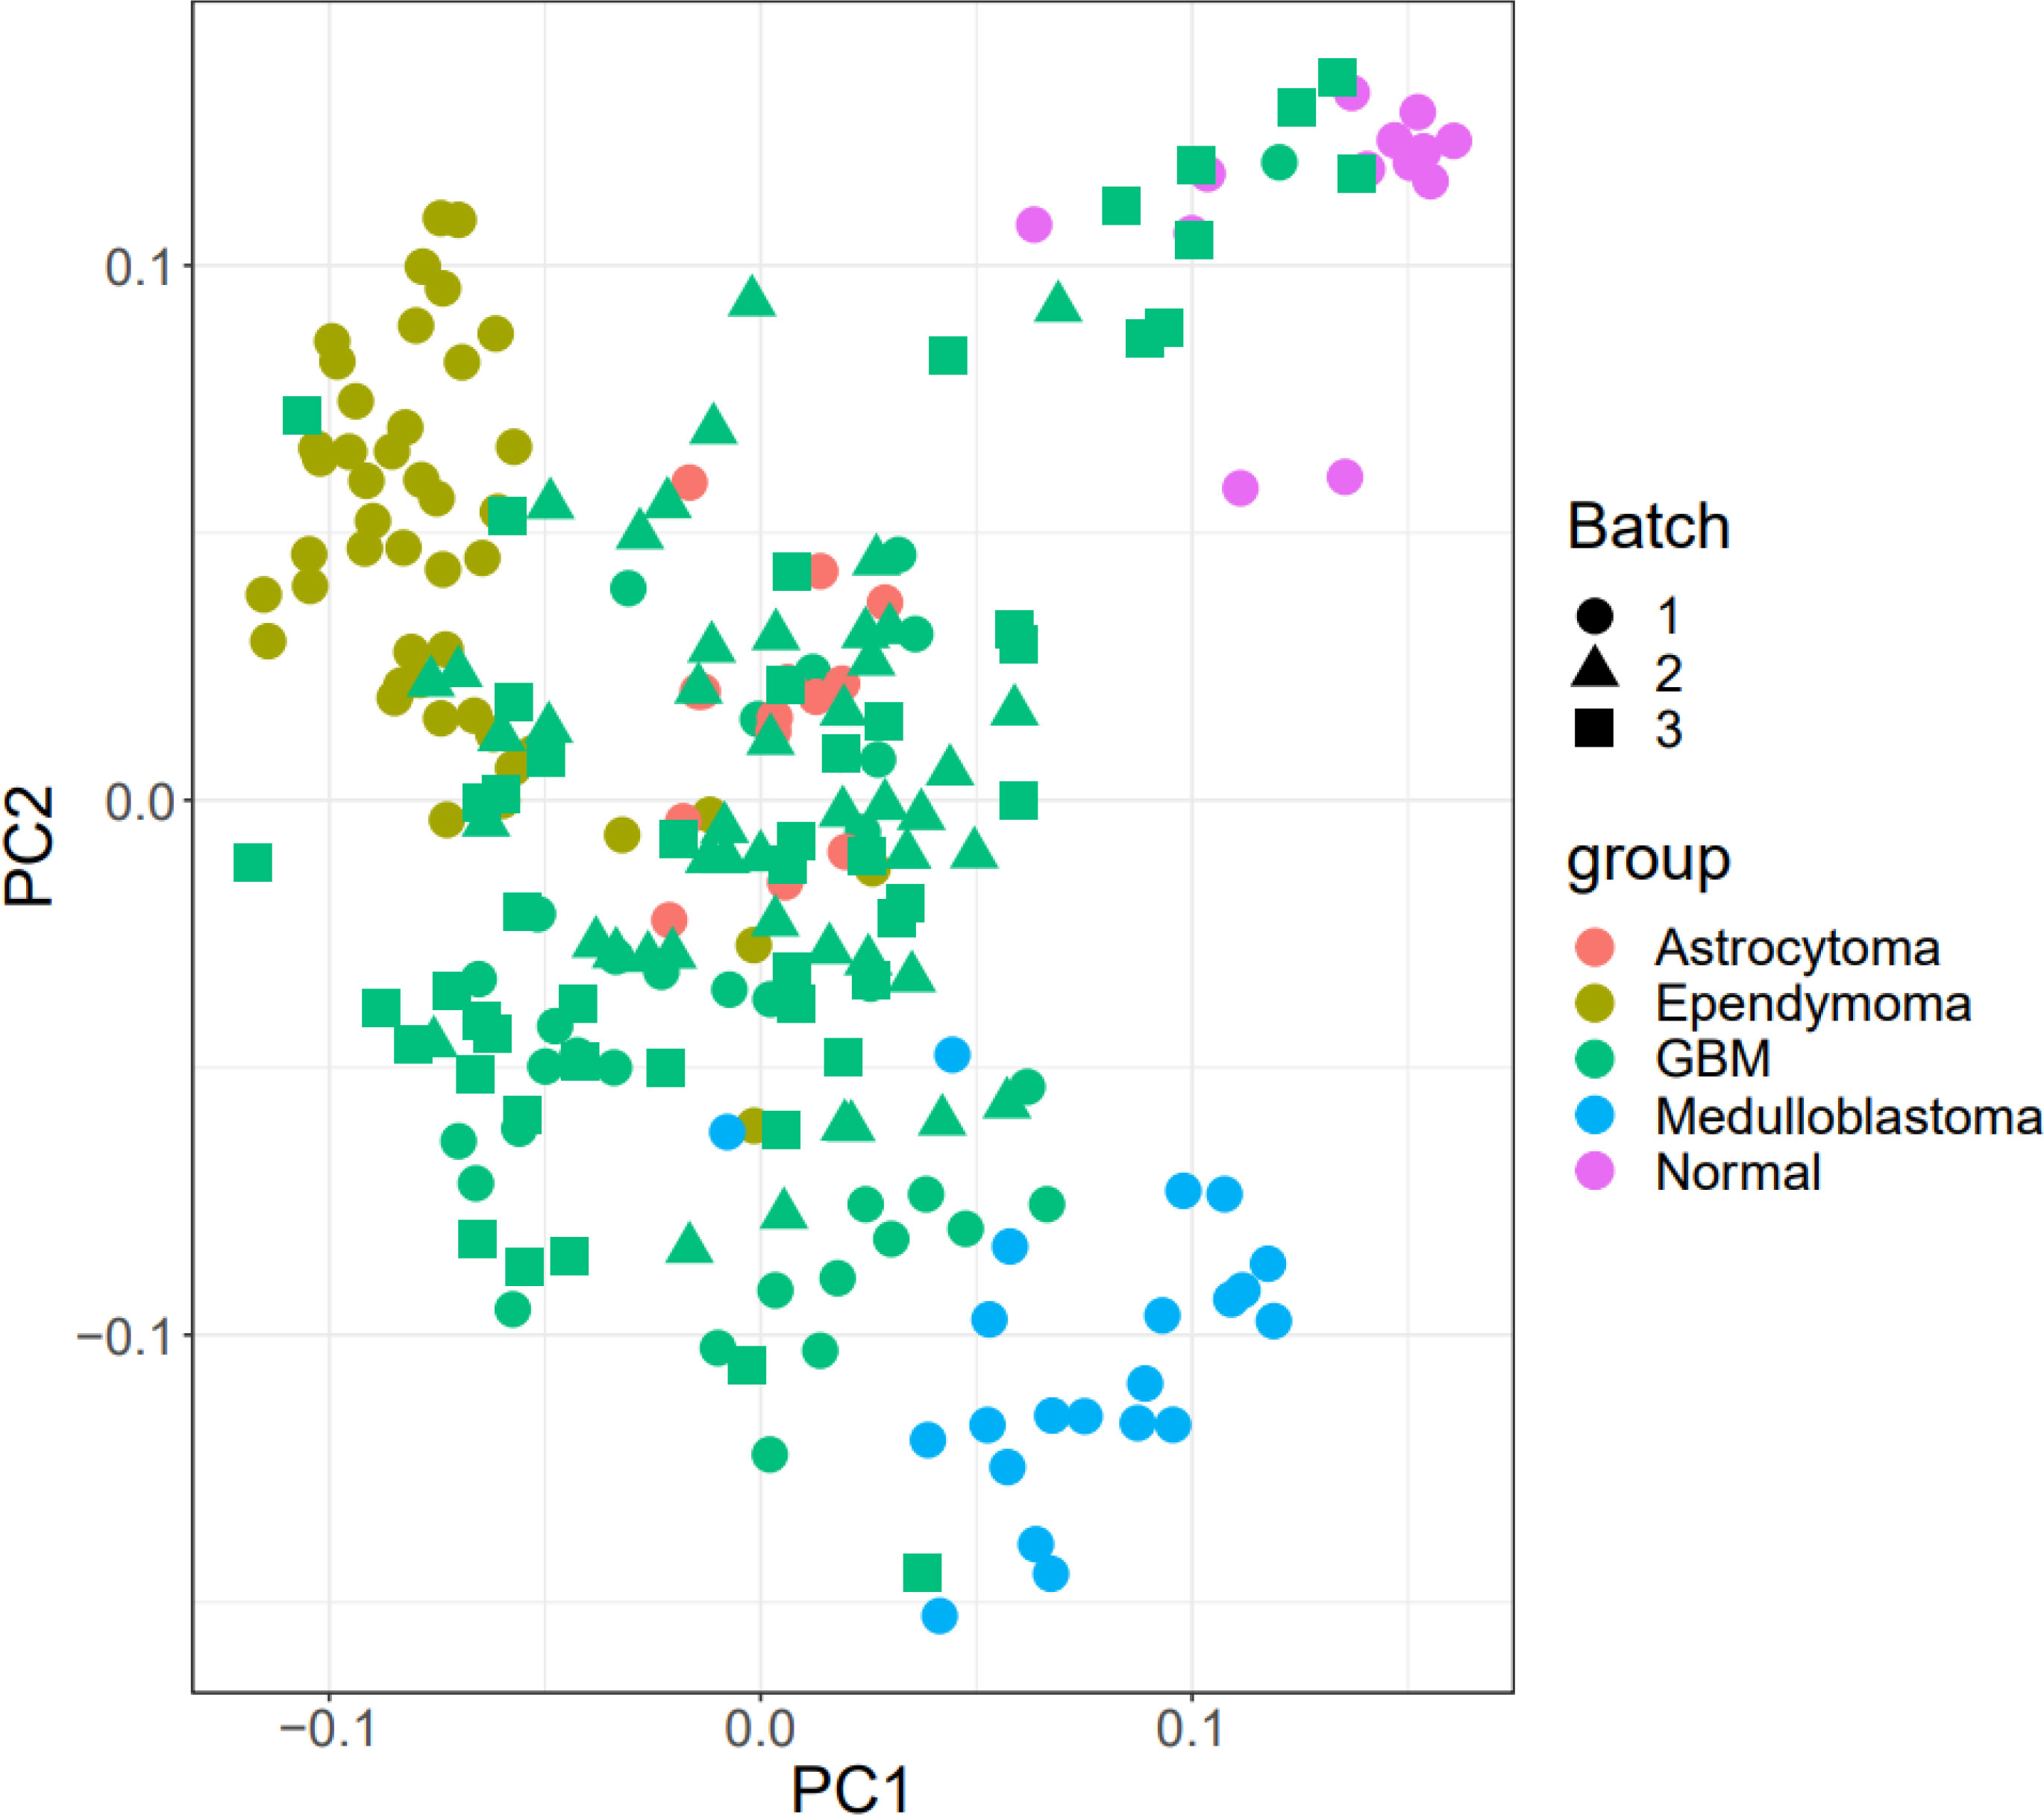
Figure 2 PCA plot. The Batch implies that the data includes three platforms. Also, healthy benign and tumor samples were divided into three groups.
DEGs analysis
Based on the microarray data analysis between GBM and normal samples using Limma package, we obtained 1080 DEmRNAs, including 777 downregulated DEmRNAs (such as GJB6 and SLC12A5) and 303 upregulated DEmRNAs (such as TOP2A and RRM2), 19 DElncRNAs, including 16 downregulated DElncRNAs (such as MIR7-3HG and MIR124-2HG) and 3 upregulated DElncRNAs (such as CRNDE and XIST) and 49 DEmiRNAs, including 10 downregulated DEmiRNAs (such as hsa-miR-10b-5p and hsa-miR-1290) and 39 upregulated DEmiRNAs (such as hsa-miR-219a-2-3p and hsa-miR-338-5p). The most significantly upregulated and downregulated DEmRNAs, DElncRNAs, and DEmiRNAs are shown in Tables 2–4, respectively.
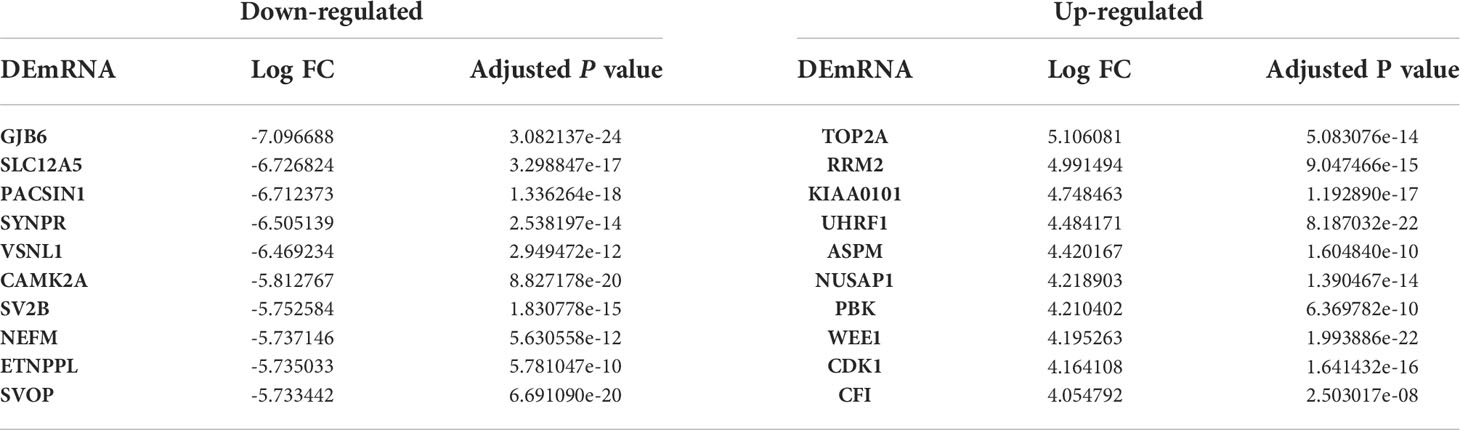
Table 2 The top 10 up- and down-regulated DEmRNAs between GBM and normal samples.
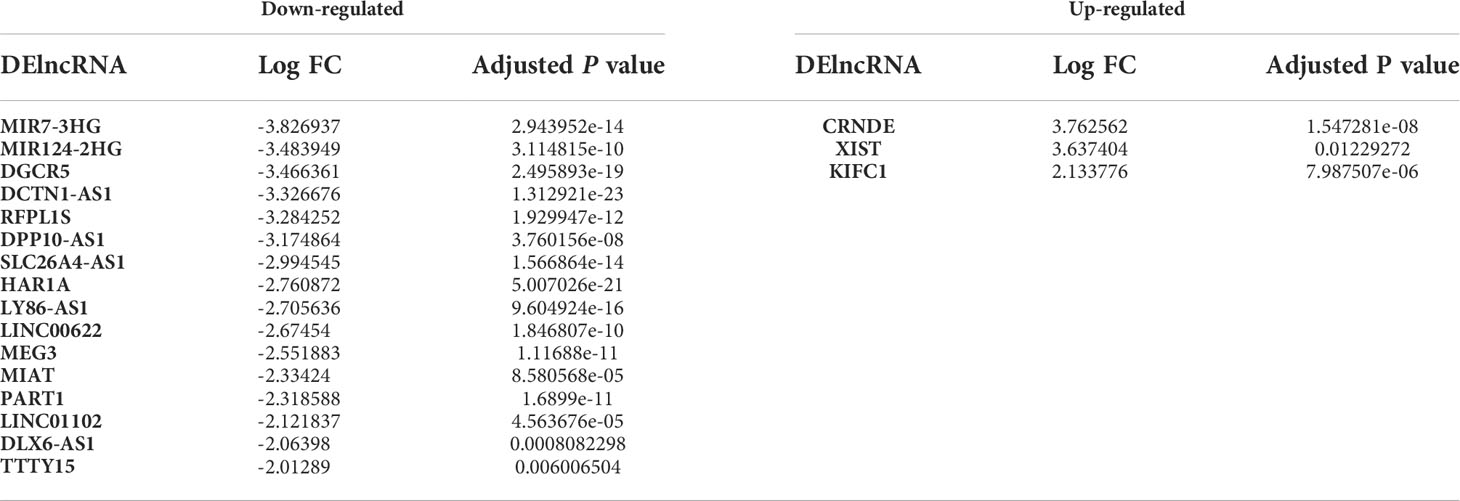
Table 3 The up- and down-regulated DElncRNAs between GBM and normal samples.
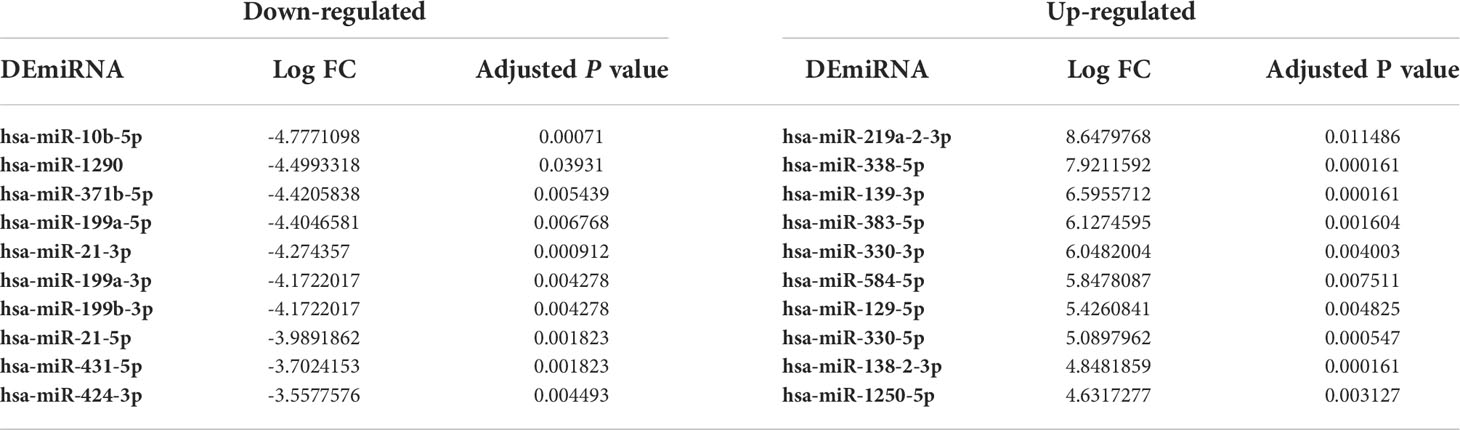
Table 4 The top 10 up- and down-regulated DEmiRNAs between GBM and normal samples.
We used the volcano plot with the Enhanced Volcano package (23) in R to compare the variation in miRNA, lncRNA, and mRNA expression between GBM and normal samples (Figure 3). In addition, the two-way clustering demonstrated that 20 clearly distinct DEmRNA expression patterns between GBM and normal samples were identifiable (Figure 4A). The expression of DElncRNAs and DEmiRNAs is also shown in two heatmaps (Figure 4B).
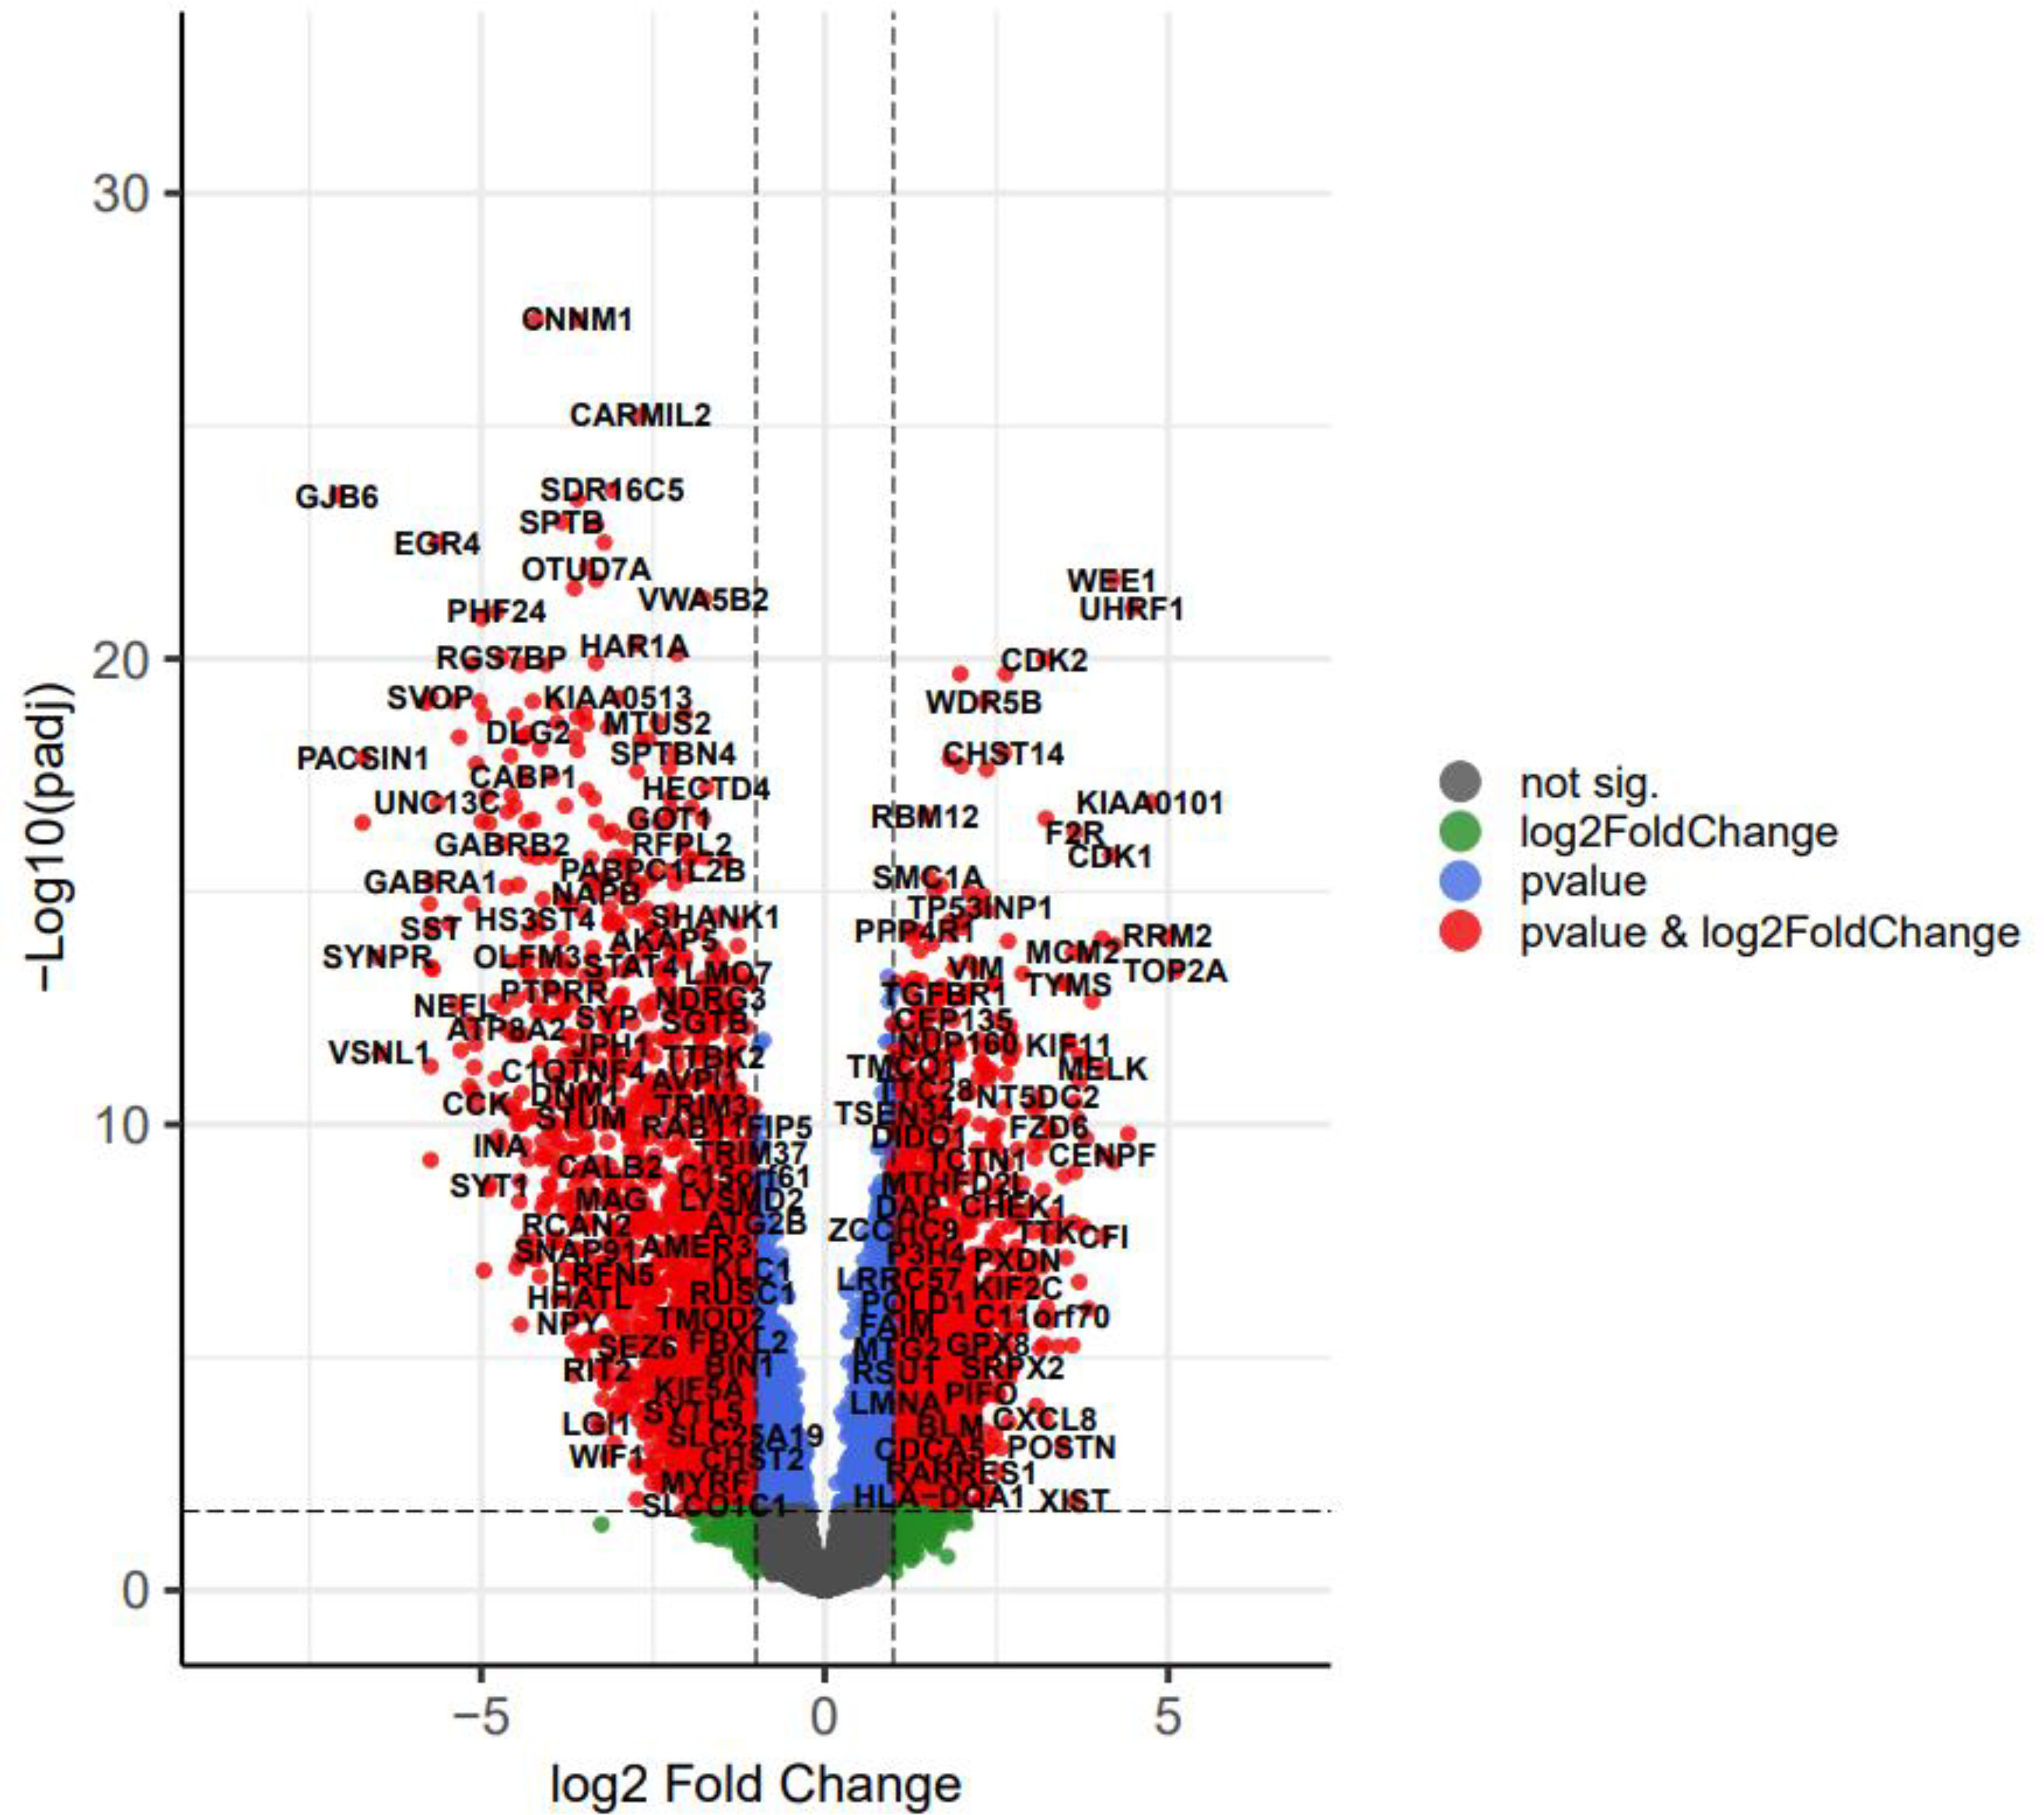
Figure 3 The volcano plot of differentially expressed genes (DEGs); horizontal axis, log2(FC); vertical axis, -log10(adjusted P value).
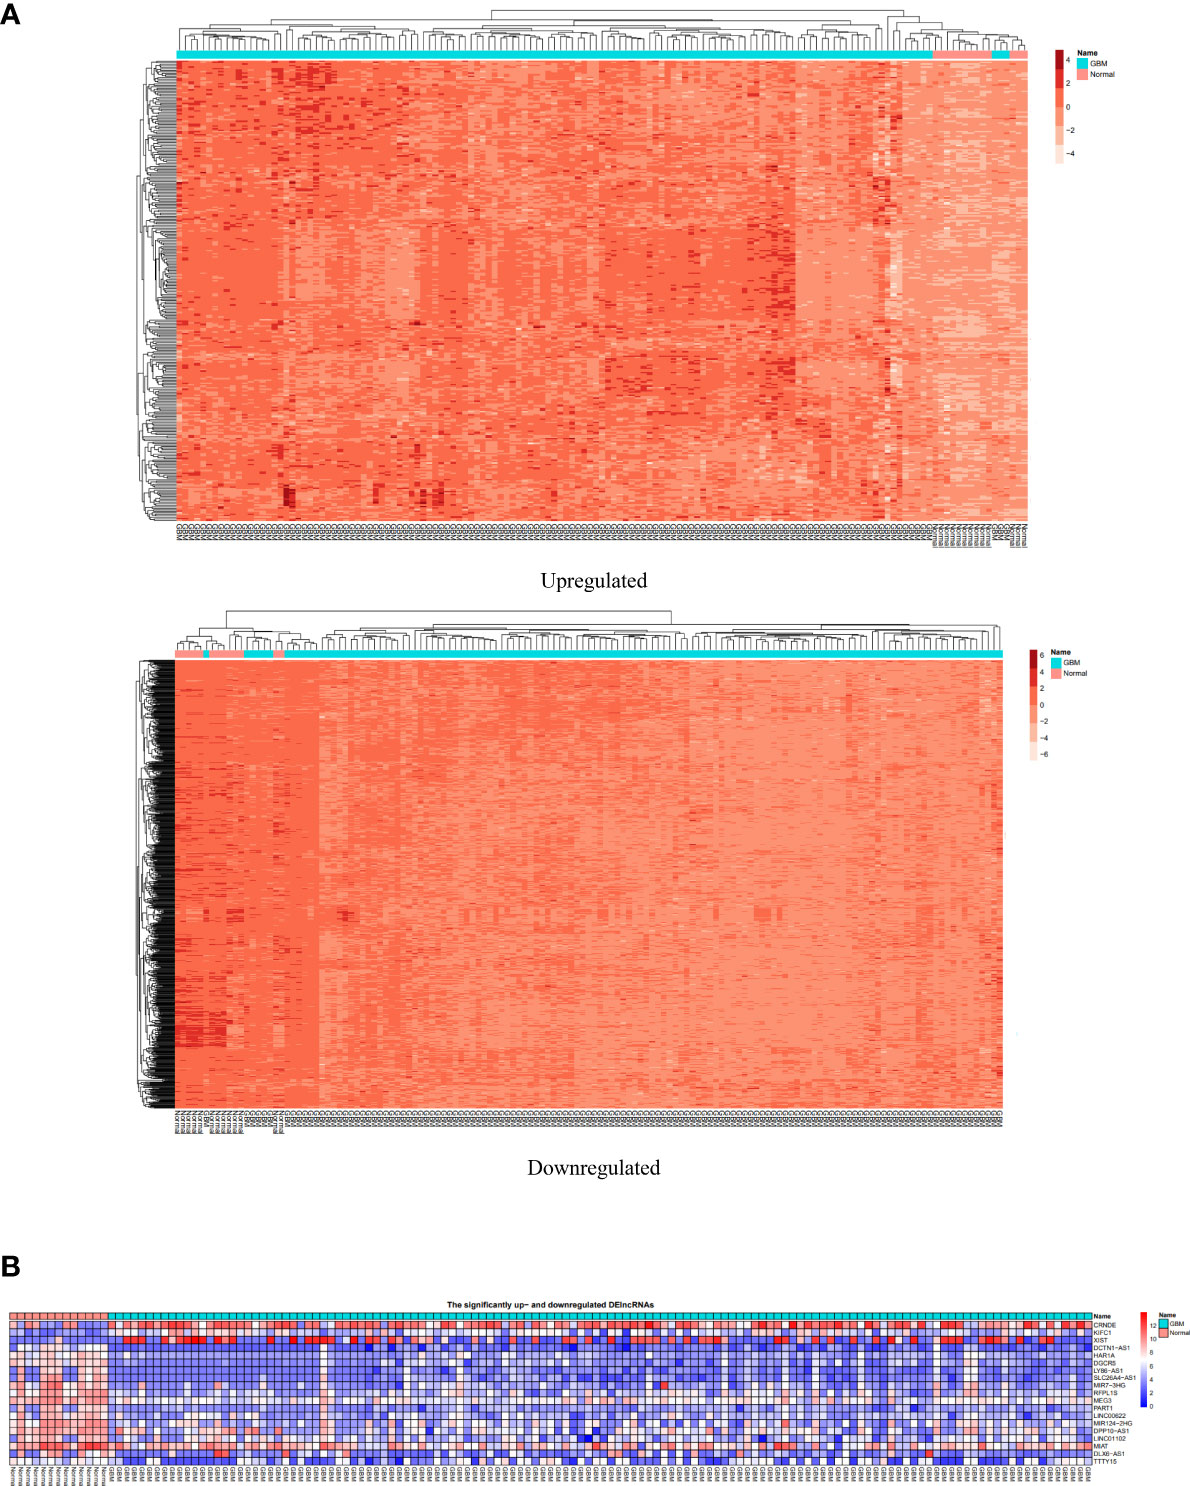
Figure 4 (A) The two-way clustering of DEmRNAs between GBM samples and normal samples; horizontal axis, the samples; vertical axis, DEmRNAs. (B) Two heatmaps depicting expression of DElncRNAs and DEmiRNAs.
GO enrichment analysis of DEGs
DEGs were enriched in 816 GO terms. We used Clusterprofiler package to perform analysis. In GO functional enrichment analysis, 816 GO entries satisfy adjusted P value less than 0.05, most of which are biological processes (BP), followed by cellular components (CC) and molecular functions (MF). The first 30 entries are synaptic membrane (CC), modulation of chemical synaptic transmission (BP), regulation of trans-synaptic signaling (BP), glutamatergic synapse (CC), synapse organization (BP), synaptic vesicle cycle (BP), vesicle-mediated transport in synapse (BP), neurotransmitter transport (BP), regulation of membrane potential (BP), neuron to neuron synapse (CC), postsynaptic specialization (CC), postsynaptic membrane (CC), neurotransmitter secretion (BP), signal release from synapse (BP), ion channel complex (CC), regulation of neurotransmitter levels (BP), postsynaptic density (CC), asymmetric synapse (CC), transmembrane transporter complex (CC), transporter complex (CC), cation channel complex (CC), regulation of synaptic plasticity (BP), presynaptic membrane (CC), synaptic vesicle membrane (CC), exocytic vesicle membrane (CC), synaptic vesicle (CC), regulation of ion transmembrane transport (BP), exocytic vesicle (CC), synaptic vesicle exocytosis (BP) and gated channel activity (MF). Figure 5 shows the barplots of top 10 enriched functions.
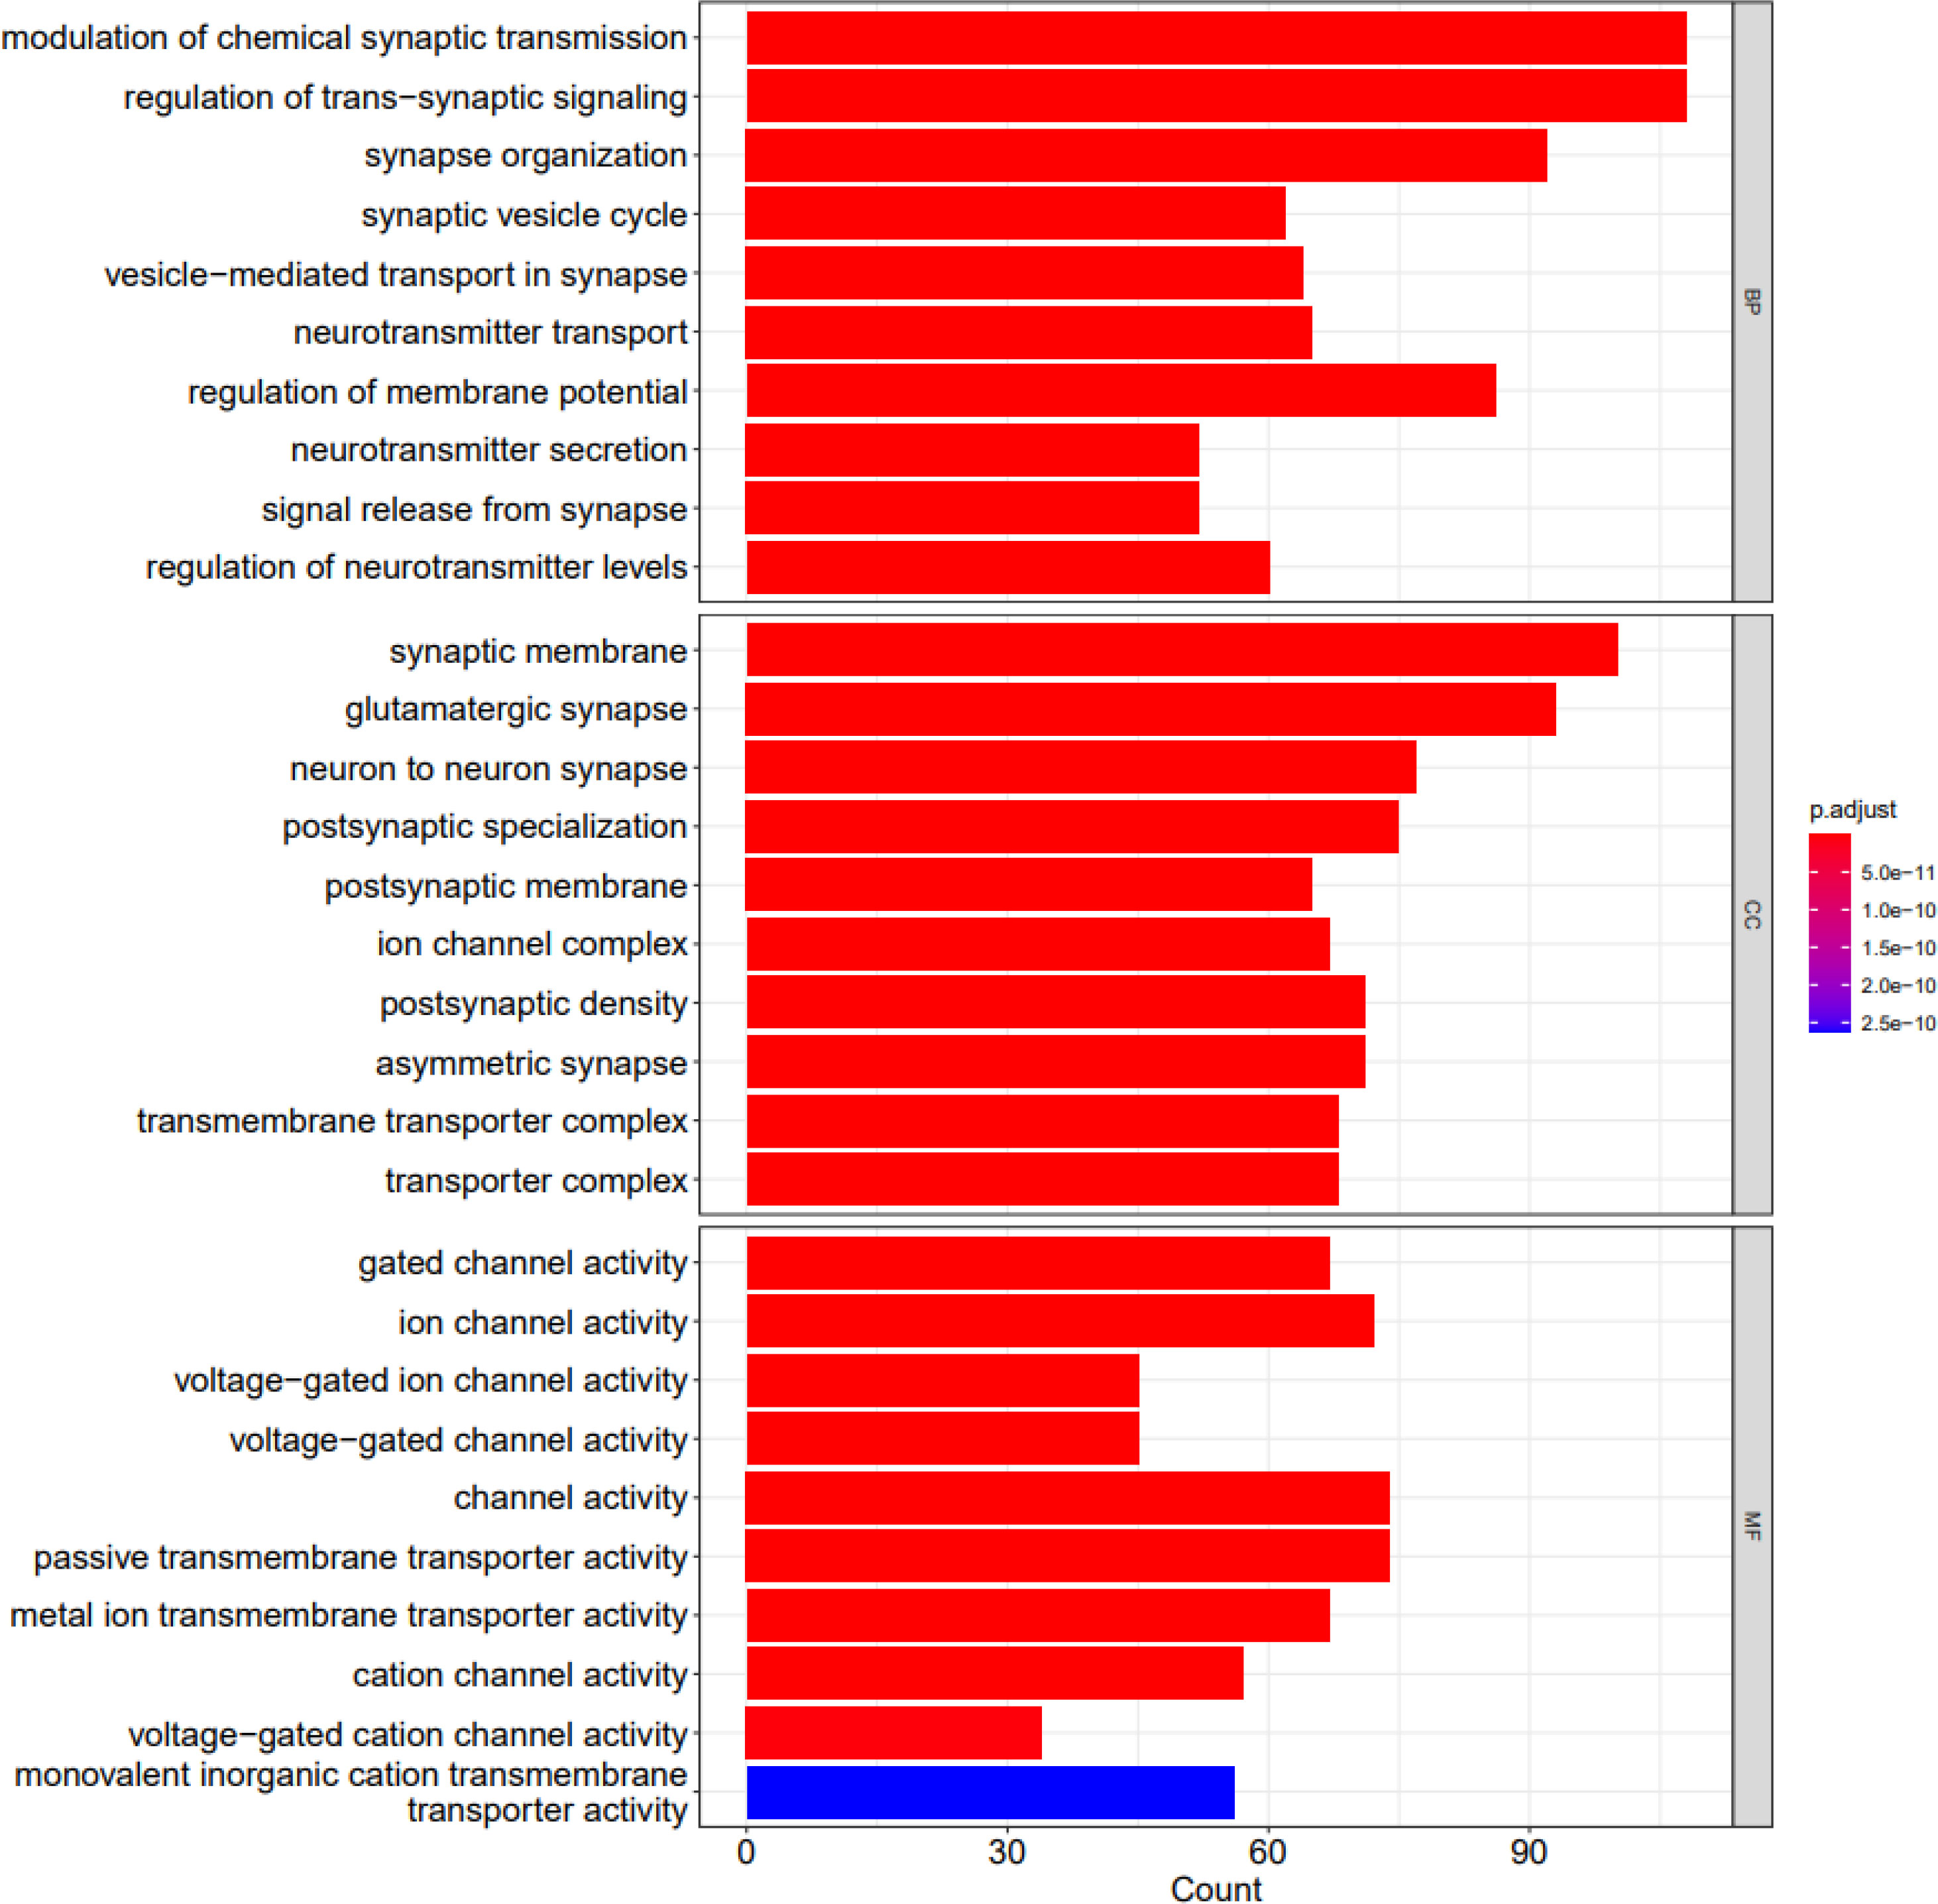
Figure 5 The barplots of top 10 enriched functions; BP (biological process), CC (cellular component) and MF (molecular function). X axis shows the count of geneset; Y axis shows the geneset function; Bar color represents the adjusted P.value, ranging from red (most significant) to blue (least significant).
Figures 6 and 7 depict visualization of the dotplots of top 10 enriched functions and enriched GO induced graph, respectively.
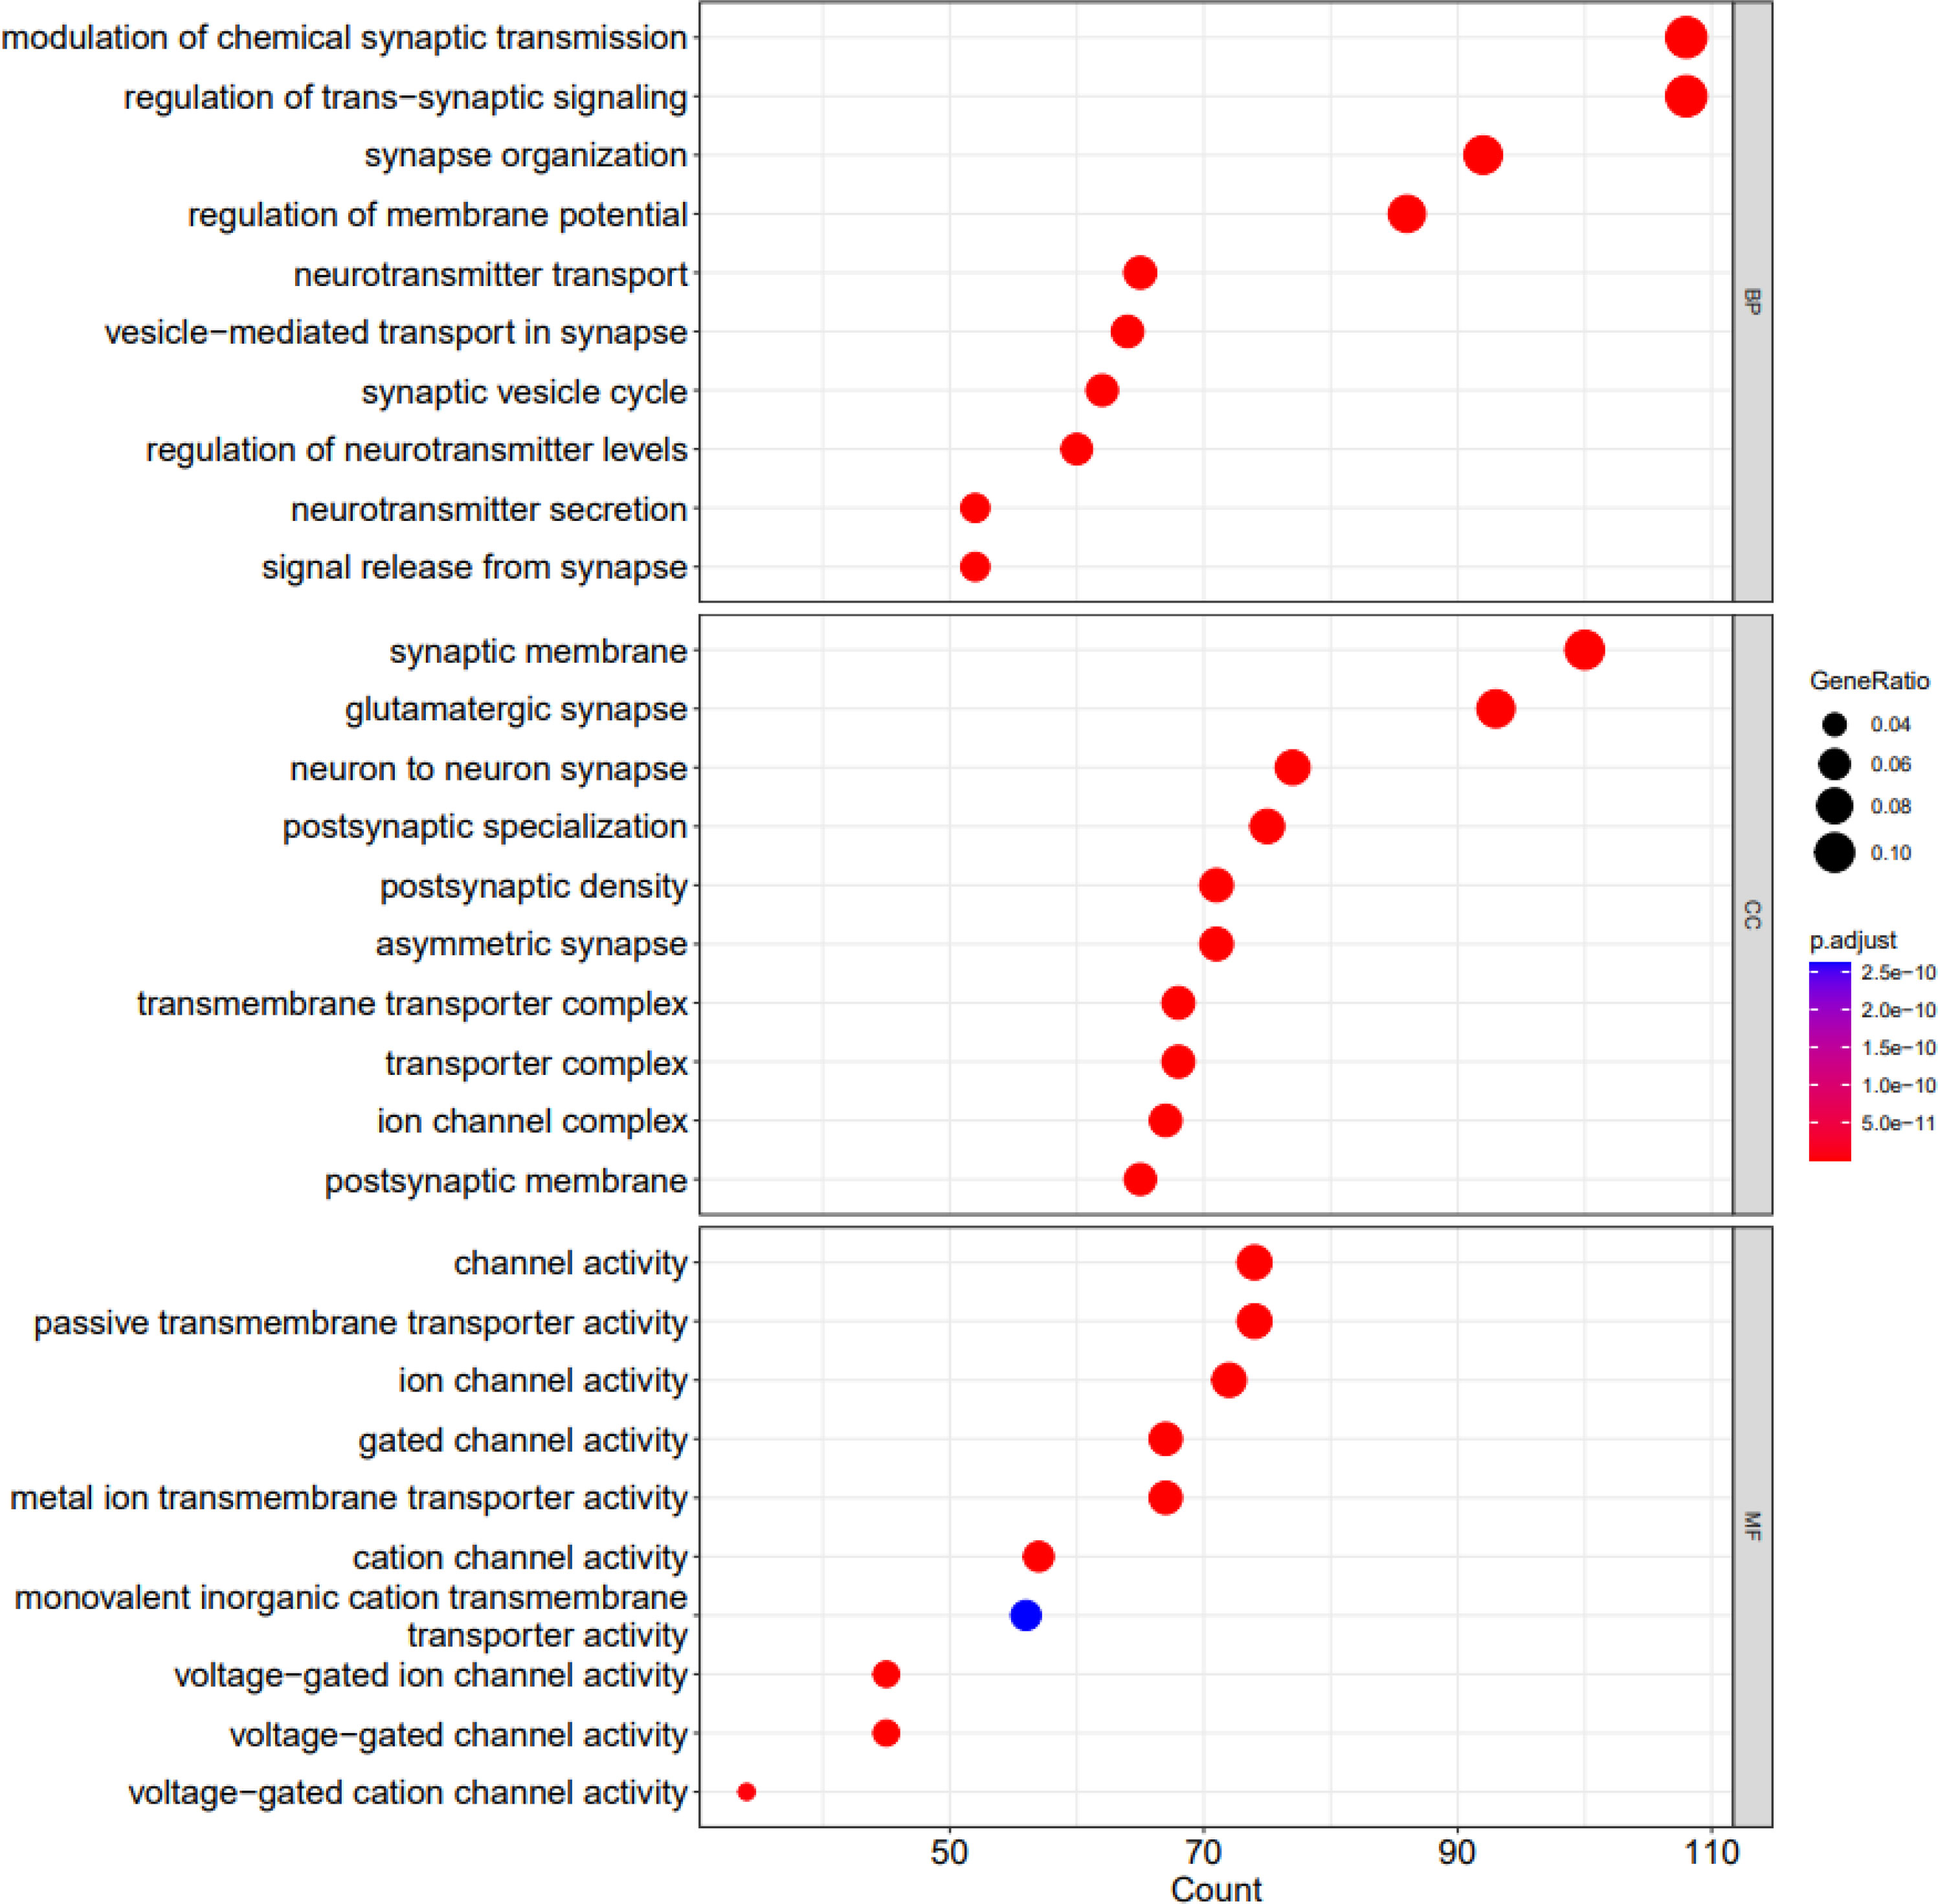
Figure 6 The dotplots of top 10 enriched functions. X axis shows the count of geneset; Y axis shows the geneset function; Dot color represents the adjusted P value ranging from dark blue (most significant) to red (least significant). Dot size represents the GeneRatio and the larger the size of the dot, the higher the value of the gene ratio.
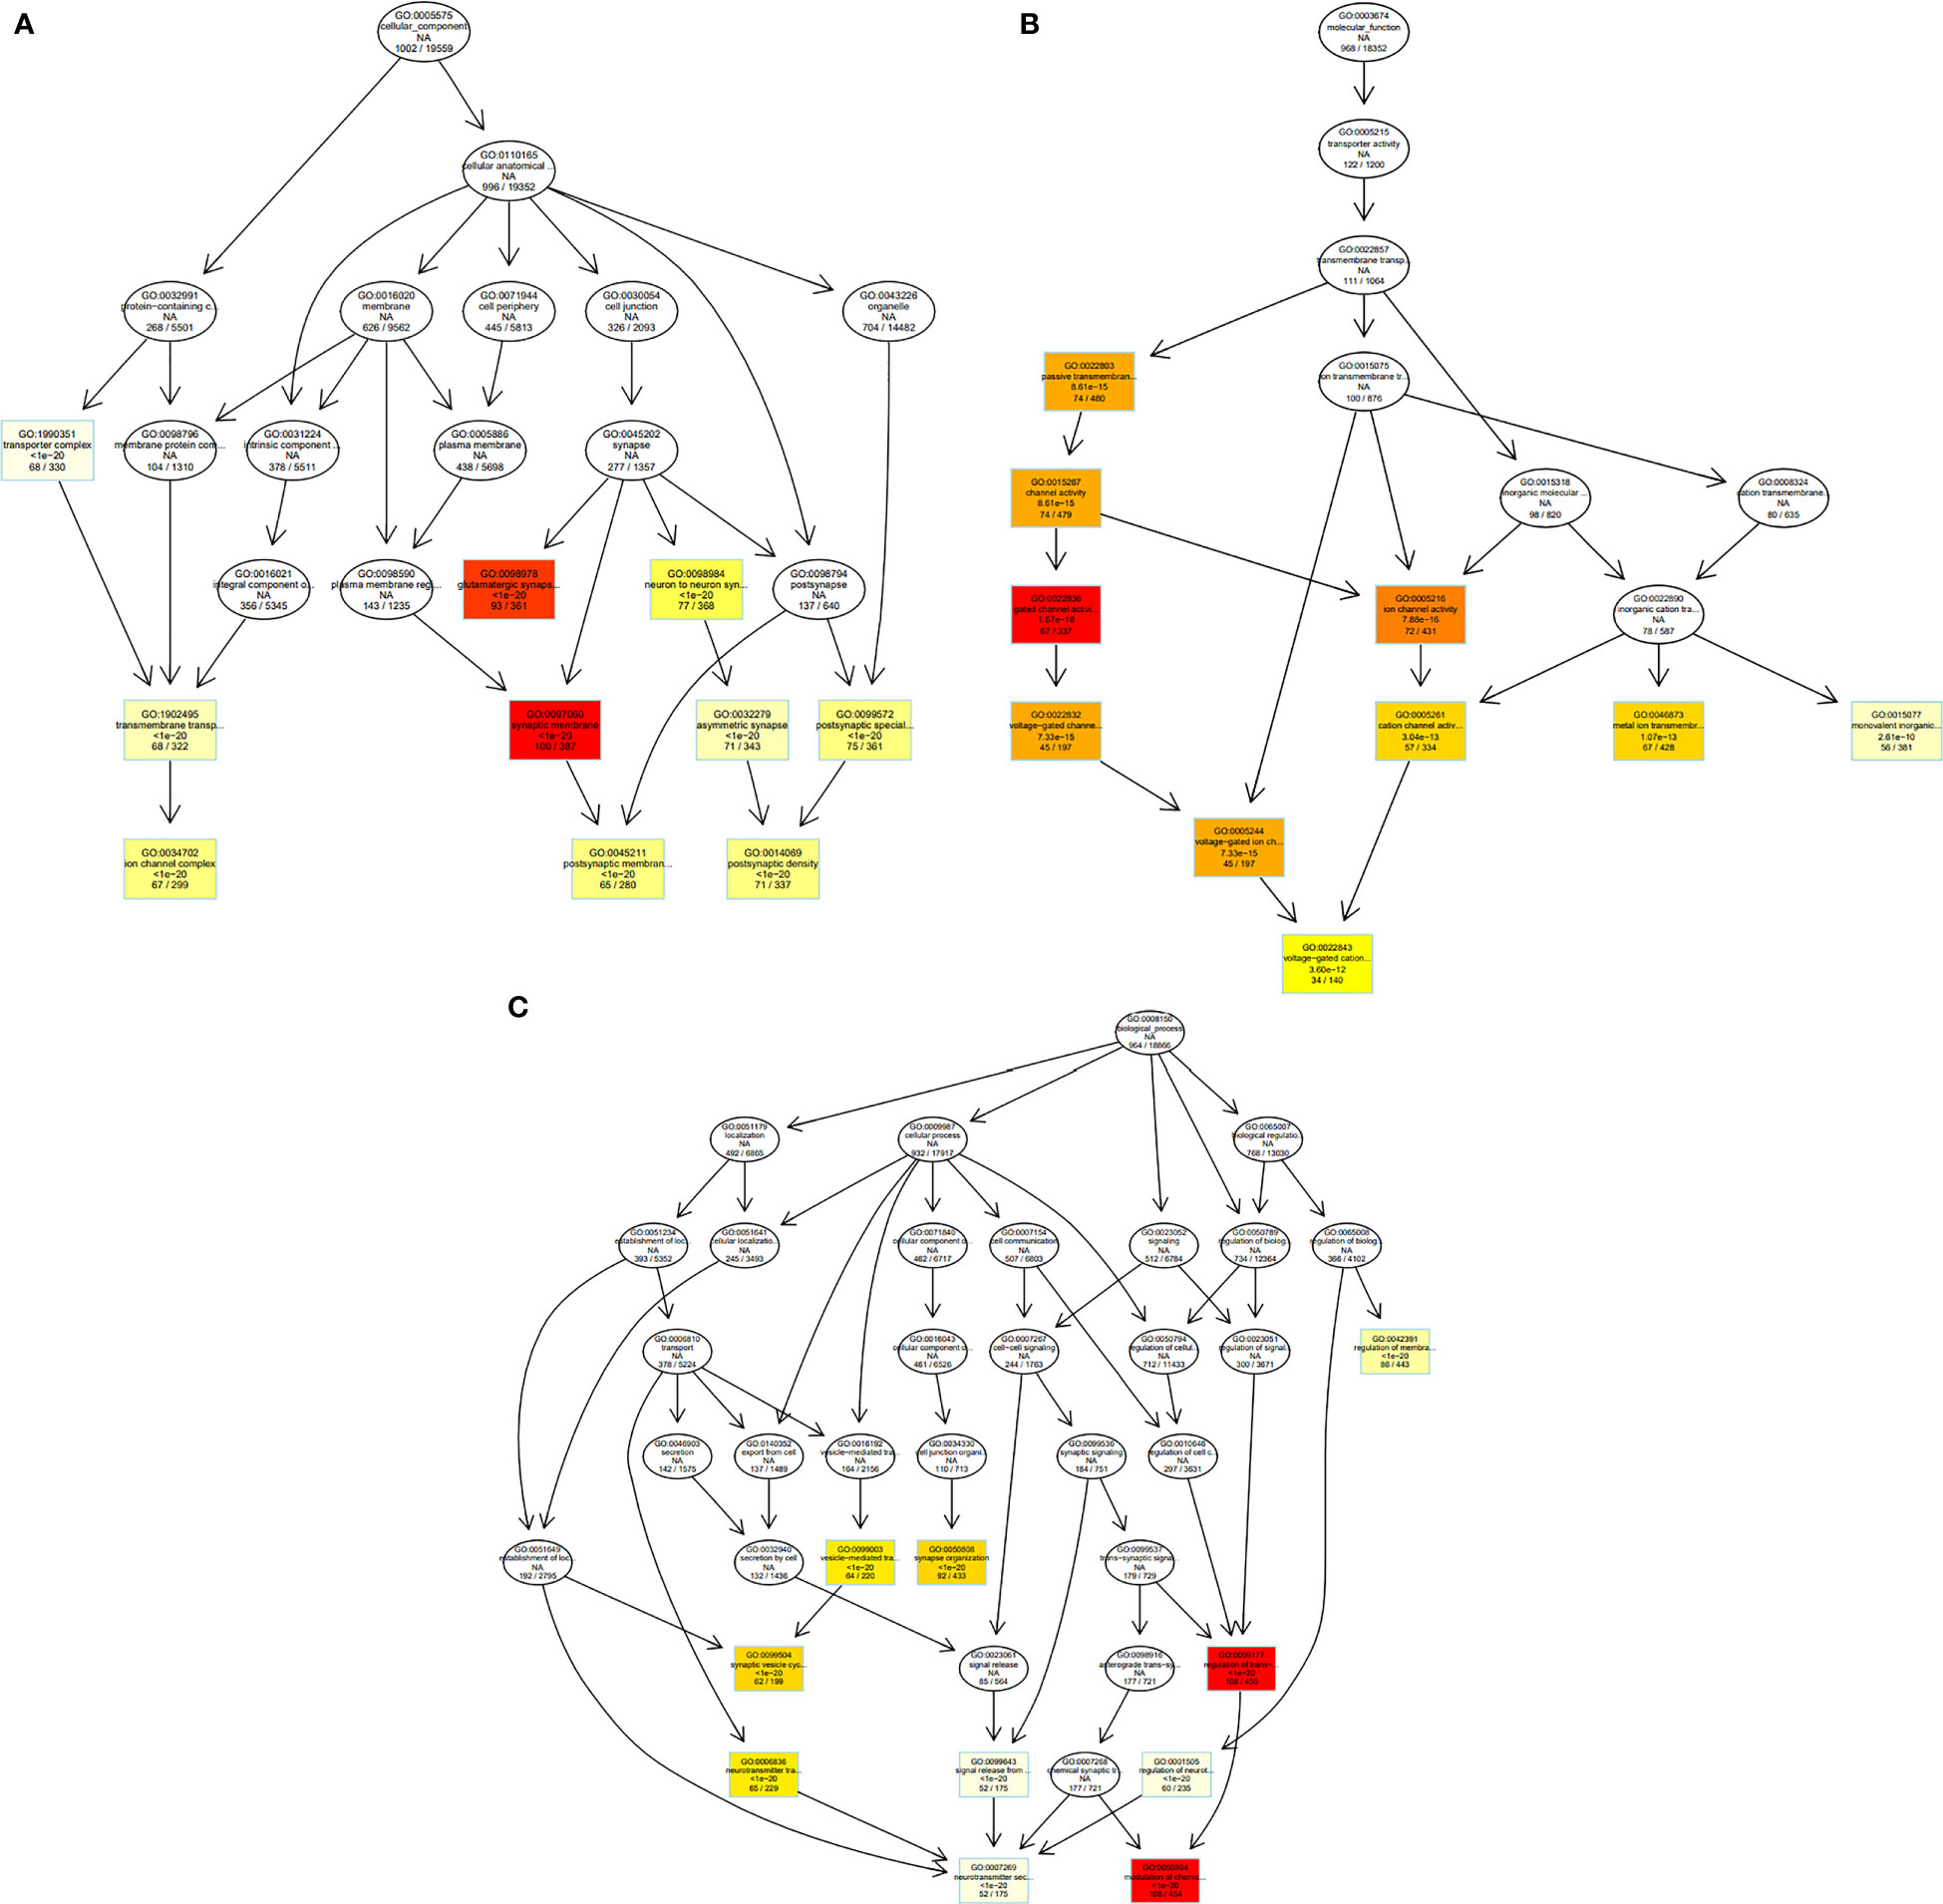
Figure 7 GO graph visualization of top GO terms enriched. (A) The top 10 GO terms in the category “Cellular Component” have generated a GO sub-graph. (B) The top 10 GO terms in the category “Molecular Function” have generated a GO sub-graph. (C) The top 10 GO terms in the category “Biological process” have generated a GO sub-graph. Boxes indicate the most significant terms. From dark red (most significant) to light yellow (least significant), the color of the box indicates the relative significance.
Figure 8 indicates the gene-concept network of top 5 GO terms (Modulation of chemical synaptic transmission, regulation of trans-synaptic signaling, synapse organization, synaptic vesicle cycle and vesicle-mediated transport in synapse).
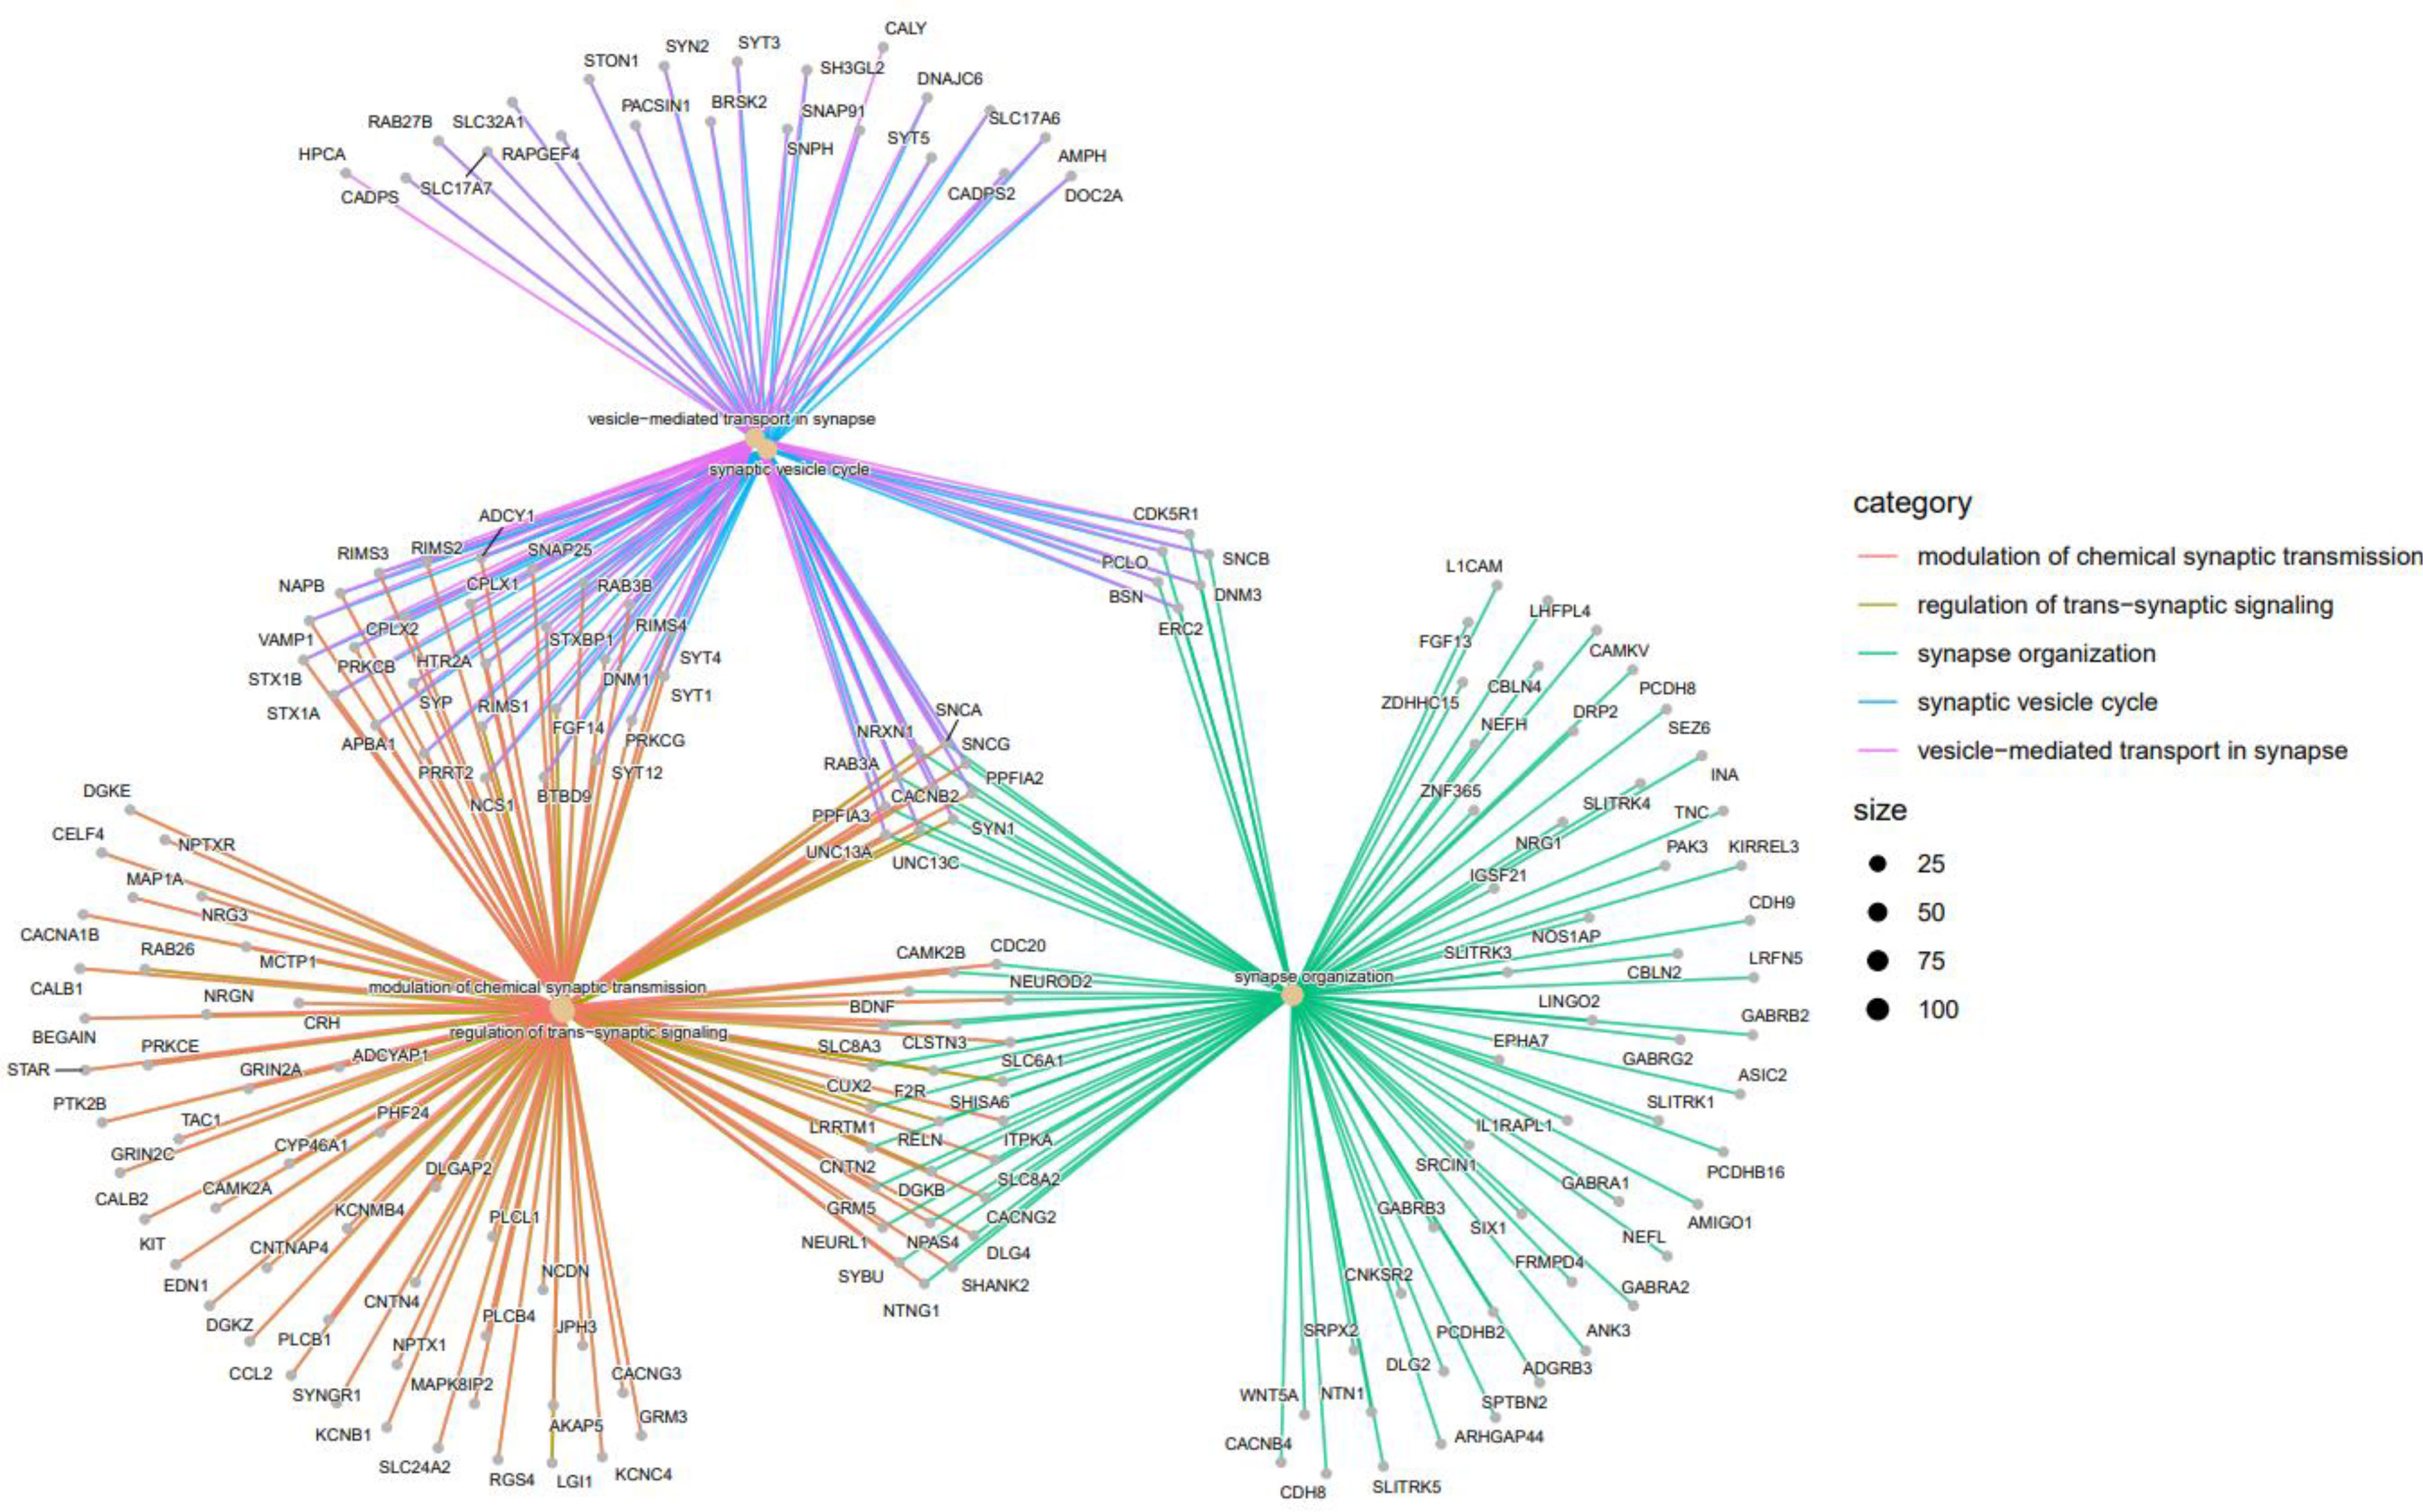
Figure 8 Top 5 GO terms as a network plot. These GO terms are connected to genes in this graph. The connection of genes to the corresponding GO is marked with a special color; There are more genes for a specific GO term if the dot relating to it is bigger.
In Figure 9, the UpSet plot visualizes the intersection between top 10 GO terms. It highlights the gene overlap between several gene sets.
Figure 9 UpsetPlot of 10 GO terms.
Pathway analysis
Using Pathview (24) and gage (25) packages in R, KEGG pathways analysis of 177 downregulated and 177 upregulated DEGs were performed to identify the potential functional genes (Table 5; Figure 10).
Table 5 Down-regulated and Up-regulated Pathways.
Figure 10 Visualization of the first two upregulated and downregulated pathways. Green boxes are downregulated genes and red boxes are upregulated genes.
PPI network construction and selection of hub genes
A PPI network of DEGs (Figure 11) with 411 nodes and 727 edges that was generated from STRING was put into the Cytohubba plugin of Cytoscape 3.9 in order to identify the hub genes. The 20 hub genes with the highest dgree of connectivity were DLG4, CAMK2B, BUB1B, LIN7B, CDK2, SYT1, DNM1, STX1A, GRIA4, CCNB1, AURKA, AURKB, BUB1, STXBP1, TP53, CCNB2, SNAP25, CDK1, GRIA2 and CDK4. Table 6 is a list of this hub’s information. The greatest degree to lowest degree is used to order these hubs.
Figure 11 PPI network of DEmRNAs. (A) Total PPI network, (B) Subnetwork of hub genes.
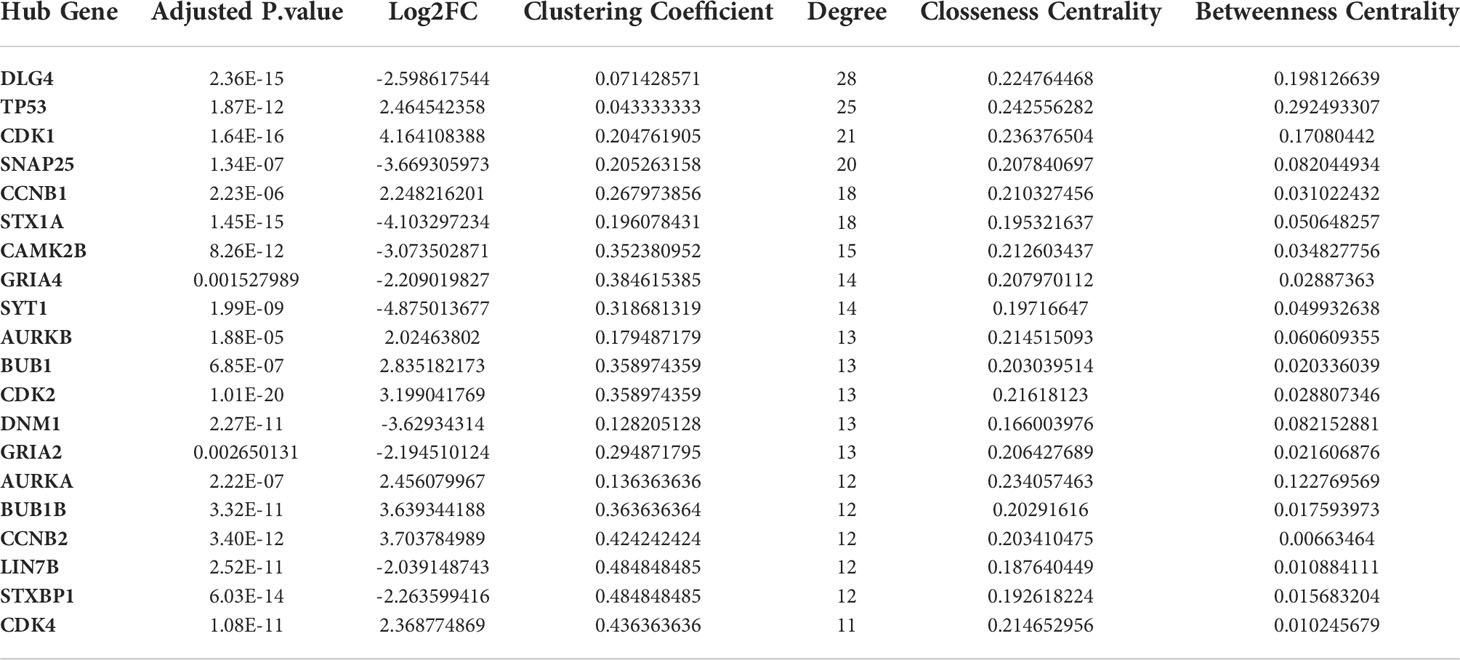
Table 6 The information of hub genes in PPI network.
CeRNA network construction in GBM
Using miRcode, the relationship between lncRNAs and miRNAs was assessed. This step demonstrated that 20 of the 39 GBM-specific DEmiRNAs may be targeted by 10 of the 19 lncRNAs (Table 7). Then, in order to investigate the connection between miRNAs and mRNAs, we used miRWalk with miRTarBase, TargetScan and miRDB filters to predict targeted mRNAs by these 20 miRNA. The findings suggested that 3 miRNAs may target 6 of the 1080 mRNAs (Table 8). If miRNA-targeted mRNAs were not found in DEmRNAs, they were eliminated. Cytoscape 3.9 was used to build the lncRNA-miRNA-mRNA ceRNA network using the data from Tables 7 and 8. The ceRNA network contained a total of 3 miRNAs, 10 lncRNAs, and 6 mRNAs (Figure 12). We displayed this ceRNA network using a Sankey diagram generated by the ggalluvial R package (Version: 0.12.3) (26) in order to better understand the impact of lncRNAs on mRNAs in GBM that is mediated by their interaction with miRNAs (Figure 13). Finally, using the cytohubba app, we calculated nodes closeness and exhibited the top 10 nodes in the network with the highest closeness centrality (Figure 14). We identified DGCR5, MIAT, hsa-miR-129-5p, XIST, hsa-miR-128-3p, PART1, hsa-miR-10b-5p, LY86-AS1, CRNDE, and DLX6-AS1 as 10 hub genes in the ceRNA network.
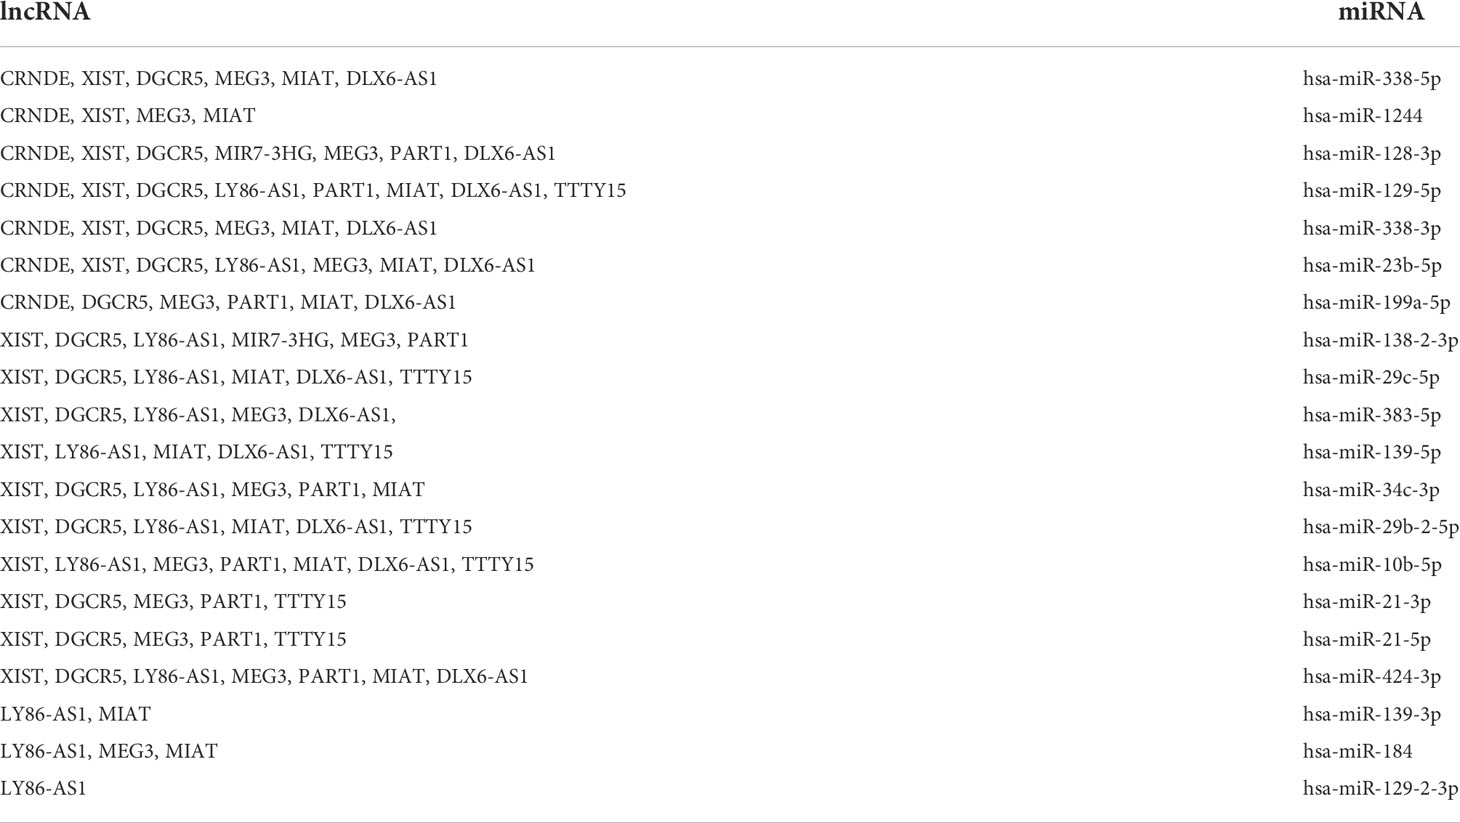
Table 7 The MiRcode database revealed interactions between 10 DElncRNAs and 20 DEmiRNAs.
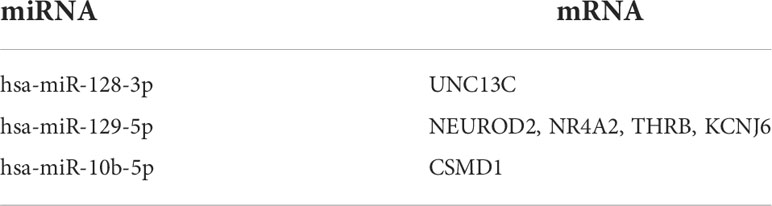
Table 8 miRWalk (miRTarBase, TargetScan and miRDB filters) database revealed interactions between 3 DEmiRNAs and 6 DEmRNAs.
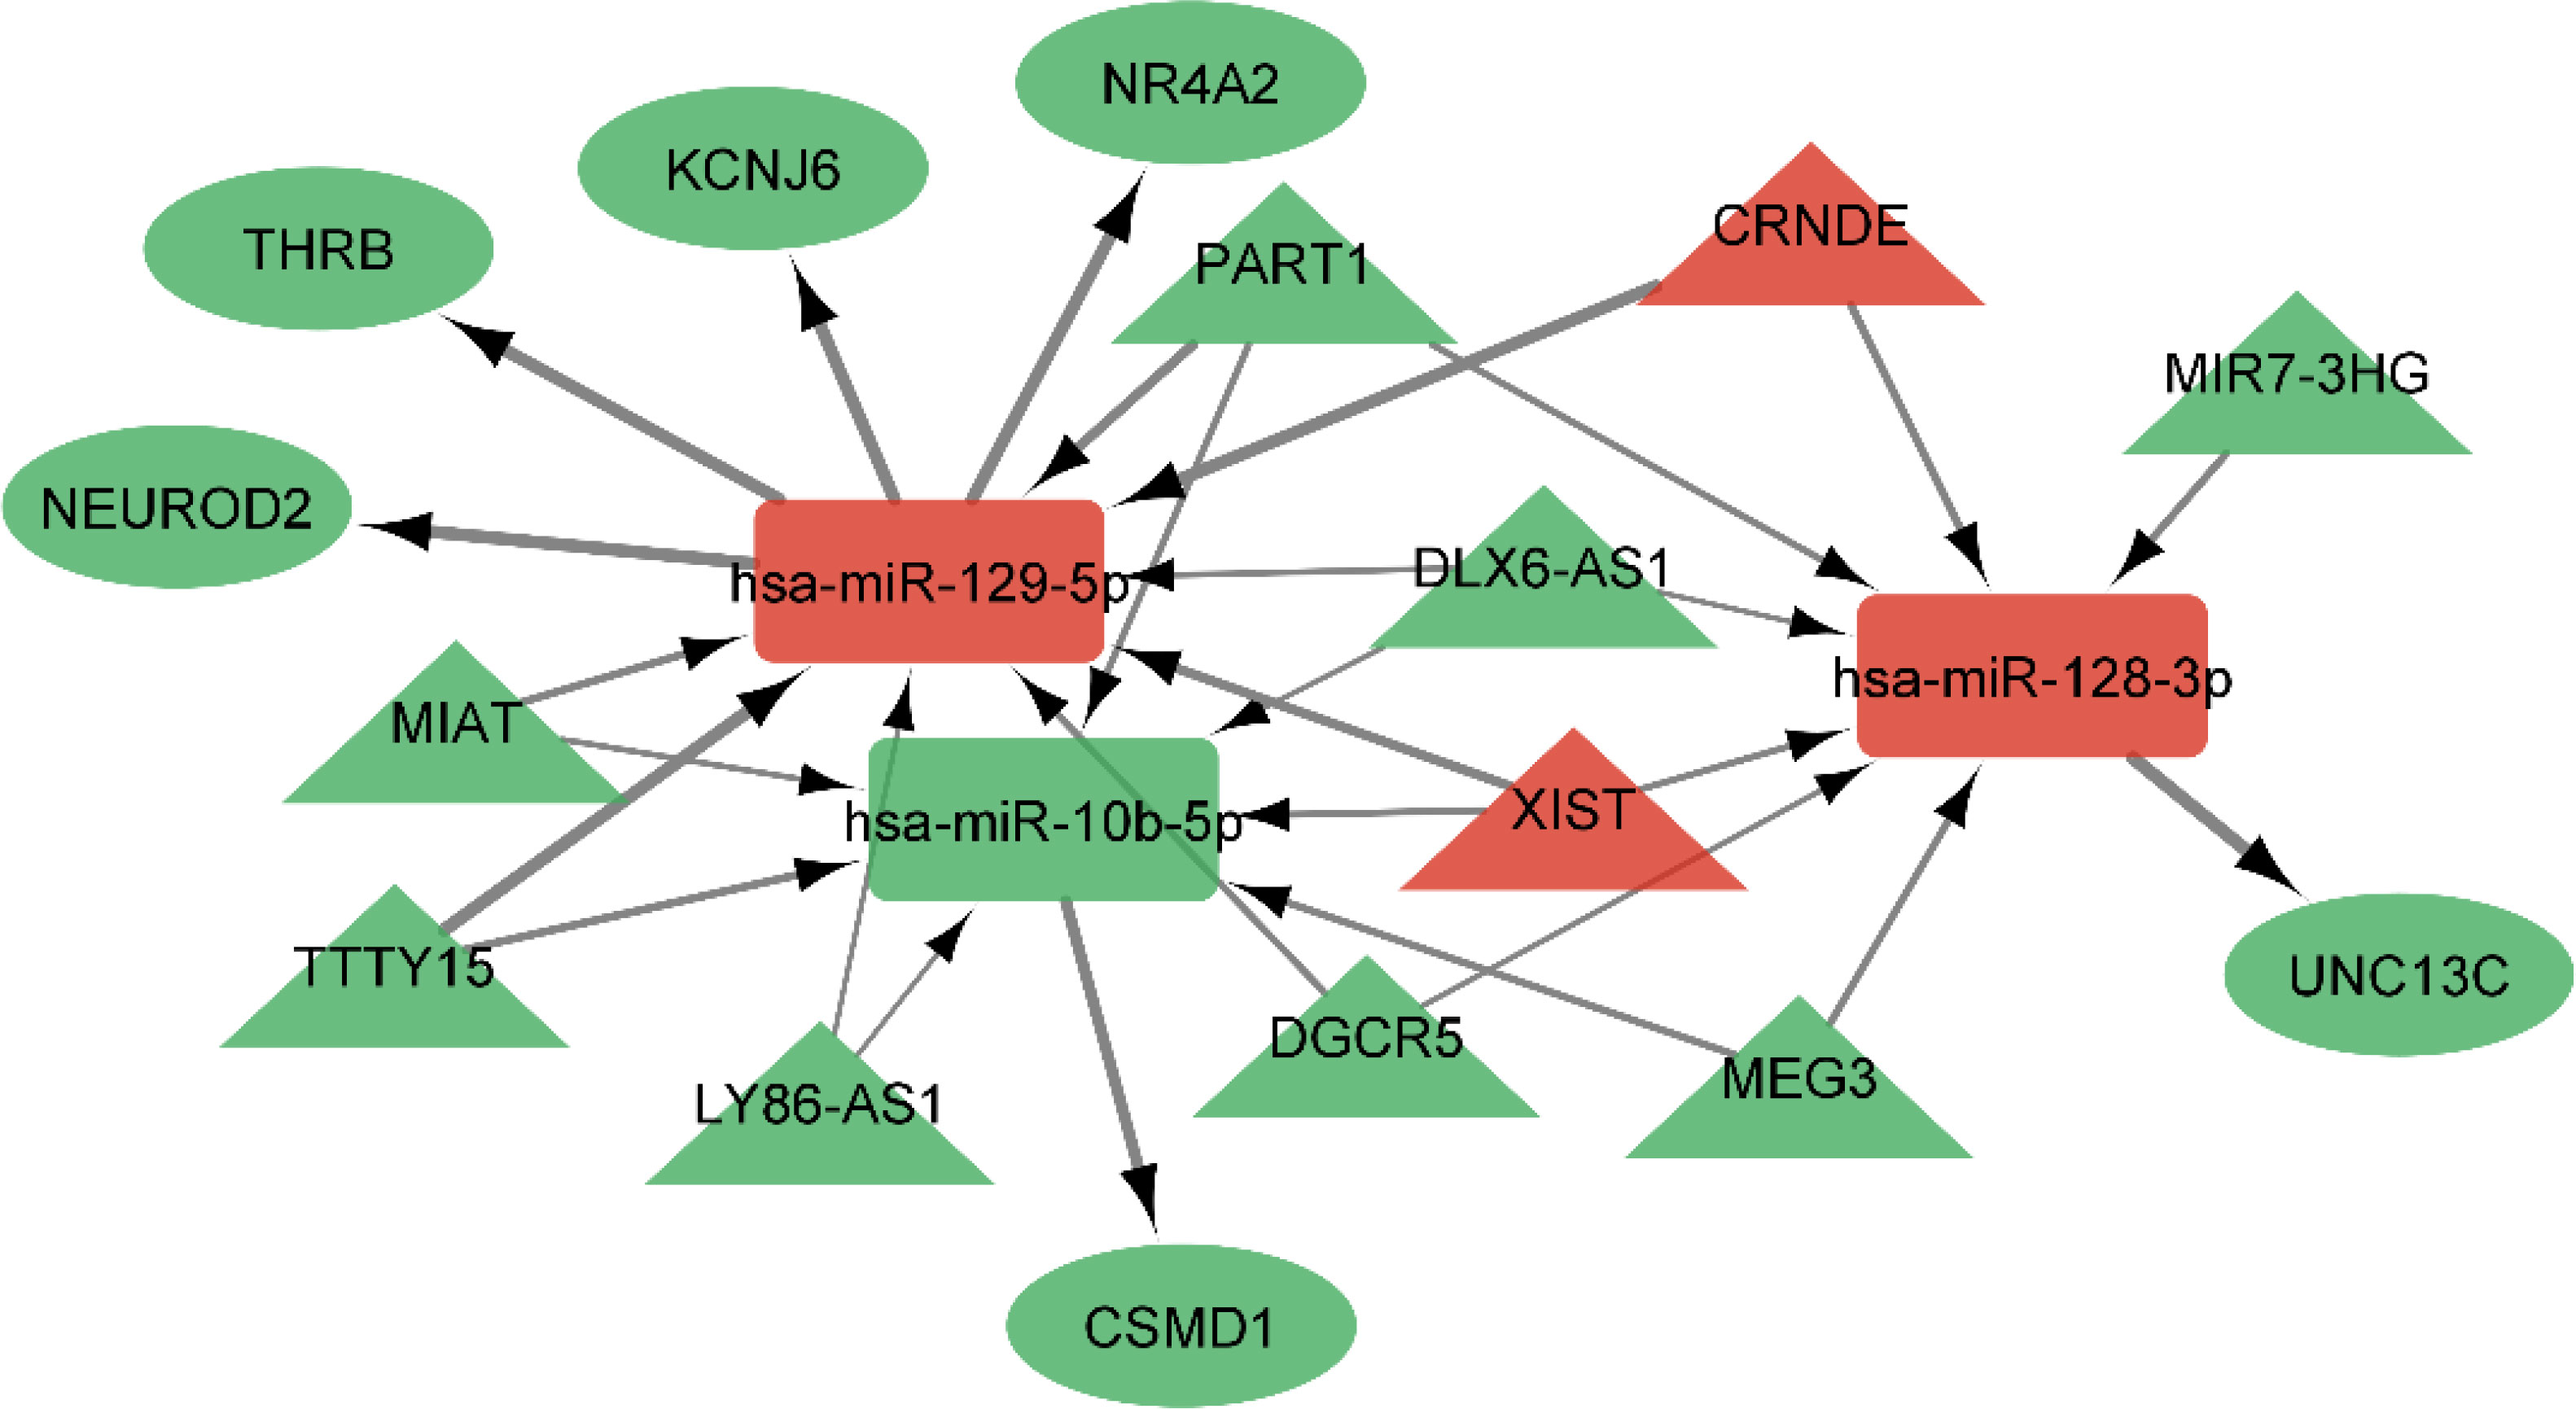
Figure 12 ceRNA network in GBM. Red nodes signify a strong expression level, while green nodes signify a low level of expression. Ellipses represent protein-coding genes; rectangles represent miRNAs; Triangles represent lncRNAs; gray edges indicate lncRNA-miRNA-mRNA interactions. Greater edge thickness indicates greater betweenness.
Figure 13 The ceRNA network in GBM is shown by a Sankey diagram. Each rectangle represents a gene, and depending on the size of the rectangle, the degree of relationship between each gene is shown.
Figure 14 Top 10 genes with highest closeness centrality in ceRNA network.
Validation of hub genes via expression value
We first obtained the TCGA-GBM RNA-seq data using the TCGAbiolinks package (27), and then we used the R packages limma and edgeR to analyze it. Then, by using Venny 2.0.2 (28), we were able to obtain the genes that were present in both the PPI and ceRNA networks’ Hub genes and TCGA-GBM DEGs (adjusted p value < 0.05 and |log2 fold Change (FC)| > 2) (Figure 15). As a result, 18 of the 20 PPI network genes and 6 of the 10 ceRNA network genes were also included in the TCGA-GBM DEGs. Utilizing the ualcan, the expression value of these hub genes was evaluated. Therefore, all hub genes in PPI network and CRNDE, DGCR5, LY86-AS1, MEG3, MIAT, PART1 in ceRNA network revealed excellent statistical significance (Figure 16; Table 9).
Figure 15 Venn diagram. The number of hub genes in PPI and ceRNA networks and TCGA-GBM DEGs.
Figure 16 Box plots of gene expression of hub genes in GBM and normal samples based on TCGA. Red and blue boxes show gene expression of hub genes in GBM and normal samples, respectively.
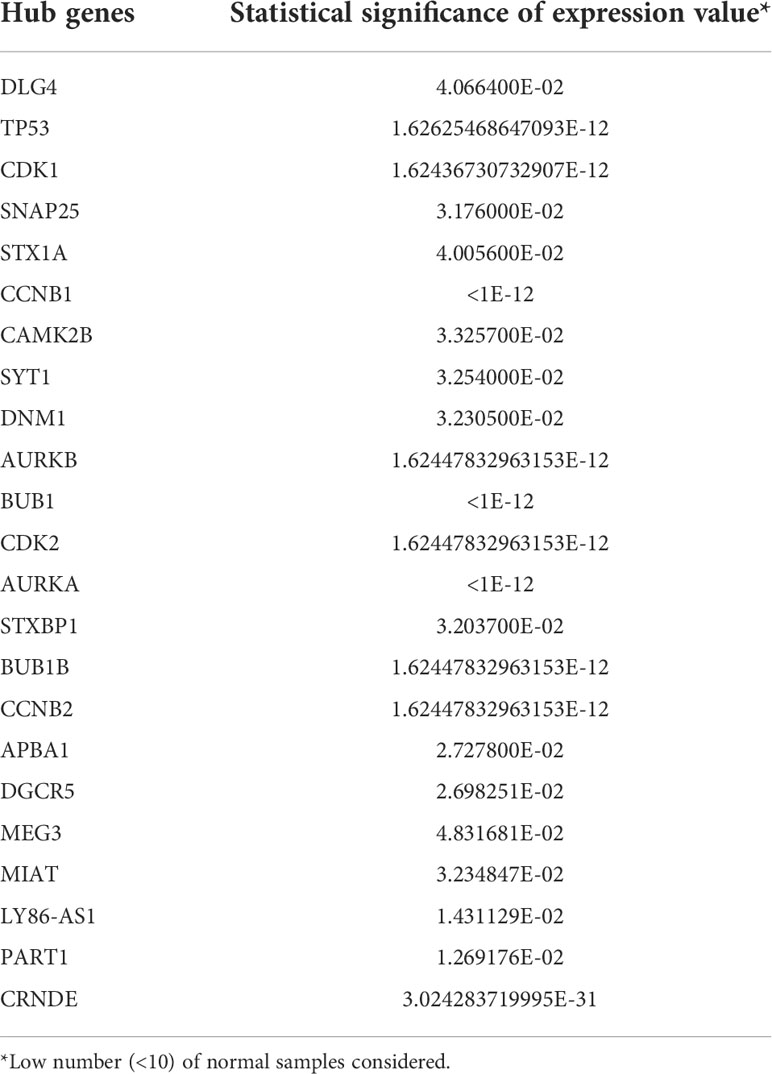
Table 9 Statistical significance of hub genes based on sample types in GBM.
Expression of the hub genes in various GBM cell lines
Using the cancer cell line encyclopedia (CCLE), we gathered cell line expression data (DepMap Public 22Q2) (29) and chose four GBM cell lines and hub genes. We selected four primary cell lines for GBM, namely A172, U251, U87, and T98G. NHA cell line was utilized as a normal brain cell line. Finally, we analyzed this data using the limma package in the R programming language, and we discovered how the hub genes are expressed in diverse GBM cell lines (Table 10). As a threshold, we utilized Log2FC > |0.5| and an adjusted P.value of 0.05.
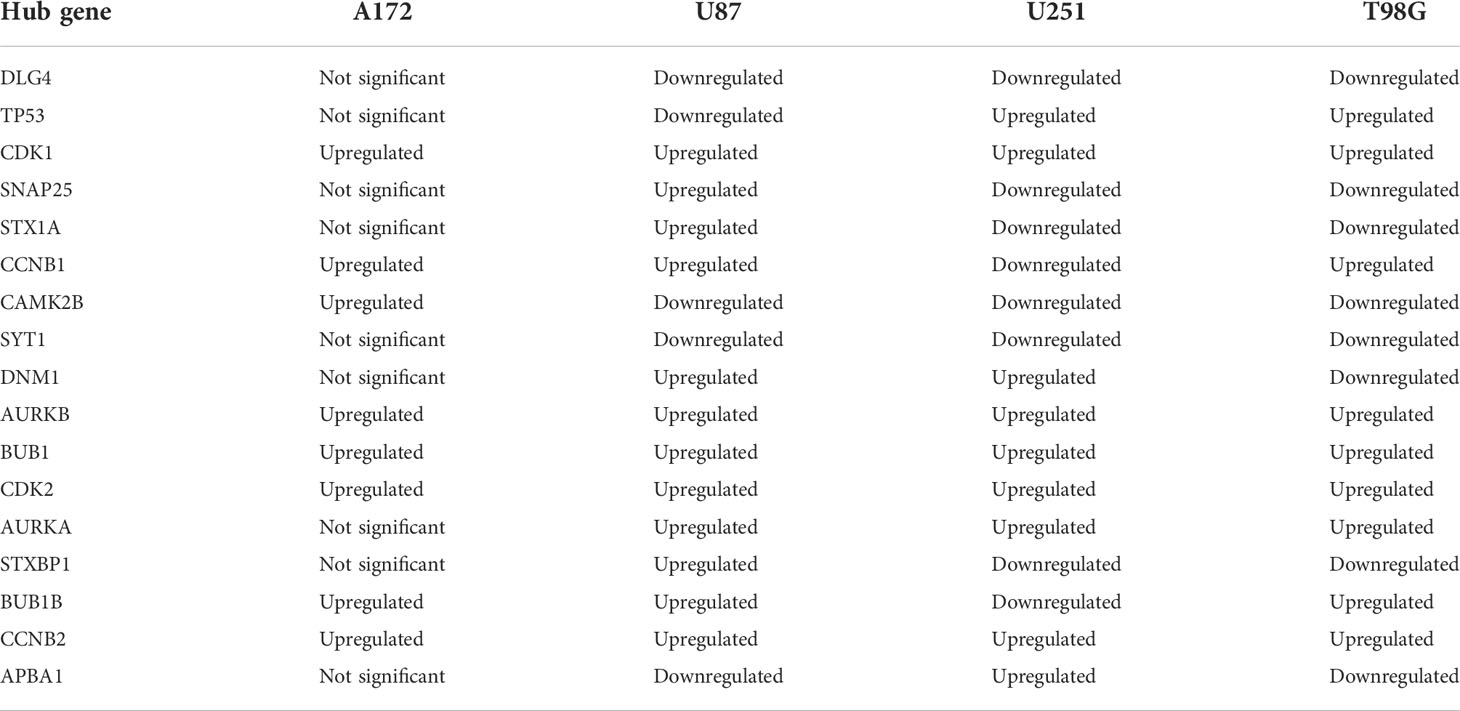
Table 10 Expression pattern of the hub genes in A172, U251, U87, and T98G cell lines.
Survival analysis
A Kaplan-Meier curve analysis was used to perform a survival analysis using the R survival package. We carried out a survival analysis using hub genes in PPI and ceRNA networks. The difference was statistically significant with a log-rank P value less than 0.05. Therefore, in patients with GBM, DLG4, DNM1, STX1, and CRNDE exhibited a significant correlation with a shorter overall survival time (Figure 17).
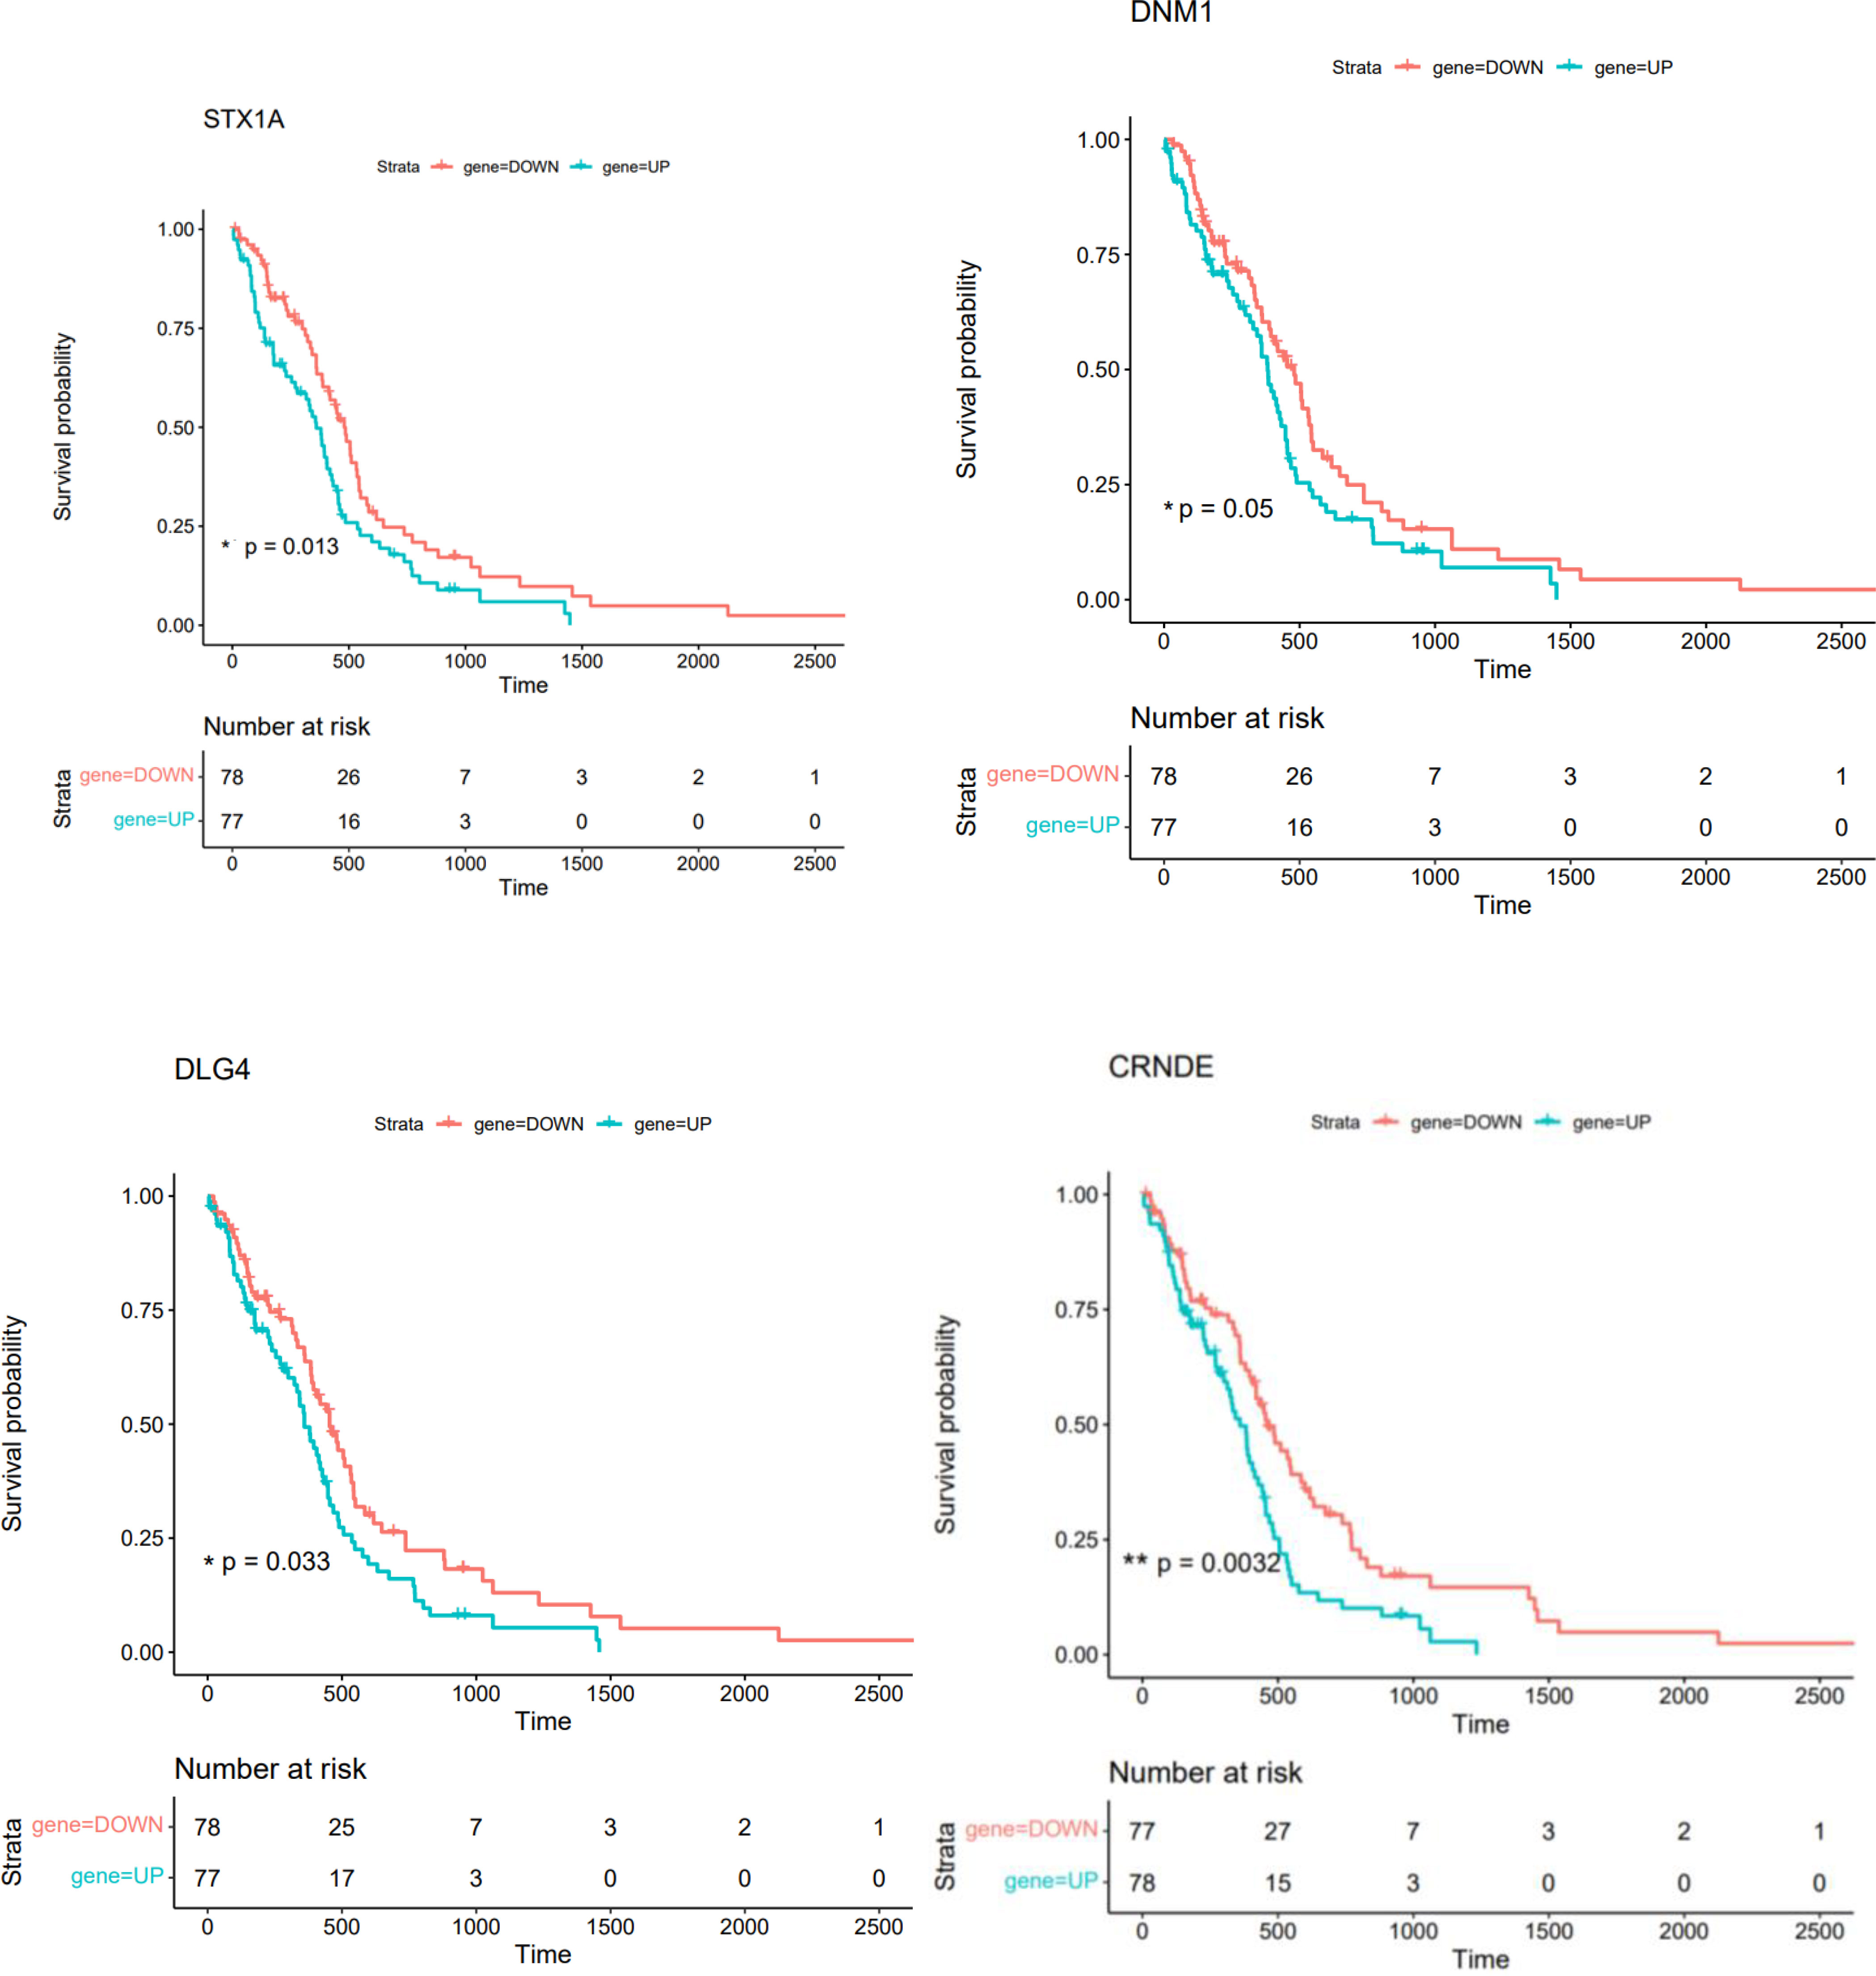
Figure 17 The overall survival of GBM patients is related to the Kaplan-Meier survival curves of STX1A, DNM1, DLG4, and CRNDE (* shows P<=0.05, ** shows P<0.01).
Discussion
Using an in-silico approach, we aimed to identify ceRNA networks in GBM. The ceRNA network between three mentioned classes of RNAs is a recently revealed regulatory relationship. This network has an essential role in the modulation of biological features of cancer. Our strategy led to identification of 1080 DEmRNAs, including 777 downregulated DEmRNAs (such as GJB6 and SLC12A5) and 303 upregulated DEmRNAs (such as TOP2A and RRM2), 19 DElncRNAs, including 16 downregulated DElncRNAs (such as MIR7-3HG and MIR124-2HG) and 3 upregulated DElncRNAs (such as CRNDE and XIST) and 49 DEmiRNAs, including 10 downregulated DEmiRNAs (such as hsa-miR-10b-5p and hsa-miR-1290) and 39 upregulated DEmiRNAs (such as hsa-miR-219a-2-3p and hsa-miR-338-5p).
In line with our results, a previous study has shown that lncRNA XIST has as oncogenic function in human glioma through influencing expression of miR-137 (30). Moreover, ceRNA network analyses have shown that CRNDE enhances glioblastoma progression via sponging miR-9-5p (31).
Modulation of chemical synaptic transmission, regulation of trans-synaptic signaling, synapse organization, synaptic vesicle cycle and vesicle-mediated transport in synapse were identified as the top five GO terms. Therefore, the most important pathways are related with synaptic function.
DGCR5, MIAT, hsa-miR-129-5p, XIST, hsa-miR-128-3p, PART1, hsa-miR-10b-5p, LY86-AS1, CRNDE, and DLX6-AS1 were identified as 10 hub genes in the ceRNA network. These different types of RNAs are possible therapeutic targets and markers for GBM. Further experiments revealed association between expression of DLG4, DNM1, STX1, and CRNDE and overall survival time of GBM patients, indicating their importance as prognostic factors. DLG4 has been identified as a core biomarker Biomarkers related with clinical outcome in glioma patients through a bioinformatics approach (32). Bioinformatics analyses have also identified DNM1 as a marker of invasion in this type of cancer (33). Besides, functional studies have shown that interference with the Stx1 function can impair progression of GBM in vivo.
Additionally, a prior study has shown that blocking the SNARE protein Stx1 via three distinct methods, including STX1A knockdown, consistently results in a marked slowing of the growth of glioblastoma tumors in an orthotopic mouse model (34).
According to reports, DNM1 promotes the growth of tumors in a number of malignancies, including gastric adenocarcinoma (35). We also found DNM1 to be a significant biomarker in GBM.
DLG4, which was also recognized as a key gene hub in this illness was another gene that we discovered to be a biomarker in GBM (36).
Taken together, ceRNA network analyses in GBM have provided new insights into molecular mechanisms in this type of cancer, representing novel markers and therapeutic targets in GBM. Future assessment of their expression in clinical samples and functional studies in animal models would lead to identification of detailed data in this regard.
Data availability statement
Publicly available datasets were analyzed in this study. This data can be found here: https://www.ncbi.nlm.nih.gov/geo/(GSE50161, GSE36245, GSE83300 and GSE65626).
Author contributions
SG-F wrote the draft and revised it. GS and MT designed and supervised the study. BH, AS, and MA-B performed the bioinformatic analysis and data collection. All authors contributed to the article and approved the submitted version.
Funding
The authors would like to thank the clinical Research Development Unit (CRDU) of Loghman Hakim Hospital, Shahid Beheshti University of Medical Sciences, Tehran, Iran for their support, cooperation and assistance throughout the period of study (Grant Number 33186).
Conflict of interest
The authors declare that the research was conducted in the absence of any commercial or financial relationships that could be construed as a potential conflict of interest.
Publisher’s note
All claims expressed in this article are solely those of the authors and do not necessarily represent those of their affiliated organizations, or those of the publisher, the editors and the reviewers. Any product that may be evaluated in this article, or claim that may be made by its manufacturer, is not guaranteed or endorsed by the publisher.
Abbreviations
GBM, Glioblastoma Multiforme; lncRNA, Long non-coding RNA; miRNA, MicroRNA; mRNA, Messenger RNA; ceRNA, Competitive Endogenous RNA; DEG, Differentially Expressed Genes; GEO, Gene Expression Omnibus; SVA, Surrogate Variable Analysis; PCA, Principal Component Analysis; Limma, Linear Models for Microarray Data; FDR, False Discovery Rate; Log2FC, Log2 Fold Change; HGNC, HUGO gene nomenclature; GO, Gene Ontology; KEGG, Kyoto Encyclopedia of Genes and Genomes; PPI, Protein-Protein Interaction; TCGA, The Cancer Genome Atlas; BP, Biological Process; MF, Molecular Function; CC, Cellular Component; CCLE, Cancer Cell Line Encyclopedia.
References
1. Bush NAO, Chang SM, Berger MS. Current and future strategies for treatment of glioma. Neurosurgical review. (2017) 40(1):1–14. doi: 10.1007/s10143-016-0709-8
2. D'Alessio A, Proietti G, Sica G, Scicchitano BM. Pathological and molecular features of glioblastoma and its peritumoral tissue. Cancers. (2019) 11(4). doi: 10.3390/cancers11040469
3. Liu R, Gao Z, Li Q, Fu Q, Han D, Wang J, et al. Integrated analysis of ceRNA network to reveal potential prognostic biomarkers for glioblastoma. Front Genet (2021) 12. doi: 10.3389/fgene.2021.803257
4. Liu G, Li H, Ji W, Gong H, Jiang Y, Ji G, et al. Construction of a ceRNA network in glioma and analysis of its clinical significance. BMC Genomics (2021) 22(1):722. doi: 10.1186/s12864-021-08035-w
5. Ghafouri-Fard S, Agabalazadeh A, Abak A, Shoorei H, Hassanzadeh Taheri MM, Taheri M, et al. Role of long non-coding RNAs in conferring resistance in tumors of the nervous system. Front Oncol (2021) 11:670917. doi: 10.3389/fonc.2021.670917
6. Rezaei O, Tamizkar KH, Sharifi G, Taheri M, Ghafouri-Fard S. Emerging role of long non-coding RNAs in the pathobiology of glioblastoma. Front Oncol (2020) 10:625884. doi: 10.3389/fonc.2020.625884
7. Hong F, Gong Z, Zhang X, Ma P, Yin Y, Wang H. Identification of biomarkers and ceRNA network in glioblastoma through bioinformatic analysis and evaluation of potential prognostic values. Ann Transl Med (2021) 9(20):1561. doi: 10.21037/atm-21-4925
8. Li Q, Yu Q, Ji J, Wang P, Li D. Comparison and analysis of lncRNA-mediated ceRNA regulation in different molecular subtypes of glioblastoma. Mol Omics. (2019) 15(6):406–19. doi: 10.1039/C9MO00126C
9. Zhou Y, Yang L, Zhang X, Chen R, Chen X, Tang W, et al. Identification of potential biomarkers in glioblastoma through bioinformatic analysis and evaluating their prognostic value. BioMed Res Int (2019) 2019:6581576. doi: 10.1155/2019/6581576
10. Leek JT, Johnson WE, Parker HS, Jaffe AE, Storey JD. The sva package for removing batch effects and other unwanted variation in high-throughput experiments. Bioinformatics. (2012) 28(6):882–3. doi: 10.1093/bioinformatics/bts034
11. Ritchie ME, Phipson B, Wu D, Hu Y, Law CW, Shi W, et al. Limma powers differential expression analyses for RNA-sequencing and microarray studies. Nucleic Acids Res (2015) 43(7):e47. doi: 10.1093/nar/gkv007
12. Batinic B. Cognitive models of positive and negative symptoms of schizophrenia and implications for treatment. Psychiatria Danubina. (2019) 31(Suppl 2):181–4. Available at: https://CRAN.R-project.org/package=pheatmap
13. Wu T, Hu E, Xu S, Chen M, Guo P, Dai Z, et al. clusterProfiler 4.0: A universal enrichment tool for interpreting omics data. Innovation (Camb) (2021) 2(3):100141. doi: 10.1016/j.xinn.2021.100141
14. Kanehisa M, Goto S. KEGG: kyoto encyclopedia of genes and genomes. Nucleic Acids Res (2000) 28(1):27–30. doi: 10.1093/nar/28.1.27
15. Szklarczyk D, Franceschini A, Wyder S, Forslund K, Heller D, Huerta-Cepas J, et al. STRING v10: protein-protein interaction networks, integrated over the tree of life. Nucleic Acids Res (2015) ;43(Database issue):D447–52. doi: 10.1093/nar/gku1003
16. Shannon P, Markiel A, Ozier O, Baliga NS, Wang JT, Ramage D, et al. Cytoscape: a software environment for integrated models of biomolecular interaction networks. Genome Res (2003) 13(11):2498–504. doi: 10.1101/gr.1239303
17. Chin C-H, Chen S-H, Wu H-H, Ho C-W, Ko M-T, Lin C-Y. cytoHubba: identifying hub objects and sub-networks from complex interactome. BMC Syst Biol (2014) 8(4):S11. doi: 10.1186/1752-0509-8-S4-S11
18. Chen Y, Wang X. miRDB: an online database for prediction of functional microRNA targets. Nucleic Acids Res (2020) 48(D1):D127–d31. doi: 10.1093/nar/gkz757
19. Huang HY, Lin YC, Li J, Huang KY, Shrestha S, Hong HC, et al. miRTarBase 2020: updates to the experimentally validated microRNA-target interaction database. Nucleic Acids Res (2020) 48(D1):D148–d54. doi: 10.1093/nar/gkz896
20. Agarwal V, Bell GW, Nam JW, Bartel DP. Predicting effective microRNA target sites in mammalian mRNAs. Elife. (2015) 4. doi: 10.7554/eLife.05005
21. Sticht C, de la Torre C, Parveen A, Gretz N. miRWalk: An online resource for prediction of microRNA binding sites. PLoS One (2018) 13(10):e0206239. doi: 10.1371/journal.pone.0206239
22. Chandrashekar DS, Bashel B, Balasubramanya SAH, Creighton CJ, Ponce-Rodriguez I, Chakravarthi B, et al. UALCAN: A portal for facilitating tumor subgroup gene expression and survival analyses. Neoplasia. (2017) 19(8):649–58. doi: 10.1016/j.neo.2017.05.002
23. Hilker R, Helenius D, Fagerlund B, Skytthe A, Christensen K, Werge TM, et al. Heritability of schizophrenia and schizophrenia spectrum based on the nationwide Danish twin register. Biol Psychiatry (2018) 83(6):492–8. doi: 10.1016/j.biopsych.2017.08.017
24. Luo W, Brouwer C. Pathview: an R/Bioconductor package for pathway-based data integration and visualization. Bioinformatics. (2013) 29(14):1830–1. doi: 10.1093/bioinformatics/btt285
25. Luo W, Friedman MS, Shedden K, Hankenson KD, Woolf PJ. GAGE: generally applicable gene set enrichment for pathway analysis. BMC Bioinf (2009) 10(1):161. doi: 10.1186/1471-2105-10-161
26. Orrico-Sánchez A, López-Lacort M, Muñoz-Quiles C, Sanfélix-Gimeno G, Díez-Domingo J. Epidemiology of schizophrenia and its management over 8-years period using real-world data in Spain. BMC Psychiatry (2020) 20(1):149. doi: 10.21105/joss.02017
27. Colaprico A, Silva TC, Olsen C, Garofano L, Cava C, Garolini D, et al. TCGAbiolinks: an R/Bioconductor package for integrative analysis of TCGA data. Nucleic Acids Res (2016) 44(8):e71. doi: 10.1093/nar/gkv1507
28. Vanevski F, Xu B. Molecular and neural bases underlying roles of BDNF in the control of body weight. Front Neurosci (2013) 7:37. doi: 10.3389/fnins.2013.00037
29. Abidin I, Eysel UT, Lessmann V, Mittmann T. Impaired GABAergic inhibition in the visual cortex of brain-derived neurotrophic factor heterozygous knockout mice. J Physiol (2008) 586(7):1885–901. doi: 10.1113/jphysiol.2007.148627
30. Wang Z, Yuan J, Li L, Yang Y, Xu X, Wang Y. Long non-coding RNA XIST exerts oncogenic functions in human glioma by targeting miR-137. Am J Trans Res (2017) 9(4):1845–55.
31. Luo X, Tu T, Zhong Y, Xu S, Chen X, Chen L, et al. CeRNA network analysis shows that lncRNA CRNDE promotes progression of glioblastoma through sponge mir-9-5p. Front Genet (2021) 12:617350. doi: 10.3389/fgene.2021.617350
32. Geng RX, Li N, Xu Y, Liu JH, Yuan FE, Sun Q, et al. Identification of core biomarkers associated with outcome in glioma: Evidence from bioinformatics analysis. Dis markers. (2018) 2018:3215958. doi: 10.1155/2018/3215958
33. Daubon T, Guyon J, Raymond AA, Dartigues B, Rudewicz J, Ezzoukhry Z, et al. The invasive proteome of glioblastoma revealed by laser-capture microdissection. Neuro-oncology Adv (2019) ;1(1):vdz029. doi: 10.1093/noajnl/vdz029
34. Ulloa F, Gonzàlez-Juncà A, Meffre D, Barrecheguren PJ, Martínez-Mármol R, Pazos I, et al. Blockade of the SNARE protein syntaxin 1 inhibits glioblastoma tumor growth. PLoS One (2015) 10(3):e0119707. doi: 10.1371/journal.pone.0119707
35. Xu XW, Yang XM, Zhao WJ, Zhou L, Li DC, Zheng YH. DNM1L, a key prognostic predictor for gastric adenocarcinoma, is involved in cell proliferation, invasion, and apoptosis. Oncol Lett (2018) 16(3):3635–41. doi: 10.3892/ol.2018.9138
Keywords: glioblastoma multiforme (GBM), ceRNA, lncRNA, miRNA, biomarker
Citation: Ghafouri-Fard S, Safarzadeh A, Mahmud Hussen B, Akhavan-Bahabadi M, Taheri M and Sharifi G (2022) In silico characterization of competing endogenous RNA network in glioblastoma multiforme with a systems biology approach. Front. Oncol. 12:1024567. doi: 10.3389/fonc.2022.1024567
Received: 21 August 2022; Accepted: 23 September 2022;
Published: 13 October 2022.
Edited by:
Shahab Uddin, Hamad Medical Corporation, QatarReviewed by:
Mohammad Imran Khan, King Abdulaziz University, Saudi ArabiaSamaneh Arab, Semnan University of Medical Sciences, Iran
Copyright © 2022 Ghafouri-Fard, Safarzadeh, Mahmud Hussen, Akhavan-Bahabadi, Taheri and Sharifi. This is an open-access article distributed under the terms of the Creative Commons Attribution License (CC BY). The use, distribution or reproduction in other forums is permitted, provided the original author(s) and the copyright owner(s) are credited and that the original publication in this journal is cited, in accordance with accepted academic practice. No use, distribution or reproduction is permitted which does not comply with these terms.
*Correspondence: Mohammad Taheri, bW9oYW1tYWQudGFoZXJpQHVuaS1qZW5hLmRl; Guive Sharifi, Z2libm93QHlhaG9vLmNvbQ==