 Qichao Yu
 Miaomiao Jiang1
 Liang Wu
95% of researchers rate our articles as excellent or good
Learn more about the work of our research integrity team to safeguard the quality of each article we publish.
Find out more
REVIEW article
Front. Oncol. , 13 October 2022
Sec. Molecular and Cellular Oncology
Volume 12 - 2022 | https://doi.org/10.3389/fonc.2022.1019111
This article is part of the Research Topic Reviews in Molecular and Cellular Oncology View all 47 articles
In recent years, spatial transcriptomics (ST) technologies have developed rapidly and have been widely used in constructing spatial tissue atlases and characterizing spatiotemporal heterogeneity of cancers. Currently, ST has been used to profile spatial heterogeneity in multiple cancer types. Besides, ST is a benefit for identifying and comprehensively understanding special spatial areas such as tumor interface and tertiary lymphoid structures (TLSs), which exhibit unique tumor microenvironments (TMEs). Therefore, ST has also shown great potential to improve pathological diagnosis and identify novel prognostic factors in cancer. This review presents recent advances and prospects of applications on cancer research based on ST technologies as well as the challenges.
Cancer is the leading cause of death worldwide (1). A series of studies have shown that high cellular heterogeneity is one of the main causes that make cancer difficult to cure (2). Therefore, it is of vital importance to characterize the heterogeneity of tumor. Single-cell sequencing technologies, especially single-cell RNA sequencing (scRNA-seq), provides useful tools for uncovering cellular heterogeneity (3–6). However, they always lose spatial histology information while cell dissociation, hence difficult to characterize spatial cellular interactions and organization of tumors.
The spatial structure of tumors is closely related to tumorigenesis, progression, and treatment response. Histologically similar tumors from different regions are molecularly distinct and have different tumorigenicities, showing the association of tumor initiation and the spatial location (7). In addition, spatially adjacent cells have stronger interactions, which could functionally remodel the TME and promote tumor progression (8, 9) and evolution (10). The tumor cells at different positions may exhibit heterogeneous metastatic potential (5), while the site of lymphocyte infiltration usually indicates specific treatment response (11). Scientists have used immunohistochemistry (IHC) and immunofluorescence (IF) staining etc. technologies to locate the cells and proteins in flash-frozen or formalin fixed paraffin-embedded (FFPE) tissue sections. However, these approaches are low-throughput and can only label limited number of pre-selected proteins in a specific section, thus incapable of discovering the distribution of novel proteins or cell types. By contrast, ST technologies have much higher throughput and can capture the whole transcriptome, showing its power in constructing spatial cell atlas in embryo, brain, heart, etc. (12). In the meanwhile, an increasing number of studies used ST to profile spatial heterogeneity of cancers (13, 14). Currently, ST has been used to distinguish tumor and non-tumor tissues, special spatial areas such as tumor interface and tertiary lymphoid structures (TLSs) (15–17), and identify spatial-specific prognostic factors in cancer (18, 19).
In this article, we first made a brief introduction of ST techniques, and reviewed recent studies on cancer research using ST. Then, we proposed our insights into the challenges and prospects of applying ST into cancer research.
ST technology could be divided into two main categories according to detection methods, including imaging-based methods and sequencing-based methods (20). Imaging-based ST methods consist of in situ hybridization (ISH) and in situ sequencing (ISS) (Table 1). In ISH, RNA molecules from individual parts (or cells) within the tissue were achieved by hybridizing a labeled probe complementary to the target of interest. This technique was first used for visualizing gene expression in 1982 (21). Single-molecule RNA fluorescence in situ hybridization (smFISH) has a stronger and more robust signal compared with initial ISH (22). Afterwards, seqFISH (23), seqFISH+ (24), multiplexed error-robust FISH (MERFISH) (25), MERFISH+ (26) et al. further improved smFISH in the aspect of target throughput. Nevertheless, ISH-based methods are not transcriptome-wide, which always need prior knowledge to design probes and obstruct comprehensive expression analysis in a single experiment (27–29). In ISS, RNA molecules from a cell are sequenced directly in its tissue context. The first ISS technique was published in 2013, using padlock probes to target known genes (30). Later, BaristaSeq (31) and STARmap (32) improved sensitivity and/or number of detected genes. In short, most ISS-based ST techniques have subcellular resolution. However, they usually have a limited number of targeted genes or low detection efficiency (33), thus restricting their applications in the specific scenarios (Table 1).
The sequencing-based ST techniques include laser capture microdissection (LCM)-based methods and in situ barcoding (ISB)-based methods (Table 1). LCM-based methods, such as geographical position sequencing (Geo-seq) (34), TIVA (35) and NICHE-seq (36), utilize a laser beam to cut out specific tissue regions identified under a microscope (37, 38). Compared with initial LCM method, Geo-seq improved sensitivity but with lower resolution. TIVA can be performed on live cells but with low throughput, while NICHE-seq has higher throughput but not applicable to human samples. Generally, LCM-based ST techniques are labor-intensive and low-throughput, thus inapplicable of processing samples in batches. ISB-based ST techniques capture RNA molecules in situ, then perform cDNA sequencing ex situ. In terms of barcoding, it can be subdivided into two groups. The first group uses solid phase-based capture (SPBC) methods (13), and the tissue is transferred to a substrate bearing a pre-arranged set of DNA barcodes, which includes 10x Genomics Visium (39), Slide-seq (40), Slide-seq2 (41), HDST (42), Stereo-seq (43) etc. The second group, including NanoString digital spatial profiling (DSP) (44) and ZipSeq (45), uses selective barcoding methods, which means DNA barcodes are either collected from or delivered to selected tissue locations. ISB-based ST techniques have been used to study mouse olfactory bulb, gingival tissue, adult human heart tissue as well as multiple cancers (12). Most ISB-based techniques are transcriptome-wide with relative higher throughput, and some of them have subcellular resolution including Seq-Scope (46), HDST (42), APEX-seq (47), PIXEL-seq (48) and Stereo-seq (43) etc.

Table 1 Current ST technologies.
Apart from the above-mentioned two ST categories, there also exists bioinformatic methods for reconstructing spatial positions of cells using scRNA-seq data. For example, novoSpaRc allows for de novo spatial reconstruction of single-cell gene expression with no inherent dependence on any prior information (49). Though many tools are available for the reconstruction of spatial positions of cells currently, their effectiveness remains to be validated in the future (50).
Tumor tissues roughly consist of various cell types, including tumor cells, stromal cells, and immune cells (51) (Figure 1A). The differential cell composition induces the diversity and heterogeneity of TME. The heterogeneity confers different abilities of proliferation, immune resistance, immune escape, and survival etc. on tumor cells, which is reflected in many aspects, such as cell composition, gene expression pattern and cell spatial positions. Thus, tumor cells can be divided into several subpopulations in terms of genotype, phenotype, or spatial position.
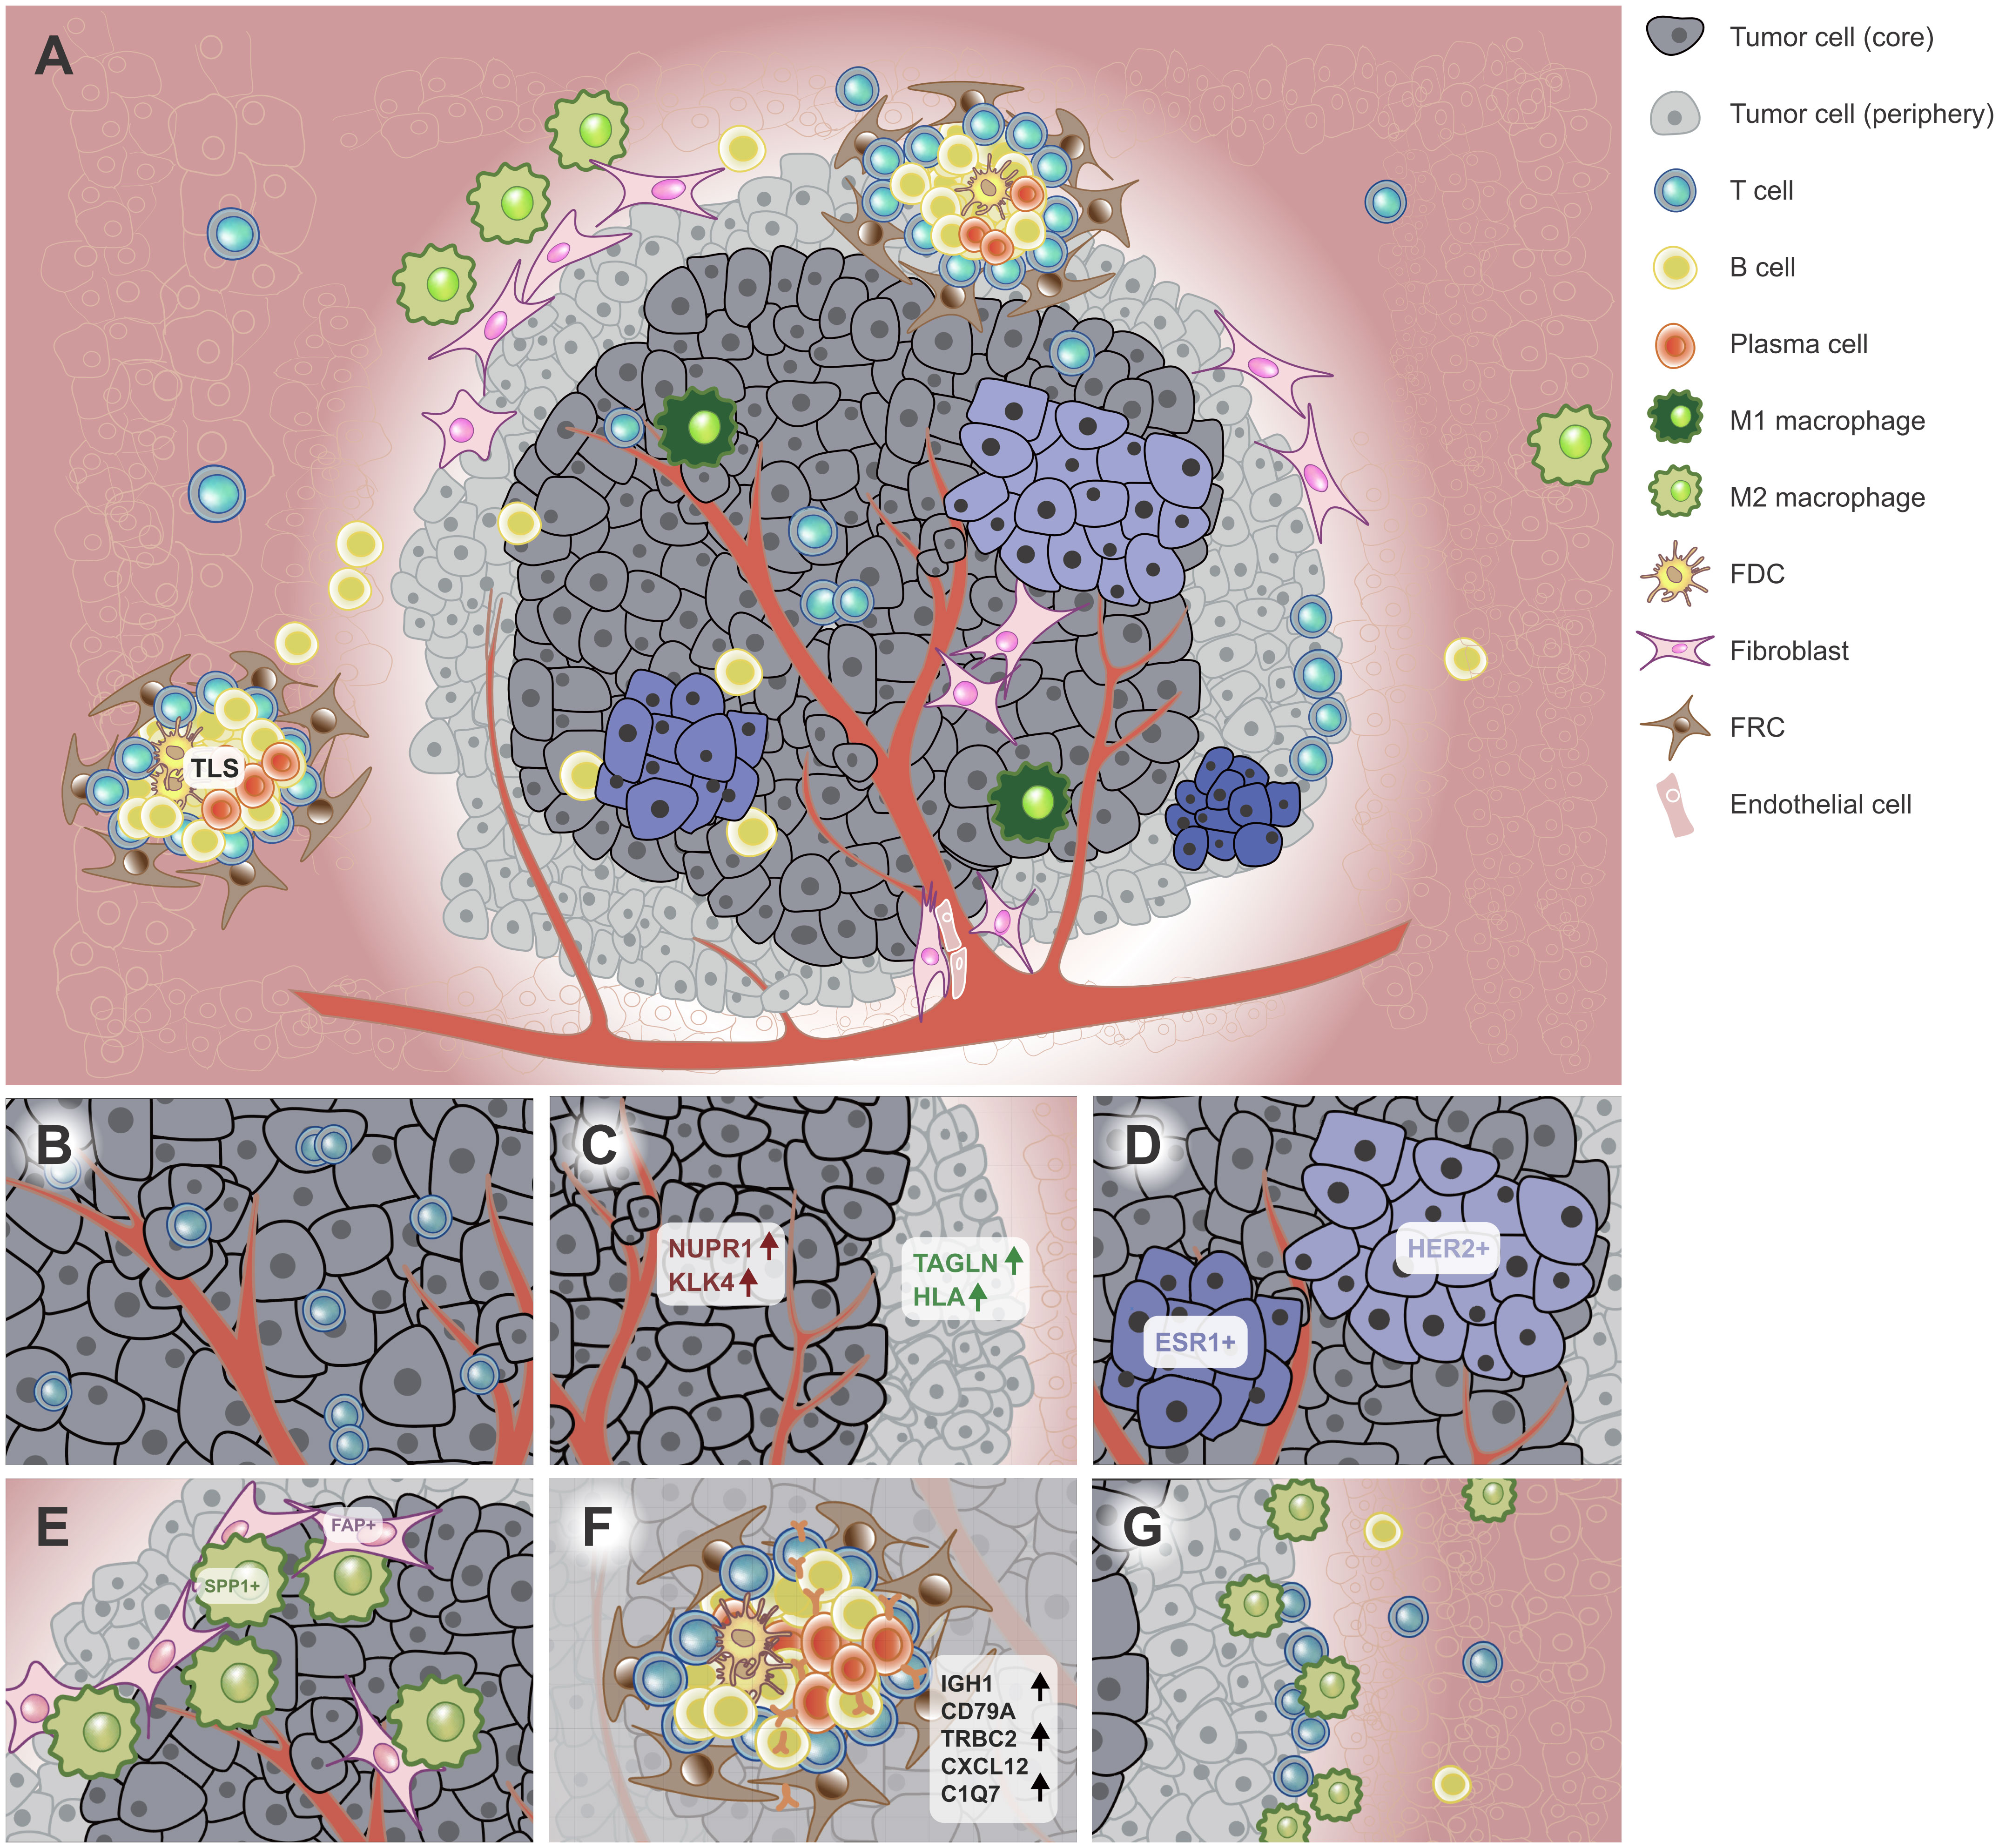
Figure 1 Spatial heterogeneity of the tumor. (A) ST techniques have been used to characterize the spatial architecture of tumors. For example, the tumor core (dark grey) and periphery (light grey) have different tumor cell subpopulations (light bule to dark blue). The TLS was found in or near the tumor, which aggregates diverse lymphoid cells. (B) CDH12+ tumor epithelial cells colocalized with exhausted CD8+ T cells in bladder cancer. (C) The tumor core and periphery had different signature genes in PC. (D) HER2+ and ESR1+ breast tumor subclones had mutually exclusive localizations in BC. (E) Tumor-specific FAP+ fibroblasts and SPP1+ macrophages colocalized in the CRC tissue. (F) TLSs have specific cell composition and signature genes. (G) The tumor interface has unique TME. Immune cells such as macrophages and NK/T cells were recruited to the interface and the region nearer to the interface enriched more immune cells in ICC. FDC, follicular dendritic cell; FRC, follicular reticular cell. PC, prostatic cancer. CRC, colorectal cancer. TME, tumor microenvironment. ICC, intrahepatic cholangiocarcinoma. BC, breast cancer. TLS, tertiary lymphoid structure.
Currently, neoplastic spatial heterogeneity has been reported in multiple malignant tumors, such as invasive micropapillary carcinoma (IMPC), gastric cancer (GC), glioblastoma (GBM), primary liver cancer and melanoma (19, 52–55) (Table 2). For instance, ERBB2, the receptor of HER2, differentially expressed in multiple tumor areas on the same ST slide (15). Further analysis showed these differentially expressed genes (DEGs) were associated with immune response, mitogenic programs and tumor invasion pathways, suggesting different areas may have differential abilities on tumor progression, invasion and immune resistance (39). Additionally, certain stress may induce certain new cell populations, which adapt to the specific TME. For instance, a functional subgroup was found in mouse pancreatic cancer model in a hypoxic microenvironment. Furthermore, the hypoxia-induced tumor tissues had less subpopulations and simplified functions (53). Intriguingly, though tumor cell subpopulations are spatially heterogeneous on the same slide, the transcriptional profile of each subpopulation is probably recurrent across tumor slides. Further analysis revealed these transcriptional programs were independent of cell-cycle states, thereinto reactive-hypoxia was associated with chromosomal alterations, indicating potential connection with genome instability (56). Moreover, tumor epithelial cells also exhibited specific colocalization with immune cell subpopulations (57, 58). In bladder cancer, CDH12+ epithelial cells colocalized with exhausted CD8+ T cells (57) (Figure 1B). In breast cancer (BC), tumor epithelial cells were negatively correlated with cancer-associated fibroblasts (CAFs), endothelial cells, B cells etc. (15). In sum, the diverse colocalization of tumor cell and other cell types inflects potential cell-cell interactions and the complex TME in tumors.
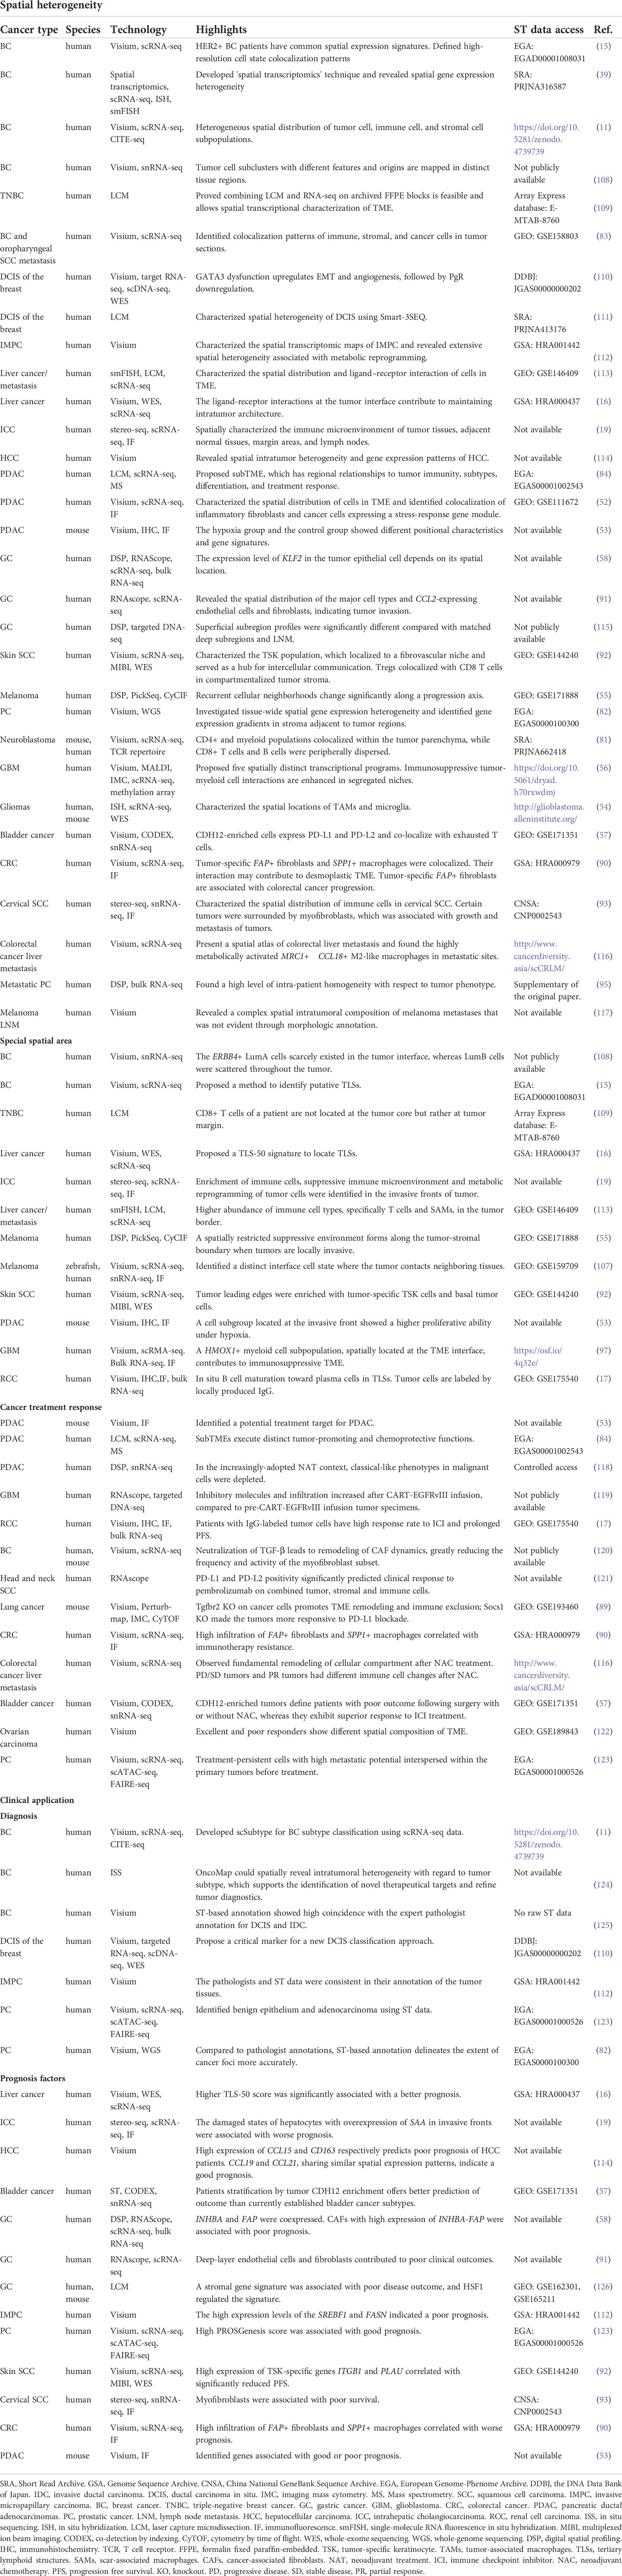
Table 2 ST-based cancer studies.
Tumor cells also showed different gene expression profiles in tumor core and periphery. Compared with tumor core, the tumor peripheral area is nearer to adjacent normal tissues, thus it has different TME (Figure 1A). In a neuroblastoma mouse model, a tumor cell cluster, which was most enriched at the tumor core, expressed more cancer-associated genes than that dispersed all over the tumor area (81). In prostatic cancer (PC), TAGLN (tumor suppressor) and HLA had higher expression in the periphery, whereas NUPR1 and KLK4 etc. were expressed higher in the tumor core (82) (Figure 1C). These findings jointly indicate the tumor core probably is more malignant than the periphery.
A series of ST-based studies showed tumor subpopulations are spatially mutually exclusive on the same slide (Figure 1A). In BC, the tumor area with high signatures of epithelial-mesenchymal transition (EMT), interferon (IFN) and major histocompatibility complex (MHC) was negatively correlated with that with high signature of proliferation (11). Another study revealed HER2+ and ESR1+ breast tumor clones had mutually exclusive localizations (83) (Figure 1D). In primary pancreatic ductal adenocarcinomas (PDAC), TM4SF1+ tumor cells had mutually exclusive spatial locations with S100A4+ tumor cells (52). Another study identified three recurrent sub-TME phenotypes within the same tumor tissue in PDAC, which also showed clear boundaries with each other (84). The mutually exclusive locations of tumor cell subpopulations suggest different clonal origins and potential competition across tumor areas (39).
The stromal cell is an important component of TME, which is associated with tumor growth, progression, immunosuppression and metastasis (85–89). ST has uncovered a series of spatial distribution preference of stromal cells in TME. For example, in a lung cancer mouse model, loss of Tgfbr2 resulted in a remodeling of the stroma and induced tumor development (89).
Among stromal cells, fibroblasts showed the most prominent spatial colocalization features in multiple cancer types. In bladder cancer, fibroblasts were observed resided in close proximity to CDH12+ epithelial cells (57). In colorectal cancer (CRC), tumor-specific FAP+ fibroblasts and SPP1+ macrophages colocalized in the tumor area, which were proved contributed to desmoplastic TME (90) (Figure 1E). In PDAC, fibroblasts and terminal ductal cell populations were significant enrichment in tumor areas, suggesting ductal cells in the cancer region may express hypoxia-response genes due to low oxygen content. In diffuse-type GC, CCL2+ fibroblasts and endothelial cells were enriched in the deep invasive layer of GC compared with the superficial layer, suggesting a greater ability of tumor invasion (91). In addition, CAFs also exhibited well-preserved colocalization patterns with endothelial cells and perivascular cells (15), which is consistent with a previous study in cutaneous squamous cell carcinoma SCC (92). Interestingly, in cervical SCC, CAFs were enriched around certain tumor areas. Compared with tumors without surrounded by CAFs, CAF-surrounded tumors were more active in metabolism and cell growth and downregulated cellular adhesion, apoptosis, and immune response, suggesting a supportive TME for tumor progression and metastasis (93). On the other hand, fibroblast subpopulations may have mutually exclusive locations. For example, Wu et al. found spatially negative correlation between myofibroblast-like CAFs and inflammatory-like CAFs in estrogen receptor positive and triple-negative breast cancer (TNBC) samples (11). This finding was also observed in a HER2+ breast tumor dataset, suggesting a conserved relationship across BC subtypes (15).
The immune cell infiltration is frequently observed in tumor tissues, which is closely associated with treatment response (94). However, not all immune cells can infiltrate into tumors (81), especially in metastases (95). ST-based studies have shown the immune cell has a specific preference on the spatial distribution as well. For instance, in a lung cancer mouse model, immune cells were more concentrated in the outer area of tumors, particularly CD4+ and CD11c+ cells. Intriguingly, when Irf1 or Socs1 was knocked out, immune cells were scattered throughout the tumor (89). As we know, macrophages can be roughly divided into M1 macrophage and M2 macrophage in terms of encouraging or decreasing inflammation (96). M1-like macrophage and M2-like macrophage appeared to have mutually exclusive locations in PDAC. Of note, a M2-like macrophage subpopulation was observed colocalized with proliferating cancer cells (83, 90). The M2-like macrophages were most enriched in the ducts, whereas the M1 macrophage were enriched in the stroma and cancer regions (52). Similarly, in BC, two macrophage subpopulations, which were outside of the conventional M1/M2 classification, displayed a modest negative spatial correlation (11). In addition, macrophage subpopulations also colocalized with T cell subpopulations in BC and neuroblastoma (15, 81). Further analysis revealed the colocalization might be associated with immune activation and tumorigenesis. In GBM, the colocalization of immune cells and stromal cell subpopulation was associated with immunosuppressive microenvironment (54, 97). Additionally, the presence of certain tissues may also influence the distribution of T cell subtypes. In liver cancer, intact continuous fibrous capsule indicated significant decrease of exhausted T cells and downregulated immune checkpoint genes, suggesting it may act as a barrier preventing the infiltration of immune cells (16). In addition, SPP1+ tumor-associated macrophages (TAMs) were colocalized with proliferating cancer cells (83), which is consistent with a recent study in CRC (90).
TLSs, sometimes also known as tertiary lymphoid organs or ectopic lymphoid structures, are organized aggregates of lymphoid cells that arise postnatally in nonlymphoid tissues, such as tissues subjected to chronic inflammation and cancers (98). They are characterized by an inner zone of CD20+ follicular B cells surrounded by CD3+ T cells. Recently, more evidence supported the important function of TLS in delaying or promoting cancer progression (98–100).
TLS was mostly found in para-tumor tissues (16). However, it also exists in tumor, leading-edge and para-tumor areas (19, 98) (Figure 1A). Previous studies generally identify TLS by multiple IHC or multiplex IF staining (101–103), which is accurate but labor-consuming and low-throughput. Mature TLSs are characterized by the presence of a germinal center containing T follicular helper (Tfh) cells and follicular dendritic cells in close contact with B cells (104). TLS could be identified by certain gene signatures or cell population aggregates using ST (Figure 1F; Table 2). For example, in BC, Andersson et al. evaluated the degree of B- and T-cell colocalization by spot deconvolution, ergo potentially constituting parts of a TLS which they called TL-like structure. At last, they proposed a TLS signature with 171 genes for TLS prediction (15). In renal cell carcinoma (RCC), Meylan et al. proposed a TLS signature with 29 genes (17). A similar gene signature was also proposed in liver cancer (16). Of note, in BC, researchers found a negative correlation between B cells and plasma cells, and colocalization of B cells and T cells (15), which probably suggested the presence of TLS.
The tumor interface, the invasion front for tumor cells to expand, is a critical region to uncover the tumor invasion and progression (5, 105–107). The intermediate zone between the tumor tissue and the non-tumor tissue has unique microenvironment, thus existing unique characteristics in cell-cell interaction, cell composition and immune states (Table 2).
The tumor interface exhibits a transitional state between the tumor and adjacent non-tumor tissues. In a zebrafish model of melanoma, a distinct cell cluster at the interface was found histologically resembled the microenvironment, but transcriptionally resembled tumor, and may function as a bridge for interaction between tumor and neighboring tissues (107). This unique interface was also observed in human melanoma (107). In primary liver cancer, PROM1+ and CD47+ cancer stem cell (CSC), which was scattered in tumor areas, was found to be gradually increased from leading-edge to tumor to portal vein tumor thrombus, and closely related to TME remodeling and tumor metastasis. The unique metabolic features at the interface, where may occur sudden decrease or increase of certain hallmark pathways, suggest it may serve as a buffer between tumor and normal regions (16).
The tumor interface has specific cell compositions. In cutaneous SCC, a tumor-specific keratinocyte (TSK) subpopulation located at the leading edges functioned as a hub for intercellular communication, which is probably due to short distance between the interface and tumor or normal tissues (92). In BC, LumA tumor cells scarcely existed in the interface of tumor, whereas LumB cells were scattered throughout the tumor tissue, suggesting heterogeneous spatial distribution of tumor cell subpopulations (108). In a mouse pancreatic cancer model, a tumor cell cluster upregulated LDHA (a hypoxia-related gene) in the interface area compared with that in the tumor center and had stronger ability for survival and invasion (53).
The tumor interface has unique immunosuppressive TME as well. In intrahepatic cholangiocarcinoma (ICC), macrophage and NK/T cells were enriched close to the boundaries. Of note, immune cells were recruited to the borderline from the tumor side, and the region nearer to the borderline enriched more immune cells, showing the heterogeneous distribution of immune cells in both the axial and lateral directions (Figure 1G). Additionally, immune checkpoint genes such as BTLA, CTLA4, CD96 and IDO1 were enriched on the tumor side of the interface (19, 113). Similar aggregation of macrophage subpopulations and T cells was also reported in ICC metastases (113). In GBM, a subset of IL-10-releasing HMOX1+ myeloid cells were identified in the direct neighborhood of mesenchymal-like tumor regions, which drove T cell exhaustion and thus facilitated the immunosuppressive TME (97). In TNBC, a CD8+ T cell population was identified at the interface instead of tumor core, but their functions need further elucidation (109).
It is very important to predict the response of cancer patients for specific cancer therapy clinically. However, it is quite difficult due to complex tumor heterogeneity (2, 123). ScRNA-seq has revealed specific cell components could influence treatment response in diverse cancers (127). ST further revealed the specific spatial aggregation and cell-cell interactions of certain cell subpopulations could induce differential treatment responses. For instance, the TLS, which aggregates immune cells in or near the tumor, provides a niche that promotes in situ B cells maturation toward plasma cells in RCC (17). These plasma cells disseminate into the tumor tissue and can produce IgG. The tumors with high percentages of IgG-labeled tumor cells were more infiltrated with CD68+ macrophages, which is one of the main effectors of antibody-dependent cellular cytotoxicity (17). This process may promote immunoreactivity and results in better response to ICI treatment. Additionally, the tumor invasive front was found enriched with specific cell subpopulations, which differ in metabolic states and functions from those elsewhere. SAA+ hepatocyte subpopulations near the invasive front are associated with recruitment of M2-like macrophages in ICC, which may form a niche with impaired immune response and promote further tumor invasion and a worse treatment response (19). Moreover, ST also uncovered the connection between specific cell-cell interaction and treatment response. Most FAP+ fibroblasts and SPP1+ macrophages were colocalized in CRC (90, 121). These FAP+ fibroblasts enhanced the recruitment and the proinflammatory activity of SPP1+ macrophages through WNT5A-FZD2 pairs and the expression of TGF-β superfamily genes (immunosuppressive molecules) etc., respectively. In addition, FAP+ fibroblasts and SPP1+ macrophages upregulated genes of extracellular matrix (ECM)-related pathways, suggesting their role in facilitating the generation of desmoplastic structures, which further limited the immune cell infiltration and induced diminished ICI treatment response (90, 121). Interestingly, the interaction of macrophage subpopulations also affects the treatment response in colorectal cancer liver metastasis (116).
The IHC technique has long been used by physicians and pathologist to diagnose a tissue as benign or malignant, determine the grade and stage of a tumor, identify the cancer cell types, and find the origin of metastasis (128–130). Compared with IHC- and IF-based methods, ST has comparable resolution and is almost transcriptome wide, indicating an enormous potential in cancer pathology (20, 131). Through spot deconvolution and prior cell marker genes, researchers can estimate the cell composition of spots and further divide the ST sections into several spatially different areas i.e., tumor area, tumor leading-edge area and para-tumor area. Several pilot studies have shown ST-based pathological annotations displayed comparable or even higher accuracy than that from pathologists (38, 82, 110, 112, 123) (Table 2). Moreover, ST can distinguish cancer subtypes as well (108). For example, Svedlund et al. developed an ISS-based tool called OncoMaps for identification of BC subtypes and predicting recurrence risk (124). Yoosuf et al. trained a machine learning model based on the expert annotation of hematoxylin and eosin (H&E)-stained images and ST data to classify BC tissues into non-malignant, ductal carcinoma in situ (DCIS) and invasive ductal carcinoma (IDC) regions with precision up to 96 – 100%. This classification method may provide clinical support for pathologists in the future (125).
Prognostic factors can indicate the clinical outcomes of various kinds of diseases (132) (Table 2). Currently, three kinds of prognostic factors identified by ST have been reported in multiple cancer types. The first is gene markers. In melanoma, in the tumor compartment, high expression levels of CD8, CD3, TIM3, IDO1 etc. suggested longer progression free survival (PFS), whereas high levels of B2M and PD-L1 in macrophage compartment were associated with longer overall survival (OS) (18). In ICC, hepatocytes close to invasive fronts with high expression level of SAA1 and SAA2 were correlated with worse prognoses (19). Moreover, many gene markers were identified in PDAC, liver cancer, BC, bladder cancer, SCC and GC (53, 92, 112, 114, 121, 126, 133). Cell subpopulations were also potential markers of prognosis. For example, CCL2+ endothelial cells and fibroblasts in the deep invasive layer were associated with poor clinical outcomes (91). Similarly, in bladder cancer, CDH12+ epithelial cell was associated with poor prognosis (57). Additionally, FAP+ and INHBA+ CAFs, and high expression of HSF1 were reported negatively correlated with survival in GC (58, 126). In glioma, blood-derived TAMs indicated poor prognosis (54). A gene signature usually consists of tens to hundreds of genes, which can serve as a prognostic factor as well. For instance, in PC, Taavitsainen et al. proposed a gene signature called PROSGenesis score and further demonstrated high PROSGenesis score was associated with good prognosis (123). In HCC, Wu et al. proposed high TLS-50 signature score was associated with good prognosis (16). Unsurprisingly, higher CAF signature predicted unfavourable PFS and OS in cervical SCC (93) and GC (126).
ST has displayed its advantages in characterizing tumor heterogeneity in gene expression patterns and cell compositions, and potential in clinical studies (12, 134). Though powerful, the cost will limit its wide application. More importantly, two aspects of technical issues also need to concern.
On the one hand, the performance and applicability of ST need to be further improved. First, the detection efficiency of ST is relatively low compared with scRNA-seq (29), which can hardly capture RNA molecules with low expression levels, leading to missing of potential genes that play a role in tumor progression, metastasis, or relapse. Since for most high-resolution SPBC techniques, the area with barcode to capture molecules is less than 30%, thus more than 70% of the mRNA molecules will be missing. Second, most ST approaches only obtain single-end transcripts instead of the full-length transcripts. Thus, it is hard to investigate immune cell receptor repertoires and alternative splicing events, which are important for cancer research. Furthermore, full-length transcripts will make it possible for variant calling across the transcriptome and differential expression analysis at the isoform level as well (135). Third, ST is not exactly suitable for FFPE samples. FFPE tissue blocks, which are the gold standard method of preservation of human tissue for diagnosis, are usually stored for a long time. Consequently, RNA molecules in these blocks are often degraded seriously, hence it is a great challenge to utilize these samples. NanoString DSP and 10x Genomics Visium have shown their compatibility for FFPE tissue blocks (17, 18, 136). However, the quality of data probably varies with specific samples and is much lower than using the fresh one.
On the other hand, the bioinformatic tools for ST data analysis do not meet current needs. Generally, extracting valuable information from raw ST data requires several steps of data processing, including imaging processing, reads mapping, gene expression mapping, followed by downstream analysis such as spot deconvolution, clustering, detection of spatially variable genes, cellular interaction inference, and trajectory inference et al. (137) (Supplementary Table 1). Some of these steps, such as deconvolution and clustering, are also frequently used in bulk RNA-seq and/or scRNA-seq data processing, hence many tools initially designed for RNA-seq or scRNA-seq are compatible with ST data. However, their power will unavoidably decrease due to neglect of spatial location and data structure features (50). Thus, it is essential to take features exclusive to ST data into consideration. First, for ST with multicellular resolution, there are plenty of tools for deconvolution of spots, such as SPOTLight (138), SpatialDWLS (139), CARD (140) and Stdeconvolve (141) etc., yet it is difficult to affirm the precise number of cells within a spot but for H&E-stained images. In addition, for ST with subcellular resolution such as HDST (42) and Stereo-seq (43), few tools could identify the individual cell by merging multiple adjacent spots. To distinguish an individual cell from ST is quite important if we want to make full use of this ultra-high-resolution technology. Second, tools for integrating spatial data from multiple batches, platforms, omics, and species are scanty. In this aspect, Spacemake (142), BASS (143) and MAPLE (144) claimed their capacity of multi-platform data integration of ST, but it is essential to further confirm their effectiveness.
Previous studies have shown the prevalent existence of heterogeneity in genomics, transcriptomics, proteomics, and epigenomics (145). However, single-omics technology can only profile the tumor heterogeneity from a specific angle, which ineluctably loses a large amount of information about the other omics. To handle this problem, scientists have developed a series of multi-omics techniques parallel sequencing of single-cell genomes and transcriptomes (146–152). At present, spatial multi-omics technology such as MOSAICA (153), DbiT-Seq (154), SM-Omics (155), NanoString CosMx™ SMI platform (156) and spatial protein and transcriptome sequencing (SPOTS) (157) etc., can quantify the transcriptome and multiple proteins and retain the spatial coordinates. The multi-modal spatial genomics approach provides a promising platform for studying the intrinsic and extrinsic factors contributing to spatial heterogeneity in gene expression and genomic variants (158). Currently, spatial multi-omics has been used in cancer research (41). Another study tried to integrate protein subcellular localization, affinity proteomics, mass spectrometry (MS) data sets and RNA-seq information in a human lymphoma cell line. Their work helps to deepen the knowledge on the architecture of the cells and the complexity of cancer heterogeneity (159). In sum, multi-omics technology has shown its unprecedented value in cancer biology.
ST techniques have ultrahigh resolution and retain the spatial information of genes and cells, which make them capable of solving many outstanding biological questions. As we know, most current ST can only display gene expression profile and organization of cells on the plane, which is two-dimensional, and does not truly recapitulate the spatial, cellular, and chemical environment of highly complex tumors and their stroma (160). The real spatial atlas should be three-dimensional (3D), which can restore the most realistic spatial environment of cells in tumors, and further provides a more precise atlas and solid basis for research on the mechanism of tumorigenesis and progression, cancer heterogeneity, and clinical applications. Currently, there are bioinformatic tools for reconstruction of 3D ST atlas using multiple sequential adjacent slices and the 3D architecture of human heart (161), cardiac organoid (162), and mouse brain (163, 164) etc. have been reconstructed (Supplementary Table 1). However, few studies characterized the 3D structure of tumor tissues (165). We believe the reconstruction and characterization of the 3D architecture of tumors based on ST will revolutionize our knowledge of cancer. In addition, ST may shed light on the role of organelles in cancer. Compared with normal cells, cancer cells display alterations in energy metabolism, which are closely associated with mitochondrial activities (166). Subcellular ST techniques could help to precisely locate the genes that involve in the abnormal energy metabolism and further reveal the mechanism of how they contribute to cancer growth. Previous research also revealed lysosomal related to the dysregulation of tumorigenesis-associated pathways in cancer (166). Interestingly, the intracellular positioning of lysosomes has close connection with the function of cells. For example, the lysosomal subpopulations at the edges of the cancer cell could regulate cell adhesion, exocytosis, and invasion (167). However, it is not clear how the spatial position affects the functions of lysosomes. In this respect, ST techniques such as APEX-seq (47), show great potential for discovering the genes and pathways involved in the functional transition within the organelle. Moreover, ST also shows great potential in premalignant disease research. Currently, the aggressiveness of a premalignant lesion is primarily evaluated by cell morphology (168). However, cell morphology alone is not always sufficient for predicting the evolutionary trajectory of a premalignant lesion. ST remains spatial information as morphology, and it has higher resolution and could predict the differentiation directions of tumor cells based on gene expression profiles and splicing events (169, 170). The additional information provided by ST allows it to identify the precancerous lesions more accurately.
Tumorigenesis, tumor progression and metastasis usually accompany with genomic, transcriptomic, and metabolic changes, which can serve as a basis for diagnosis and identification of subtypes of cancer (171, 172). Recent studies proved ST could obtain these variations (16, 56, 172–175), suggesting ST has great potential in cancer clinical application, especially for digital pathology (DP). In addition, the combination of ST and other information, i.e. pathological imageology and spatial proteasome, may bring new insights into DP (176).
Currently, there are two major kinds of ST techniques in term of the experimental principle, thereinto ISB-based ST technique is among the most promising one due to high resolution and throughput, as well as the ability of whole transcriptome profiling. ST has shown its power in characterizing spatial heterogeneity and clinical applications in cancer. Researchers have profiled the TME in PDAC, BC, CRC, GC, PC, lung cancer, liver cancer, skin cancer, gliomas etc. based on ST. In addition, an increasing number of studies have shown the strength of ST in pathological diagnosis. Many novel potential prognostic markers were also discovered recently. These results jointly suggest ST is a promising technology for comprehensively elucidating spatial heterogeneity, discovering specific spatial structures in tumor tissues as well as for applications in clinical such as pathological diagnosis and prognostic prediction.
With the development of ST techniques and matched bioinformatic tools, the challenge in cost, sensitivity, and automation will be overcome in a few years. In addition, spatial multi-omics technology further integrates transcriptome with other omics such as proteomics, providing more comprehensive landscape of cancer, which may revolutionize our knowledge on cancer. In conclusion, ST technology is progressing rapidly, and it is promising for cancer research and clinical application.
QY collected the related papers, drafted, and revised the manuscript. LW designed the review and helped to draft and revise the manuscript. MJ prepared the figure and the tables, and participated in the discussion of revision. All authors contributed to the article and approved the submitted version.
This project was supported by grants from Shenzhen Key Laboratory of Single-Cell Omics (NO. ZDSYS20190902093613831), Guangdong-Hong Kong Joint Laboratory on Immunological and Genetic Kidney Diseases (NO. 2019B121205005), and Guangdong Basic and Applied Basic Research Foundation (NO. 2021A1515110832).
We thank Dr. Pengfei Qin for constructive advice on this work.
The authors declare that the research was conducted in the absence of any commercial or financial relationships that could be construed as a potential conflict of interest.
All claims expressed in this article are solely those of the authors and do not necessarily represent those of their affiliated organizations, or those of the publisher, the editors and the reviewers. Any product that may be evaluated in this article, or claim that may be made by its manufacturer, is not guaranteed or endorsed by the publisher.
The Supplementary Material for this article can be found online at: https://www.frontiersin.org/articles/10.3389/fonc.2022.1019111/full#supplementary-material
1. Sung H, Ferlay J, Siegel RL, Laversanne M, Soerjomataram I, Jemal A, et al. Global Cancer Statistics 2020: Globocan Estimates of Incidence and Mortality Worldwide for 36 Cancers in 185 Countries. CA Cancer J Clin (2021) 71(3):209–49. doi: 10.3322/caac.21660
2. Dagogo-Jack I, Shaw AT. Tumour Heterogeneity and Resistance to Cancer Therapies. Nat Rev Clin Oncol (2018) 15(2):81–94. doi: 10.1038/nrclinonc.2017.166
3. Patel AP, Tirosh I, Trombetta JJ, Shalek AK, Gillespie SM, Wakimoto H, et al. Single-Cell Rna-Seq Highlights Intratumoral Heterogeneity in Primary Glioblastoma. Science (2014) 344(6190):1396–401. doi: 10.1126/science.1254257
4. Gohil SH, Iorgulescu JB, Braun DA, Keskin DB, Livak KJ. Applying High-Dimensional Single-Cell Technologies to the Analysis of Cancer Immunotherapy. Nat Rev Clin Oncol (2021) 18(4):244–56. doi: 10.1038/s41571-020-00449-x
5. Puram SV, Tirosh I, Parikh AS, Patel AP, Yizhak K, Gillespie S, et al. Single-Cell Transcriptomic Analysis of Primary and Metastatic Tumor Ecosystems in Head and Neck Cancer. Cell (2017) 171(7):1611–24 e24. doi: 10.1016/j.cell.2017.10.044
6. Tellez-Gabriel M, Ory B, Lamoureux F, Heymann MF, Heymann D. Tumour Heterogeneity: The Key Advantages of Single-Cell Analysis. Int J Mol Sci (2016) 17(12):1–19. doi: 10.3390/ijms17122142
7. Gilbertson RJ, Gutmann DH. Tumorigenesis in the Brain: Location, Location, Location. Cancer Res (2007) 67(12):5579–82. doi: 10.1158/0008-5472.CAN-07-0760
8. Phuengkham H, Ren L, Shin IW, Lim YT. Nanoengineered Immune Niches for Reprogramming the Immunosuppressive Tumor Microenvironment and Enhancing Cancer Immunotherapy. Adv Mater (2019) 31(34):1–21. doi: 10.1002/adma.201803322
9. Kim J. Regulation of Immune Cell Functions by Metabolic Reprogramming. J Immunol Res (2018) 2018:1–12. doi: 10.1155/2018/8605471
10. Noble R, Burri D, Le Sueur C, Lemant J, Viossat Y, Kather JN, et al. Spatial Structure Governs the Mode of Tumour Evolution. Nat Ecol Evol (2022) 6(2):207–17. doi: 10.1038/s41559-021-01615-9
11. Wu SZ, Al-Eryani G, Roden DL, Junankar S, Harvey K, Andersson A, et al. A Single-Cell and Spatially Resolved Atlas of Human Breast Cancers. Nat Genet (2021) 53(9):1334–47. doi: 10.1038/s41588-021-00911-1
12. Zhang L, Chen D, Song D, Liu X, Zhang Y, Xu X, et al. Clinical and Translational Values of Spatial Transcriptomics. Signal Transduct Target Ther (2022) 7(1):111. doi: 10.1038/s41392-022-00960-w
13. Zheng B, Fang L. Spatially Resolved Transcriptomics Provide a New Method for Cancer Research. J Exp Clin Cancer Res (2022) 41(1):179. doi: 10.1186/s13046-022-02385-3
14. Maniatis S, Petrescu J, Phatnani H. Spatially Resolved Transcriptomics and Its Applications in Cancer. Curr Opin Genet Dev (2021) 66:70–7. doi: 10.1016/j.gde.2020.12.002
15. Andersson A, Larsson L, Stenbeck L, Salmen F, Ehinger A, Wu SZ, et al. Spatial Deconvolution of Her2-Positive Breast Cancer Delineates Tumor-Associated Cell Type Interactions. Nat Commun (2021) 12(1):6012. doi: 10.1038/s41467-021-26271-2
16. Wu R, Guo W, Qiu X, Wang S, Sui C, Lian Q, et al. Comprehensive Analysis of Spatial Architecture in Primary Liver Cancer. Sci Adv (2021) 7(51):eabg3750. doi: 10.1126/sciadv.abg3750
17. Meylan M, Petitprez F, Becht E, Bougouin A, Pupier G, Calvez A, et al. Tertiary Lymphoid Structures Generate and Propagate Anti-Tumor Antibody-Producing Plasma Cells in Renal Cell Cancer. Immunity (2022) 55(3):527–41.e5. doi: 10.1016/j.immuni.2022.02.001
18. Toki MI, Merritt CR, Wong PF, Smithy JW, Kluger HM, Syrigos KN, et al. High-Plex Predictive Marker Discovery for Melanoma Immunotherapy-Treated Patients Using Digital Spatial Profiling. Clin Cancer Res (2019) 25(18):5503–12. doi: 10.1158/1078-0432.CCR-19-0104
19. Wu L, Yan J, Bai Y, Chen F, Xu J, Zou X, et al. Spatially-Resolved Transcriptomics Analyses of Invasive Fronts in Solid Tumors. bioRxiv (2021) 2021:10. doi: 10.1101/2021.10.21.465135
20. Rao A, Barkley D, Franca GS, Yanai I. Exploring Tissue Architecture Using Spatial Transcriptomics. Nature (2021) 596(7871):211–20. doi: 10.1038/s41586-021-03634-9
21. Singer RH, Ward DC. Actin Gene Expression Visualized in Chicken Muscle Tissue Culture by Using in Situ Hybridization with a Biotinated Nucleotide Analog. Proc Natl Acad Sci U.S.A. (1982) 79(23):7331–5. doi: 10.1073/pnas.79.23.7331
22. Raj A, van den Bogaard P, Rifkin SA, van Oudenaarden A, Tyagi S. Imaging Individual Mrna Molecules Using Multiple Singly Labeled Probes. Nat Methods (2008) 5(10):877–9. doi: 10.1038/nmeth.1253
23. Eng CL, Lawson M, Zhu Q, Dries R, Koulena N, Takei Y, et al. Transcriptome-Scale Super-Resolved Imaging in Tissues by Rna Seqfish. Nature (2019) 568(7751):235–9. doi: 10.1038/s41586-019-1049-y
24. Takei Y, Yun J, Zheng S, Ollikainen N, Pierson N, White J, et al. Integrated Spatial Genomics Reveals Global Architecture of Single Nuclei. Nature (2021) 590(7845):344–50. doi: 10.1038/s41586-020-03126-2
25. Xia C, Fan J, Emanuel G, Hao J, Zhuang X. Spatial Transcriptome Profiling by Merfish Reveals Subcellular Rna Compartmentalization and Cell Cycle-Dependent Gene Expression. Proc Natl Acad Sci U.S.A. (2019) 116(39):19490–9. doi: 10.1073/pnas.1912459116
26. Petukhov V, Xu RJ, Soldatov RA, Cadinu P, Khodosevich K, Moffitt JR, et al. Cell Segmentation in Imaging-Based Spatial Transcriptomics. Nat Biotechnol (2022) 40(3):345–54. doi: 10.1038/s41587-021-01044-w
27. Dar D, Dar N, Cai L, Newman DK. Spatial Transcriptomics of Planktonic and Sessile Bacterial Populations at Single-Cell Resolution. Science (2021) 373(6556):1–16. doi: 10.1126/science.abi4882
28. Goh JJL, Chou N, Seow WY, Ha N, Cheng CPP, Chang YC, et al. Highly Specific Multiplexed Rna Imaging in Tissues with Split-Fish. Nat Methods (2020) 17(7):689–93. doi: 10.1038/s41592-020-0858-0
29. Asp M, Bergenstrahle J, Lundeberg J. Spatially Resolved Transcriptomes-Next Generation Tools for Tissue Exploration. Bioessays (2020) 42(10):1–16. doi: 10.1002/bies.201900221
30. Ke R, Mignardi M, Pacureanu A, Svedlund J, Botling J, Wahlby C, et al. In Situ Sequencing for Rna Analysis in Preserved Tissue and Cells. Nat Methods (2013) 10(9):857–60. doi: 10.1038/nmeth.2563
31. Chen X, Sun YC, Church GM, Lee JH, Zador AM. Efficient in Situ Barcode Sequencing Using Padlock Probe-Based Baristaseq. Nucleic Acids Res (2018) 46(4):e22. doi: 10.1093/nar/gkx1206
32. Wang X, Allen WE, Wright MA, Sylwestrak EL, Samusik N, Vesuna S, et al. Three-Dimensional Intact-Tissue Sequencing of Single-Cell Transcriptional States. Science (2018) 361(6400):1–9. doi: 10.1126/science.aat5691
33. Lee JH, Daugharthy ER, Scheiman J, Kalhor R, Yang JL, Ferrante TC, et al. Highly Multiplexed Subcellular Rna Sequencing in Situ. Science (2014) 343(6177):1360–3. doi: 10.1126/science.1250212
34. Chen J, Suo S, Tam PP, Han JJ, Peng G, Jing N. Spatial Transcriptomic Analysis of Cryosectioned Tissue Samples with Geo-Seq. Nat Protoc (2017) 12(3):566–80. doi: 10.1038/nprot.2017.003
35. Lovatt D, Ruble BK, Lee J, Dueck H, Kim TK, Fisher S, et al. Transcriptome in Vivo Analysis (Tiva) of Spatially Defined Single Cells in Live Tissue. Nat Methods (2014) 11(2):190–6. doi: 10.1038/nmeth.2804
36. Medaglia C, Giladi A, Stoler-Barak L, De Giovanni M, Salame TM, Biram A, et al. Spatial Reconstruction of Immune Niches by Combining Photoactivatable Reporters and Scrna-Seq. Science (2017) 358(6370):1622–6. doi: 10.1126/science.aao4277
37. Emmert-Buck MR, Bonner RF, Smith PD, Chuaqui RF, Zhuang Z, Goldstein SR, et al. Laser Capture Microdissection. Science (1996) 274(5289):998–1001. doi: 10.1126/science.274.5289.998
38. Nichterwitz S, Benitez JA, Hoogstraaten R, Deng Q, Hedlund E. Lcm-Seq: A Method for Spatial Transcriptomic Profiling Using Laser Capture Microdissection Coupled with Polya-Based Rna Sequencing. Methods Mol Biol (2018) 1649:95–110. doi: 10.1007/978-1-4939-7213-5_6
39. Stahl PL, Salmen F, Vickovic S, Lundmark A, Navarro JF, Magnusson J, et al. Visualization and Analysis of Gene Expression in Tissue Sections by Spatial Transcriptomics. Science (2016) 353(6294):78–82. doi: 10.1126/science.aaf2403
40. Rodriques SG, Stickels RR, Goeva A, Martin CA, Murray E, Vanderburg CR, et al. Slide-Seq: A Scalable Technology for Measuring Genome-Wide Expression at High Spatial Resolution. Science (2019) 363(6434):1463–7. doi: 10.1126/science.aaw1219
41. Stickels RR, Murray E, Kumar P, Li J, Marshall JL, Di Bella DJ, et al. Highly Sensitive Spatial Transcriptomics at near-Cellular Resolution with Slide-Seqv2. Nat Biotechnol (2021) 39(3):313–9. doi: 10.1038/s41587-020-0739-1
42. Vickovic S, Eraslan G, Salmen F, Klughammer J, Stenbeck L, Schapiro D, et al. High-Definition Spatial Transcriptomics for in Situ Tissue Profiling. Nat Methods (2019) 16(10):987–90. doi: 10.1038/s41592-019-0548-y
43. Chen A, Liao S, Cheng M, Ma K, Wu L, Lai Y, et al. Spatiotemporal Transcriptomic Atlas of Mouse Organogenesis Using DNA Nanoball-Patterned Arrays. Cell (2022) 185(10):1777–92.e21. doi: 10.1016/j.cell.2022.04.003
44. Merritt CR, Ong GT, Church SE, Barker K, Danaher P, Geiss G, et al. Multiplex Digital Spatial Profiling of Proteins and Rna in Fixed Tissue. Nat Biotechnol (2020) 38(5):586–99. doi: 10.1038/s41587-020-0472-9
45. Hu KH, Eichorst JP, McGinnis CS, Patterson DM, Chow ED, Kersten K, et al. Zipseq: Barcoding for Real-Time Mapping of Single Cell Transcriptomes. Nat Methods (2020) 17(8):833–43. doi: 10.1038/s41592-020-0880-2
46. Cho CS, Xi J, Si Y, Park SR, Hsu JE, Kim M, et al. Microscopic Examination of Spatial Transcriptome Using Seq-Scope. Cell (2021) 184(13):3559–72 e22. doi: 10.1016/j.cell.2021.05.010
47. Fazal FM, Han S, Parker KR, Kaewsapsak P, Xu J, Boettiger AN, et al. Atlas of Subcellular Rna Localization Revealed by Apex-Seq. Cell (2019) 178(2):473–90 e26. doi: 10.1016/j.cell.2019.05.027
48. Fu X, Sun L, Chen JY, Dong R, Lin Y, Palmiter RD, et al. Continuous Polony Gels for Tissue Mapping with High Resolution and Rna Capture Efficiency. bioRxiv (2021) 2021:3. doi: 10.1101/2021.03.17.435795
49. Nitzan M, Karaiskos N, Friedman N, Rajewsky N. Gene Expression Cartography. Nature (2019) 576(7785):132–7. doi: 10.1038/s41586-019-1773-3
50. Li B, Zhang W, Guo C, Xu H, Li L, Fang M, et al. Benchmarking Spatial and Single-Cell Transcriptomics Integration Methods for Transcript Distribution Prediction and Cell Type Deconvolution. Nat Methods (2022) 19(6):662–70. doi: 10.1038/s41592-022-01480-9
51. Giraldo NA, Sanchez-Salas R, Peske JD, Vano Y, Becht E, Petitprez F, et al. The Clinical Role of the Tme in Solid Cancer. Br J Cancer (2019) 120(1):45–53. doi: 10.1038/s41416-018-0327-z
52. Moncada R, Barkley D, Wagner F, Chiodin M, Devlin JC, Baron M, et al. Integrating Microarray-Based Spatial Transcriptomics and Single-Cell Rna-Seq Reveals Tissue Architecture in Pancreatic Ductal Adenocarcinomas. Nat Biotechnol (2020) 38(3):333–42. doi: 10.1038/s41587-019-0392-8
53. Sun H, Zhang D, Huang C, Guo Y, Yang Z, Yao N, et al. Hypoxic Microenvironment Induced Spatial Transcriptome Changes in Pancreatic Cancer. Cancer Biol Med (2021) 18(2):616–30. doi: 10.20892/j.issn.2095-3941.2021.0158
54. Muller S, Kohanbash G, Liu SJ, Alvarado B, Carrera D, Bhaduri A, et al. Single-Cell Profiling of Human Gliomas Reveals Macrophage Ontogeny as a Basis for Regional Differences in Macrophage Activation in the Tumor Microenvironment. Genome Biol (2017) 18(1):234. doi: 10.1186/s13059-017-1362-4
55. Nirmal AJ, Maliga Z, Vallius T, Quattrochi B, Chen AA, Jacobson CA, et al. The Spatial Landscape of Progression and Immunoediting in Primary Melanoma at Single-Cell Resolution. Cancer Discovery (2022) 12(6):1518–41. doi: 10.1158/2159-8290.CD-21-1357
56. Ravi VM, Will P, Kueckelhaus J, Sun N, Joseph K, Salie H, et al. Spatially Resolved Multi-Omics Deciphers Bidirectional Tumor-Host Interdependence in Glioblastoma. Cancer Cell (2022) 40(6):639–55 e13. doi: 10.1016/j.ccell.2022.05.009
57. Gouin KH 3rd, Ing N, Plummer JT, Rosser CJ, Ben Cheikh B, Oh C, et al. An N-Cadherin 2 Expressing Epithelial Cell Subpopulation Predicts Response to Surgery, Chemotherapy and Immunotherapy in Bladder Cancer. Nat Commun (2021) 12(1):4906. doi: 10.1038/s41467-021-25103-7
58. Kumar V, Ramnarayanan K, Sundar R, Padmanabhan N, Srivastava S, Koiwa M, et al. Single-Cell Atlas of Lineage States, Tumor Microenvironment, and Subtype-Specific Expression Programs in Gastric Cancer. Cancer Discovery (2022) 12(3):670–91. doi: 10.1158/2159-8290.CD-21-0683
59. Nichterwitz S, Chen G, Aguila Benitez J, Yilmaz M, Storvall H, Cao M, et al. Laser Capture Microscopy Coupled with Smart-Seq2 for Precise Spatial Transcriptomic Profiling. Nat Commun (2016) 7:12139. doi: 10.1038/ncomms12139
60. Junker JP, Noel ES, Guryev V, Peterson KA, Shah G, Huisken J, et al. Genome-Wide Rna Tomography in the Zebrafish Embryo. Cell (2014) 159(3):662–75. doi: 10.1016/j.cell.2014.09.038
61. Honda M, Oki S, Kimura R, Harada A, Maehara K, Tanaka K, et al. High-Depth Spatial Transcriptome Analysis by Photo-Isolation Chemistry. Nat Commun (2021) 12(1):4416. doi: 10.1038/s41467-021-24691-8
62. Zhang X, Hu C, Huang C, Wei Y, Li X, Hu M, et al. Robust Acquisition of Spatial Transcriptional Programs in Tissues with Immunofluorescence-Guided Laser Capture Microdissection. Front Cell Dev Biol (2022) 10:853188. doi: 10.3389/fcell.2022.853188
63. Femino AM, Fay FS, Fogarty K, Singer RH. Visualization of Single Rna Transcripts in Situ. Science (1998) 280(5363):585–90. doi: 10.1126/science.280.5363.585
64. Shah S, Lubeck E, Zhou W, Cai L. In Situ Transcription Profiling of Single Cells Reveals Spatial Organization of Cells in the Mouse Hippocampus. Neuron (2016) 92(2):342–57. doi: 10.1016/j.neuron.2016.10.001
65. Wang G, Moffitt JR, Zhuang X. Multiplexed Imaging of High-Density Libraries of Rnas with Merfish and Expansion Microscopy. Sci Rep (2018) 8(1):4847. doi: 10.1038/s41598-018-22297-7
66. Shah S, Lubeck E, Schwarzkopf M, He TF, Greenbaum A, Sohn CH, et al. Single-Molecule Rna Detection at Depth by Hybridization Chain Reaction and Tissue Hydrogel Embedding and Clearing. Development (2016) 143(15):2862–7. doi: 10.1242/dev.138560
67. Wu C, Simonetti M, Rossell C, Mignardi M, Mirzazadeh R, Annaratone L, et al. Rollfish Achieves Robust Quantification of Single-Molecule Rna Biomarkers in Paraffin-Embedded Tumor Tissue Samples. Commun Biol (2018) 1:209. doi: 10.1038/s42003-018-0218-0
68. Codeluppi S, Borm LE, Zeisel A, La Manno G, van Lunteren JA, Svensson CI, et al. Spatial Organization of the Somatosensory Cortex Revealed by Osmfish. Nat Methods (2018) 15(11):932–5. doi: 10.1038/s41592-018-0175-z
69. Wang F, Flanagan J, Su N, Wang LC, Bui S, Nielson A, et al. Rnascope: A Novel in Situ Rna Analysis Platform for Formalin-Fixed, Paraffin-Embedded Tissues. J Mol Diagn (2012) 14(1):22–9. doi: 10.1016/j.jmoldx.2011.08.002
70. Kishi JY, Lapan SW, Beliveau BJ, West ER, Zhu A, Sasaki HM, et al. Saber Amplifies Fish: Enhanced Multiplexed Imaging of Rna and DNA in Cells and Tissues. Nat Methods (2019) 16(6):533–44. doi: 10.1038/s41592-019-0404-0
71. Weinstein JA, Regev A, Zhang F. DNA Microscopy: Optics-Free Spatio-Genetic Imaging by a Stand-Alone Chemical Reaction. Cell (2019) 178(1):229–41 e16. doi: 10.1016/j.cell.2019.05.019
72. Roberts K, Aivazidis A, Kleshchevnikov V, Li T, Fropf R, Rhodes M, et al. Transcriptome-Wide Spatial Rna Profiling Maps the Cellular Architecture of the Developing Human Neocortex. bioRxiv (2021), 2021.03.20.436265. doi: 10.1101/2021.03.20.436265
73. Liu S, Punthambaker S, Iyer EPR, Ferrante T, Goodwin D, Furth D, et al. Barcoded Oligonucleotides Ligated on Rna Amplified for Multiplexed and Parallel in Situ Analyses. Nucleic Acids Res (2021) 49(10):e58. doi: 10.1093/nar/gkab120
74. Fürth D, Hatini V, Lee JH. In Situ Transcriptome Accessibility Sequencing (Insta-Seq). bioRxiv (2019), 722819. doi: 10.1101/722819
75. Chen X, Sun YC, Zhan H, Kebschull JM, Fischer S, Matho K, et al. High-Throughput Mapping of Long-Range Neuronal Projection Using in Situ Sequencing. Cell (2019) 179(3):772–86.e19. doi: 10.1016/j.cell.2019.09.023
76. Gyllborg D, Langseth CM, Qian X, Choi E, Salas SM, Hilscher MM, et al. Hybridization-Based in Situ Sequencing (Hybiss) for Spatially Resolved Transcriptomics in Human and Mouse Brain Tissue. Nucleic Acids Res (2020) 48(19):e112. doi: 10.1093/nar/gkaa792
77. Qian X, Harris KD, Hauling T, Nicoloutsopoulos D, Munoz-Manchado AB, Skene N, et al. Probabilistic Cell Typing Enables Fine Mapping of Closely Related Cell Types in Situ. Nat Methods (2020) 17(1):101–6. doi: 10.1038/s41592-019-0631-4
78. Srivatsan SR, Regier MC, Barkan E, Franks JM, Packer JS, Grosjean P, et al. Embryo-Scale, Single-Cell Spatial Transcriptomics. Science (2021) 373(6550):111–7. doi: 10.1126/science.abb9536
79. Alon S, Goodwin DR, Sinha A, Wassie AT, Chen F, Daugharthy ER, et al. Expansion Sequencing: Spatially Precise in Situ Transcriptomics in Intact Biological Systems. Science (2021) 371(6528):1–13. doi: 10.1126/science.aax2656
80. Lee Y, Bogdanoff D, Wang Y, Hartoularos GC, Woo JM, Mowery CT, et al. Xyzeq: Spatially Resolved Single-Cell Rna Sequencing Reveals Expression Heterogeneity in the Tumor Microenvironment. Sci Adv (2021) 7(17):1–14. doi: 10.1126/sciadv.abg4755
81. Van de Velde LA, Allen EK, Crawford JC, Wilson TL, Guy CS, Russier M, et al. Neuroblastoma Formation Requires Unconventional Cd4 T Cells and Arginase-1-Dependent Myeloid Cells. Cancer Res (2021) 81(19):5047–59. doi: 10.1158/0008-5472.CAN-21-0691
82. Berglund E, Maaskola J, Schultz N, Friedrich S, Marklund M, Bergenstrahle J, et al. Spatial Maps of Prostate Cancer Transcriptomes Reveal an Unexplored Landscape of Heterogeneity. Nat Commun (2018) 9(1):2419. doi: 10.1038/s41467-018-04724-5
83. Nieto P, Elosua-Bayes M, Trincado JL, Marchese D, Massoni-Badosa R, Salvany M, et al. A Single-Cell Tumor Immune Atlas for Precision Oncology. Genome Res (2021) 31(10):1913–26. doi: 10.1101/gr.273300.120
84. Grunwald BT, Devisme A, Andrieux G, Vyas F, Aliar K, McCloskey CW, et al. Spatially Confined Sub-Tumor Microenvironments in Pancreatic Cancer. Cell (2021) 184(22):5577–92.e18. doi: 10.1016/j.cell.2021.09.022
85. Davidson S, Efremova M, Riedel A, Mahata B, Pramanik J, Huuhtanen J, et al. Single-Cell Rna Sequencing Reveals a Dynamic Stromal Niche That Supports Tumor Growth. Cell Rep (2020) 31(7):107628. doi: 10.1016/j.celrep.2020.107628
86. Yang E, Wang X, Gong Z, Yu M, Wu H, Zhang D. Exosome-Mediated Metabolic Reprogramming: The Emerging Role in Tumor Microenvironment Remodeling and Its Influence on Cancer Progression. Signal Transduct Target Ther (2020) 5(1):242. doi: 10.1038/s41392-020-00359-5
87. Ren G, Zhang L, Zhao X, Xu G, Zhang Y, Roberts AI, et al. Mesenchymal Stem Cell-Mediated Immunosuppression Occurs Via Concerted Action of Chemokines and Nitric Oxide. Cell Stem Cell (2008) 2(2):141–50. doi: 10.1016/j.stem.2007.11.014
88. Hill BS, Sarnella A, D'Avino G, Zannetti A. Recruitment of Stromal Cells into Tumour Microenvironment Promote the Metastatic Spread of Breast Cancer. Semin Cancer Biol (2020) 60:202–13. doi: 10.1016/j.semcancer.2019.07.028
89. Dhainaut M, Rose SA, Akturk G, Wroblewska A, Nielsen SR, Park ES, et al. Spatial Crispr Genomics Identifies Regulators of the Tumor Microenvironment. Cell (2022) 185(7):1223–39.e20. doi: 10.1016/j.cell.2022.02.015
90. Qi J, Sun H, Zhang Y, Wang Z, Xun Z, Li Z, et al. Single-Cell and Spatial Analysis Reveal Interaction of Fap(+) Fibroblasts and Spp1(+) Macrophages in Colorectal Cancer. Nat Commun (2022) 13(1):1742. doi: 10.1038/s41467-022-29366-6
91. Jeong HY, Ham IH, Lee SH, Ryu D, Son SY, Han SU, et al. Spatially Distinct Reprogramming of the Tumor Microenvironment Based on Tumor Invasion in Diffuse-Type Gastric Cancers. Clin Cancer Res (2021) 27(23):6529–42. doi: 10.1158/1078-0432.CCR-21-0792
92. Ji AL, Rubin AJ, Thrane K, Jiang S, Reynolds DL, Meyers RM, et al. Multimodal Analysis of Composition and Spatial Architecture in Human Squamous Cell Carcinoma. Cell (2020) 182(6):1661–2. doi: 10.1016/j.cell.2020.08.043
93. Ou Z, Lin S, Qiu J, Ding W, Ren P, Chen D, et al. Single-Nucleus Rna Sequencing and Spatial Transcriptomics Reveal the Immunological Microenvironment of Cervical Squamous Cell Carcinoma. Adv Sci (Weinh) (2022), e2203040. doi: 10.1002/advs.202203040
94. Schneider K, Marbaix E, Bouzin C, Hamoir M, Mahy P, Bol V, et al. Immune Cell Infiltration in Head and Neck Squamous Cell Carcinoma and Patient Outcome: A Retrospective Study. Acta Oncol (2018) 57(9):1165–72. doi: 10.1080/0284186X.2018.1445287
95. Brady L, Kriner M, Coleman I, Morrissey C, Roudier M, True LD, et al. Inter- and Intra-Tumor Heterogeneity of Metastatic Prostate Cancer Determined by Digital Spatial Gene Expression Profiling. Nat Commun (2021) 12(1):1426. doi: 10.1038/s41467-021-21615-4
96. Liu J, Geng X, Hou J, Wu G. New Insights into M1/M2 Macrophages: Key Modulators in Cancer Progression. Cancer Cell Int (2021) 21(1):389. doi: 10.1186/s12935-021-02089-2
97. Ravi VM, Neidert N, Will P, Joseph K, Maier JP, Kuckelhaus J, et al. T-Cell Dysfunction in the Glioblastoma Microenvironment Is Mediated by Myeloid Cells Releasing Interleukin-10. Nat Commun (2022) 13(1):925. doi: 10.1038/s41467-022-28523-1
98. Sautes-Fridman C, Petitprez F, Calderaro J, Fridman WH. Tertiary Lymphoid Structures in the Era of Cancer Immunotherapy. Nat Rev Cancer (2019) 19(6):307–25. doi: 10.1038/s41568-019-0144-6
99. Sautes-Fridman C, Verneau J, Sun CM, Moreira M, Chen TW, Meylan M, et al. Tertiary Lymphoid Structures and B Cells: Clinical Impact and Therapeutic Modulation in Cancer. Semin Immunol (2020) 48:101406. doi: 10.1016/j.smim.2020.101406
100. Dieu-Nosjean MC, Goc J, Giraldo NA, Sautes-Fridman C, Fridman WH. Tertiary Lymphoid Structures in Cancer and Beyond. Trends Immunol (2014) 35(11):571–80. doi: 10.1016/j.it.2014.09.006
101. Helmink BA, Reddy SM, Gao J, Zhang S, Basar R, Thakur R, et al. B Cells and Tertiary Lymphoid Structures Promote Immunotherapy Response. Nature (2020) 577(7791):549–55. doi: 10.1038/s41586-019-1922-8
102. Petitprez F, de Reynies A, Keung EZ, Chen TW, Sun CM, Calderaro J, et al. B Cells Are Associated with Survival and Immunotherapy Response in Sarcoma. Nature (2020) 577(7791):556–60. doi: 10.1038/s41586-019-1906-8
103. Cabrita R, Lauss M, Sanna A, Donia M, Skaarup Larsen M, Mitra S, et al. Tertiary Lymphoid Structures Improve Immunotherapy and Survival in Melanoma. Nature (2020) 577(7791):561–5. doi: 10.1038/s41586-019-1914-8
104. Schumacher TN, Thommen DS. Tertiary Lymphoid Structures in Cancer. Science (2022) 375(6576):eabf9419. doi: 10.1126/science.abf9419
105. Provenzano PP, Eliceiri KW, Campbell JM, Inman DR, White JG, Keely PJ. Collagen Reorganization at the Tumor-Stromal Interface Facilitates Local Invasion. BMC Med (2006) 4(1):38. doi: 10.1186/1741-7015-4-38
106. Sanegre S, Eritja N, de Andrea C, Diaz-Martin J, Diaz-Lagares A, Jacome MA, et al. Characterizing the Invasive Tumor Front of Aggressive Uterine Adenocarcinoma and Leiomyosarcoma. Front Cell Dev Biol (2021) 9:670185. doi: 10.3389/fcell.2021.670185
107. Hunter MV, Moncada R, Weiss JM, Yanai I, White RM. Spatially Resolved Transcriptomics Reveals the Architecture of the Tumor-Microenvironment Interface. Nat Commun (2021) 12(1):6278. doi: 10.1038/s41467-021-26614-z
108. Liu SQ, Gao ZJ, Wu J, Zheng HM, Li B, Sun S, et al. Single-Cell and Spatially Resolved Analysis Uncovers Cell Heterogeneity of Breast Cancer. J Hematol Oncol (2022) 15(1):19. doi: 10.1186/s13045-022-01236-0
109. Romanens L, Chaskar P, Tille J-C, Ryser S, Liaudet N, Hu-Heimgartner K, et al. Spatial Transcriptomics of Tumor Microenvironment in Formalin-Fixed Paraffin-Embedded Breast Cancer. bioRxiv (2020), 2020.01.31.928143:1–41. doi: 10.1101/2020.01.31.928143
110. Nagasawa S, Kuze Y, Maeda I, Kojima Y, Motoyoshi A, Onishi T, et al. Genomic Profiling Reveals Heterogeneous Populations of Ductal Carcinoma in Situ of the Breast. Commun Biol (2021) 4(1):438. doi: 10.1038/s42003-021-01959-9
111. Foley JW, Zhu C, Jolivet P, Zhu SX, Lu P, Meaney MJ, et al. Gene Expression Profiling of Single Cells from Archival Tissue with Laser-Capture Microdissection and Smart-3seq. Genome Res (2019) 29(11):1816–25. doi: 10.1101/gr.234807.118
112. Lv J, Shi Q, Han Y, Li W, Liu H, Zhang J, et al. Spatial Transcriptomics Reveals Gene Expression Characteristics in Invasive Micropapillary Carcinoma of the Breast. Cell Death Dis (2021) 12(12):1095. doi: 10.1038/s41419-021-04380-6
113. Massalha H, Bahar Halpern K, Abu-Gazala S, Jana T, Massasa EE, Moor AE, et al. A Single Cell Atlas of the Human Liver Tumor Microenvironment. Mol Syst Biol (2020) 16(12):e9682. doi: 10.15252/msb.20209682
114. Wang YF, Yuan SX, Jiang H, Li ZX, Yin HZ, Tan J, et al. Spatial Maps of Hepatocellular Carcinoma Transcriptomes Reveal Spatial Expression Patterns in Tumor Immune Microenvironment. Theranostics (2022) 12(9):4163–80. doi: 10.7150/thno.71873
115. Sundar R, Liu DH, Hutchins GG, Slaney HL, Silva AN, Oosting J, et al. Spatial Profiling of Gastric Cancer Patient-Matched Primary and Locoregional Metastases Reveals Principles of Tumour Dissemination. Gut (2021) 70(10):1823–32. doi: 10.1136/gutjnl-2020-320805
116. Wu Y, Yang S, Ma J, Chen Z, Song G, Rao D, et al. Spatiotemporal Immune Landscape of Colorectal Cancer Liver Metastasis at Single-Cell Level. Cancer Discovery (2022) 12(1):134–53. doi: 10.1158/2159-8290.CD-21-0316
117. Thrane K, Eriksson H, Maaskola J, Hansson J, Lundeberg J. Spatially Resolved Transcriptomics Enables Dissection of Genetic Heterogeneity in Stage Iii Cutaneous Malignant Melanoma. Cancer Res (2018) 78(20):5970–9. doi: 10.1158/0008-5472.CAN-18-0747
118. Hwang WL, Jagadeesh KA, Guo JA, Hoffman HI, Yadollahpour P, Mohan R, et al. Single-Nucleus and Spatial Transcriptomics of Archival Pancreatic Cancer Reveals Multi-Compartment Reprogramming after Neoadjuvant Treatment. bioRxiv (2020), 2020.08.25.267336. doi: 10.1101/2020.08.25.267336
119. O'Rourke DM, Nasrallah MP, Desai A, Melenhorst JJ, Mansfield K, Morrissette JJD, et al. A Single Dose of Peripherally Infused Egfrviii-Directed Car T Cells Mediates Antigen Loss and Induces Adaptive Resistance in Patients with Recurrent Glioblastoma. Sci Transl Med (2017) 9(399):1–15. doi: 10.1126/scitranslmed.aaa0984
120. Grauel AL, Nguyen B, Ruddy D, Laszewski T, Schwartz S, Chang J, et al. Tgfbeta-Blockade Uncovers Stromal Plasticity in Tumors by Revealing the Existence of a Subset of Interferon-Licensed Fibroblasts. Nat Commun (2020) 11(1):6315. doi: 10.1038/s41467-020-19920-5
121. Yearley JH, Gibson C, Yu N, Moon C, Murphy E, Juco J, et al. Pd-L2 Expression in Human Tumors: Relevance to Anti-Pd-1 Therapy in Cancer. Clin Cancer Res (2017) 23(12):3158–67. doi: 10.1158/1078-0432.CCR-16-1761
122. Stur E, Corvigno S, Xu M, Chen K, Tan Y, Lee S, et al. Spatially Resolved Transcriptomics of High-Grade Serous Ovarian Carcinoma. iScience (2022) 25(3):103923. doi: 10.1016/j.isci.2022.103923
123. Taavitsainen S, Engedal N, Cao S, Handle F, Erickson A, Prekovic S, et al. Single-Cell Atac and Rna Sequencing Reveal Pre-Existing and Persistent Cells Associated with Prostate Cancer Relapse. Nat Commun (2021) 12(1):5307. doi: 10.1038/s41467-021-25624-1
124. Svedlund J, Strell C, Qian X, Zilkens KJC, Tobin NP, Bergh J, et al. Generation of in Situ Sequencing Based Oncomaps to Spatially Resolve Gene Expression Profiles of Diagnostic and Prognostic Markers in Breast Cancer. EBioMedicine (2019) 48:212–23. doi: 10.1016/j.ebiom.2019.09.009
125. Yoosuf N, Navarro JF, Salmen F, Stahl PL, Daub CO. Identification and Transfer of Spatial Transcriptomics Signatures for Cancer Diagnosis. Breast Cancer Res (2020) 22(1):6. doi: 10.1186/s13058-019-1242-9
126. Grunberg N, Pevsner-Fischer M, Goshen-Lago T, Diment J, Stein Y, Lavon H, et al. Cancer-Associated Fibroblasts Promote Aggressive Gastric Cancer Phenotypes Via Heat Shock Factor 1-Mediated Secretion of Extracellular Vesicles. Cancer Res (2021) 81(7):1639–53. doi: 10.1158/0008-5472.CAN-20-2756
127. Barnes TA, Amir E. Hype or Hope: The Prognostic Value of Infiltrating Immune Cells in Cancer. Br J Cancer (2018) 118(2):e5. doi: 10.1038/bjc.2017.417
128. Magi-Galluzzi C. Prostate Cancer: Diagnostic Criteria and Role of Immunohistochemistry. Mod Pathol (2018) 31(S1):S12–21. doi: 10.1038/modpathol.2017.139
129. Selves J, Long-Mira E, Mathieu MC, Rochaix P, Ilie M. Immunohistochemistry for Diagnosis of Metastatic Carcinomas of Unknown Primary Site. Cancers (Basel) (2018) 10(4):1–23. doi: 10.3390/cancers10040108
130. Zaha DC. Significance of Immunohistochemistry in Breast Cancer. World J Clin Oncol (2014) 5(3):382–92. doi: 10.5306/wjco.v5.i3.382
131. Williams CG, Lee HJ, Asatsuma T, Vento-Tormo R, Haque A. An Introduction to Spatial Transcriptomics for Biomedical Research. Genome Med (2022) 14(1):68. doi: 10.1186/s13073-022-01075-1
132. Clark GM. Prognostic Factors Versus Predictive Factors: Examples from a Clinical Trial of Erlotinib. Mol Oncol (2008) 1(4):406–12. doi: 10.1016/j.molonc.2007.12.001
133. Roudnicky F, Poyet C, Buser L, Saba K, Wild P, Otto VI, et al. Characterization of Tumor Blood Vasculature Expression of Human Invasive Bladder Cancer by Laser Capture Microdissection and Transcriptional Profiling. Am J Pathol (2020) 190(9):1960–70. doi: 10.1016/j.ajpath.2020.05.020
134. Nerurkar SN, Goh D, Cheung CCL, Nga PQY, Lim JCT, Yeong JPS. Transcriptional Spatial Profiling of Cancer Tissues in the Era of Immunotherapy: The Potential and Promise. Cancers (Basel) (2020) 12(9):1–21. doi: 10.3390/cancers12092572
135. Lebrigand K, Bergenstråhle J, Thrane K, Mollbrink A, Meletis K, Barbry P, et al. The Spatial Landscape of Gene Expression Isoforms in Tissue Sections. bioRxiv (2022) 2020:8. doi: 10.1101/2020.08.24.252296
136. McCart Reed AE, Bennett J, Kutasovic JR, Kalaw E, Ferguson K, Yeong J, et al. Digital Spatial Profiling Application in Breast Cancer: A User's Perspective. Virchows Arch (2020) 477(6):885–90. doi: 10.1007/s00428-020-02821-9
137. Palla G, Fischer DS, Regev A, Theis FJ. Spatial Components of Molecular Tissue Biology. Nat Biotechnol (2022) 40(3):308–18. doi: 10.1038/s41587-021-01182-1
138. Elosua-Bayes M, Nieto P, Mereu E, Gut I, Heyn H. Spotlight: Seeded Nmf Regression to Deconvolute Spatial Transcriptomics Spots with Single-Cell Transcriptomes. Nucleic Acids Res (2021) 49(9):e50. doi: 10.1093/nar/gkab043
139. Dong R, Yuan GC. Spatialdwls: Accurate Deconvolution of Spatial Transcriptomic Data. Genome Biol (2021) 22(1):145. doi: 10.1186/s13059-021-02362-7
140. Ma Y, Zhou X. Spatially Informed Cell-Type Deconvolution for Spatial Transcriptomics. Nat Biotechnol (2022) 40(9):1349–59. doi: 10.1038/s41587-022-01273-7
141. Miller BF, Huang F, Atta L, Sahoo A, Fan J. Reference-Free Cell Type Deconvolution of Multi-Cellular Pixel-Resolution Spatially Resolved Transcriptomics Data. Nat Commun (2022) 13(1):1–13. doi: 10.1038/s41467-022-30033-z
142. Sztanka-Toth TR, Jens M, Karaiskos N, Rajewsky N. Spacemake: Processing and Analysis of Large-Scale Spatial Transcriptomics Data. GigaScience (2022) 11:1–14. doi: 10.1093/gigascience/giac064
143. Li Z, Zhou X. Bass: Multi-Scale and Multi-Sample Analysis Enables Accurate Cell Type Clustering and Spatial Domain Detection in Spatial Transcriptomic Studies. Genome Biol (2022) 23(1):168. doi: 10.1186/s13059-022-02734-7
144. Allen C, Chang Y, Ma Q, Chung D. Maple: A Hybrid Framework for Multi-Sample Spatial Transcriptomics Data. bioRxiv (2022), 2022.02.28.482296. doi: 10.1101/2022.02.28.482296
145. Ogbeide S, Giannese F, Mincarelli L, Macaulay IC. Into the Multiverse: Advances in Single-Cell Multiomic Profiling. Trends Genet (2022) 38(8):831–43. doi: 10.1016/j.tig.2022.03.015
146. Madissoon E, Oliver AJ, Kleshchevnikov V, Wilbrey-Clark A, Polanski K, Orsi AR, et al. A Spatial Multi-Omics Atlas of the Human Lung Reveals a Novel Immune Cell Survival Niche. bioRxiv (2021), 2021.11.26.470108. doi: 10.1101/2021.11.26.470108
147. Stoeckius M, Hafemeister C, Stephenson W, Houck-Loomis B, Chattopadhyay PK, Swerdlow H, et al. Simultaneous Epitope and Transcriptome Measurement in Single Cells. Nat Methods (2017) 14(9):865–8. doi: 10.1038/nmeth.4380
148. Hwang B, Lee DS, Tamaki W, Sun Y, Ogorodnikov A, Hartoularos GC, et al. Scito-Seq: Single-Cell Combinatorial Indexed Cytometry Sequencing. Nat Methods (2021) 18(8):903–11. doi: 10.1038/s41592-021-01222-3
149. Bian S, Hou Y, Zhou X, Li X, Yong J, Wang Y, et al. Single-Cell Multiomics Sequencing and Analyses of Human Colorectal Cancer. Science (2018) 362(6418):1060–3. doi: 10.1126/science.aao3791
150. Guo F, Li L, Li J, Wu X, Hu B, Zhu P, et al. Single-Cell Multi-Omics Sequencing of Mouse Early Embryos and Embryonic Stem Cells. Cell Res (2017) 27(8):967–88. doi: 10.1038/cr.2017.82
151. Swanson E, Lord C, Reading J, Heubeck AT, Savage AK, Green R, et al. Tea-Seq: A Trimodal Assay for Integrated Single Cell Measurement of Transcription, Epitopes, and Chromatin Accessibility. bioRxiv (2020), 2020.09.04.283887. doi: 10.1101/2020.09.04.283887
152. Xu Z, Heidrich-O'Hare E, Chen W, Duerr RH. Comprehensive Benchmarking of Cite-Seq Versus Dogma-Seq Single Cell Multimodal Omics. Genome Biol (2022) 23(1):135. doi: 10.1186/s13059-022-02698-8
153. Vu T, Vallmitjana A, Gu J, La K, Xu Q, Flores J, et al. Spatial Transcriptomics Using Combinatorial Fluorescence Spectral and Lifetime Encoding, Imaging and Analysis. Nat Commun (2022) 13(1):169. doi: 10.1038/s41467-021-27798-0
154. Liu Y, Yang M, Deng Y, Su G, Enninful A, Guo CC, et al. High-Spatial-Resolution Multi-Omics Sequencing Via Deterministic Barcoding in Tissue. Cell (2020) 183(6):1665–81 e18. doi: 10.1016/j.cell.2020.10.026
155. Vickovic S, Lotstedt B, Klughammer J, Mages S, Segerstolpe A, Rozenblatt-Rosen O, et al. Sm-Omics Is an Automated Platform for High-Throughput Spatial Multi-Omics. Nat Commun (2022) 13(1):795. doi: 10.1038/s41467-022-28445-y
156. He S, Bhatt R, Brown C, Brown EA, Buhr DL, Chantranuvatana K, et al. High-Plex Multiomic Analysis in Ffpe at Subcellular Level by Spatial Molecular Imaging. bioRxiv (2022), 2021.11.03.467020. doi: 10.1101/2021.11.03.467020
157. Ben-Chetrit N, Niu X, Swett AD, Sotelo J, Jiao MS, Roelli P, et al. Integrated Protein and Transcriptome High-Throughput Spatial Profiling. bioRxiv (2022), 2022.03.15.484516. doi: 10.1101/2022.03.15.484516
158. Zhao T, Chiang ZD, Morriss JW, LaFave LM, Murray EM, Del Priore I, et al. Spatial Genomics Enables Multi-Modal Study of Clonal Heterogeneity in Tissues. Nature (2022) 601(7891):85–91. doi: 10.1038/s41586-021-04217-4
159. Landeira-Vinuela A, Diez P, Juanes-Velasco P, Lecrevisse Q, Orfao A, De Las Rivas J, et al. Deepening into Intracellular Signaling Landscape through Integrative Spatial Proteomics and Transcriptomics in a Lymphoma Model. Biomolecules (2021) 11(12):1–22. doi: 10.3390/biom11121776
160. Pape J, Emberton M, Cheema U. 3d Cancer Models: The Need for a Complex Stroma, Compartmentalization and Stiffness. Front Bioeng Biotechnol (2021) 9:660502. doi: 10.3389/fbioe.2021.660502
161. Sun D, Liu Z, Li T, Wu Q, Wang C. Stride: Accurately Decomposing and Integrating Spatial Transcriptomics Using Single-Cell Rna Sequencing. Nucleic Acids Res (2022) 50(7):e42. doi: 10.1093/nar/gkac150
162. He Y, Tang X, Huang J, Ren J, Zhou H, Chen K, et al. Clustermap for Multi-Scale Clustering Analysis of Spatial Gene Expression. Nat Commun (2021) 12(1):5909. doi: 10.1038/s41467-021-26044-x
163. Dong K, Zhang S. Deciphering Spatial Domains from Spatially Resolved Transcriptomics with an Adaptive Graph Attention Auto-Encoder. Nat Commun (2022) 13(1):1739. doi: 10.1038/s41467-022-29439-6
164. Preibisch S, Karaiskos N, Rajewsky N. Image-Based Representation of Massive Spatial Transcriptomics Datasets. bioRxiv. doi: 10.1101/2021.12.07.471629
165. Zeira R, Land M, Strzalkowski A, Raphael BJ. Alignment and Integration of Spatial Transcriptomics Data. Nat Methods (2022) 19(5):567–75. doi: 10.1038/s41592-022-01459-6
166. Martinez-Carreres L, Nasrallah A, Fajas L. Cancer: Linking Powerhouses to Suicidal Bags. Front Oncol (2017) 7:204. doi: 10.3389/fonc.2017.00204
167. Hamalisto S, Jaattela M. Lysosomes in Cancer-Living on the Edge (of the Cell). Curr Opin Cell Biol (2016) 39:69–76. doi: 10.1016/j.ceb.2016.02.009
168. Frankhauser DE, Jovanovic-Talisman T, Lai L, Yee LD, Wang LV, Mahabal A, et al. Spatiotemporal Strategies to Identify Aggressive Biology in Precancerous Breast Biopsies. WIREs Mech Dis (2021) 13(2):e1506. doi: 10.1002/wsbm.1506
169. Cao J, Spielmann M, Qiu X, Huang X, Ibrahim DM, Hill AJ, et al. The Single-Cell Transcriptional Landscape of Mammalian Organogenesis. Nature (2019) 566(7745):496–502. doi: 10.1038/s41586-019-0969-x
170. La Manno G, Soldatov R, Zeisel A, Braun E, Hochgerner H, Petukhov V, et al. Rna Velocity of Single Cells. Nature (2018) 560(7719):494–8. doi: 10.1038/s41586-018-0414-6
171. Berger MF, Mardis ER. The Emerging Clinical Relevance of Genomics in Cancer Medicine. Nat Rev Clin Oncol (2018) 15(6):353–65. doi: 10.1038/s41571-018-0002-6
172. Byron SA, Van Keuren-Jensen KR, Engelthaler DM, Carpten JD, Craig DW. Translating Rna Sequencing into Clinical Diagnostics: Opportunities and Challenges. Nat Rev Genet (2016) 17(5):257–71. doi: 10.1038/nrg.2016.10
173. Elyanow R, Zeira R, Land M, Raphael BJ. Starch: Copy Number and Clone Inference from Spatial Transcriptomics Data. Phys Biol (2021) 18(3):035001. doi: 10.1088/1478-3975/abbe99
174. Friedrich S, Sonnhammer ELL. Fusion Transcript Detection Using Spatial Transcriptomics. BMC Med Genomics (2020) 13(1):110. doi: 10.1186/s12920-020-00738-5
175. Zou LS, Zhao T, Cable DM, Murray E, Aryee MJ, Chen F, et al. Detection of Allele-Specific Expression in Spatial Transcriptomics with Spase. bioRxiv (2021), 2021.12.01.470861. doi: 10.1101/2021.12.01.470861
Keywords: spatial transcriptomics (ST), tumor microenvironment, prognostic factor, spatial heterogeneity, tertiary lymphoid structure (TLS), tumor interface
Citation: Yu Q, Jiang M and Wu L (2022) Spatial transcriptomics technology in cancer research. Front. Oncol. 12:1019111. doi: 10.3389/fonc.2022.1019111
Received: 14 August 2022; Accepted: 21 September 2022;
Published: 13 October 2022.
Edited by:
Maoshan Chen, Army Medical University, ChinaReviewed by:
Yuanyuan Zhang, Peking-Tsinghua Center for Life Sciences, ChinaCopyright © 2022 Yu, Jiang and Wu. This is an open-access article distributed under the terms of the Creative Commons Attribution License (CC BY). The use, distribution or reproduction in other forums is permitted, provided the original author(s) and the copyright owner(s) are credited and that the original publication in this journal is cited, in accordance with accepted academic practice. No use, distribution or reproduction is permitted which does not comply with these terms.
*Correspondence: Liang Wu, d3VsaWFuZ0BnZW5vbWljcy5jbg==
Disclaimer: All claims expressed in this article are solely those of the authors and do not necessarily represent those of their affiliated organizations, or those of the publisher, the editors and the reviewers. Any product that may be evaluated in this article or claim that may be made by its manufacturer is not guaranteed or endorsed by the publisher.
Research integrity at Frontiers
Learn more about the work of our research integrity team to safeguard the quality of each article we publish.