
94% of researchers rate our articles as excellent or good
Learn more about the work of our research integrity team to safeguard the quality of each article we publish.
Find out more
ORIGINAL RESEARCH article
Front. Oncol. , 11 October 2022
Sec. Cancer Imaging and Image-directed Interventions
Volume 12 - 2022 | https://doi.org/10.3389/fonc.2022.1017911
This article is part of the Research Topic Bridging Quantitative Imaging and Artificial Intelligence Methods in Preclinical and Clinical Oncology View all 6 articles
 Denis Krajnc1
 Clemens P. Spielvogel2,3
 Marko Grahovac2Boglarka Ecsedi1
 Sazan Rasul2Nina Poetsch2
 Tatjana Traub-Weidinger2Alexander R. Haug2,3
 Zsombor Ritter4
 Hussain Alizadeh5
 Marcus Hacker2
 Thomas Beyer1*
 Laszlo Papp1,6
Background: This study proposes machine learning-driven data preparation (MLDP) for optimal data preparation (DP) prior to building prediction models for cancer cohorts.
Methods: A collection of well-established DP methods were incorporated for building the DP pipelines for various clinical cohorts prior to machine learning. Evolutionary algorithm principles combined with hyperparameter optimization were employed to iteratively select the best fitting subset of data preparation algorithms for the given dataset. The proposed method was validated for glioma and prostate single center cohorts by 100-fold Monte Carlo (MC) cross-validation scheme with 80-20% training-validation split ratio. In addition, a dual-center diffuse large B-cell lymphoma (DLBCL) cohort was utilized with Center 1 as training and Center 2 as independent validation datasets to predict cohort-specific clinical endpoints. Five machine learning (ML) classifiers were employed for building prediction models across all analyzed cohorts. Predictive performance was estimated by confusion matrix analytics over the validation sets of each cohort. The performance of each model with and without MLDP, as well as with manually-defined DP were compared in each of the four cohorts.
Results: Sixteen of twenty established predictive models demonstrated area under the receiver operator characteristics curve (AUC) performance increase utilizing the MLDP. The MLDP resulted in the highest performance increase for random forest (RF) (+0.16 AUC) and support vector machine (SVM) (+0.13 AUC) model schemes for predicting 36-months survival in the glioma cohort. Single center cohorts resulted in complex (6-7 DP steps) DP pipelines, with a high occurrence of outlier detection, feature selection and synthetic majority oversampling technique (SMOTE). In contrast, the optimal DP pipeline for the dual-center DLBCL cohort only included outlier detection and SMOTE DP steps.
Conclusions: This study demonstrates that data preparation prior to ML prediction model building in cancer cohorts shall be ML-driven itself, yielding optimal prediction models in both single and multi-centric settings.
Cancer is the leading cause of death worldwide, accounting for approximately 10 million death cases in 2020 (1). Molecular and hybrid imaging have a prominent role in cancer detection, diagnosis and evaluation by assessing physiological aspects on a molecular level non-invasively (2, 3). Hybrid imaging provides both morphological and functional information of patients, as well as the assessment of quantitative information for tumor characterization (4), however, it is mainly used for visual assessment in the clinical routine. In contrast, recent studies have demonstrated the added value of radiomics to analyze tumors directly in imaging data. As such, radiomics was shown to predict clinical endpoints, such as survival, risk assessment, treatment response as well as to characterize tumor heterogeneity (5–7). Here, the Imaging Biomarker Standardization Initiative (IBSI) has been aiding to execute and report radiomics analyses in a standardized way in order to support repeatability of derived features (8). Once established, radiomics readouts can be used in combinations with machine learning (ML) approaches to establish high performing predictive models (9–14). Due to the low sample count as a natural characteristic of hybrid imaging datasets, classical ML approaches are preferred over deep learning (DL) algorithms that demand large scale input data for model training (15–17).
Nevertheless, radiomic studies routinely encounter challenges, such as high feature counts (sparse feature spaces for ML) as well as high feature redundancy when combined with ML approaches (18, 19). In addition, the presence of outliers or borderline cases may further affect the performance of ML prediction models (20, 21). Last, class imbalance, originating from sparse occurrence of various disease subtypes further influences ML predictive performance, where minority subtypes can be systematically misclassified (22, 23). The above properties are representative in cancer cohorts. Therefore, data preparation is increasingly becoming a necessity in radiomic studies combined with ML approaches to build oncological prediction models (24–26).
Data preparation refers to various methods that are performed prior to ML to optimize the training data for e.g., subclass imbalance correction, outlier handling, as well as feature selection and dimensionality reduction. While data preparation remains underrepresented in the field of hybrid imaging ML analysis, it has been estimated that approximately 70% of workload is spent with manual data preparation prior to ML in industry environments driven by ML (27, 28).
Since determining the ideal configuration of data preparation is a complex and time-consuming process, we hypothesize that it shall become ML-driven on its own, thus, maximizing model performance in various cancer cohorts and significantly reducing the time for the creation of ML workflows. Therefore, the objectives of this study were: (a) to propose an ML-driven data preparation (MLDP) approach which automatically selects consecutive data preparation algorithms and their hyperparameters for defining a data preparation pipeline prior to ML-based prediction modelling. (b) to estimate the added value of MLDP in various ML predictive models, comparing their respective predictive performance with and without MLDP, as well as with manual preparation.
In this study, three clinically relevant cancer cohorts were included retrospectively to investigate the added value of ML-driven data preparation (MLDP) (Figure 1). Written informed consent was obtained from all patients before examination and their respective studies were approved by their local institutional review boards (10, 29, 30). The cohort selection process focused on collecting cancer imaging cohorts of various imaging systems, tracers, sample sizes, feature counts and subclass imbalance ratios. In addition, all datasets were composed of radiomic features coming from different imaging modalities (Table 1). Two out of three analyzed cohorts originated from a single center-only, and one originated from two centers. See Figure 1 for the CONSORT diagram of the study. For the Imaging Biomarker Standardization Initiative (IBSI)-conform extracted radiomic features of each involved radiomic study, see their respective references.
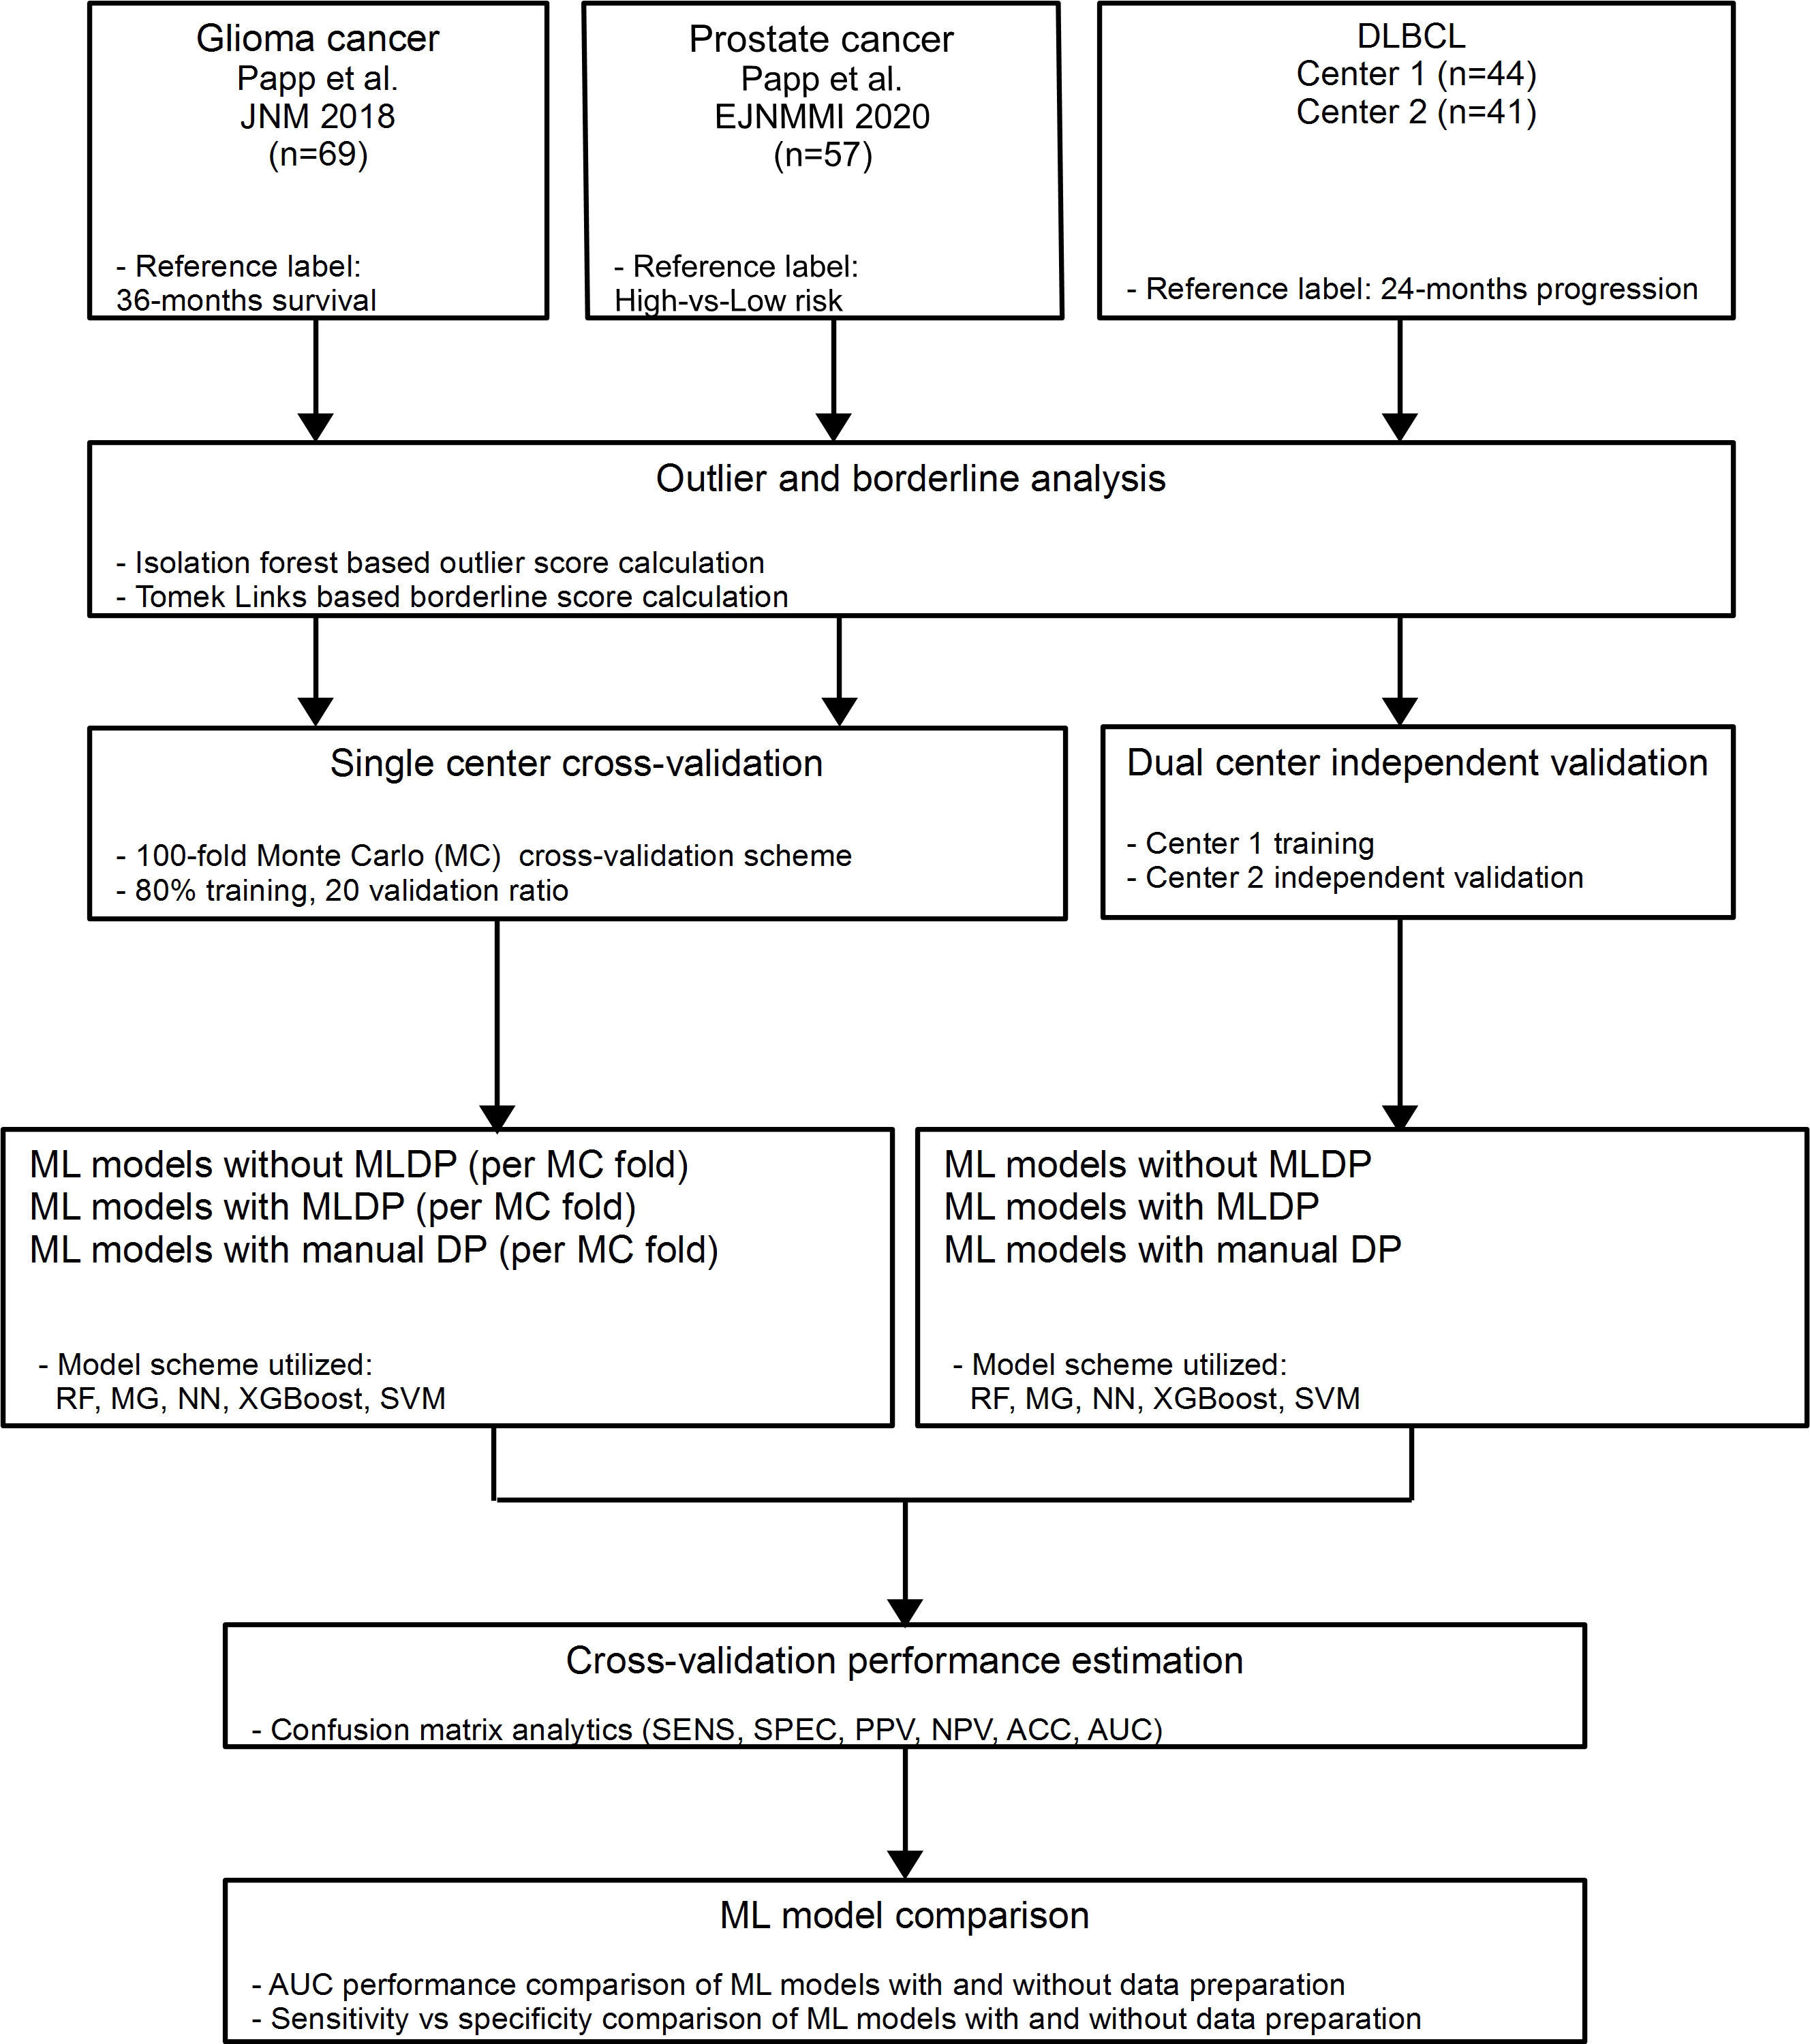
Figure 1 In this study, two single center glioma (29) and prostate (10) cancer and one dual-center diffuse large B-cell lymphoma (DLBCL) (30) cohorts were analyzed retrospectively. Outlier and borderline scores were calculated for all cohorts. For single center data, 100-fold Monte Carlo (MC) cross-validation scheme was utilized with 80%-20% training/validation data split. For dual center DLBCL analysis, Center 1 dataset was used for training and Center 2 for independent validation. Predictive models were established with and without machine learning-driven data preparation (MLDP) per training-validation pair in each cohort. All model building utilized five machine learning (ML) schemes: Random Forest (RF), Multi Gaussian (MG), Extreme gradient boosting (XGBoost), Neural networks (NN) and support vector machine (SVM). Predictive performance of each model scheme was evaluated with confusion matrix analytics. Performance comparison of ML models with and without incorporated MLDP was conducted for each analyzed cohort. DLBCL, Diffuse large B-cell lymphoma; ACC, Accuracy; SNS, Sensitivity; SPC, Specificity; PPV, Positive predictive value; NPV, Negative predictive value; AUC, Area under the receiver operator characteristics curve.
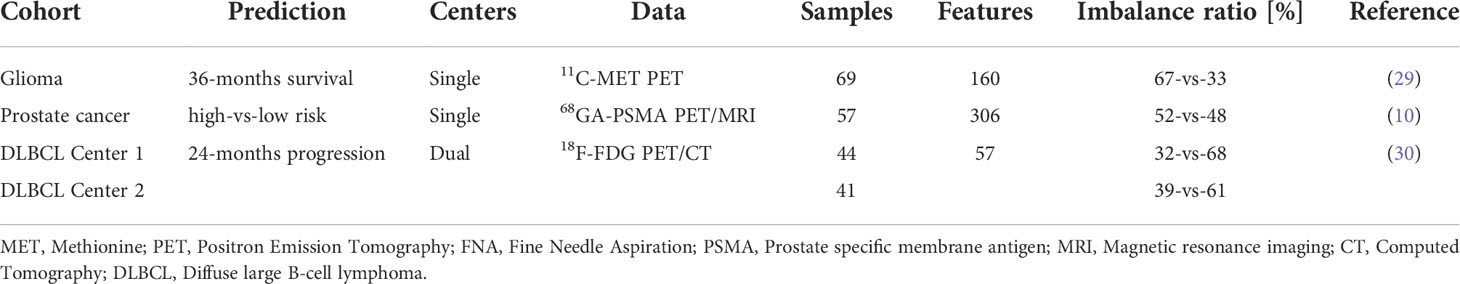
Table 1 Characteristics of cancer cohorts used in study.
Outlier and borderline scores were calculated to estimate the presence of outliers and borderline samples within the analyzed datasets. The isolation forest (31) method was utilized for outlier detection. To determine the outlier score, the percentage of detected outliers was calculated with respect to total sample count. For borderline score calculation, Tomek Links (32) was utilized including the minority subclass samples. The percentage of the minority borderline samples presence was then calculated with respect to total sample count. See Supplemental S1 for hyper-parameters of the utilized algorithms for both outlier and borderline score calculations.
In this study, various, well established, data pre-processing methods were incorporated to perform data preparation prior to machine learning. Synthetic minority oversampling technique (SMOTE) (33), borderline synthetic minority oversampling technique (BSMOTE) (34), and random oversampling method (35) were employed to handle subclass imbalance correction. Tomek link (32) approach was utilized for data purification. Isolation forest (31) was employed for outlier detection and elimination. R-squared based sequential forward selection (SFS) (36) was employed to perform feature selection and principal component analysis (PCA) (37) was incorporated to reduce high number of dimensions with data transformation approach.
Data preparation pipelines – containing an ordered list of data preparation steps – were defined for each cohort automatically (see Sec. ML-driven data preparation). To guide and regulate this process, this study defined restrictions to build data preparation pipelines. Restrictions covered the range of maximum number of methods allowed in a pipeline, no repetitions of the same method and restrictions regarding co-existence of certain method pairs in each pipeline. For details of these restrictions and the way of building pipelines see Supplemental S2.
This study utilized machine learning approaches to identify the optimal data preparation pipeline for each of its input cohorts, where receiver operator characteristics (ROC) distance fitness is measured strictly over the training dataset (29). The validation dataset was not involved in any decision making processes. For this purpose, all possible pipeline variants that satisfy the defined restrictions were pre-generated and stored in a pipeline tree per cohort (Figure 2). The tree contains pipelines with identical preparation algorithms included but in different sequential order, thus allowing the MLDP to evaluate the importance of preparation steps ordering within a pipeline. The machine learning approach to build data preparation pipelines utilized evolutionary principles (38–40) to iteratively select pipeline variant pairs from the pipeline tree, followed by generating a new offspring pipeline from them, which also satisfies the pipeline restrictions. In addition, hyperparameter optimization of established pipelines was also performed (see Supplemental S3 and S6). This approach naturally converged towards an optimal pipeline. See Supplemental S3 for details of the evolutionary algorithm.

Figure 2 Pipeline tree generation based on the pre-determined restriction conditions. The pipeline restriction table contains rules regarding permitted, consecutive data preparation steps and the permitted number of repetitions of particular data preparation methods. The Tree builder generates a tree of all possible data preparation pipelines, satisfying the rules defined in the Pipeline restriction table. A particular pipeline is defined as the ordered steps of data preparation methods from tree root to any leaf. Px, randomly selected data preparation pipeline; FS, Feature selection; DR, Dimensionality reduction; OD, Outlier detection; US, Undersampling; OS, Oversampling.
To estimate the performance of the evolutionary algorithm for pipeline building, 100-fold Monte Carlo (MC) cross-validation with training-validation split of 80-20% was utilized for single-center cohorts, which assures lower data variance due to the high iteration count compared to other suggested cross-validation methods such as Leave One Out (LOO) (41). In case of the dual-centric cohort, Center 1 and Center 2 was chosen to act as a training set and independent validation set respectively. The evolutionary algorithm utilized solely the given training dataset to build an optimal data preparation pipeline, thus, risk of overfitting the model was minimized. The ML predictive model was established on the preprocessed training dataset (Figure 3). In order to estimate machine learning method bias, this study built five different machine learning models for each preprocessed training set utilizing random forest (RF) (42), multi-gaussian (MG) (29), support vector machine (SVM) (43), extreme gradient boosting (XGBoost) (44) and neural networks (NN) (45).
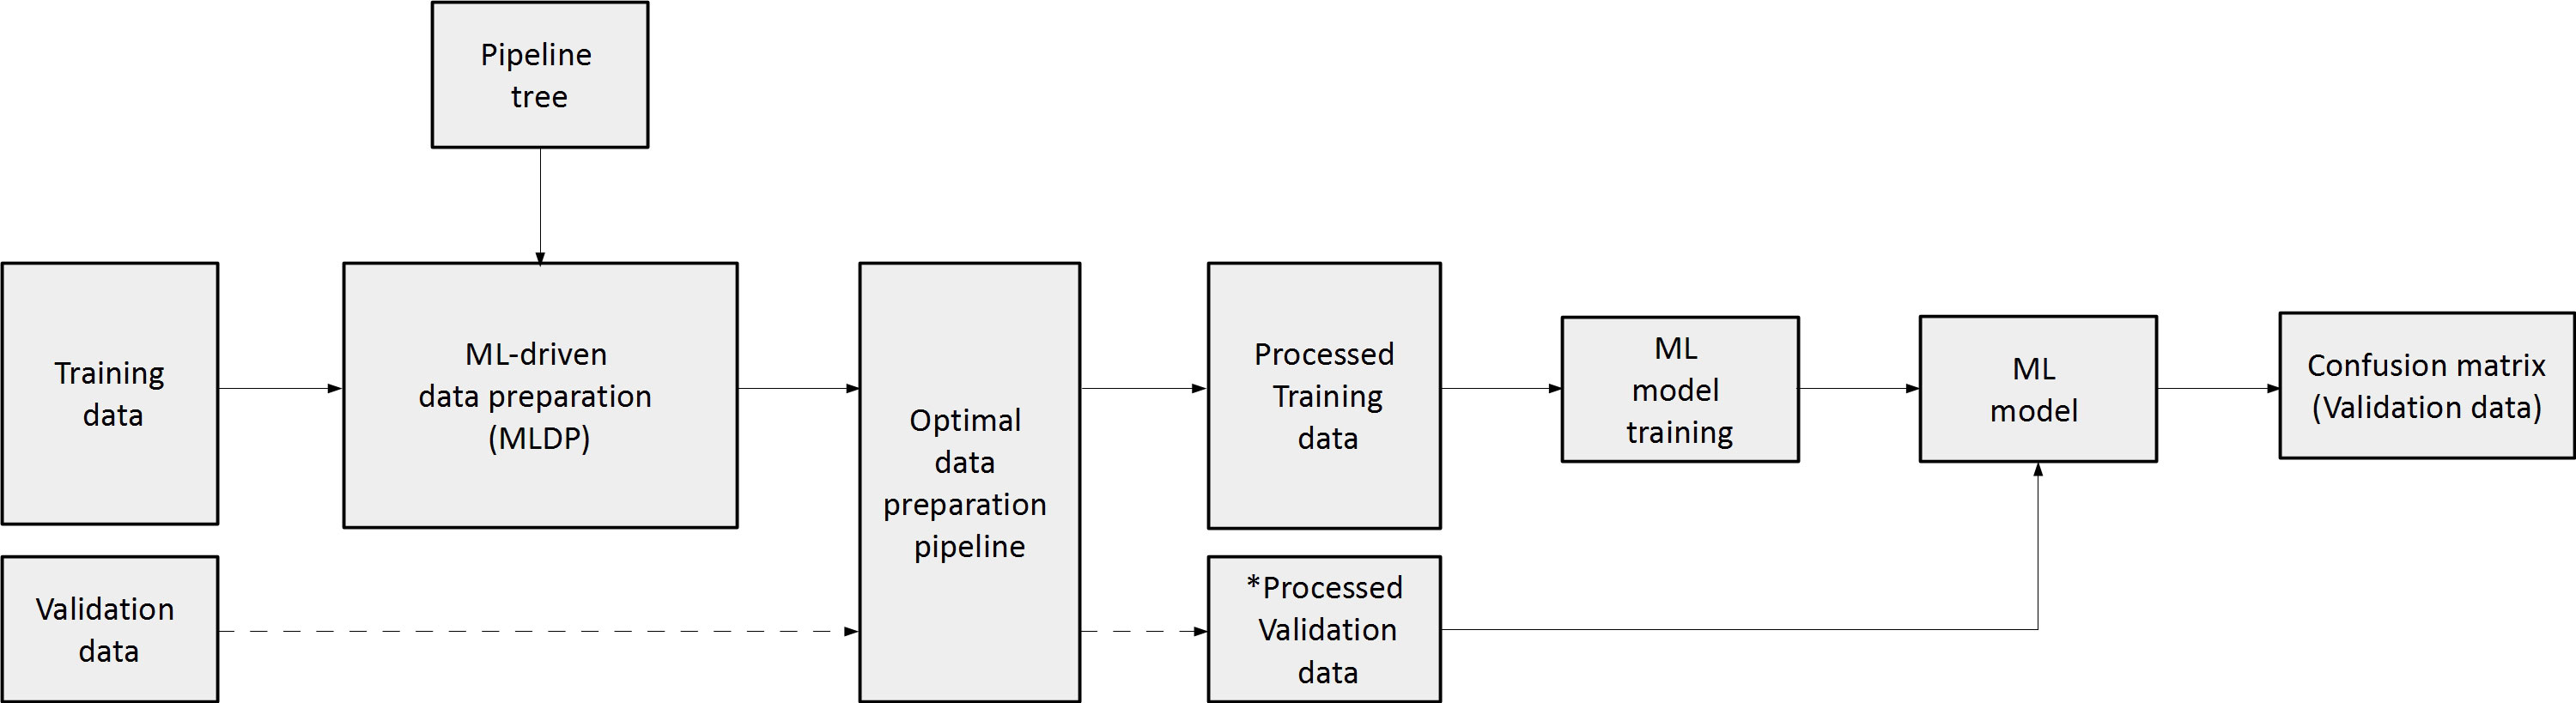
Figure 3 The concept of machine learning-driven data preparation (MLDP). Given a training and validation subset pair, the training subset is the input of MLDP, which has access to the pipeline tree (Figure 2). The MLDP identifies an optimal data preparation pipeline from the tree by solely analyzing the training subset. The preprocessed training dataset is the input for machine learning (ML) to build the prediction model. Data preparation algorithms that operate in the feature space are also applied to the validation subset (e.g., feature selection). The preprocessed validation subsets serve as inputs to the built ML prediction model to estimate cross-validation performance of the given model. ML – Machine learning; * - only preparation steps, which operate in feature space (feature selection/dimensionality reduction) are applied on validation data.
To estimate the performance of the MLDP-trained pipeline in each Monte Carlo fold, the respective validation dataset was processed by its methods that operate in the feature space (e.g., feature selection and dimensionality reduction). The reason of not executing the whole pipeline on the validation set was that some steps, such as SMOTE are operating in sample space and hence, shall only be applied on the training set (25). The processed validation cases were inputs of the RF, SVM, XGBoost, NN and MG model variants per cross-validation fold. Predictive performance estimation across 100-folds for single-center studies and across Center 2 independent validation cases of the dual-center study were done by confusion matrix analytics (24), where accuracy (ACC), sensitivity (SENS), specificity (SPEC), positive predictive value (PPV), negative predictive value (NPV) and area under the receiver operator characteristics curve (AUC) were calculated per model variant across validation samples. The significance of ML predictive model performance with and without MLDP was analyzed with ANOVA test (Microsoft Excel 2016), resulting in dedicated p-values, where p<0.05 was considered as significance threshold. The analysis was conducted over validation results across all MC folds for each predictive model. In addition, mean, standard deviation and confidence interval (CI 95%) were calculated. In order to compare the performance of MLDP to manual preparation, a fixed data preparation pipeline including feature selection and SMOTE algorithms was incorporated. The choice of data preparation steps was based on the literature review of similar works that addressed the high feature dimensionality of radiomic datasets and the highly imbalanced nature of diseases they attempted to characterize (13, 46, 47). In addition, comparisons without MLDP or any preprocessing were also performed. In latter case, the datasets were not modified at all but taken for analysis on an as-is basis.
The outlier score calculations revealed low outlier presence across all analyzed cohorts (0.0% - 2.4%). The Center 1 cohort from the DLBCL dataset presented outliers (2.4%), while Center 2 had no outliers present (0.0%). The average borderline score across all cohorts were 25.7% (21.4% - 29.6%). See Table 2 for outlier and borderline score calculations across all cohorts.
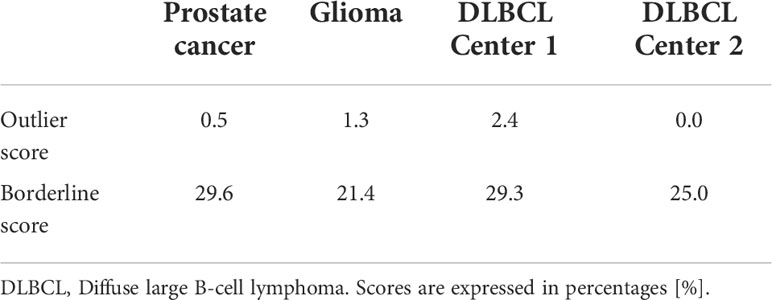
Table 2 Outlier and borderline score ratio across the MC folds of each analyzed cohort.
Analysis of data preparation method occurrences per 100 MC cross-validation folds revealed high presence of the outlier detection algorithm (IF) in pipelines with 70% - 80% occurrence in single-center cohorts. In the dual-center cohort, both IF and SMOTE were present in the optimal pipeline as provided by the MLDP. Furthermore, SMOTE yielded high presence in single-center data preparation pipelines (39% - 50%) as well as the R-Squared feature selection method (38% - 82%). Random undersampling occurred moderately (30% - 35%). Borderline SMOTE and Tomek Links showed minor impact with 0% - 4% and 0% - 14% occurrences, respectively. See Table 3 for detailed description of data preparation pipelines across the 100 Monte Carlo cross-validation folds for all cohorts.
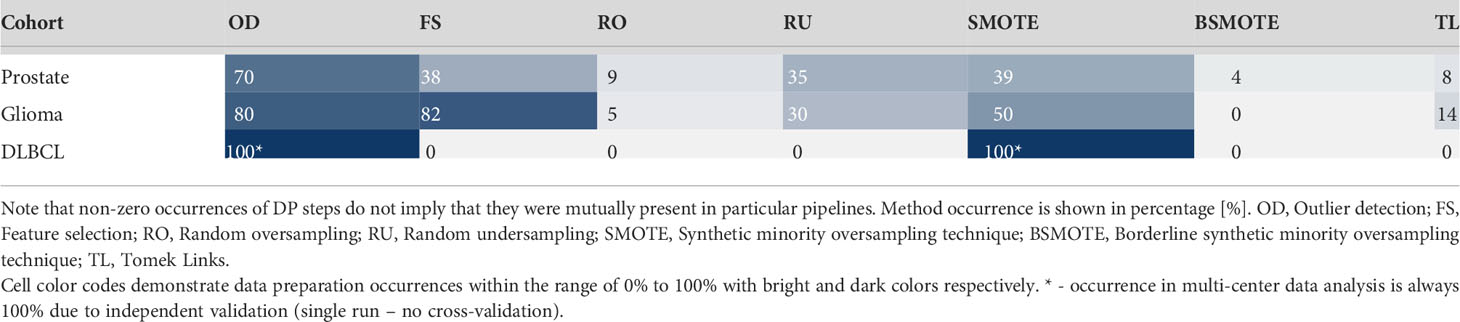
Table 3 Data preparation method occurrences across the 100 Monte Carlo cross-validation folds per cohort.
Established data preparation pipelines showed high complexities in preparation the prostate cancer, and glioma cohorts, by incorporating high numbers of data preparation methods (n=6-7). In contrast, the pipelines for preparing the training data for DLBCL machine learning analysis consisted of only two methods (Table 3).
The random forest (RF) model scheme achieved the highest performance increase of +0.16 AUC (p<0.001) with MLDP (0.87 AUC) compared to no MLDP (0.71 AUC) for predicting 36-months survival in the glioma cohort. Similarly, the SVM demonstrated a +0.13 AUC (p<0.001) increase with MLDP (0.86 AUC) compared to no MLDP (0.73 AUC) in the same cohort. In contrast, MG demonstrated the lowest performance increase of +0.01 AUC with MLDP (0.75 AUC). On average, the RF and NN models benefited the most with the average performance increase of +0.06 AUC across all cohorts, while XGBoost model demonstrated the least performance increase of +0.01 AUC. Average performance increase across all ML approaches was +0.05 AUC while utilizing MLDP.
In addition, ML schemes with utilizing MLDP outperformed the manual data preparation-based models across all cohorts, except for predicting 36-months survival in the glioma cohort where the NN model benefited equally from both data preparation approaches (0.80 AUC).
On average, the highest increase of +0.09 AUC was achieved in the glioma cohort across all ML methods when utilizing MLDP (0.85 AUC). In contrast, ML models for prostate cancer high-vs-low risk prediction benefited the least from utilizing MLDP with +0.01 AUC (0.78 AUC). See Table 4 for the cross-validation AUC of all cohorts and ML methods with and without MLDP, with manual data preparation, as well as for their respective p-values.
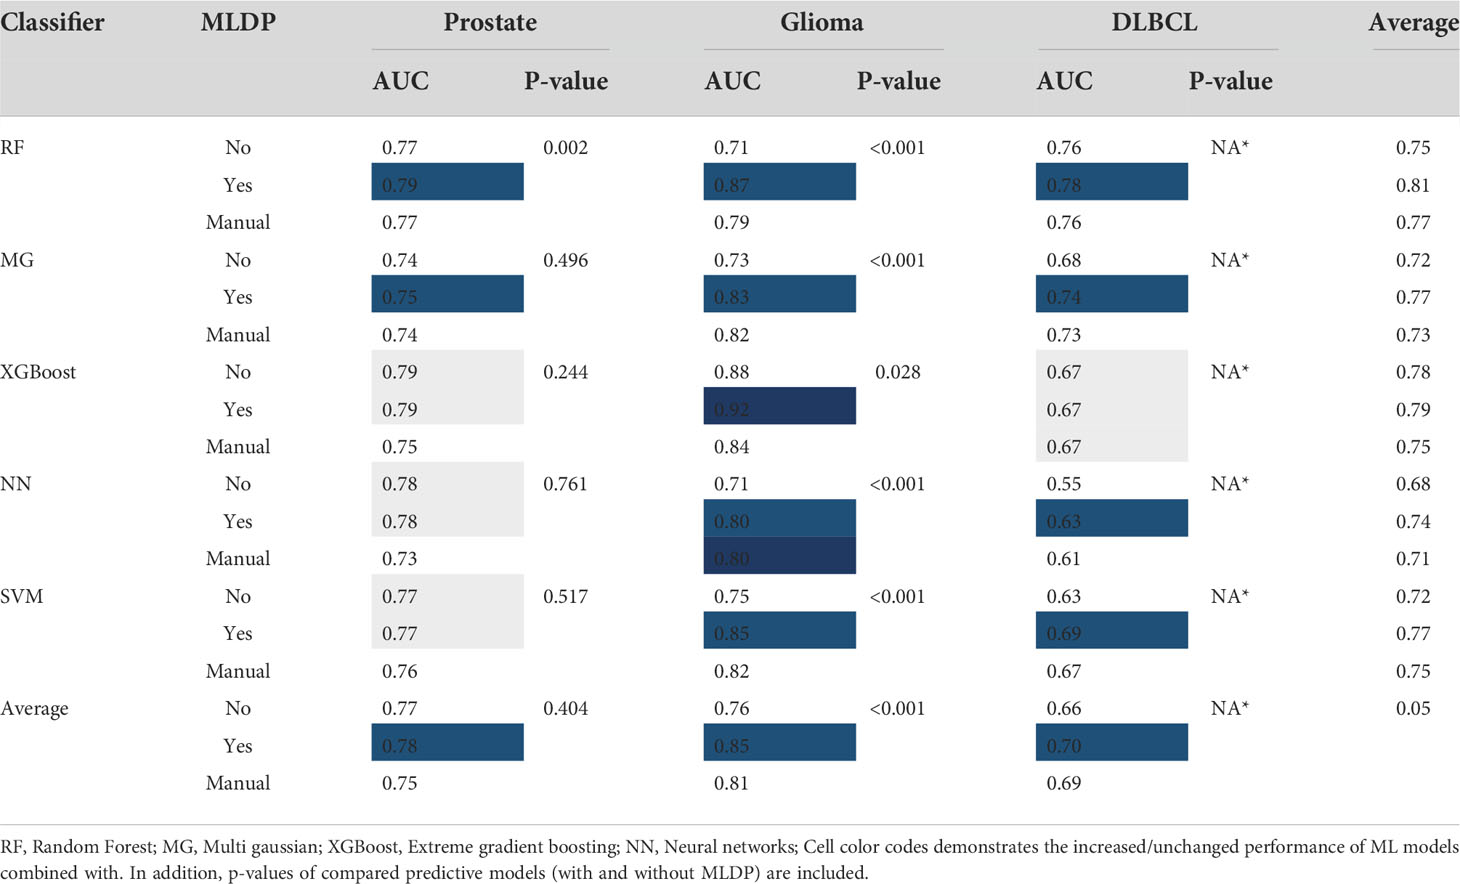
Table 4 The cross-validation area under the receiver operator characteristics curve (AUC) of all cohorts and machine learning (ML) methods with and without ML-driven data preparation (MLDP) as well as manually preprocessed across Monte (MC) cross-validation folds.
Models with unchanged AUC performance for predicting high-vs-low risk in prostate cancer cohort still demonstrated a more balanced sensitivity (SENS) and specificity (SPEC) with MLDP. Utilizing MLDP, the NN model yielded 0.77% SENS and 0.78% SPEC, respectively, compared to 0.83% SENS and 0.71% SPEC without MLDP. Similarly, the SVM model yielded 0.76% SENS and 0.78% SPEC with MLDP compared to no MLDP (0.80% SENS, 0.74% SPEC). See Supplemental S4 for sensitivity, specificity, positive predictive value, negative predictive value and accuracy cross-validation values across each model and cohort. For detailed information about conventional statistical analysis such mean, standard deviation, confidence interval (CI 95%) and p-values of each established model see Supplemental S5.
In this study we proposed a machine learning-driven data preparation approach (MLDP) to automate the building process of data preparation pipelines prior to building ML prediction models for radiomic studies. We investigated the effects of the proposed approach on machine learning predictive performance across various single and dual-center cancer cohorts and achieved up-to +0.16 AUC increase compared to performing no data preparation and up to +0.08 AUC com-pared to manually performed data preparation.
Across all ML approaches, the prediction models established for glioma cohort benefited the most from MLDP (+0.09 AUC) compared to +0.05 AUC from manual DP, while the models for prostate cohort did not significantly benefit from it. This is in line with their respective imbalance ratios (0.33 for glioma vs. 0.48 for prostate), implying, that class imbalance – even with utilizing imbalance correction approaches such as SMOTE – has the most-influential effect on ML prediction. The above findings are logical, given that most disease subtypes have an imbalanced occurrence (10, 13, 24, 25, 46–48). The RF and NN methods demonstrated the highest average AUC increase of +0.06 across all cohorts, while XGBoost yielded the lowest AUC increase of average +0.01. Nevertheless, XGBoost demonstrated a relatively high performance compared to other ML approaches before applying MLDP. We assume that this is due to the guided training process of XGBoost, also referred to as gradient boosting (44). The highest average AUC of 0.85 across all cohorts was achieved by the RF models when utilizing MLDP.
MLDP pipelines that increased overall performance the most, were also the most complex, containing an average of 6-7 data preparation steps. The highest occurrence of data preparation steps across single-center MC folds were outlier detection (70% - 80%), imbalance correction (SMOTE) (39% - 50%) and feature selection (38% - 82%) methods. On the other hand, MLDP only included two data preparation steps (OD and SMOTE) in the dual-center cohort. We consider that the high data preparation step count in single center studies may be due to the chosen cross-validation scheme. Monte Carlo cross-validation performs a random split to generate a training and a validation subset. It is one of the preferred cross-validation approaches, since it minimizes the risk of training subset selection bias (49). Nevertheless, selected splits may result in training-validation feature value distributions that are less similar compared to distributions of a dual, or multi-center dataset which represents reality. While this phenomenon appears suboptimal, it is one of the best practices to avoid overestimating single-center prediction model performance (4). Since MLDP was utilized per-training split, we assume that the high preparation step count is the result of attempting to counter-balance the above effect.
Single-center machine learning studies even with utilizing cross-validation may tend to over-estimate performance because of the bias in the data itself (49). Therefore, the characteristics of MLDP outputs shall not be interpreted solely by single-center investigations. Nevertheless, our dual-center cohort analysis successfully demonstrated the expected behavior of MLDP. Specifically, the Center 1 dataset had detectable outliers (2.4%) in the DLBCL dual-center cohort. The optimal data preparation steps as built by the MLDP contained outlier detection (OD) as a necessary step for preparation Center 1 prior to machine learning. The dual-center DLBCL dataset originated from the same country and region representing similar cohort characteristics, even though the imaging data came from two different scanner types. Consistently, the DLBCL optimal pipeline contained only two data preparation steps that were sufficient to yield high-performing prediction models in this cohort. Nevertheless, feature distribution similarities in case of multi-national and/or multi-centric datasets is not guaranteed and, thus, may require a more complex data preparation pipeline.
Even though borderline score calculations yielded relatively high presence across all cohorts (21% – 30%), we recorded low borderline handling method (BSMOTE and TL) occurrences across all data preparation pipelines (4% - 14%). This may have two reasons: first, some ML methods may be able to handle borderline cases more effectively compared to others, especially if they rely on kernel methods (e.g., SVM) or if they are ensemble approaches (e.g., RF, XGBOOST). And, secondly, the Tomek Links approach may overestimate the percentage of borderline samples, as it does not consider individual ML strategies to handle such samples.
The application of data preparation principles has been recently increasing in machine learning, radiomics and imaging analysis studies (50) (13, 24, 25, 46–48). These studies rely on manually pre-selected singular data preparation steps or combining thereof. Cysouw et al. performed dimensionality reduction by applying the principal component analysis (PCA); in addition, they performed subclass imbalance correction using SMOTE to characterize prostate cancer in [18F]DCFPyL PET (13). Umutlu et al. utilized least absolute shrinkage and selection operator (LASSO) regression to perform feature preselection, and in addition the employed adaptive synthetic (ADASYN) approach for subclass imbalance correction in their [18F]-FDG PET/MRI study to predict hormone receptor status and proliferation rate (48). Chang et al. employed SMOTE as subclass imbalance correction technique in their PET/CT radiomics study to predict anaplastic lymphoma kinase (ALK) rearrangement status in lung adenocarcinoma. In addition, they utilized LASSO regression for feature selection (46). Sanduleanu et al. employed recursive feature elimination (RFE) for feature selection, combined with SMOTE for subclass imbalance correction in their [18F]FDG-PET/CT radiomics study to predict tumor hypoxia (47). Parmar et al. investigated the effects of various feature selection algorithms combined with different ML classifiers to establish the highest performing predictive model for lung cancer and head and neck cancer cohorts (51, 52). Authors reported highest performing models of 0.69 AUC and 0.68 AUC respectively over independent validation data. Xie et al. investigated class imbalance correction approaches in a cohort of head and neck cancer patients in their [18F]FDG-PET/CT-based radiomics study, by testing various resampling techniques for generating minority subclass samples and for cleaning noisy and redundant data (25). Authors evaluated their preprocessed data using various classifiers, with highest reported performance increase of +0.32 AUC (0.50 AUC vs 0.82 AUC) with applying data resampling techniques. Their study utilized individual pre-processing methods, without combining them prior to machine learning. Furthermore, only Xie et al. compared predictive performance with and without data preparation (25). Lv et al. employed LASSO logistic regression for feature selection combined with various oversampling techniques for imbalance correction to predict lymph node metastasis (LNM) in clinical stage T1 lung adenocarcinoma (LUAD). The authors reported highest performance increase of +0.05 AUC (0.70 AUC vs 0.75 AUC) utilizing the edited nearest neighbors (ENN) method (53). Du et al. utilized various feature selection techniques combined with different classification algorithms for recurrence vs inflammation differentiation model establishment. The authors reported highest predictive performance of 0.89 AUC (0.83 sensitivity vs 0.87 specificity) utilizing the cross-combination of fisher score (FSCR) and random forest classifier (54). None of the above studies performed hyperparameter optimization of the utilized data preparation methods or automatized the building of data preparation pipelines.
Compared to the above studies, our proposed data preparation approach differs in several aspects: First, prior studies focused only on subclass imbalance correction and feature preselection, without handling outliers in their training data. Second, prior studies performed data preparation manually. This allows retesting various data preparation steps while utilizing the whole dataset prior to executing and reporting the given study, thus, may expose the given study to data leakage. In contrast, our approach provides a data preparation pipeline for the given data automatically, eliminating the possibility of data leakage that may occur due to incremental manual reuse of the whole dataset. Third, our solution provides hyperparameter optimization of various data preparation approaches being present in each pipeline on subsets of the training set.
The above findings imply that data preparation is indeed a non-trivial approach, however, it is a pre-requisite for state-of-the-art machine learning. Given the high level of expertise and the amount of time required to build optimal data preparation pipelines (27, 28), we argue that such activities may likely result in suboptimal prediction models, when performed manually. Given the above characteristics of our MLDP, it is applicable to a wide range of machine learning scenarios even beyond the scope of medical imaging. In contrast to the above, we wish to emphasize that MLDP does not substitute high-quality input data or clinical domain knowledge, which is still a prerequisite – even with utilizing MLDP – to properly collect, interpret and annotate data as well as to identify clinically-relevant hypotheses to be tested by building prediction models.
We also wish to highlight the relationship of our MLDP approach to automated machine learning (AutoML) approaches (30, 55). AutoML optimizes data preparation and ML classifier hyperparameters together. Therefore, in case of AutoML, the contribution of DP steps is not possible to analyze in retrospect. In contrast, our MLDP approach intentionally wishes to handle DP independently from ML, as it can better support the identification of biomarkers and the interpretation of data characteristics for clinicians before ML takes place.
Nonetheless, our study has a few limitations: First, only a limited number of preparation methods was included in the MLDP. Therefore, extending it with additional data preparation approaches may increase the resulting ML model performances. Second, we used default parameters for the utilized ML algorithms to build prediction models, while hyperparameter optimization (56) may further increase predictive performance.
Automated data preparation (MLDP) can help increase the predictive performance of machine learning models, while eliminating the need of manual interventions to preprocess the data. Therefore, we consider that future machine learning studies, particularly in the field of clinical research shall rely on MLDP as a standard data preparation approach instead of performing such steps manually.
The raw data supporting the conclusions of this article will be made available by the authors, without undue reservation.
The studies involving human participants were reviewed and approved by Local Ethics Committee, Medical University of Vienna, Vienna, Austria. The patients/participants provided their written informed consent to participate in this study.
Concept and design: DK and LP; Data acquisition: SR, NP, TT-W, ZR, HA, and AH; Data analysis/interpretation: DK, LP, CS, MG, and BE; Drafting of the manuscript: DK and LP; Critical revision of the manuscript: All; Statistical analysis: DK and LP; Administration, financial, or material support: TB and MH; Supervision: LP, TB, and MH; All authors contributed to the article and approved the submitted version.
MH, LP, and TB are co-founders of Dedicaid GmbH, Austria.
The remaining authors declare that the research was conducted in the absence of any commercial or financial relationships that could be construed as a potential conflict of interest.
All claims expressed in this article are solely those of the authors and do not necessarily represent those of their affiliated organizations, or those of the publisher, the editors and the reviewers. Any product that may be evaluated in this article, or claim that may be made by its manufacturer, is not guaranteed or endorsed by the publisher.
The Supplementary Material for this article can be found online at: https://www.frontiersin.org/articles/10.3389/fonc.2022.1017911/full#supplementary-material
1. (WHO). WHO. cancer (2021). Available at: https://www.who.int/news-room/fact-sheets/detail/cancer.
2. Kircher MF, Hricak H, Larson SM. Molecular imaging for personalized cancer care. Mol Oncol (2012) 6(2):182–95. doi: 10.1016/j.molonc.2012.02.005
3. Garg PK, Deo SVS, Kumar R, Shukla NK, Thulkar S, Gogia A, et al. Staging PET–CT scanning provides superior detection of lymph nodes and distant metastases than traditional imaging in locally advanced breast cancer. World J Surg (2016) 40(8):2036–42. doi: 10.1007/s00268-016-3570-6
4. Papp L, Spielvogel CP, Rausch I, Hacker M, Beyer T. Personalizing medicine through hybrid imaging and medical big data analysis. Front Phys (2018) 6. doi: 10.3389/fphy.2018.00051
5. Mayerhoefer ME, Materka A, Langs G, Häggström I, Szczypiński P, Gibbs P, et al. Introduction to radiomics. J Nucl Med (2020) 61(4):488–95. doi: 10.2967/jnumed.118.222893
6. Bologna M, Corino V, Calareso G, Tenconi C, Alfieri S, Iacovelli NA, et al. Baseline MRI-radiomics can predict overall survival in non-endemic EBV-related nasopharyngeal carcinoma patients. Cancers (2020) 12(10):1–20. doi: 10.3390/cancers12102958
7. Choi YS, Ahn SS, Chang JH, Kang S-G, Kim EH, Kim SH, et al. Machine learning and radiomic phenotyping of lower grade gliomas: improving survival prediction. Eur Radiol (2020) 30(7):3834–42. doi: 10.1007/s00330-020-06737-5
8. Zwanenburg A, Vallières M, Abdalah MA, Aerts HJWL, Andrearczyk V, Apte A, et al. The image biomarker standardization initiative: Standardized quantitative radiomics for high-throughput image-based phenotyping. Radiology (2020) 295(2):328–38. doi: 10.1148/radiol.2020191145
9. Gitto S, Cuocolo R, Albano D, Chianca V, Messina C, Gambino A, et al. MRI Radiomics-based machine-learning classification of bone chondrosarcoma. Eur J Radiol (2020) 128:1–6. doi: 10.1016/j.ejrad.2020.109043
10. Papp L, Spielvogel CP, Grubmüller B, Grahovac M, Krajnc D, Ecsedi B, et al. Supervised machine learning enables non-invasive lesion characterization in primary prostate cancer with [68Ga]Ga-PSMA-11 PET/MRI. Eur J Nucl Med Mol Imaging (2020) 48(6):1795–805. doi: 10.1007/s00259-020-05140-y
11. Toyama Y, Hotta M, Motoi F, Takanami K, Minamimoto R, Takase K. Prognostic value of FDG-PET radiomics with machine learning in pancreatic cancer. Sci Rep (2020) 10(1):1–8. doi: 10.1038/s41598-020-73237-3
12. Ren C, Zhang J, Qi M, Zhang J, Zhang Y, Song S, et al. Machine learning based on clinico-biological features integrated 18F-FDG PET/CT radiomics for distinguishing squamous cell carcinoma from adenocarcinoma of lung. Eur J Nucl Med Mol Imaging (2020) 48(5):1538–49. doi: 10.1007/s00259-020-05065-6
13. Cysouw MCF, Jansen BHE, van de Brug T, Oprea-Lager DE, Pfaehler E, de Vries BM, et al. Machine learning-based analysis of [18F]DCFPyL PET radiomics for risk stratification in primary prostate cancer. Eur J Nucl Med Mol Imaging (2020) 48(2):340–9. doi: 10.1007/s00259-020-04971-z
14. Kniep HC, Madesta F, Schneider T, Hanning U, Schönfeld MH, Schön G, et al. Radiomics of brain MRI: Utility in prediction of metastatic tumor type. Radiology (2019) 290(2):479–87. doi: 10.1148/radiol.2018180946
15. LeCun Y, Bengio Y, Hinton G. Deep learning. Nature (2015) 521(7553):436–44. doi: 10.1038/nature14539
16. Sarker IH. Deep learning: A comprehensive overview on techniques, taxonomy, applications and research directions. SN Comput Sci (2021) 2(6):1–20. doi: 10.1007/s42979-021-00815-1
17. Hoffmann J, Bar-Sinai Y, Lee LM, Andrejevic J, Mishra S, Rubinstein SM, et al. Machine learning in a data-limited regime: Augmenting experiments with synthetic data uncovers order in crumpled sheets. Sci Adv (2019) 5(4):1–8. doi: 10.1126/sciadv.aau6792
18. Zhao H, Wang Z, Nie F. A new formulation of linear discriminant analysis for robust dimensionality reduction. IEEE Trans Knowl Data Eng (2019) 31(4):629–40. doi: 10.1109/TKDE.2018.2842023
19. Liu D, Qian H, Dai G, Zhang Z. An iterative SVM approach to feature selection and classification in high-dimensional datasets. Pattern Recognit (2013) 46(9):2531–7. doi: 10.1016/j.patcog.2013.02.007
20. Nnamoko N, Korkontzelos I. Efficient treatment of outliers and class imbalance for diabetes prediction. Artif Intell Med (2020) 104:1–12. doi: 10.1016/j.artmed.2020.101815
21. Luo Z, Parv H, Garg H, Pho K-H. Dealing with imbalanced dataset leveraging boundary samples discovered by support vector data description. computers. Mater Continua (2021) 66(3):2691–708. doi: 10.32604/cmc.2021.012547
22. Johnson JM, Khoshgoftaar TM. Survey on deep learning with class imbalance. J Big Data (2019) 6(1):1–54. doi: 10.1186/s40537-019-0192-5
23. Haixiang G, Yijing L, Shang J, Mingyun G, Yuanyue H, Bing G. Learning from class-imbalanced data: Review of methods and applications. Expert Syst Appl (2017) 73:220–39. doi: 10.1016/j.eswa.2016.12.035
24. Krajnc D, Papp L, Nakuz TS, Magometschnigg HF, Grahovac M, Spielvogel CP, et al. Breast tumor characterization using [18F]FDG-PET/CT imaging combined with data preprocessing and radiomics. Cancers (2021) 13(6):1–18. doi: 10.3390/cancers13061249
25. Xie C, Du R, Ho JWK, Pang HH, Chiu KWH, Lee EYP, et al. Effect of machine learning re-sampling techniques for imbalanced datasets in 18F-FDG PET-based radiomics model on prognostication performance in cohorts of head and neck cancer patients. Eur J Nucl Med Mol Imaging (2020) 47(12):2826–35. doi: 10.1007/s00259-020-04756-4
26. Romeo V, Clauser P, Rasul S, Kapetas P, Gibbs P, Baltzer PAT, et al. AI-Enhanced simultaneous multiparametric 18F-FDG PET/MRI for accurate breast cancer diagnosis. IECON 2010 - 36th Annual Conference on IEEE Industrial Electronics Society. USA:IEEE Computer Society (2021) 49(2):596–608. doi: 10.1007/s00259-021-05492-z
27. Balatsko M. All you want to know about preprocessing (2019). Available at: https://towardsdatascience.com/all-you-want-to-know-about-preprocessing-data-preparation-b6c2866071d4.
28. Press G. Cleaning big data: Most time-consuming, least enjoyable data science task (2016). Available at: https://www.forbes.com/sites/gilpress/2016/03/23/data-preparation-most-time-consuming-least-enjoyable-data-science-task-survey-says/?sh=7ae89506f637.
29. Papp L, Pötsch N, Grahovac M, Schmidbauer V, Woehrer A, Preusser M, et al. Glioma survival prediction with combined analysis of In vivo 11C-MET PET features, ex vivo features, and patient features by supervised machine learning. J Nucl Med (2018) 59(6):892–9. doi: 10.2967/jnumed.117.202267
30. Ritter Z, Papp L, Zámbó K, Tóth Z, Dezső D, Veres DS, et al. Two-year event-free survival prediction in DLBCL patients based on In vivo radiomics and clinical parameters. Front Oncol (2022) 12:1–11. doi: 10.3389/fonc.2022.820136
31. Liu FT, Ting KM, Zhou Z-H. (2008). Isolation forest, in: 2008 Eighth IEEE International Conference on Data Mining, (USA: IEEE). pp. 413–22.
32. Elhassan TMA. Classification of imbalance data using tomek Link(T-link) combined with random under-sampling (RUS) as a data reduction method. J Inf Data Min (2016) 1(2):1–11. doi: 10.4172/2229-8711.S1:111
33. Chawla NV, Bowyer KW, Hall LO, Kegelmeyer WP. SMOTE: Synthetic minority over-sampling technique. J Artif Intell Res (2002) 16:321–57. doi: 10.1613/jair.953
34. Nguyen HM, Cooper EW, Kamei K. Borderline over-sampling for imbalanced data classification. Int J Knowl Eng Soft Data Paradigms (2011) 3(1):24–9. doi: 10.1504/IJKESDP.2011.039875
35. Zhang J, Chen L. Clustering-based undersampling with random over sampling examples and support vector machine for imbalanced classification of breast cancer diagnosis. Comput Assist Surg (2019) 24(sup2):62–72. doi: 10.1080/24699322.2019.1649074
36. Marcano-Cedeno A, Quintanilla-Dominguez J, Cortina-Januchs MG, Andina D. (2010). Feature selection using sequential forward selection and classification applying artificial metaplasticity neural network, in: IECON 2010 - 36th Annual Conference on IEEE Industrial Electronics Society, (USA: IEEE Computer Society). pp. 2845–50.
37. Jolliffe IT, Cadima J. Principal component analysis: a review and recent developments. Philos Trans R Soc A: Math Phys Eng Sci (2065) 2016:374. doi: 10.1098/rsta.2015.0202
38. Bartz-Beielstein T, Branke J, Mehnen J, Mersmann O. Evolutionary algorithms. Wiley interdisciplinary reviews. Data Min Knowl Discov (2014) 4(3):178–95. doi: 10.1002/widm.1124
39. Droste S, Jansen T, Rudolph G, Schwefel H-P, Tinnefeld K, Wegener I. Theory of Evolutionary Algorithms and Genetic Programming. In: Schwefel HP, Wegener I, Weinert K (eds) Advances in Computational Intelligence. Natural Computing Series. Springer, Berlin, Heidelberg. doi: 10.1007/978-3-662-05609-7_5
40. Vikhar PA. Evolutionary algorithms: A critical review and its future prospects. 2016 international conference on global trends in signal processing. Inf Comput Commun (ICGTSPICC) (2016), 261–5. doi: 10.1109/ICGTSPICC.2016.7955308
41. Xu Q-S, Liang Y-Z. Monte Carlo Cross validation. Chemometr Intell Lab Syst (2001) 56(1):1–11. doi: 10.1016/S0169-7439(00)00122-2
42. Sarica A, Cerasa A, Quattrone A. Random forest algorithm for the classification of neuroimaging data in alzheimer’s disease: A systematic review. Front Aging Neurosci (2017) 9. doi: 10.3389/fnagi.2017.00329
43. Cristianini N, Ricci E. Support vector machines. Encyclopedia Algorithms (2008) Boston, MA: Springer, 928–32. doi: 10.1007/978-0-387-30162-4_415
44. Chen T, Guestrin C. (2016). XGBoost, in: KDD '16: Proceedings of the 22nd ACM SIGKDD International Conference on Knowledge Discovery and Data Mining, (New York, NY, USA: ACM). pp. 785–94.
45. Grossi E, Buscema M. Introduction to artificial neural networks. Eur J Gastroenterol Hepatol (2007) 19(12):1046–54. doi: 10.1097/MEG.0b013e3282f198a0
46. Chang C, Sun X, Wang G, Yu H, Zhao W, Ge Y, et al. A machine learning model based on PET/CT radiomics and clinical characteristics predicts ALK rearrangement status in lung adenocarcinoma. Front Oncol (2021) 11. doi: 10.3389/fonc.2021.603882
47. Sanduleanu S, Jochems A, Upadhaya T, Even AJG, Leijenaar RTH, Dankers FJWM, et al. Non-invasive imaging prediction of tumor hypoxia: A novel developed and externally validated CT and FDG-PET-based radiomic signatures. Radiother Oncol (2020) 153:97–105. doi: 10.1016/j.radonc.2020.10.016
48. Umutlu L, Kirchner J, Bruckmann NM, Morawitz J, Antoch G, Ingenwerth M, et al. Multiparametric integrated 18F-FDG PET/MRI-based radiomics for breast cancer phenotyping and tumor decoding. Cancers (2021) 13(12):1–13. doi: 10.3390/cancers13122928
49. Guo L, Liu J, Lu R. Subsampling bias and the best-discrepancy systematic cross validation. Sci China Math (2019) 64(1):197–210. doi: 10.1007/s11425-018-9561-0
50. Castiglioni I, Rundo L, Codari M, Di Leo G, Salvatore C, Interlenghi M, et al. AI Applications to medical images: From machine learning to deep learning. Physica Med (2021) 83:9–24. doi: 10.1016/j.ejmp.2021.02.006
51. Parmar C, Grossmann P, Bussink J, Lambin P, Aerts H. Machine learning methods for quantitative radiomic biomarkers. Sci Rep (2015) 5:13087. doi: 10.1038/srep13087
52. Parmar C, Grossmann P, Rietveld D, Rietbergen MM, Lambin P, Aerts HJ. Radiomic machine-learning classifiers for prognostic biomarkers of head and neck cancer. Front Oncol (2015) 5:272. doi: 10.3389/fonc.2015.00272
53. Lv J, Chen X, Liu X, Du D, Lv W, Lu L, et al. Imbalanced data correction based PET/CT radiomics model for predicting lymph node metastasis in clinical stage T1 lung adenocarcinoma. Front Oncol (2022) 12. doi: 10.3389/fonc.2022.788968
54. Du D, Feng H, Lv W, Ashrafinia S, Yuan Q, Wang Q, et al. Machine learning methods for optimal radiomics-based differentiation between recurrence and inflammation: Application to nasopharyngeal carcinoma post-therapy PET/CT images. Mol Imaging Biol (2019) 22(3):730–8. doi: 10.1007/s11307-019-01411-9
55. Hasimbegovic E, Papp L, Grahovac M, Krajnc D, Poschner T, Hasan W, et al. A sneak-peek into the physician’s brain: A retrospective machine learning-driven investigation of decision-making in TAVR versus SAVR for young high-risk patients with severe symptomatic aortic stenosis. J Person Med (2021) 11(11):1–14. doi: 10.3390/jpm11111062
Keywords: cancer, hybrid imaging, PET, data preprocessing, machine learning
Citation: Krajnc D, Spielvogel CP, Grahovac M, Ecsedi B, Rasul S, Poetsch N, Traub-Weidinger T, Haug AR, Ritter Z, Alizadeh H, Hacker M, Beyer T and Papp L (2022) Automated data preparation for in vivo tumor characterization with machine learning. Front. Oncol. 12:1017911. doi: 10.3389/fonc.2022.1017911
Received: 12 August 2022; Accepted: 23 September 2022;
Published: 11 October 2022.
Edited by:
Yousef Mazaheri, Memorial Sloan Kettering Cancer Center, United StatesReviewed by:
Madjid Soltani, University of Waterloo, CanadaCopyright © 2022 Krajnc, Spielvogel, Grahovac, Ecsedi, Rasul, Poetsch, Traub-Weidinger, Haug, Ritter, Alizadeh, Hacker, Beyer and Papp. This is an open-access article distributed under the terms of the Creative Commons Attribution License (CC BY). The use, distribution or reproduction in other forums is permitted, provided the original author(s) and the copyright owner(s) are credited and that the original publication in this journal is cited, in accordance with accepted academic practice. No use, distribution or reproduction is permitted which does not comply with these terms.
*Correspondence: Thomas Beyer, dGhvbWFzLmJleWVyQG1lZHVuaXdpZW4uYWMuYXQ=
Disclaimer: All claims expressed in this article are solely those of the authors and do not necessarily represent those of their affiliated organizations, or those of the publisher, the editors and the reviewers. Any product that may be evaluated in this article or claim that may be made by its manufacturer is not guaranteed or endorsed by the publisher.
Research integrity at Frontiers
Learn more about the work of our research integrity team to safeguard the quality of each article we publish.