 Yuancheng Huang1†
 Yushan Zou1†
 Yanhua Tian1
 Zehong Yang1
 Zhengkun Hou2Peiwu Li2Fengbin Liu2,3*Jiasheng Ling4*Yi Wen2*
- 1First Clinical Medical College, Guangzhou University of Chinese Medicine, Guangzhou, Guangdong, China
- 2Department of Gastroenterology, The First Affiliated Hospital of Guangzhou University of Chinese Medicine, Guangzhou, Guangdong, China
- 3Department of Gastroenterology, Baiyun Branch of the First Affiliated Hospital of Guangzhou University of Chinese Medicine, Guangzhou, Guangdong, China
- 4Department of Gastroenterology, Huizhou Hospital of Traditional Chinese Medicine, Huizhou, Guangdong, China
Objectives: This study aimed to probe into the significance of N6-methyladenosine (m6A)-related immune genes (m6AIGs) in predicting prognoses and immune landscapes of patients with gastric cancer (GC).
Methods: The clinical data and transcriptomic matrix of GC patients were acquired from The Cancer Genome Atlas database. The clinically meaningful m6AIGs were acquired by univariate Cox regression analysis. GC patients were stratified into different clusters via consensus clustering analysis and different risk subgroups via m6AIGs prognostic signature. The clinicopathological features and tumor microenvironment (TME) in the different clusters and different risk subgroups were explored. The predictive performance was evaluated using the KM method, ROC curves, and univariate and multivariate regression analyses. Moreover, we fabricated a nomogram based on risk scores and clinical risk characteristics. Biological functional analysis was performed based on Gene Ontology and Kyoto Encyclopedia of Genes and Genomes pathways. The connectivity map was used to screen out potential small molecule drugs for GC patients.
Results: A total of 14 prognostic m6AIGs and two clusters based on 14 prognostic m6AIGs were identified. A prognostic signature based on 4 m6AIGs and a nomogram based on independent prognostic factors was constructed and validated. Different clusters and different risk subgroups were significantly correlated with TME scores, the distribution of immune cells, and the expression of immune checkpoint genes. Some malignant and immune biological processes and pathways were correlated with the patients with poor prognosis. Ten small molecular drugs with potential therapeutic effect were screened out.
Conclusions: This study revealed the prognostic role and significant values of m6AIGs in GC, which enhanced the understanding of m6AIGs and paved the way for developing predictive biomarkers and therapeutic targets for GC.
Introduction
As the fifth most prevalent cancer and third most lethal neoplasm worldwide, gastric cancer (GC) presents a nonnegligible threat to global health (1). Key contributors to the high mortality of GC include its low early diagnostic rate and poor curative effect in the advanced stage (2, 3). Recently, targeted therapy and immunotherapy have shown their clinical efficacy in improving the prognosis of GC patients (4). Therefore, searching for novel biomarkers and effective therapeutic targets for GC patients is of increasing importance.
RNAs in eukaryotic cells are discovered to have over 100 different kinds of post-transcriptional modifications, which are associated with RNA stability, processing, and so on (5). N6-methyladenosine (m6A), is a methylation modification of the sixth nitrogen atom of adenine, widely present in messenger RNAs, pri-microRNAs, long non-coding RNAs, and circular RNAs, is the most dominant and enriched kind of internal RNA modification in eukaryotes (6). Involving multiple tumor-related biological processes, m6A modification is a reversible process, which is controlled under the three types of m6A regulator (methyltransferases “writers”, for demethylases “erasers”, and binding proteins “readers”) (7), which involved in various biological processes related to the occurrence and progression of different cancers, including GC (8, 9). For example, METTL3 could improve the stability of HDGF by stimulating m6A modification, which accelerates the progression of GC (10). Moreover, METTL3, through an m6A DGCR8-dependent method, could accelerate the processing of pri-miR-17, which facilitates the development of GC by activating the AKT/mTOR pathway (11). The m6A modification of METTL3 also enhances the expression of long non-coding RNAs THAP7-AS1, which exerts oncogenic functions in GC (12).
There is plenty of evidence that the immune system is pivotal to the occurrence and development of cancers (13). Immune cells take key a part in immune surveillance, which recognizes cancer-associated antigens and eradicates cancer cells (14). In recent years, accumulating evidence has shown that cancer immunotherapy has significant efficacy, which could prolong the overall survival (OS) of patients (15). However, the number of patients achieving clinical benefits is small, primarily due to the immunosuppression in the complicated tumor microenvironment (TME) (16). The TME, composing immune-related cells, blood vessels, cytokines, extracellular matrix, adipocytes, myofibroblasts, fibroblasts, and neuroendocrine cells, induces changes in the phenotype of cancer cells and immune cells to promote immune escape by complex molecular mechanisms (17, 18). The association of immune cells and immune-related genes with GC have been demonstrated by an increasing number of studies (19, 20). Additionally, immune-related genes and immune cells also present tremendous latent value in serving as novel prognostic biomarkers of GC patients (21–23).
Epigenetic and immune therapy has been under concentrated investigation for many years, and there has been evidence that the inhibitors of histone methyltransferase and DNA methyltransferase could facilitate anti-tumor immunity (24). Recently, the RNA modification m6A has been identified as a key regulator in the immune system, such as immune recognition and immune responses (25, 26). For instance, the m6A modification could regulate durable neoantigen-specific immunity (27). The m6A modification of CD40 and CD80 could stimulate T-cell activation by enhancing their translation in dendritic cells (28). Notwithstanding, the full role of m6A-related immune genes (m6AIGs) for patients with GC has never been systematically evaluated.
Here, we analyzed The Cancer Genome Atlas (TCGA) database for m6AIGs involved in GC, identified two clusters based on prognostic m6AIGs, and constructed an m6AIGs prognostic signature (m6AIGs-PS) for GC patients. Then, we further explore the correlation of m6AIGs with clinicopathological features, TME scores, TME infiltrating immune cells (TIICs), and immune checkpoint genes (ICGs), as well as biological function. Subsequently, based on the connectivity map (CMap) database, small molecule drugs having the potential to suppress high-risk gene expression in GC were identified. These findings as a revelation of the critical role of m6AIGs and disclosed the latent relationship and the underlying mechanism between m6AIGs and tumor-immune interactions.
Methods and materials
Data collection
Raw data, composed of transcriptomic matrix and clinical information of GC (375 samples) and normal tissues (32 samples), was downloaded from the TCGA database (https://portal.gdc.cancer.gov/).
Selection of immune-related gene and m6A-related regulators
The immune-related genes were downloaded from InnateDB (https://www.innatedb.com/) and ImmPort (https://www.immport.org/) respectively (29, 30). The above-obtained genes were combined and a total of 3179 immune-related genes were included. Based on published data (6, 7, 31), 23 m6A-related regulators, including ZC3H13, RBM15, RBM15B, METTL3, METTL16, METTL14, YTHDC1, YTHDC2, WTAP, VIRMA, HNRNPC, FMR1, LRPPRC, YTHDF1, YTHDF2, YTHDF3, HNRNPA2B1, IGFBP3, FTO, IGFBP2, RBMX, IGFBP1, and ALKBH5, were used in our study.
Identification of prognostic m6AIGs
Primarily, m6AIGs were filtrated by performing correlation analysis between m6A-related regulators and immune-related genes. To filtrate the prognostic m6AIGs, a univariate Cox regression analysis was conducted. The correlation analysis between prognostic m6AIGs and m6A-related regulators was implemented.
Consistent clustering of m6AIGs
To determine subgroups of GC, we used the R package “ConsensusClusterPlus” for the consistent clustering based on the expression pattern of prognostic m6AIGs as the previous study (32). Using the K-mean cluster algorithm and the Euclidean squared distance metric, the optimal clustering amount was confirmed by the clustering score.
To explore the role of m6AIGs in GC, the different clinicopathological features, OS, TME scores, the content of TIICs, and the expression of ICGs of different clusters were compared as the previous study (33). The content of TIICs was recognized through CIBERSORT (34), and TME immune scores were counted based on the “ESTIMATE” package (35).
Establishment and validation of m6AIGs-PS
The included patients were randomly segmented into two cohorts of approximately equal numbers (the training cohort with 169 samples and the test cohort containing 168 samples). Thereafter, based on prognostic m6AIGs and the training cohort, the least absolute shrinkage and selection operator (LASSO) Cox regression algorithm was performed to establish m6AIGs-PS, which could screen out m6AIGs with optimal performance and calculate their coefficients. The risk score (RS) was estimated using the following formula: RS= coef (m6AIGs1) × expr (m6AIGs1) + coef (m6AIGs2) × expr (m6AIGs2) +…… + coef (m6AIGsn) × expr (m6AIGsn). The coef (m6AIGsn) was the coefficient of prognostic m6AIGs, and expr (m6AIGsn) was the expression of m6AIGs. Based on m6AIGs-PS, the training cohort was segmented into two groups: the high-risk group and the low-risk group. The predictive performance of m6AIGs-PS was verified by the receiver operating characteristic (ROC) curves and Kaplan-Meier (KM) analysis. Moreover, to further validate the accuracy of m6AIGs-PS, the same methods were performed in the test cohort and the combined cohort. Furthermore, principal component analysis (PCA) was used to assess the clustering ability of RS. In addition, univariate and multivariate Cox regression analyses were used to examine the predictive performance of RS.
Establishment and evaluation of a nomogram
To fully expand the predictive performance of m6AIGs-PS, we constructed another quantitative method, nomogram to predict the individual probability of survival based on the independent prognostic factors by using “rms” package in R (36).
Clinical application of m6AIGs-PS
To explore the clinical application of m6AIGs-PS, the different clinicopathological characteristics, the expression of ICGs, the content of TIICs, and the TME scores of different risk subgroups were compared. Additionally, the association between OS and the content of TIICs and TME scores was also investigated.
Functional enrichment analysis
To explore the biological functions associated with m6AIGs, Gene Set Enrichment Analysis (GSEA), Kyoto Encyclopedia of Genes and Genomes (KEGG) pathway, and Gene Ontology (GO) analysis were performed. Genes in different risk subgroups and different clusters were functionally annotated by GSEA. With the “edgeR” package in R, differentially expressed genes (DEGs) (|fold change| > 1 and p < 0.05) between different risk subgroups and different clusters were screened out and applied to GO and KEGG pathway analysis.
Screening of potential small molecule drugs
To predict potential small molecule drugs for GC, the connectivity map (CMap) (https://portals.broadinstitute.org/cmap/) database was used (37). These small molecule drugs were identified based on DEGs between different risk subgroups. The drugs (p < 0.05) were ranked according to negative connectivity value. The 3D structures of the three most significant drugs were obtained from PubChem (https://pubchem.ncbi.nlm.nih.gov/).
Quantitative reverse transcription-polymerase chain reaction
The RNA Purification Kit (EZBioscience, USA), Color Reverse Transcription Kit (EZBioscience, USA), and Color SYBR Green qPCR Master Mix (EZBioscience, USA) were used for RNA extraction, reverse transcription, and qRT-PCR according to their manufacturer’s instructions. GAPDH was used as an endogenous control. Primers sequences used in our study were as follows: GAPDH forward 5’-GGACCTGACCTGCCGTCTAG-3’, and reverse 5’-GTAGCCCAGGATGCCCTTGA-3’; PAEP forward 5’-GCGACCAACAACATCTCCCTC-3’, and reverse 5’-CGACACAACTCTTCTTCCAGC-3’; NPR1 forward 5’-GCAAAGGCCGAGTTATCTACATC-3’, and reverse 5’-AACGTAGTCCTCCCCACACAA-3’; GLP2R forward 5’-CTTATTCCTTTCCTGGC-3’, and reverse 5’-GACAGGTAGGACATCCACC-3’; FANCC forward 5’-GGCAAAAGCTTGTTGGAATC-3’, and reverse 5’-CCAGGAGTTAAGTTTTGATTGTCC-3’.
Statistical analysis
The expression data were compared using a one-way analysis of variance; the clinicopathological characteristics of different subgroups were compared using the chi-square test; the KM method was used to perform a bilateral logarithmic rank test in OS analysis; p < 0.05 were regarded as statistically significant. R v4.0.3 (https://www.r-project.org/) or Spss software (Version 20.0) or GraphPad Prism software (Version 8.0) were used for all statistical analyses.
Results
Identification of prognostic m6AIGs in GC
To clearly illustrate the process of our study, a flow chart is shown in Figure 1. The expression levels of m6A-related regulators and immune-related genes were extracted respectively. 73 m6AIGs were identified (|cor| > 0.4, p < 0.001) through coexpression analysis. 23 m6A-related regulators and 73 m6AIGs were shown in co-expression network (Figure 2A). 14 m6AIGs having a dramatic correlation with OS were identified via univariate Cox analyses (p < 0.05) (Figure 2B). The co-expression relationship between the candidate m6AIGs and m6A-related regulators was shown in Figure 2C. The expression pattern of the 14 prognosis-related m6AIGs was shown in the heatmap (Figure 2D).
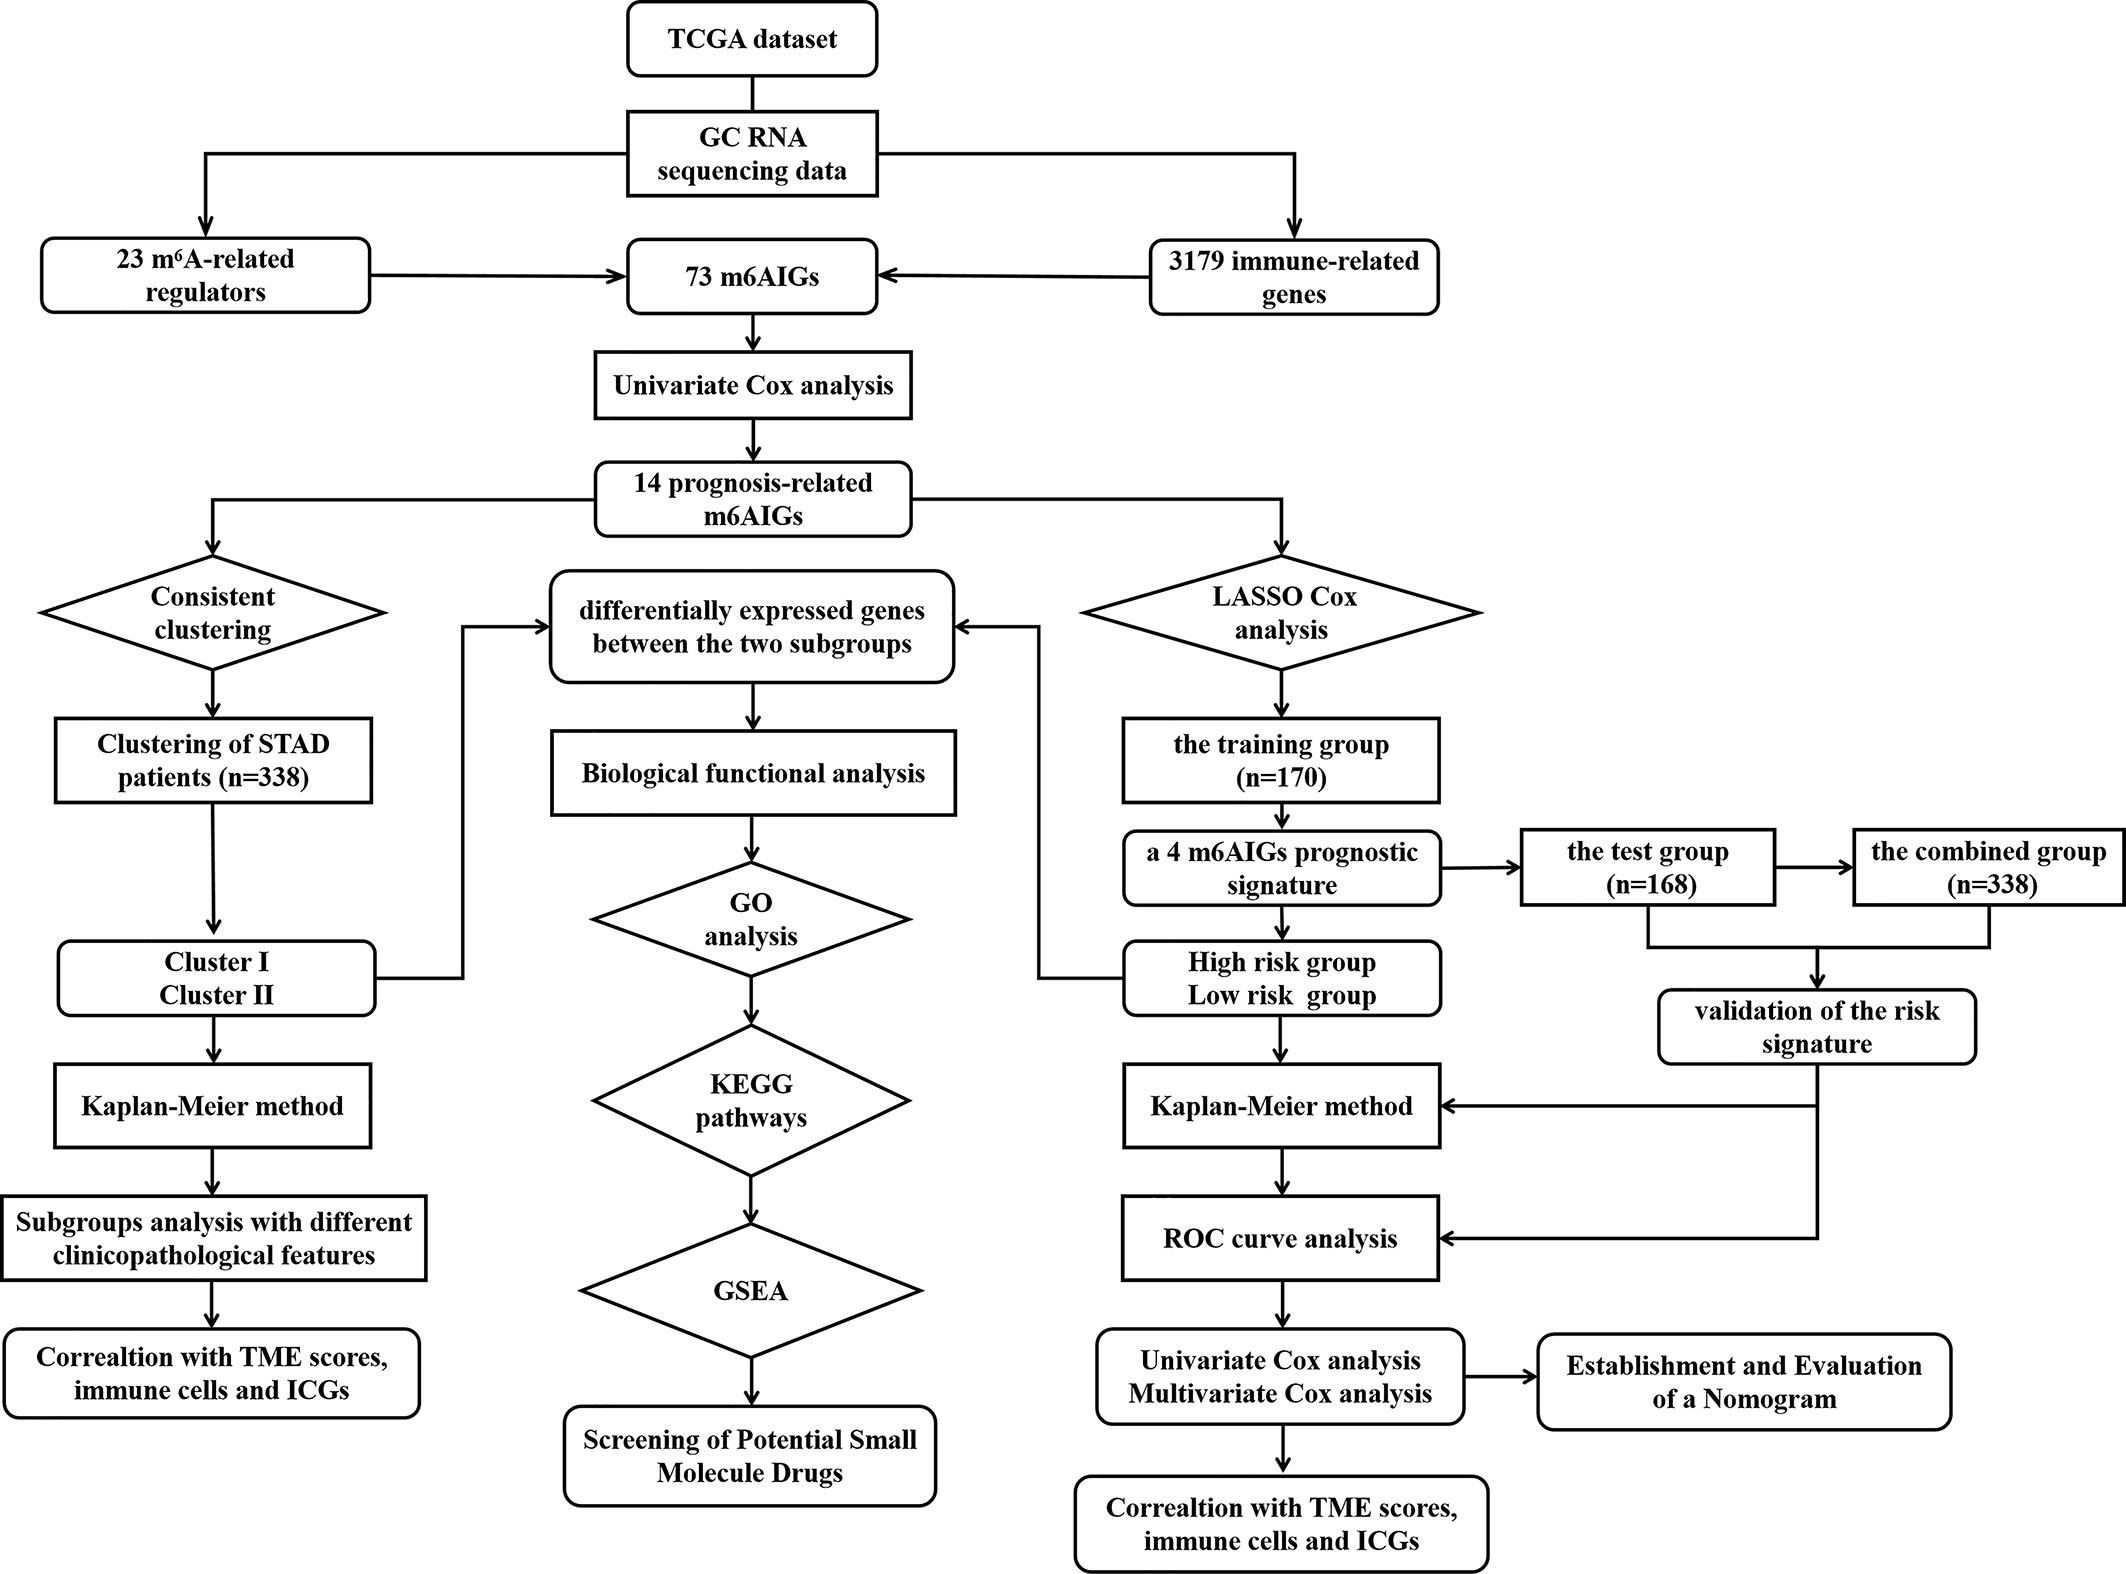
Figure 1 The flow chart of the study.
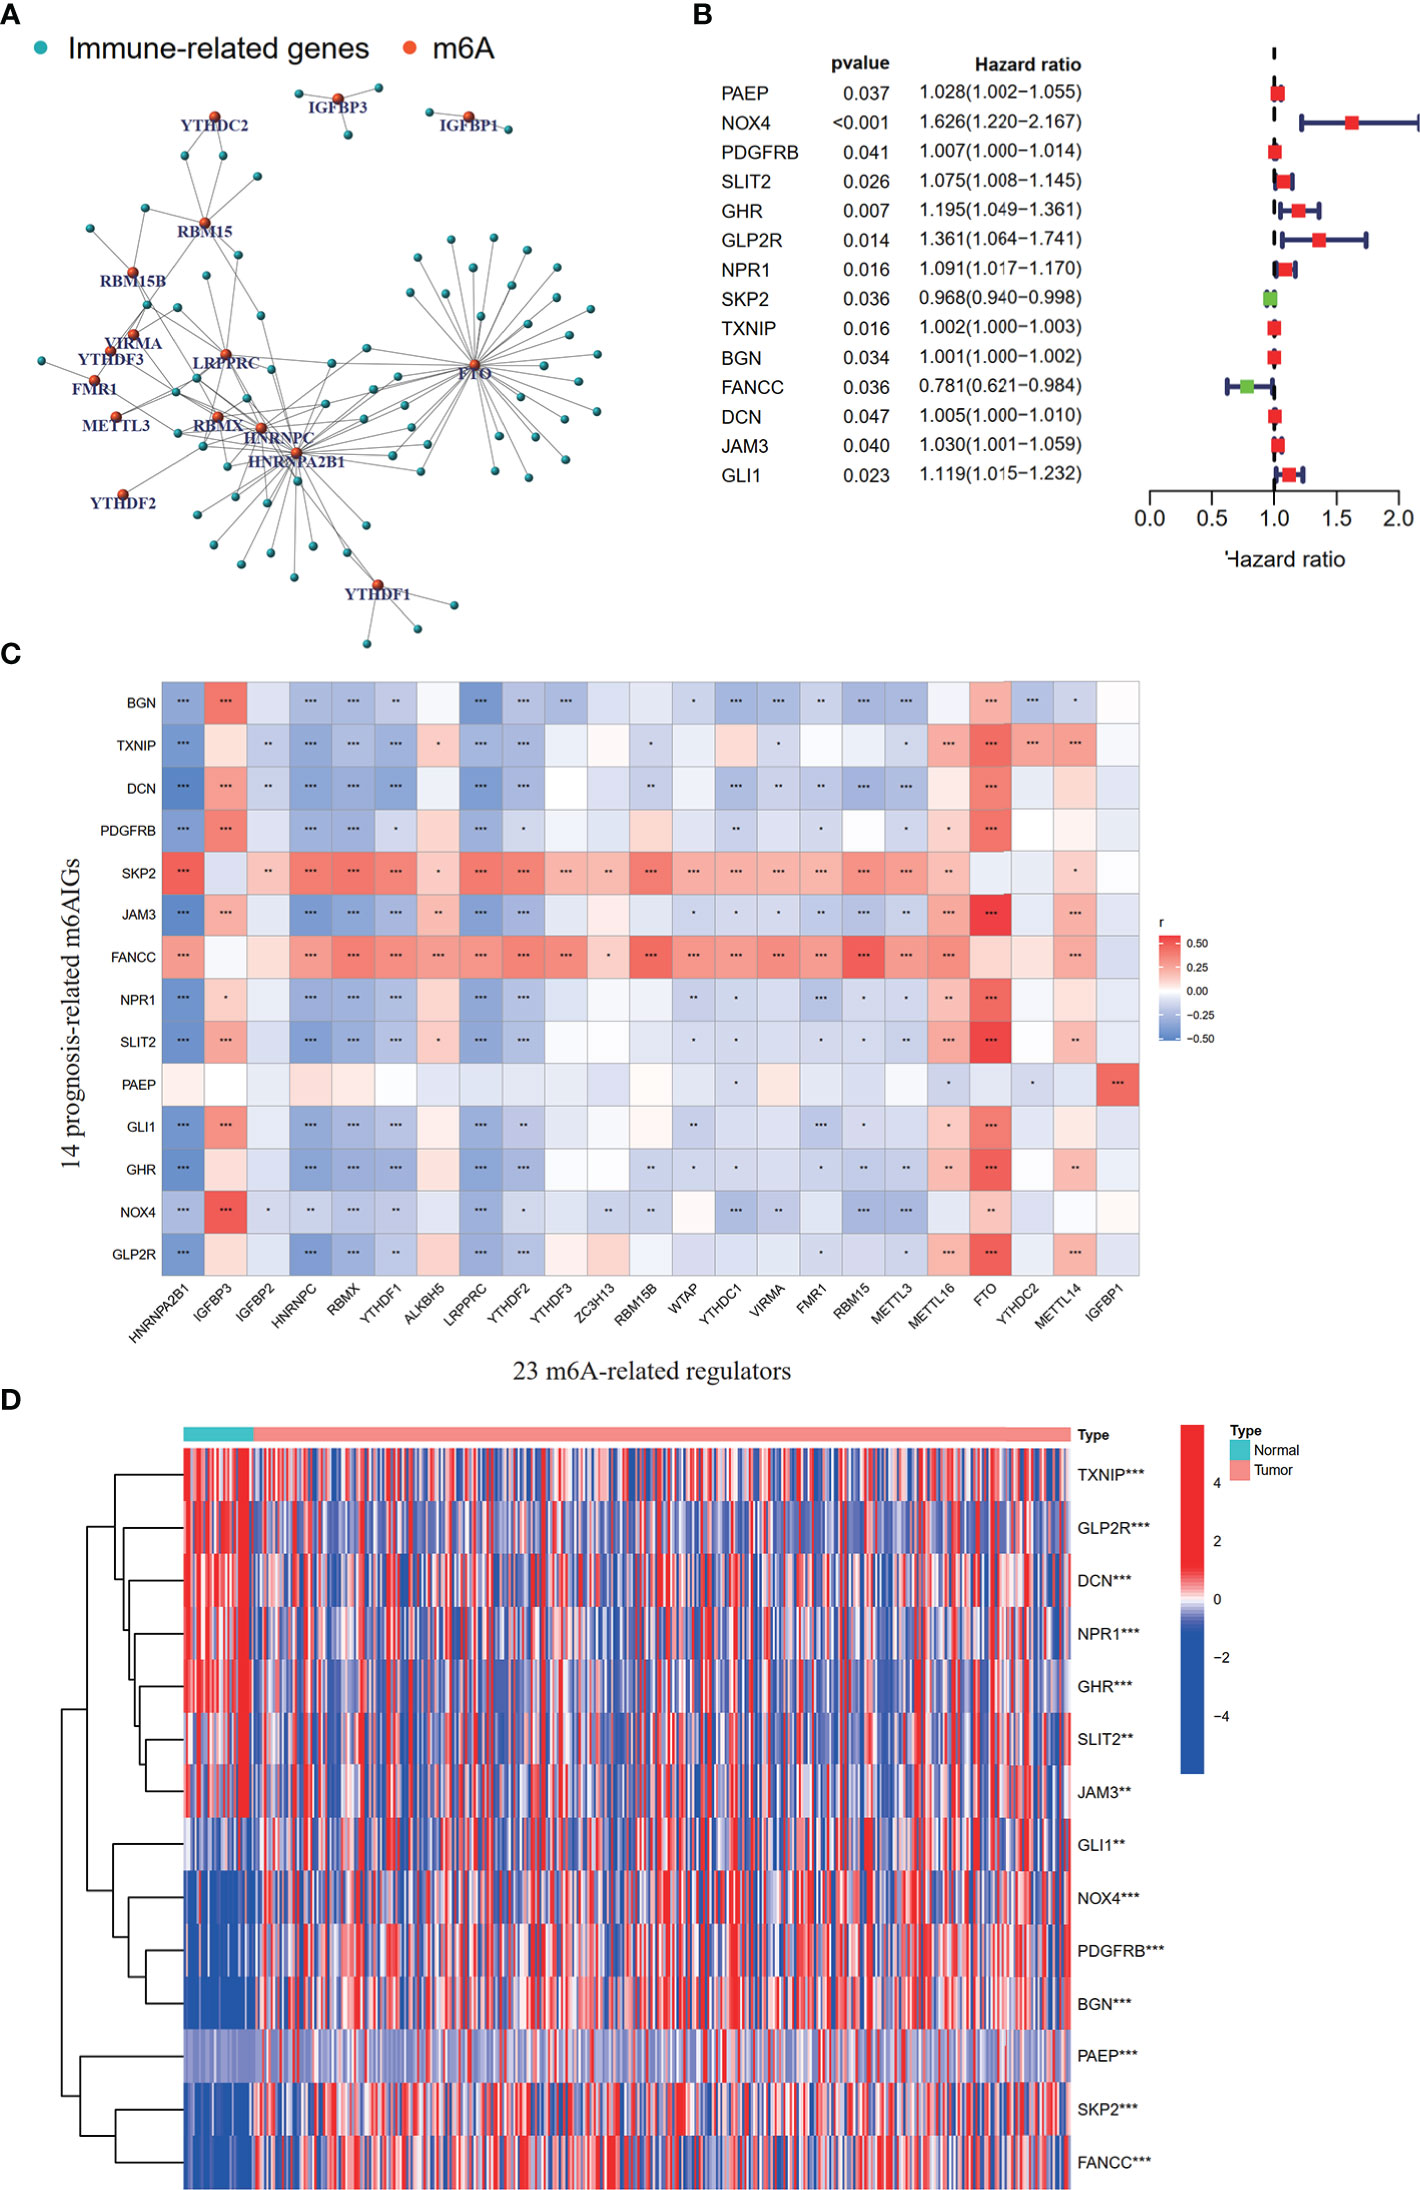
Figure 2 Processing of data and acquisition of prognosis-related m6AIGs. (A) The network of the 73 m6AIGs and 23 m6A-related regulators. (B) The hazard ratio 95% confidence interval of 14 prognostic m6AIGs were estimated by univariate Cox regression. (C) Pearson correlation analysis between 23 m6A-related regulators and 14 prognostic m6AIGs. (D) The heatmap with differential expression of 14 prognostic m6AIGs between the tumor group and the normal group.*p <0.05, **p <0.01, ***p <0.001.
Consensus clustering of prognosis-related m6AIGs identified two GC clusters with different clinicopathological characteristics and immune landscape
Consistent clustering analysis of GC patients was performed and we found that the optimal cluster number was two (Figures 3A-C). We found significant differences in OS between clusters I and II via KM analysis (Figure 3D). The relationship between clinicopathological characteristics and different clusters was shown in Figure 3E.
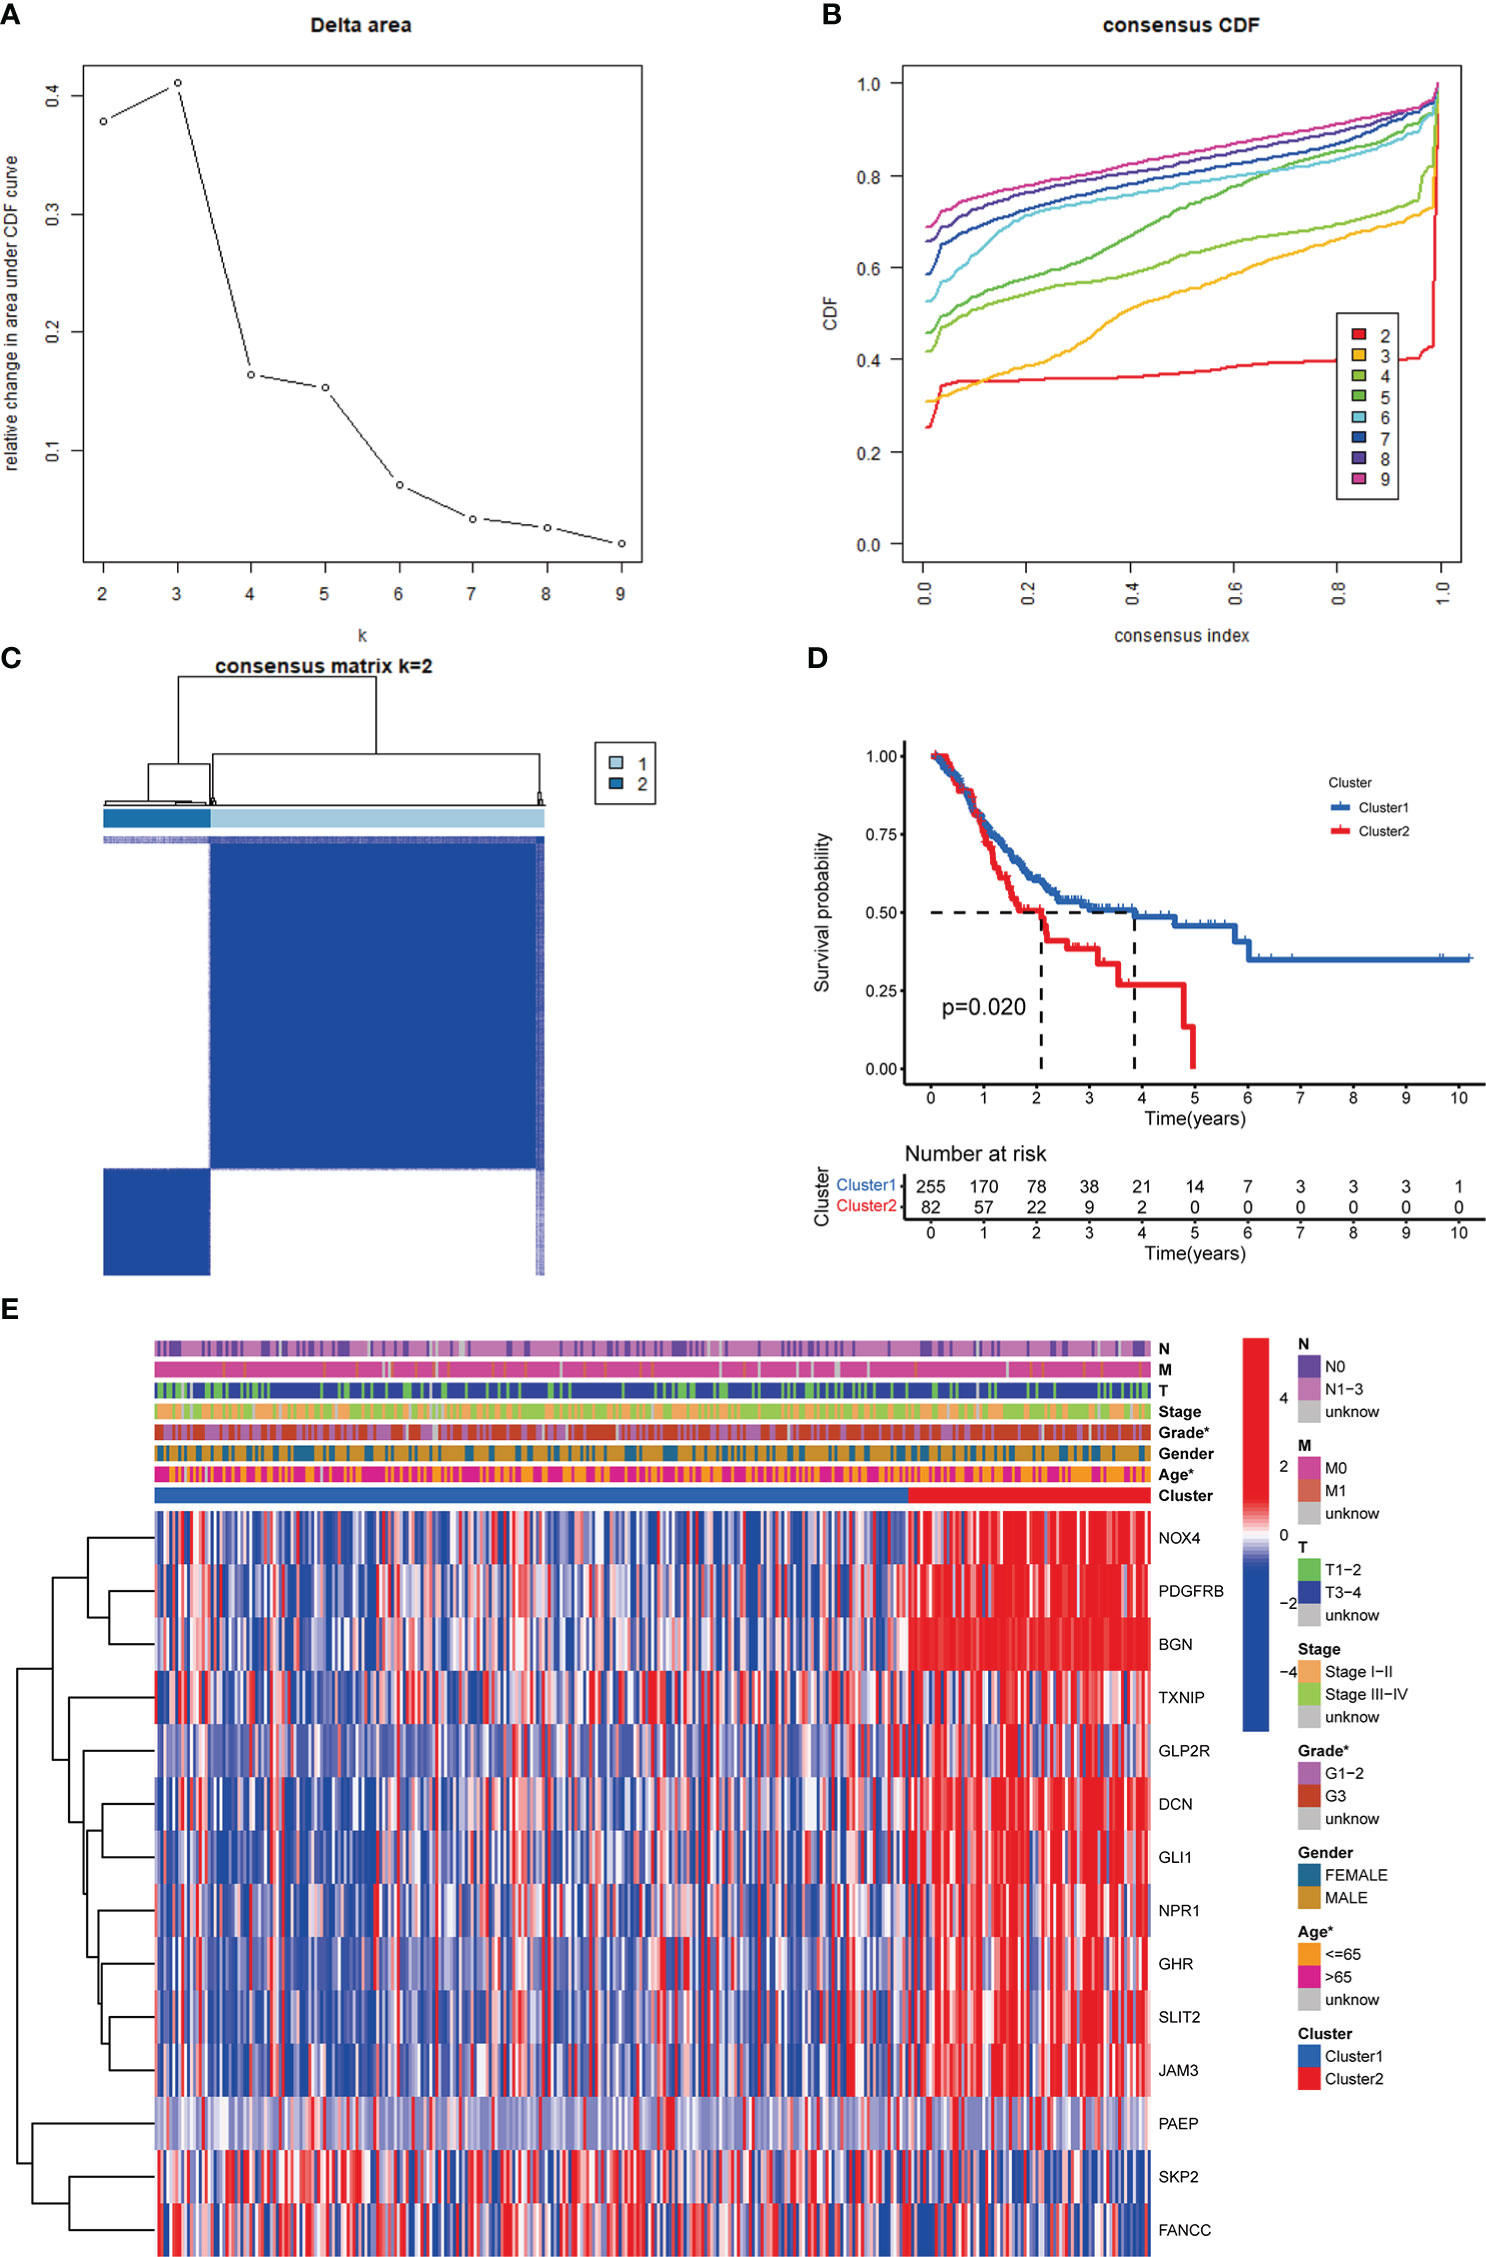
Figure 3 Identification of m6AIGs-based clusters of GC samples. (A) The consensus among clusters from 2 to 10 of (k). (B) Delta area curve of consensus clustering. (C) Consensus clustering of GC samples with k = 2. (D) KM analyses for GC patients in clusters I and II. (E) The distribution of clinicopathological characteristics and the expression of 14 prognostic m6AIGs in clusters I and II. *p < 0.05.
In terms of TME scores, the ESTIMATE, stromal, and immune scores in cluster II were significantly higher than those in cluster I (Figures 4A-C). Furthermore, in terms of the content of TIICs, cluster I contained more CD4 memory activated T cells (p = 0.003) and plasma cells (p = 0.004), and cluster II had more monocytes (p < 0.001) and M2 macrophages (p < 0.001) (Figures 4D, E).
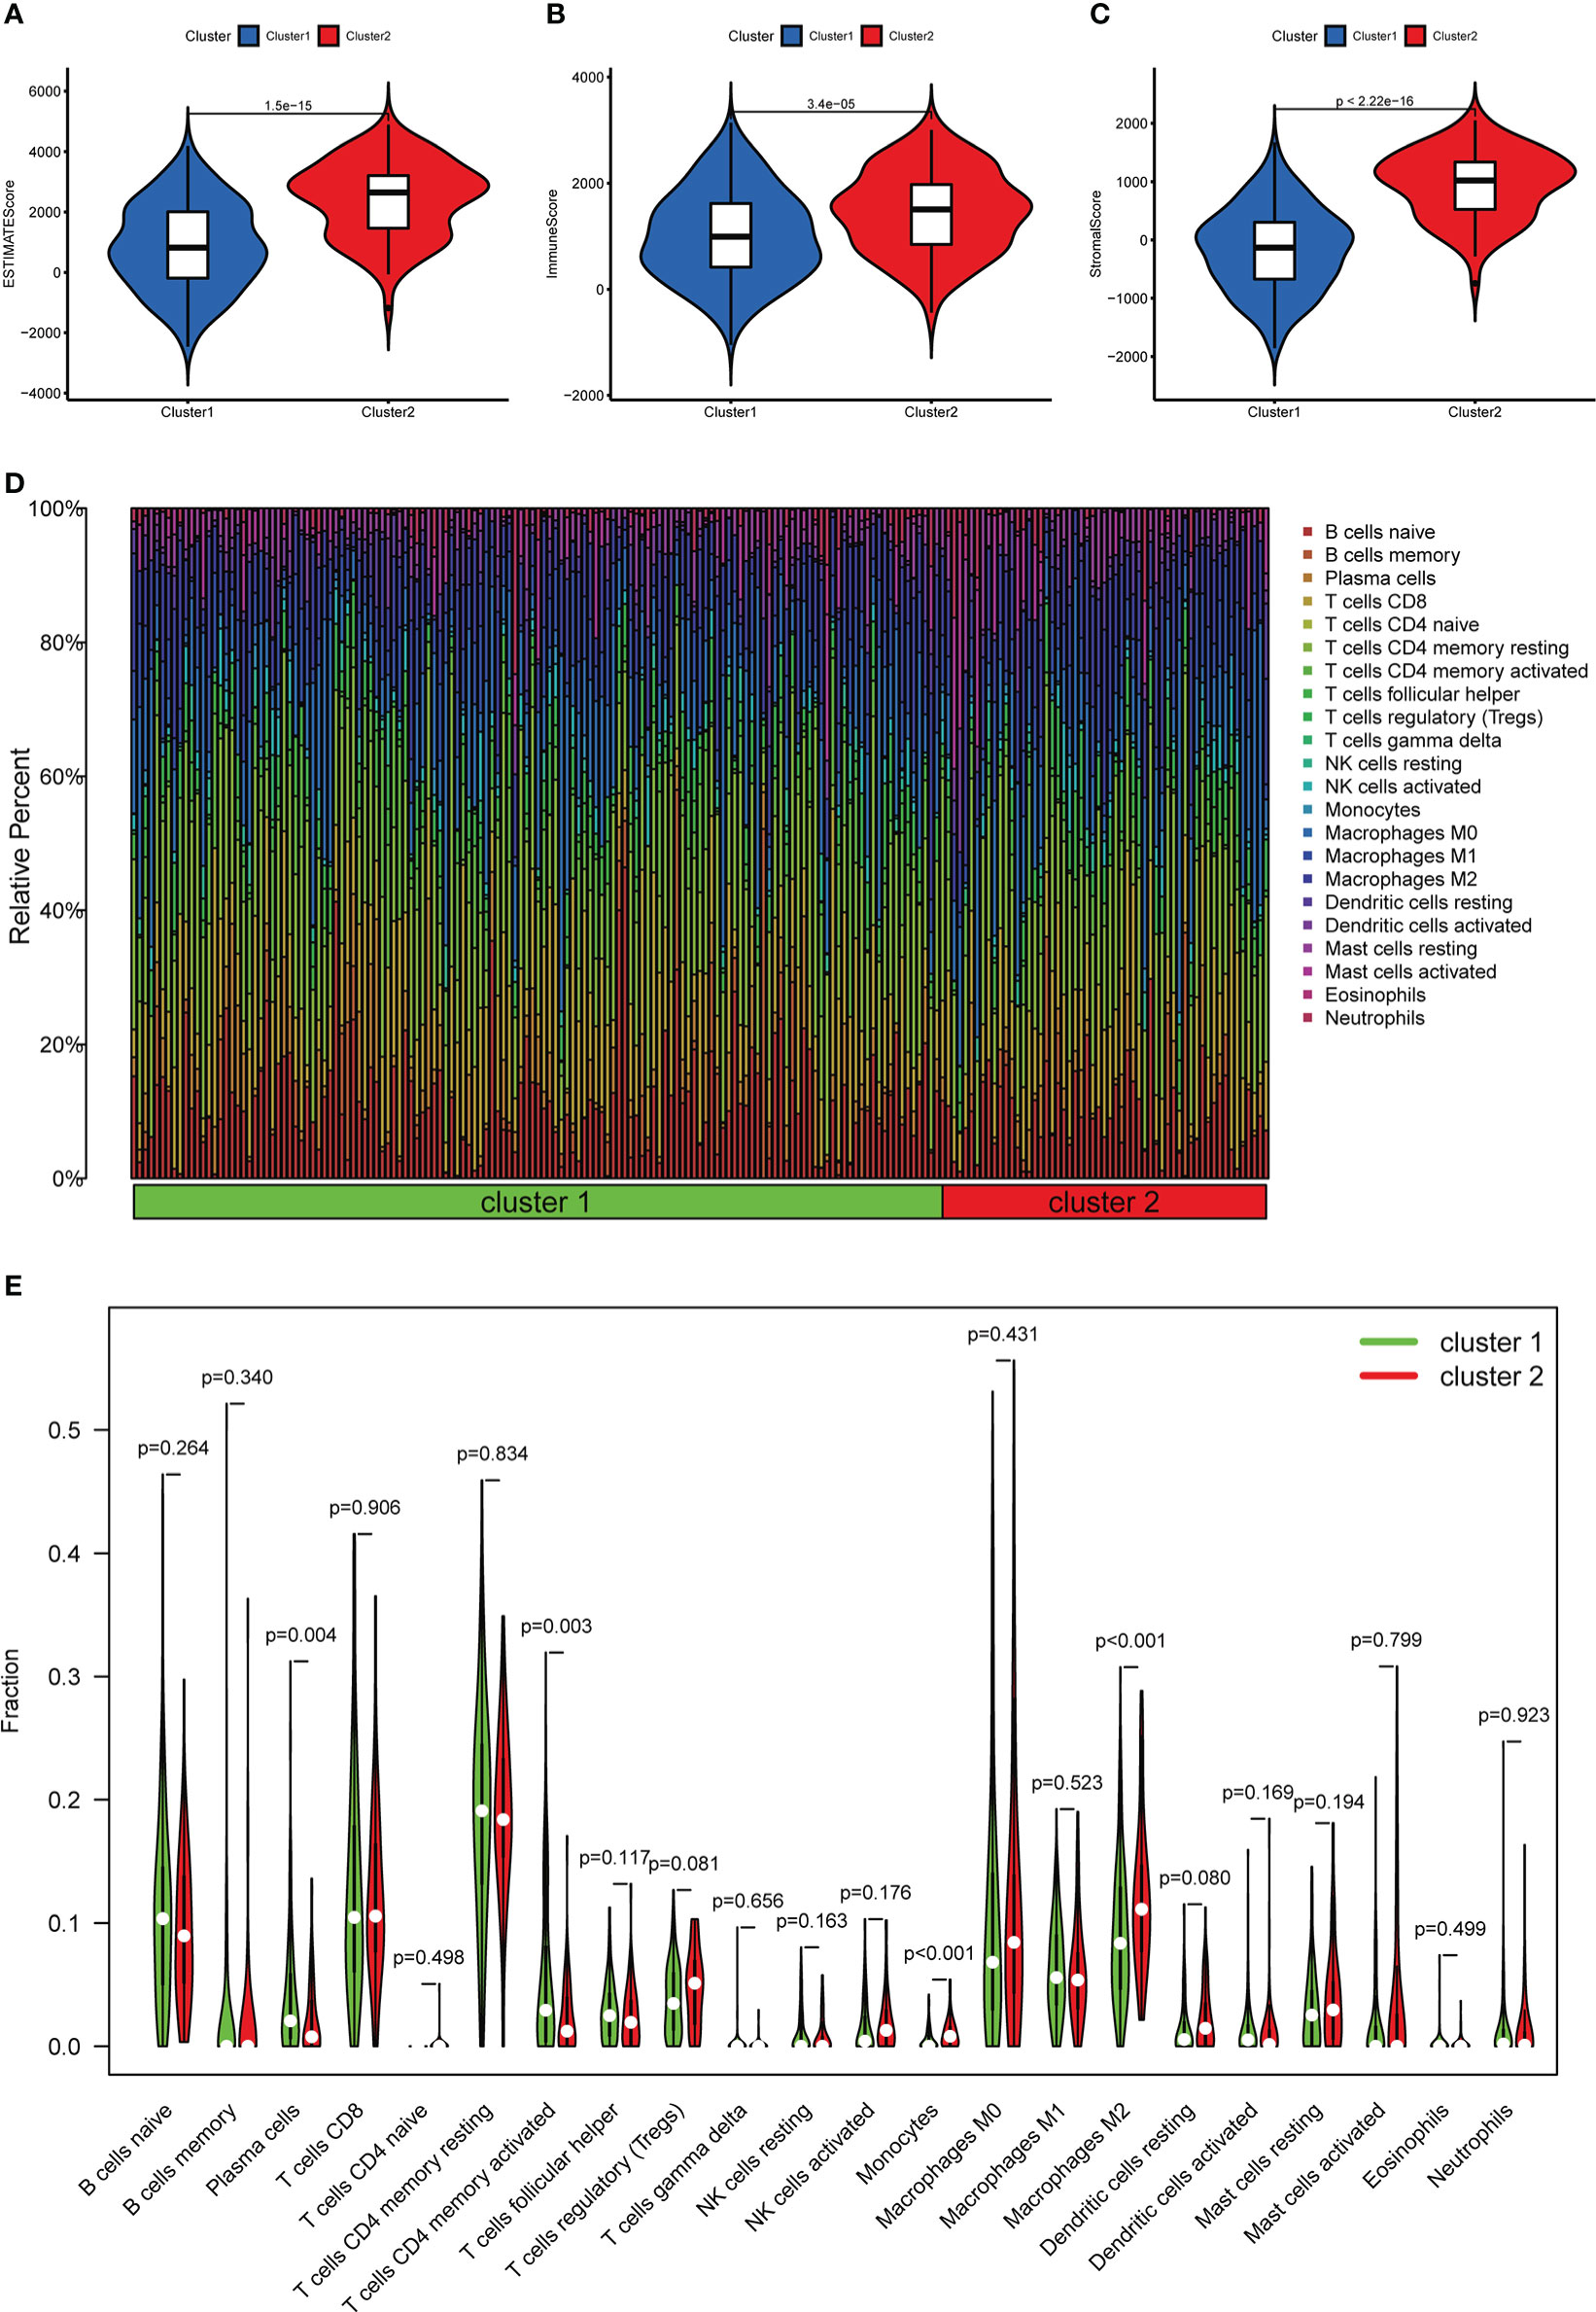
Figure 4 The relationship between different clusters and TME. (A–C) Comparison of ESTIMATE scores, Immune scores, and Stromal scores in clusters I and II. (D) The distribution of TIICs in clusters I and II. (E) Violin plot showing differences in TIICs between clusters I and II.
In addition, we also investigated the expression levels of 38 ICGs obtained from previous studies (27, 38–41) in different clusters. Firstly, compared with the adjacent tissues, 25 ICGs were differentially expressed in the gastric tumor tissues (p < 0.05) (Figure 5A). Then, we observed that 20 ICGs were differentially expressed between the two clusters (p < 0.05) (Figure 5B). To be more specific, TNFSF4, CD86, PDCD1LG2, TNFRSF4, HAVCR2, CD28, TNFSF18, TNFRSF9, PTPRC, PDCD1, IL12B, CD80, JAK1were significantly highly expressed in gastric tumor tissues and cluster II that associated with worse OS.
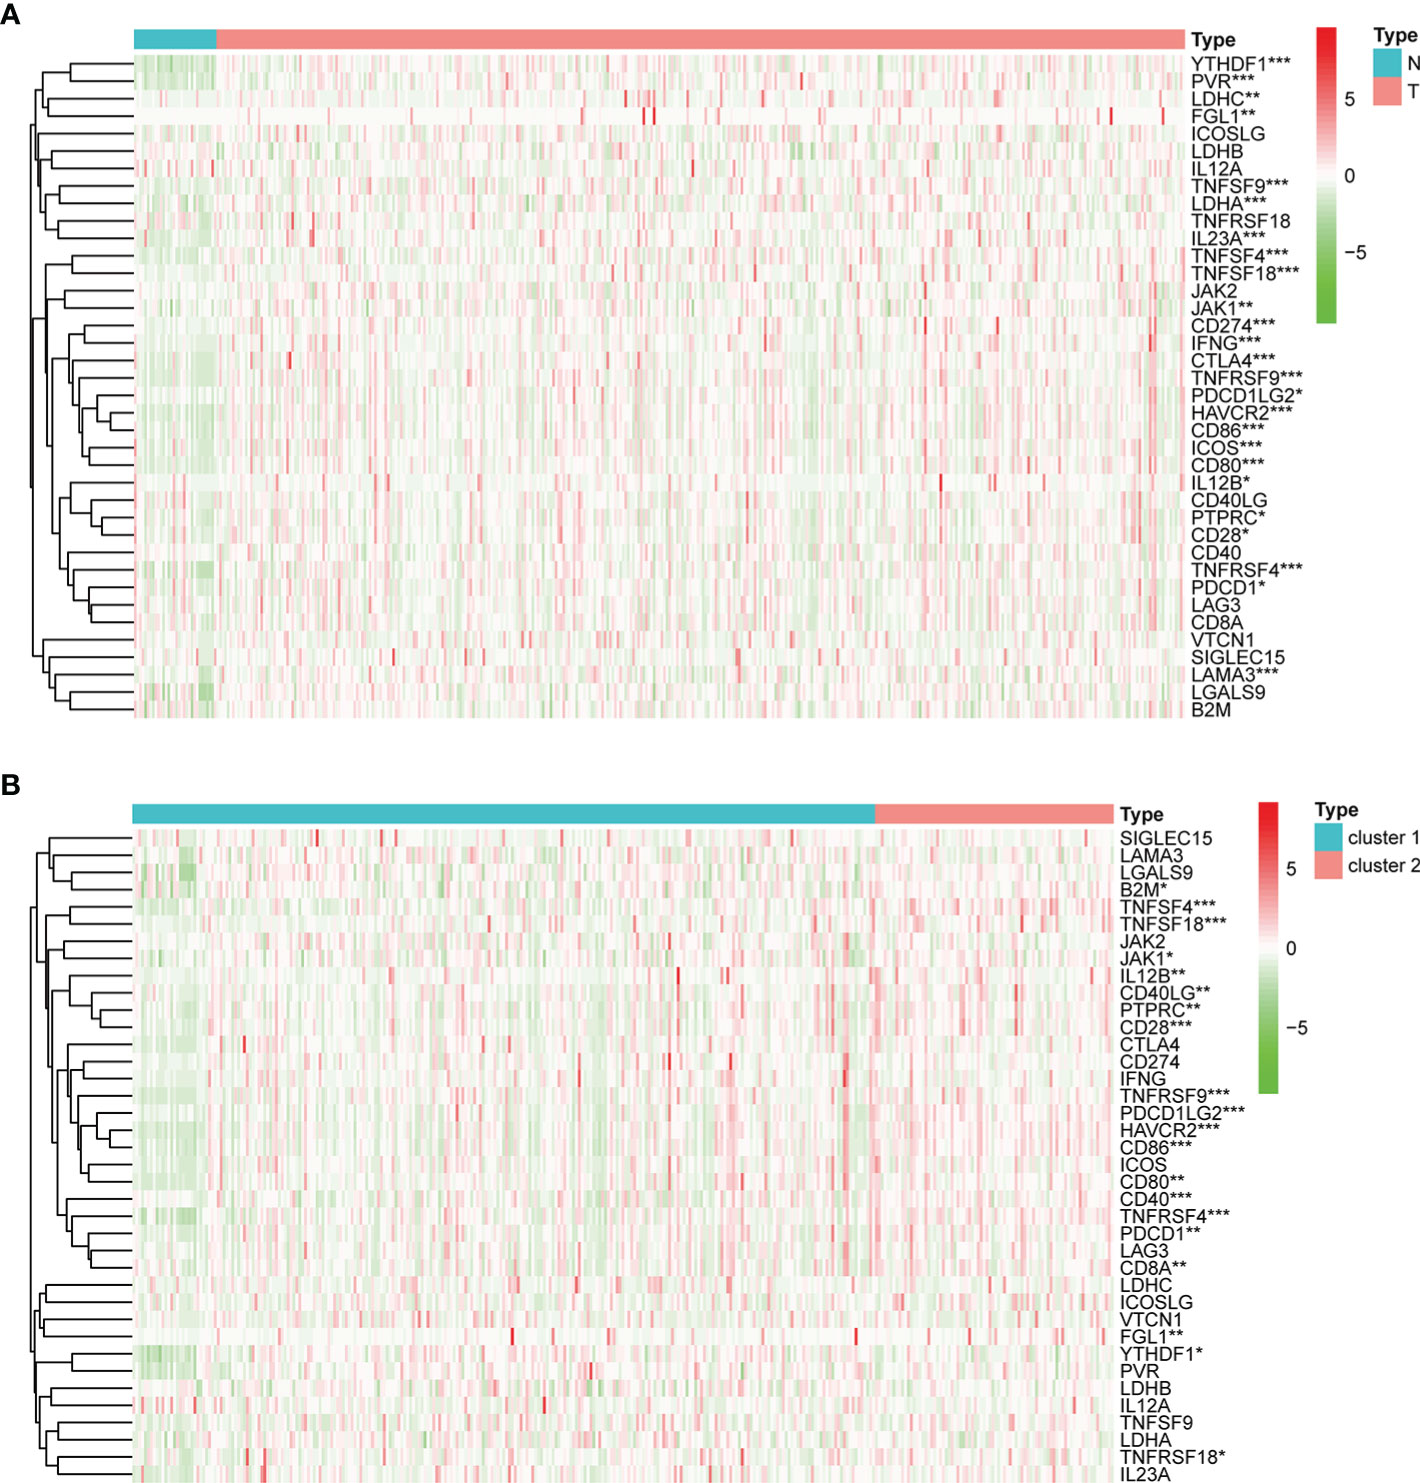
Figure 5 The expression of ICGs in the different subgroups. (A) Heatmap for the differential expression of ICGs between normal and tumor tissues. (B) Heatmap for the differential expression of ICGs between clusters I and II. *p < 0.05, **p < 0.01, and ***p < 0.001.
Construction and validation of m6AIGs-PS
After using the LASSO method in the training cohort (n = 169), 4 m6AIGs were chosen to establish m6AIGs-PS (Figures 6A-C). Using the median RS as a cutoff value, the training cohort was segmented into the low-risk and high-risk groups. KM survival analysis proved that the high-risk group had a significantly shorter survival time than the low-risk group (p < 0.01) (Figure 6D). The value of the area under the curve in the time-dependent ROC curve was 0.730 (Figure 6E), suggesting the powerful prediction performance of m6AIGs-PS in the training cohort. Furthermore, the distribution plot of RS and survival status demonstrated that the higher RS, the more deaths of patients (Figure 6F). To further validate the m6AIGs-PS, verification analysis in the test group (n = 168) and the combined group (n = 337) was performed. Consequently, the m6AIGs-PS also had well-prediction performances in these two cohorts. The expression pattern of selected m6AIGs of the different cohorts in different risk subgroups was shown in Figure 6G. Additionally, PCA analysis demonstrated a reliable clustering ability of RS (Figures 7A, B). Moreover, univariate Cox regression and multivariable Cox regression analyses demonstrated RS was significantly correlated with OS in addition to age and stage (p < 0.05) (Figures 7C, D).
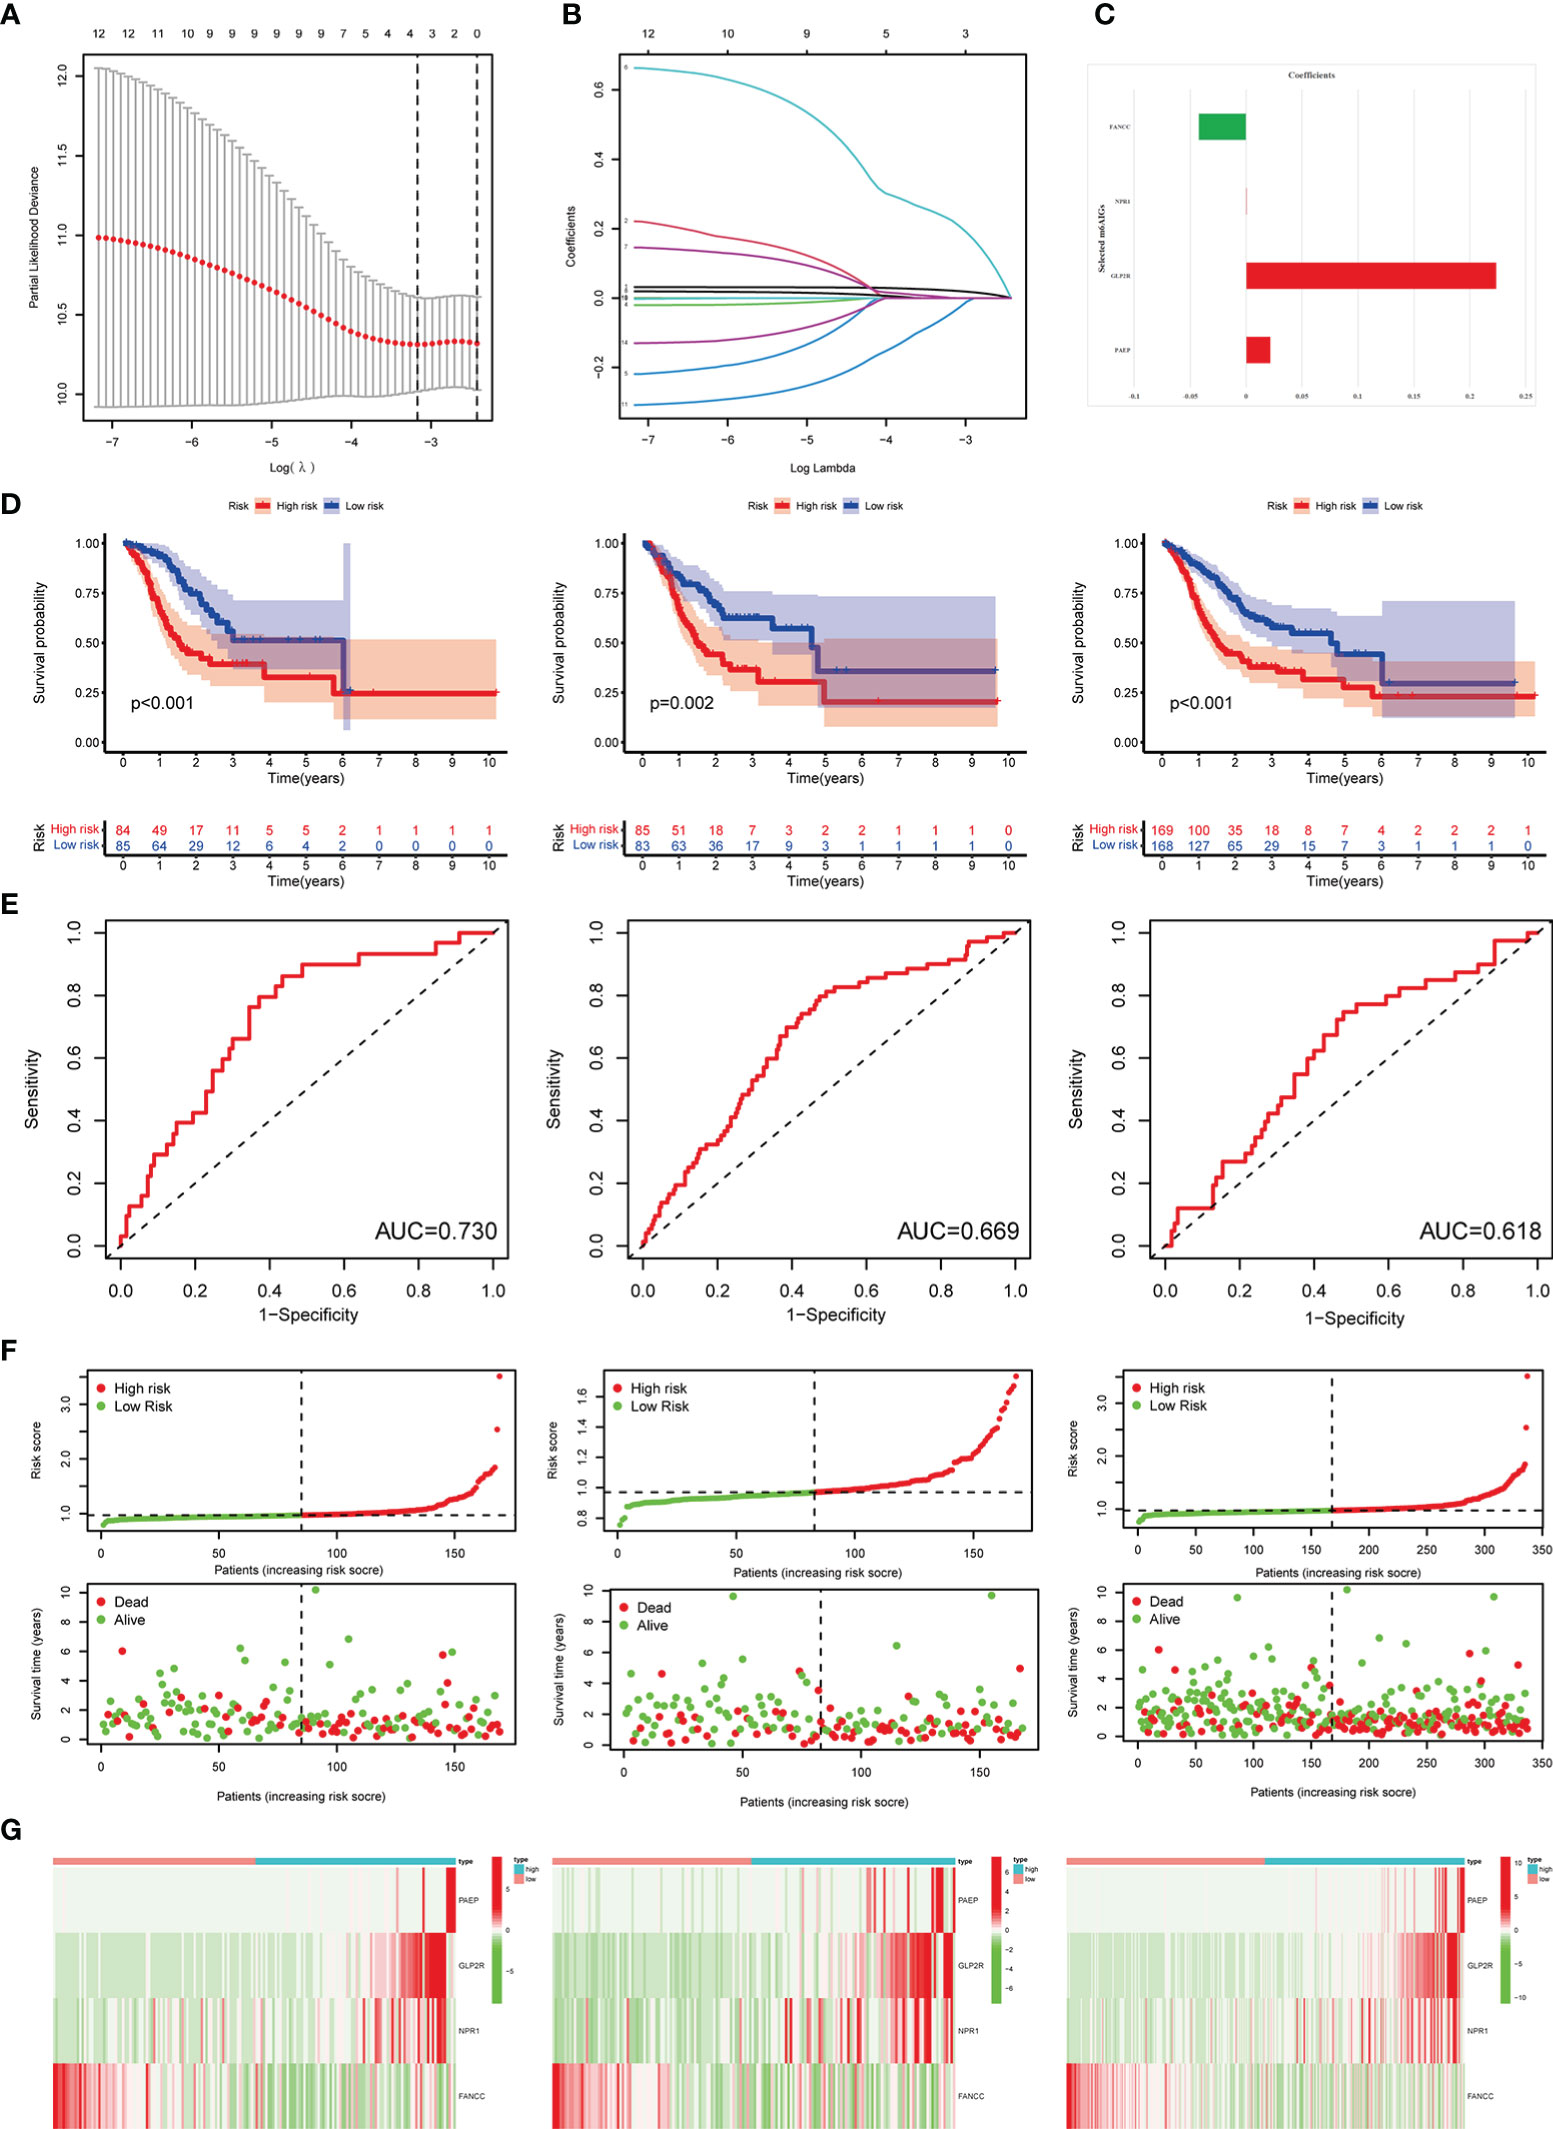
Figure 6 Construction and validation of the m6AIGs-PS. (A) The number that corresponded to the point with the smallest cross-verification error was the gene numbers included in the LASSO regression risk model. (B) The lines of different colors represent the trajectory of the correlation coefficient of different factors in the model with the increase of Log Lamda. (C) LASSO coefficients of 4 selected prognostic m6AIGs. (D) KM analysis of patients in the low- and high-risk groups in the training cohort, the test cohort, and the combined cohort. (E) ROC analysis for OS prediction in the training cohort, the test cohort, and the combined cohort. (F) The distribution plots of RS and survival status in the training group, the test group, and the combined group. (G) Heatmap of four-gene profiles in the low- and high-risk groups in the training cohort, the test cohort, and the combined cohort.
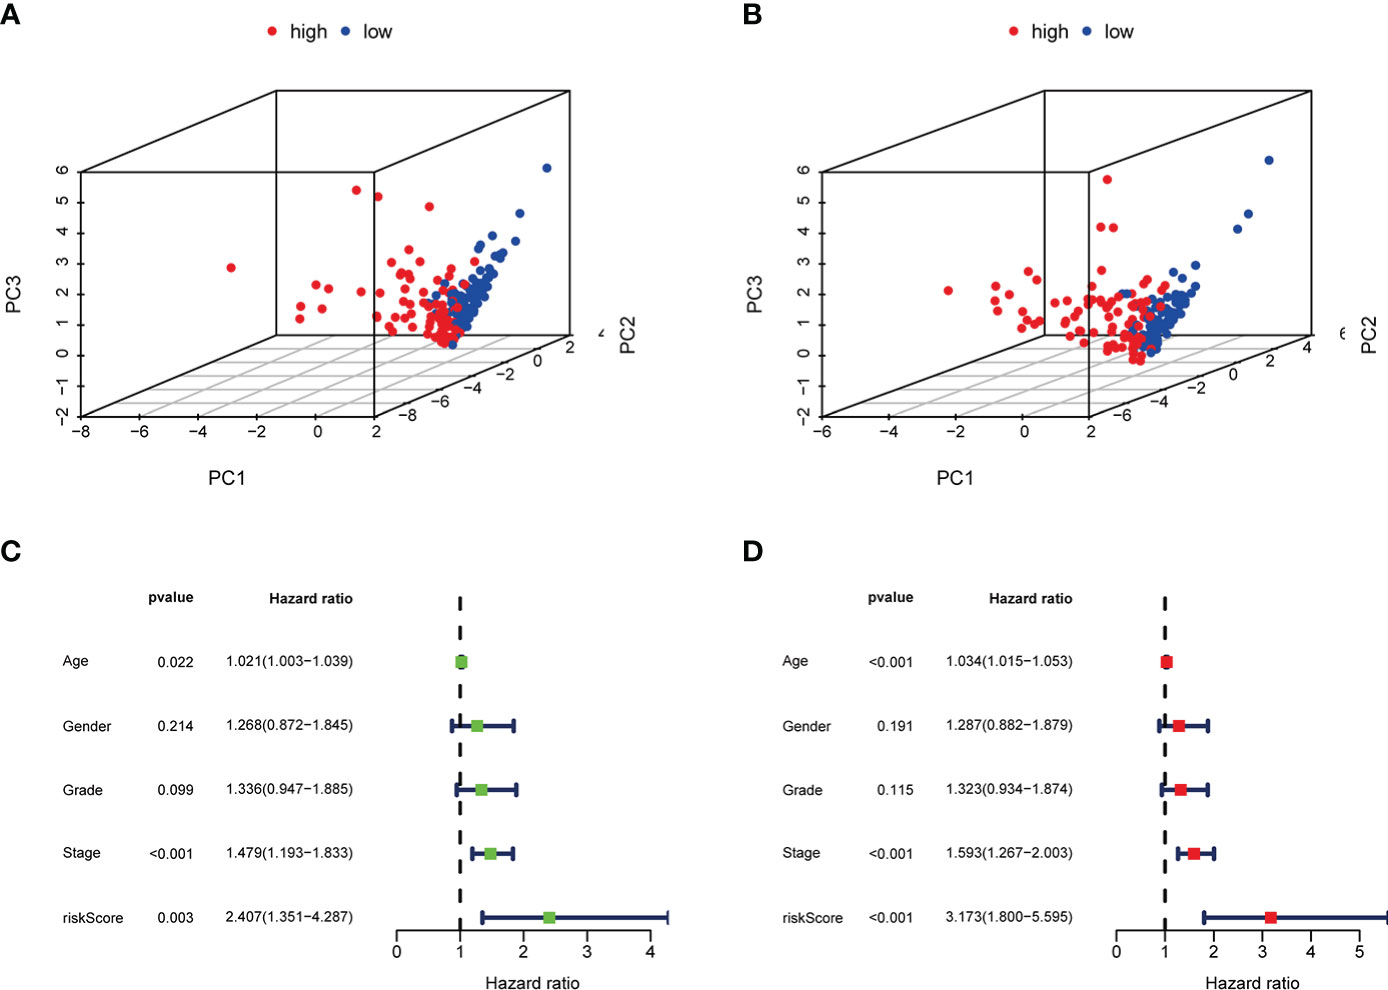
Figure 7 PCA analysis, univariate and multivariate Cox regression analyses of m6AIGs-PS. (A, B) PCA analysis in the training group and the test group. (C) Univariate Cox regression analyses in the combined group. (D) Multivariate Cox regression analyses in the combined group.
Establishment and evaluation of a nomogram based on independent prognostic factors
The nomogram comprising clinical risk features and RS was fabricated (Figure 8A), which showed robust accuracy in predicting 1-, 3-, and 5-year OS (AUC = 0.712, 0.711, and 0.710, respectively) (Figure 8B). Moreover, the calibration curves demonstrated a good match between the actual and nomogram-predicted probability (Figure 8C). These data indicated that it had the latent force to be used as a quantitative instrument to predict the OS for patients with GC, which had particular importance in clinical practice.
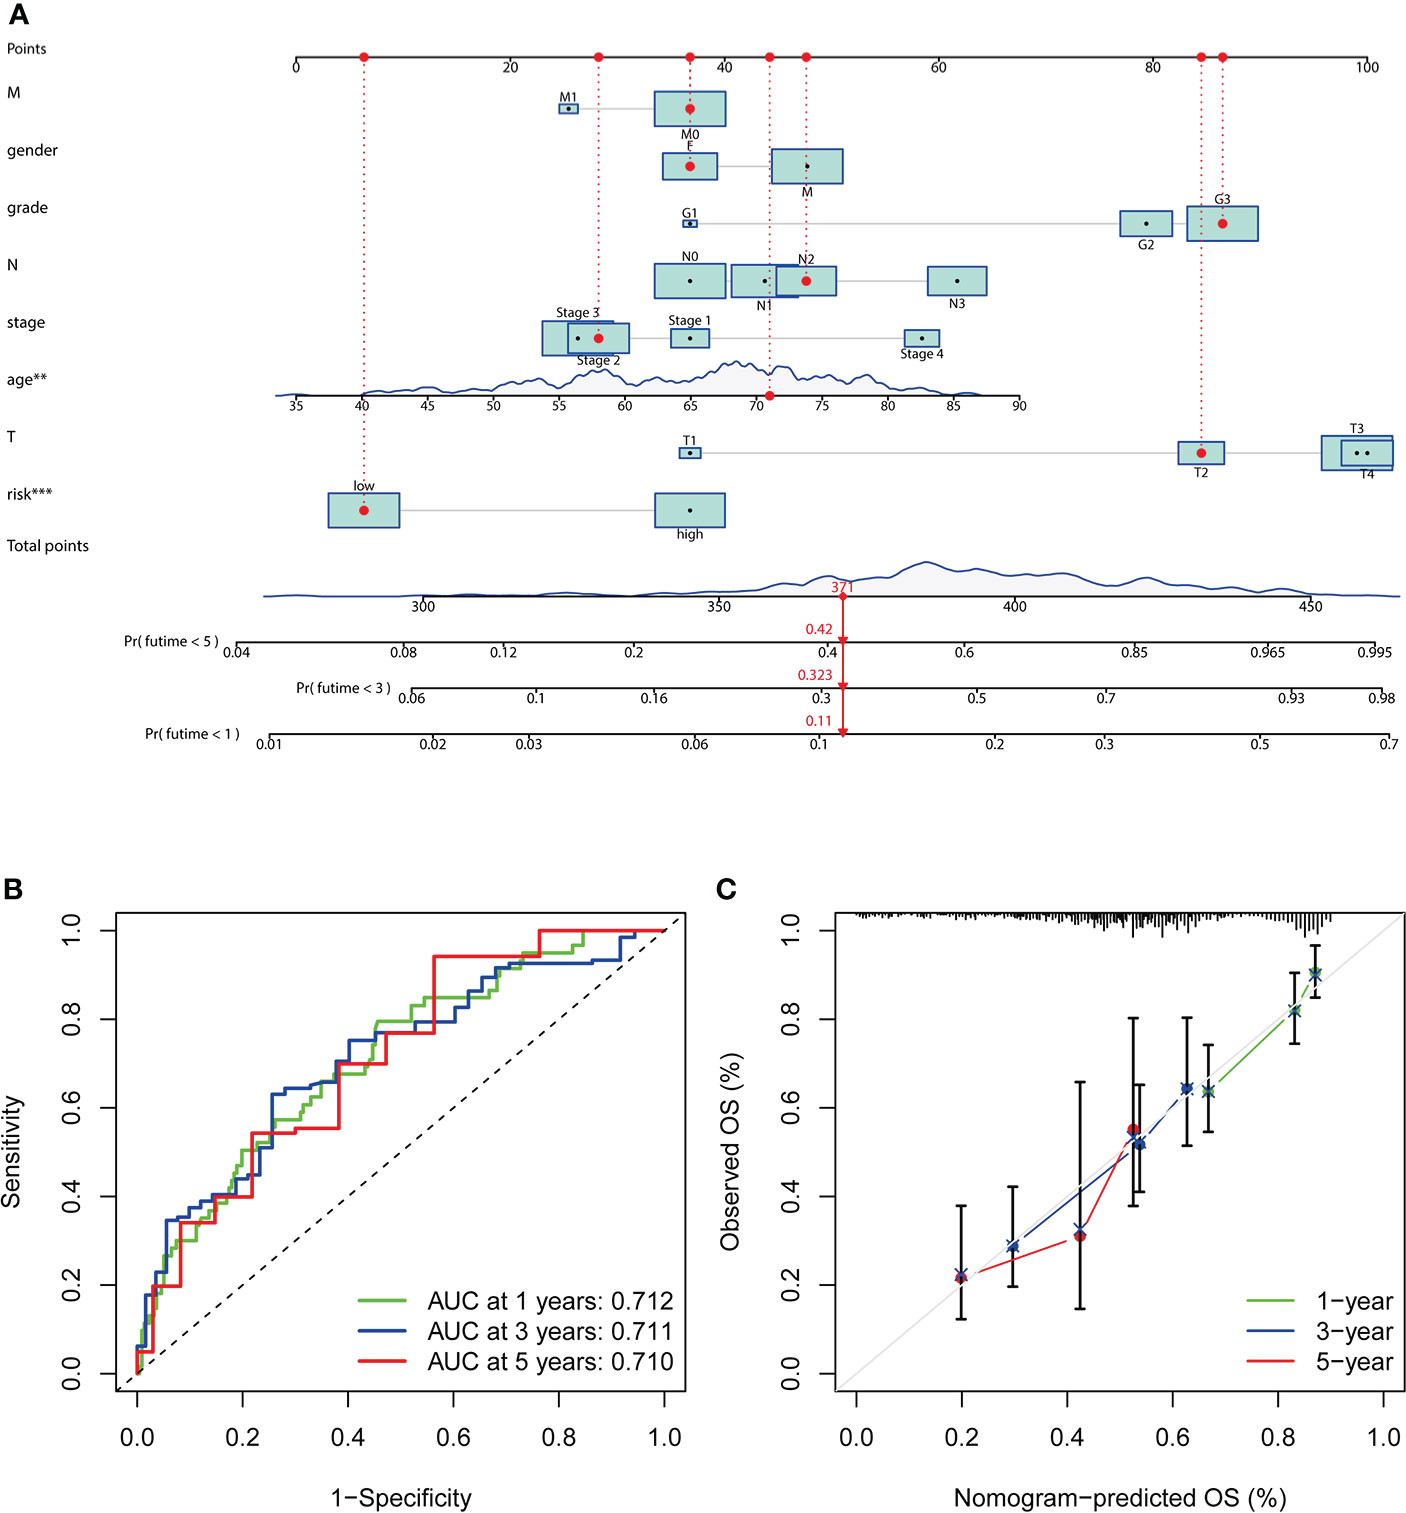
Figure 8 Establishment and evaluation of a nomogram. (A) Nomogram based on RS, age at diagnosis, gender, grade, clinical stage, and stage TMN. (B) The ROC analyses of the nomogram in predicting 1-, 3-, and 5-year OS. (C) The calibration curves show the concordance between the actual and nomogram-predicted probability of 1-, 3-, and 5-year OS.
Subgroup analysis with different clinicopathological features
The distribution of clinicopathological features, the immune scores of TME, and the expression of 4 selected m6AIGs of patients in different risk subgroups were shown as a heatmap (Figure 9A). Significant differences were observed between the two subgroups according to cluster (p < 0.001) and the immune scores of TME (p < 0.001). Significant differences in RS were observed between: 1) different clusters (p < 0.001); 2) age (p < 0.01); 3) clinical stage (p < 0.05); 4) stage M (p < 0.01); 5) stage N (p < 0.05) (Figure 9B).
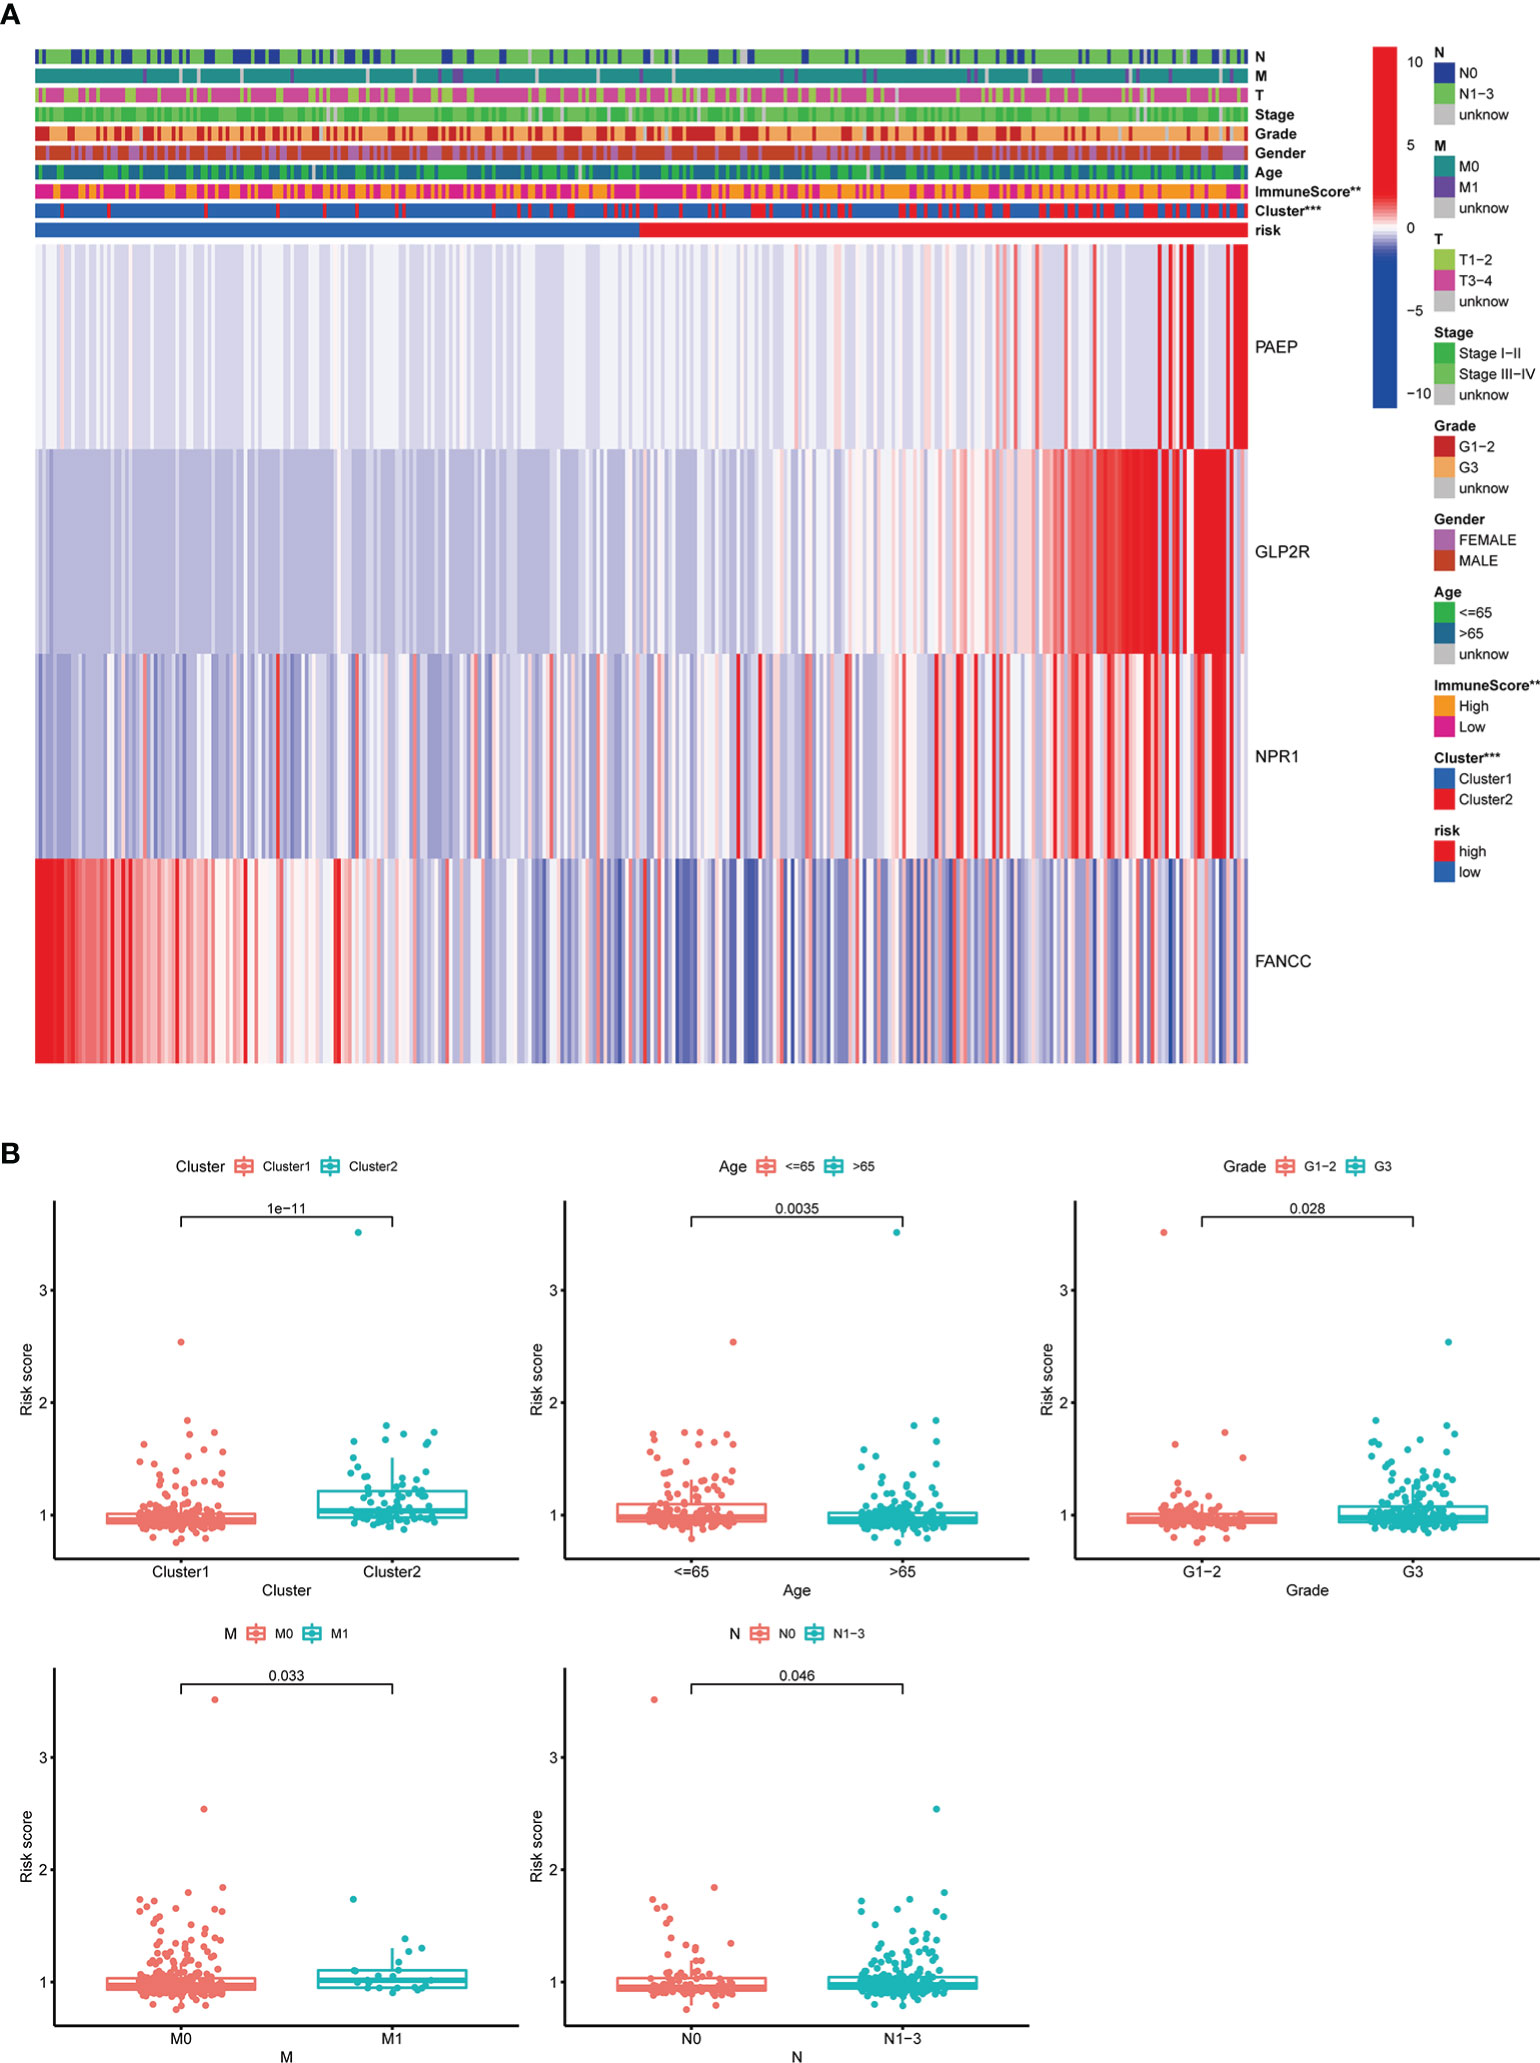
Figure 9 The relationship between RS and clinicopathological characteristics, and TME. (A) The heatmap showed the expression of 4 prognostic m6AIGs, the distribution of clinicopathological characteristics, and the immune scores of TME in different risk subgroups. **p <0.01, ***p <0.001. (B) Significant differences in RS were observed between different clusters, age, stage M, stage N, and different tumor grades.
To evaluate whether m6AIGs-PS could be a prognostic instrument for patients with diverse clinical characteristics, we stratified subgroups by age, gender, grade, clinical stage, stage T, stage M, and stage N. Consequently, the OS of the low-risk patients according to age(p< 0.001 in age ≤ 65 and age > 65), sex (p < 0.001 in female and male), grade (p < 0.001 in G3), stage I-II (p < 0.05), stage III-IV (p < 0.001), stage T3-4 (p < 0.001), stage M0 (p < 0.001) and stage N1-3 (p < 0.001) was significantly higher than those of the high-risk patients (Figure 10).
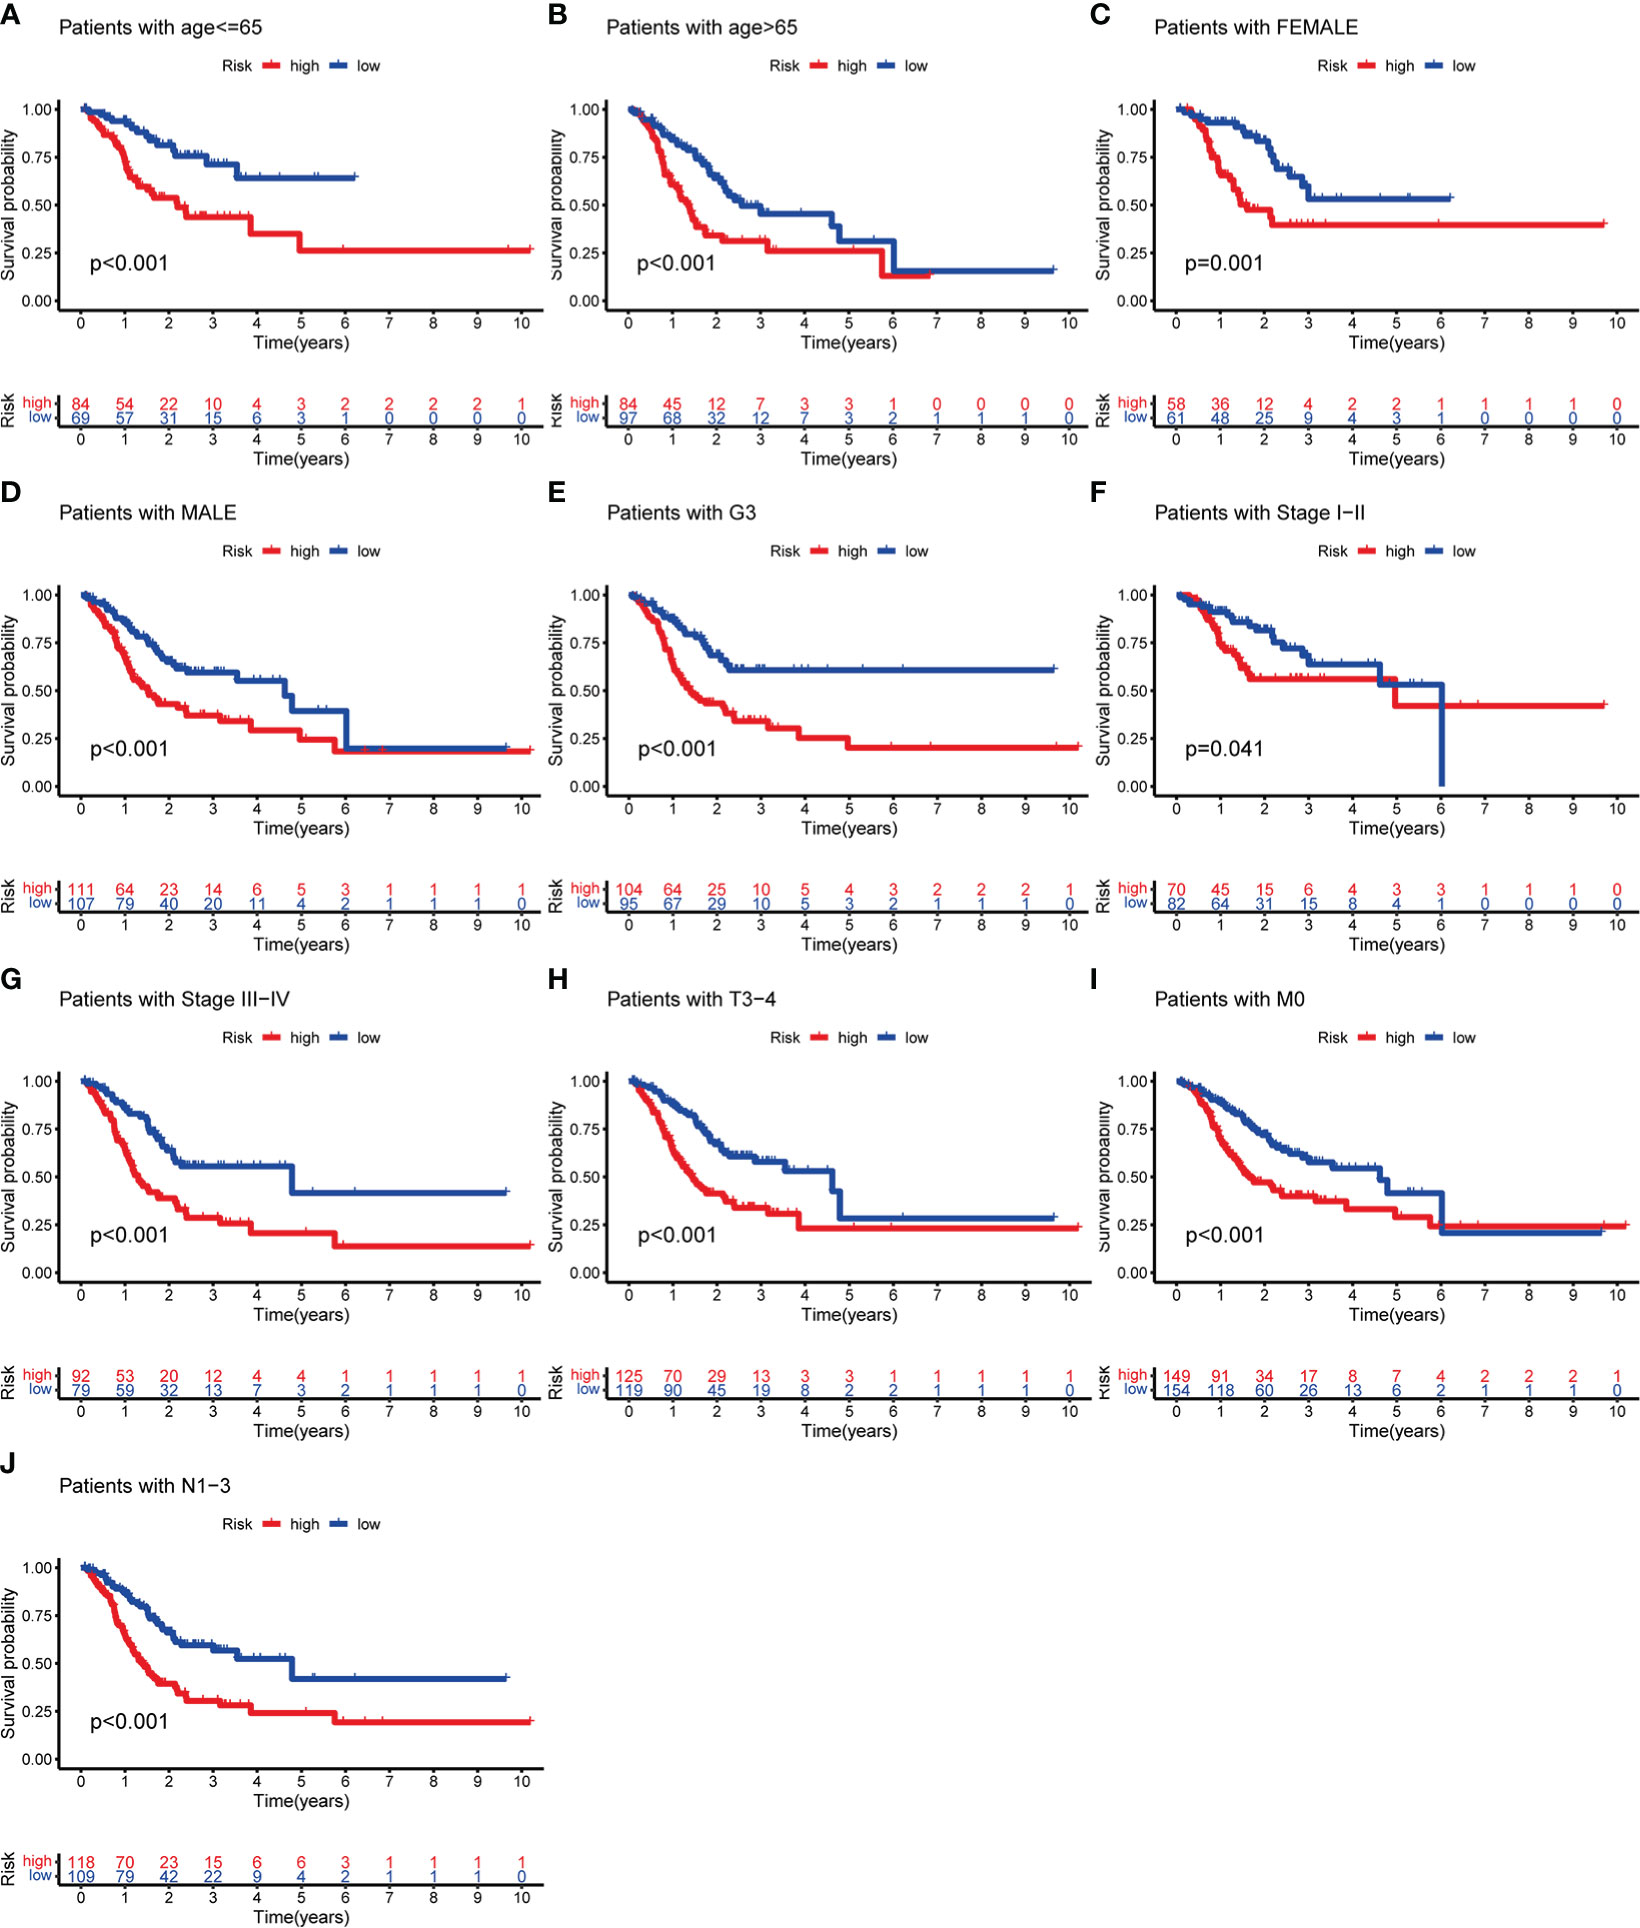
Figure 10 KM analysis with different clinicopathological features in different risk subgroups. (A) Age ≤ 65. (B) Age > 65. (C) Female. (D) Male. (E) G3. (F) Stage I-II. (G) Stage III-IV. (H) Stage T3-4. (I) Stage M0. (J) Stage N1-3.
Subgroup analysis with different immune landscape
Based on the previously mentioned currently accepted methods, the relationship between different subgroups and the immune landscape, including TME scores, TIICs and ICGs, was explored. In terms of TME scores, the ESTIMATE, stromal, and immune scores of the high-risk groups were significantly higher than those in the low-risk groups (Figures 11A-C). Moreover, we further found that the higher the stromal scores, the lower OS of patients (p < 0.05) (Figure 11D). As for TIICs, the correlation between the content of TIICs and subgroups was shown in Figure 11E, F. To be more specific, the RS had significant positive correlations with infiltrating levels of memory B cells (r = 0.15, p = 0.032), memory resting CD4 T cells (r = 0.19, p = 0.0089), regulatory T cells (r = 0.22, p = 0.0017), resting mast cells (r = 0.28, p = 7.6E-05), monocytes (r = 0.31, p = 1.1E-05) (Figure 12A), and had significant negative correlations with infiltrating levels of resting NK cells (r = -0.17, p = 0.014), M0 Macrophages (r = -0.21, p = 0.0026), M1 Macrophages (r = -0.21, p = 0.0027), memory activated CD4 T cells (r = -0.22, p = 0.0022), follicular helper T cells (r = -0.28, p = 5.6E-05) (Figure 12B). Concerning ICGs, in the high-risk group, seven ICGs (namely, TNFSF4, TNFSF18, CD40LG, PTPRC, CD28, CD86, CD40) were significantly highly expressed, while in the low-risk group, one ICGs (namely, FGL1) was significantly highly expressed (Figure 12C).
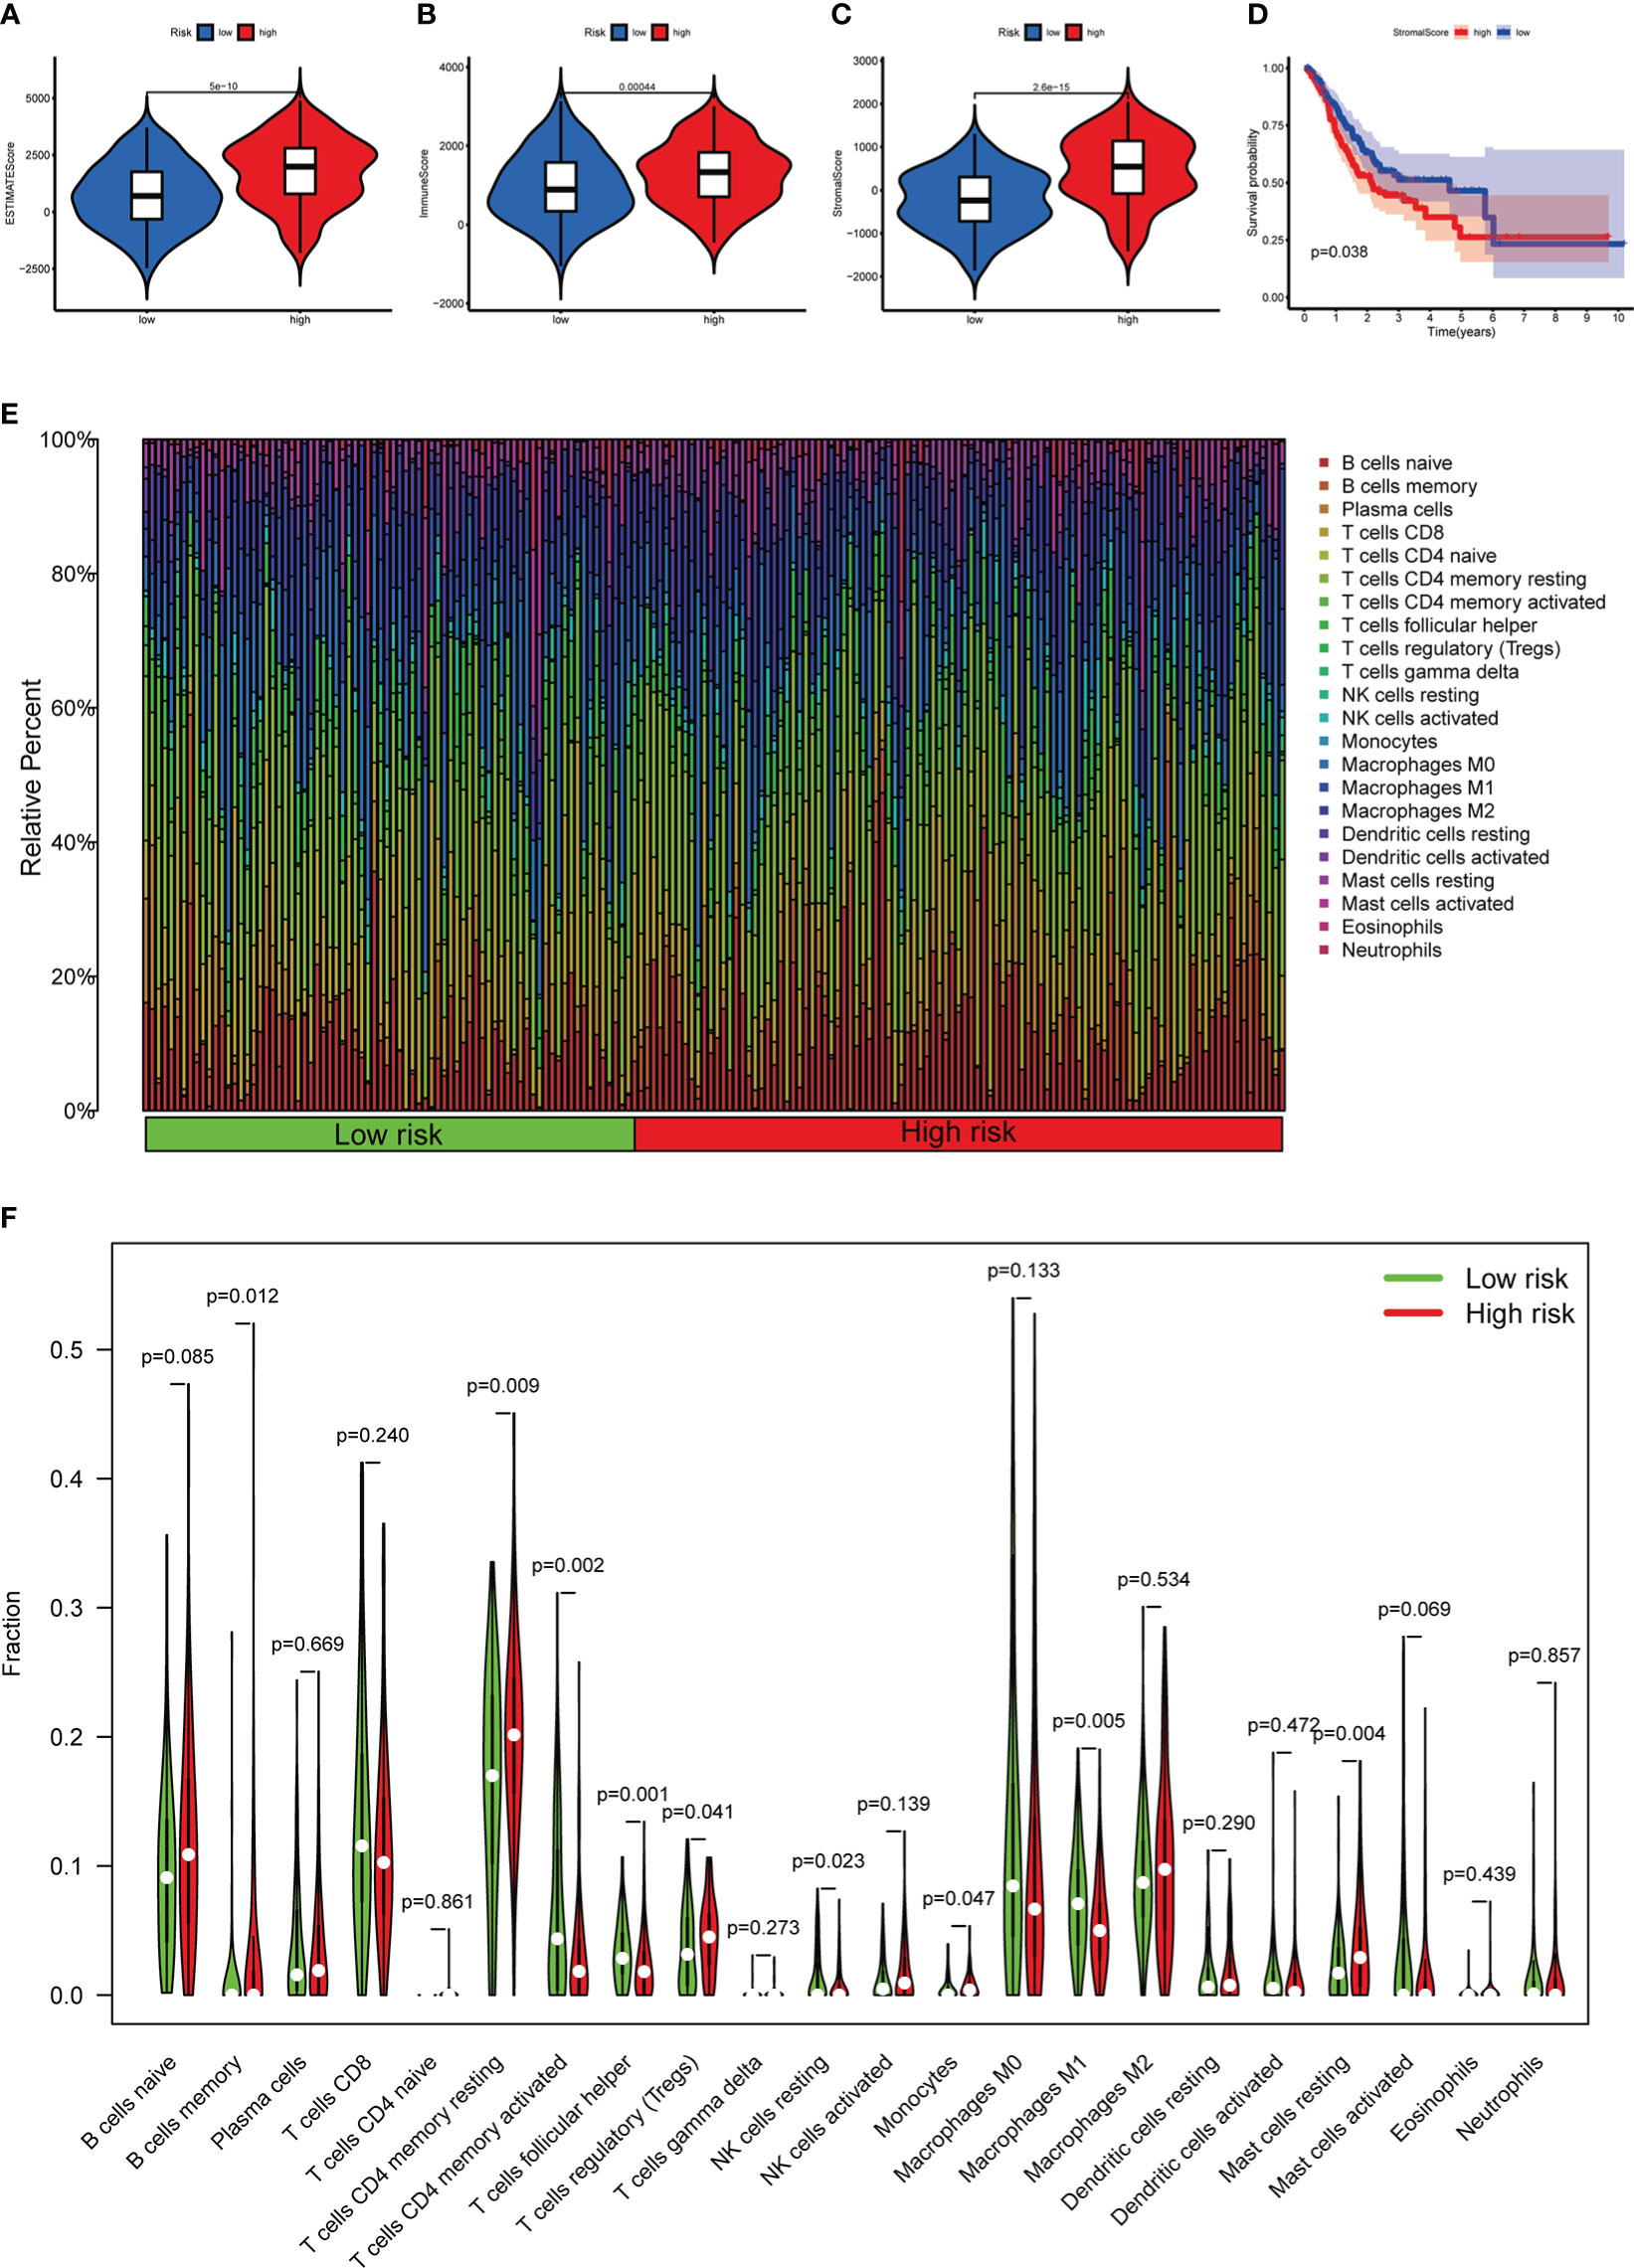
Figure 11 The relationship between different risk subgroups and TME. (A–C) Comparison of ESTIMATE scores, Immune scores, and Stromal scores in the high-risk group and low-risk group. (D) The OS of patients with high stromal scores was significantly lower than those with low stromal scores. (E) The distribution of TIICs in the high-risk group and low-risk group. (F) Violin plot showing differences in TIICs between the high-risk group and low-risk group.
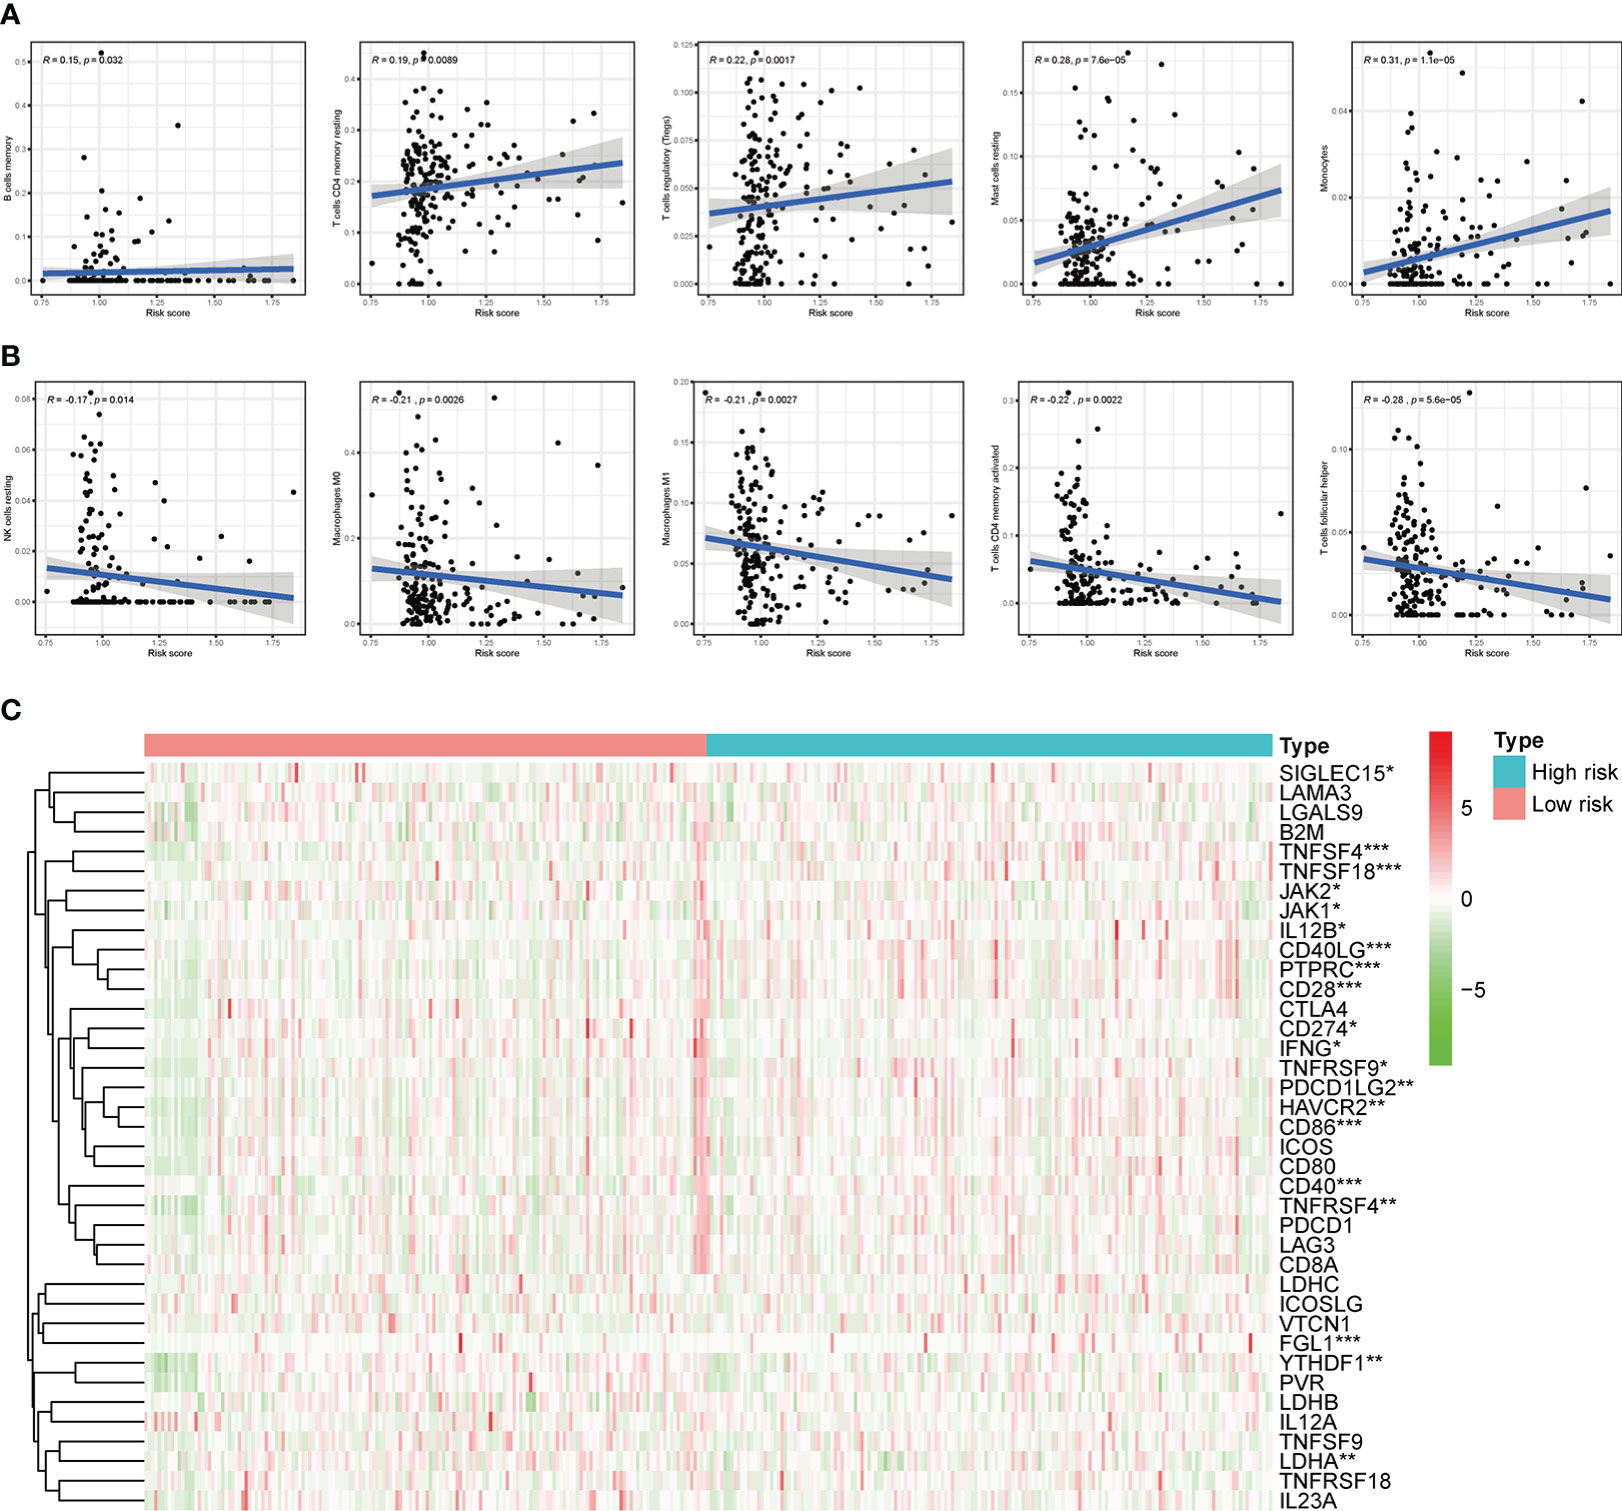
Figure 12 Correlation of subgroup with TME and ICGs. (A) The high-risk group has significant positive correlations with memory B cells, memory resting CD4 T cells, regulatory T cells, resting mast cells, and monocytes. (B) The high-risk group has significant negative correlations with resting NK cells, M0 Macrophages, M1 Macrophages, memory activated CD4 T cells, and follicular helper T cells. (C) The expression of ICGs between different risk subgroups. *p < 0.05, **p < 0.01, and ***p < 0.001.
Functional enrichment analysis
The results of GO analysis suggested that the DEGs in different risk subgroups and clusters were mainly enriched in extracellular structure-related biological processes, such as “extracellular matrix organization”, “collagen-containing extracellular matrix”, and “extracellular matrix structural constituent” (Figures 13A, B). KEGG pathway analysis results revealed that the DEGs in different clusters or risk groups were particularly enriched in malignancy-associated pathways, including “PI3K-Akt signaling pathway”, “Focal adhesion,” and “Wnt signaling pathway”. (Figures 13C, D). Moreover, the result of GSEA showed that some cancer-related pathways, such as “Focal adhesion”, “ECM−receptor interaction”, and “Cell adhesion molecules”, were highly active in cluster II and high-risk group (Figure 13E, F).
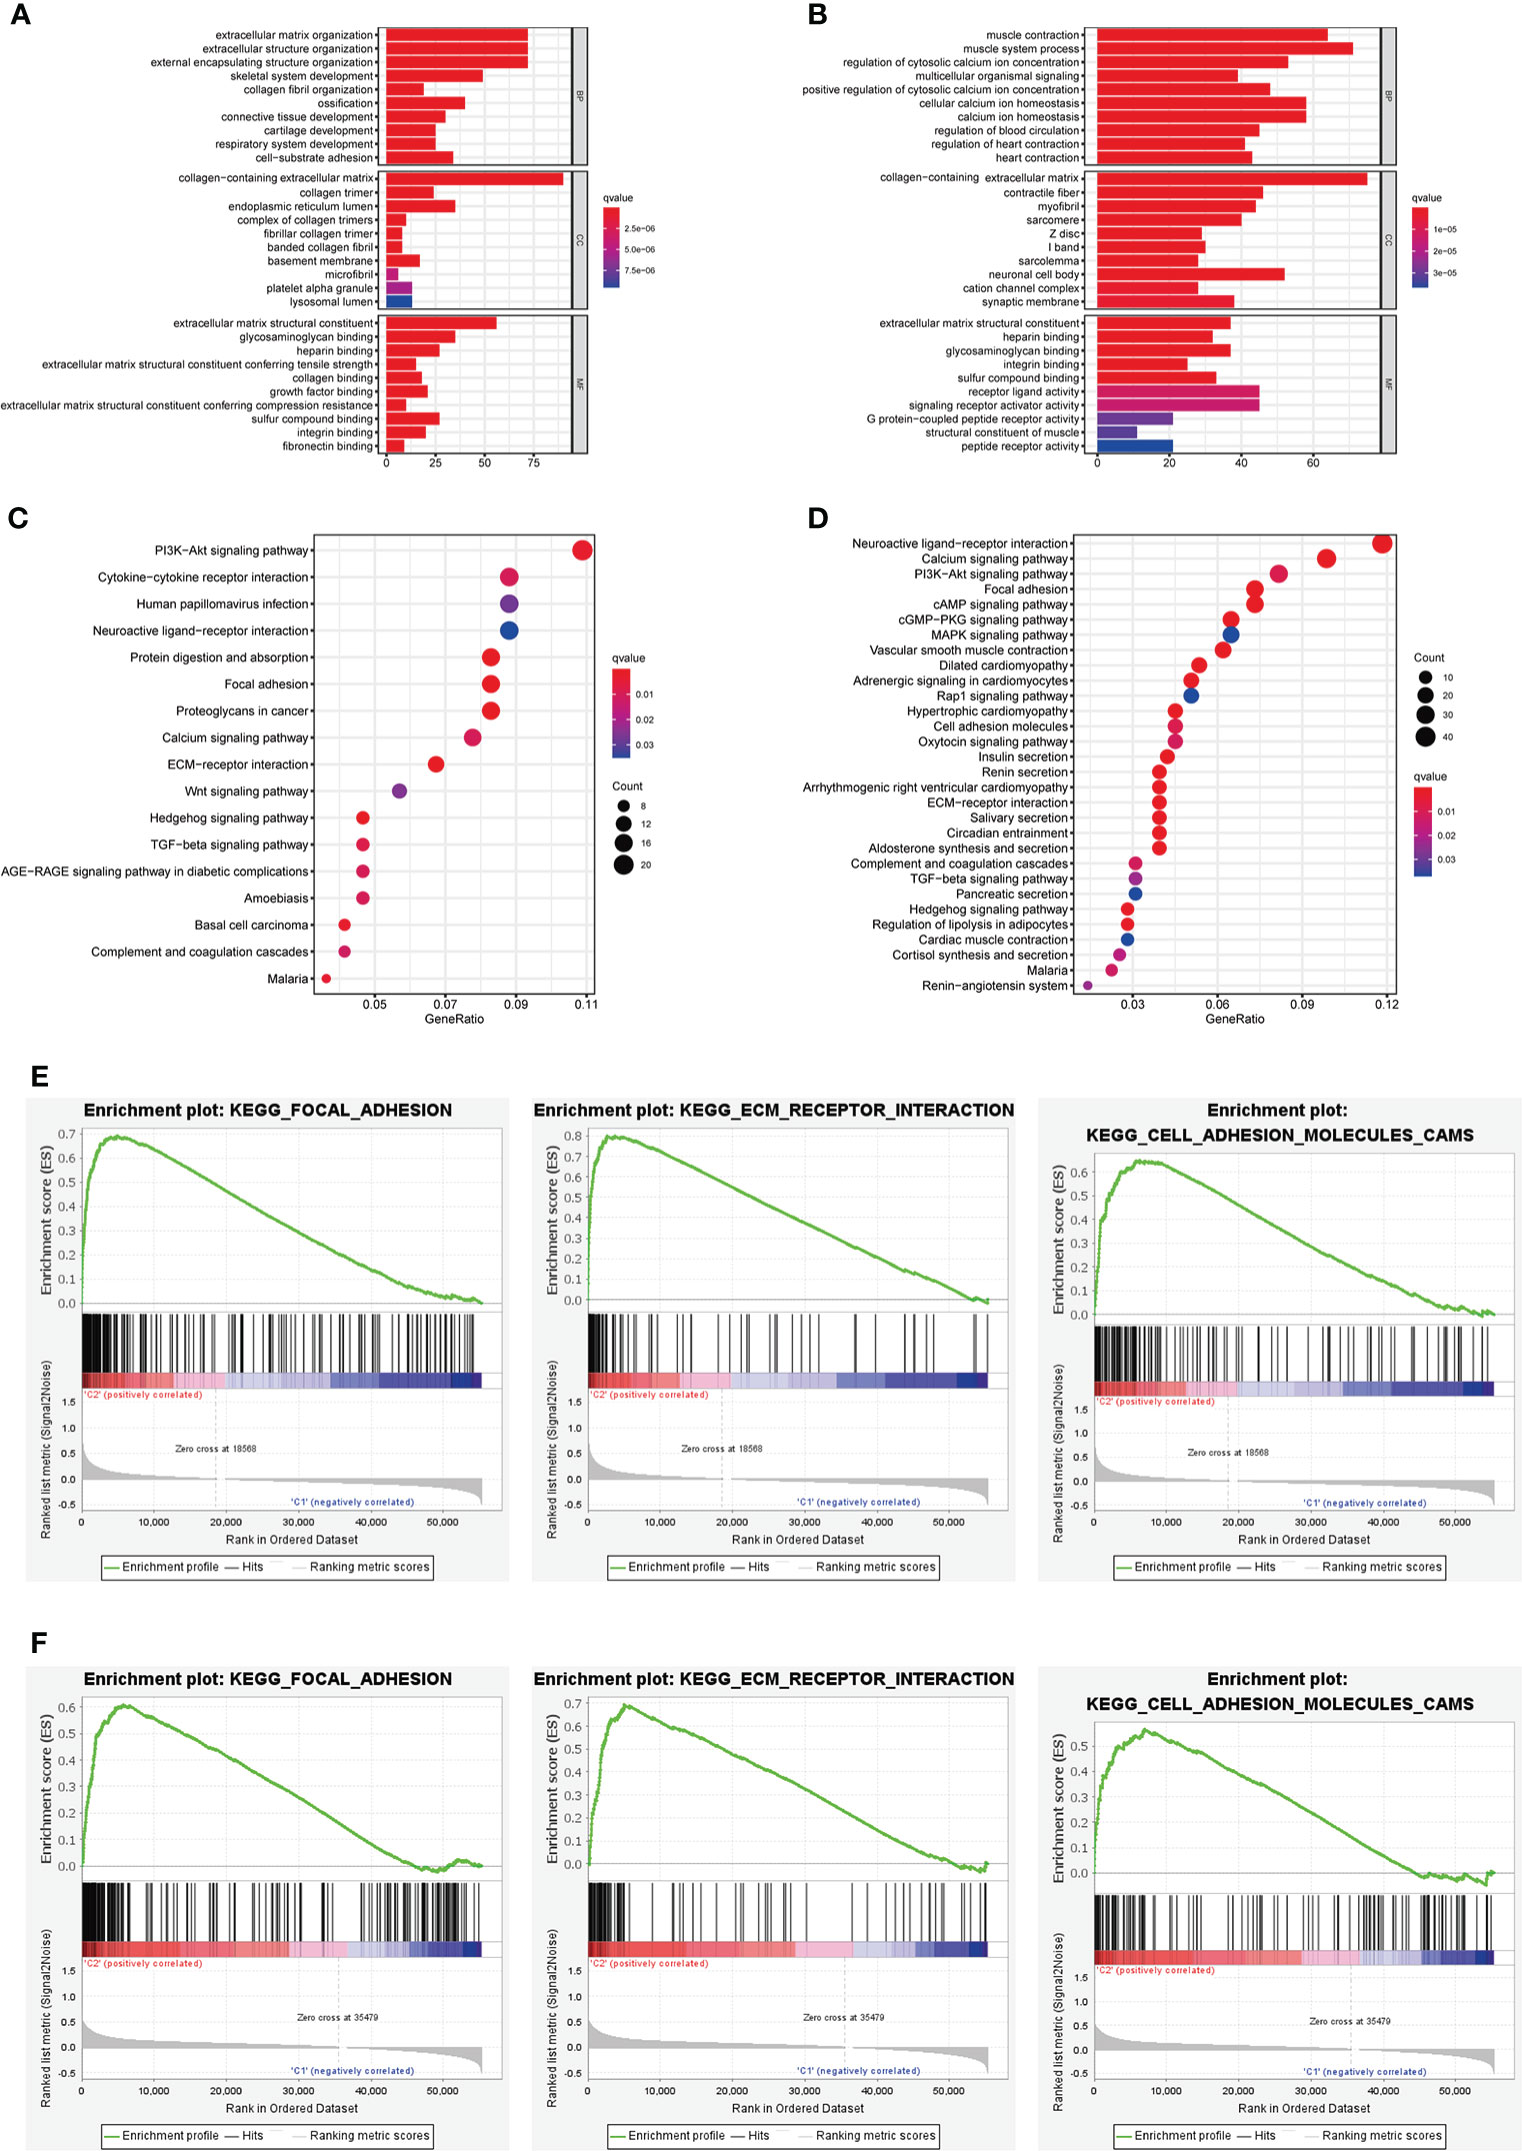
Figure 13 Biological functional analysis. (A, B) The bar plot of GO analysis in DEGs between different clusters and different risk subgroups. (C, D) The bubble plot of KEGG pathways analysis in DEGs between different clusters and different risk subgroups. (E, F) GSEA analysis for cluster II and high-risk group.
CMap database analysis
To acquire candidate small molecules for treating GC, we uploaded the DEGs (|fold change| > 1 and p < 0.05) between different risk subgroups to the CMap database for GSEA. The top ten small molecules with satisfactory enrichment scores were listed in Table 1 and the 3D chemical structures of the three most significant drugs were shown in Figure 14A-C, which may become new therapeutic regimens to treat GC.
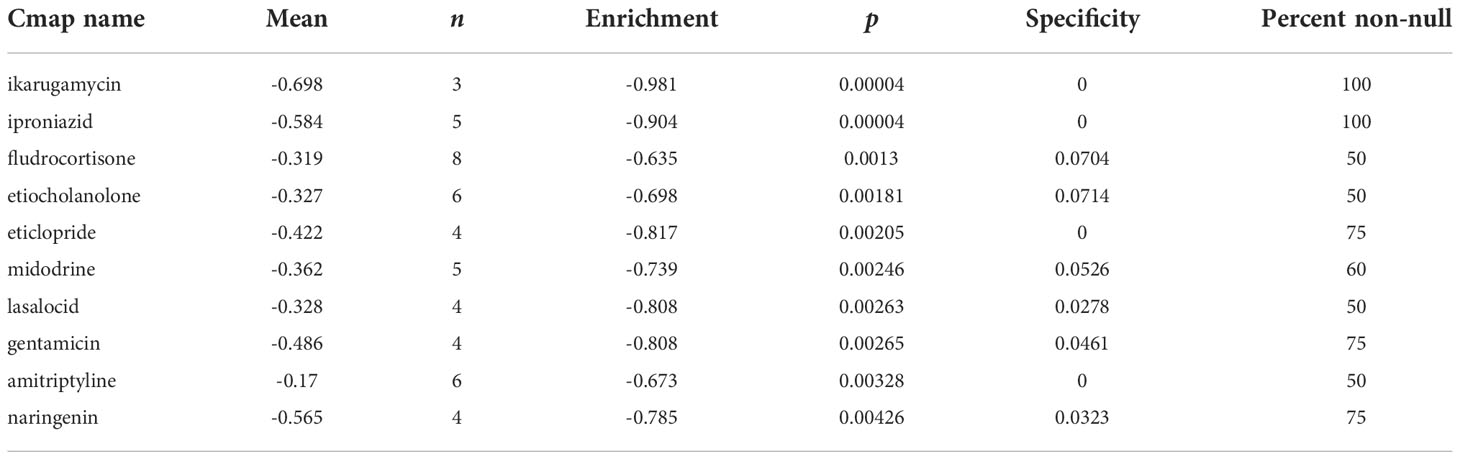
Table 1 Results of CMap analysis.
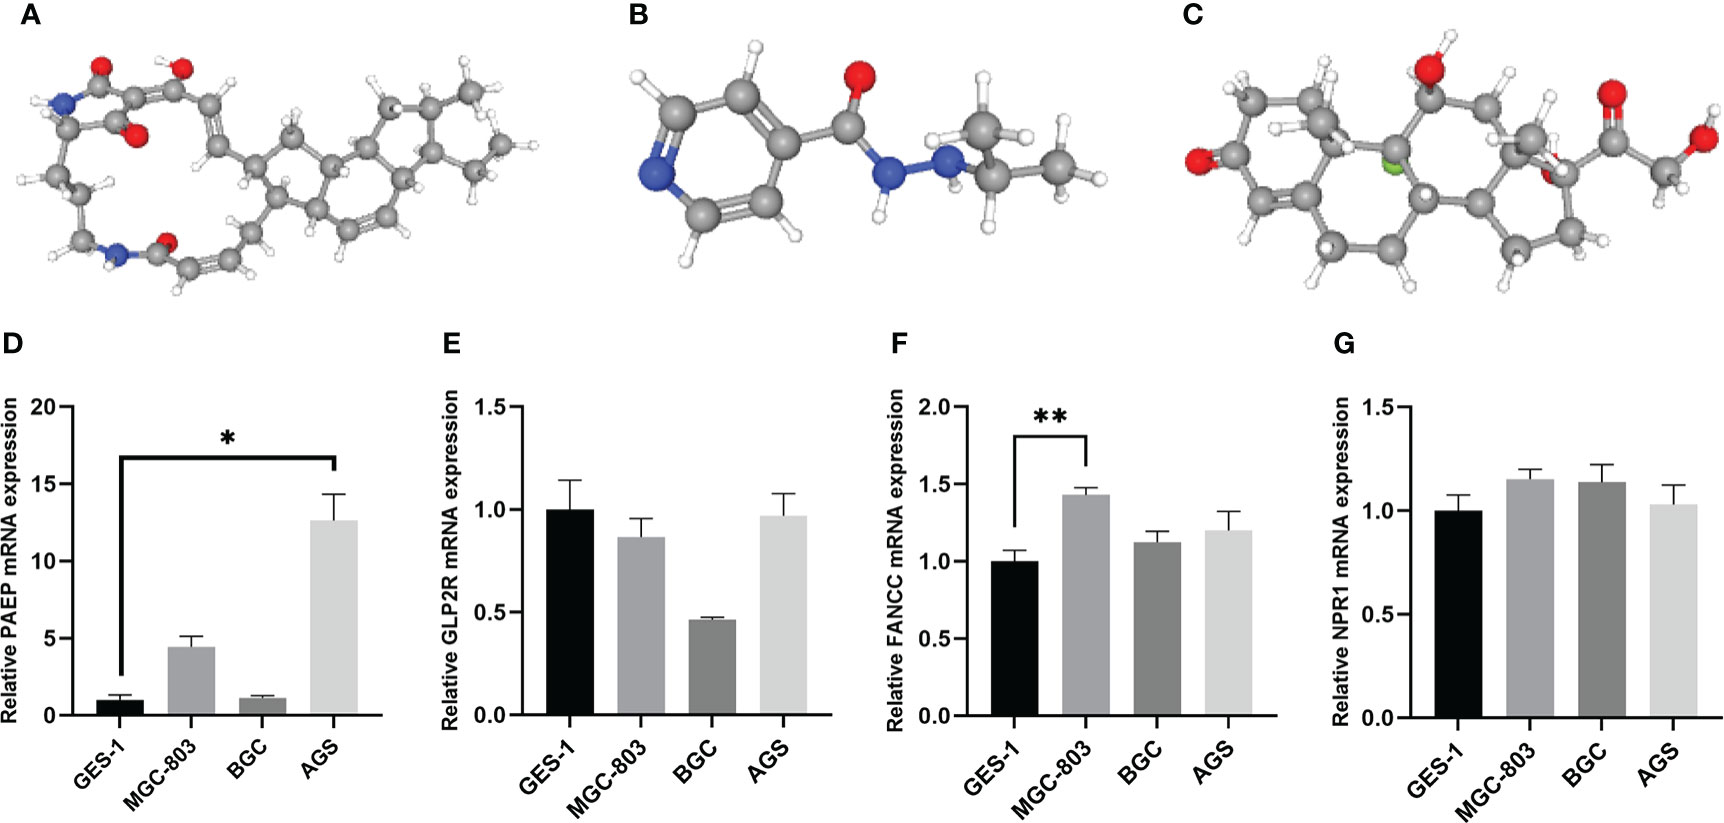
Figure 14 The 3D structure of the three small molecule drugs for GC and validation of the expression levels of the prognostic m6AIGs in cell lines. (A) Ikarugamycin. (B) Iproniazid. (C) Fludrocortisone. (D–G) The expression of four mRNAs from m6AIGs-PS in GC cells and GES-1. *p < 0.05, **p < 0.01.
Validation of the expression levels of the prognostic m6AIGs in cell lines
Human GC cell line MGC-803, BGC and AGS, and normal human gastric epithelial cell line GES-1 were used to validate the expression levels of the m6AIGs from m6AIGs-PS. As a result, PAEP and FANCC were upregulated in GC cells compared with GES-1, and GLP2R was lowly expressed in GC cells, which were with the same expression profile with TCGA data (Figure 14D-F). However, we found that NPR1 was upregulated in GC cells compared with GES-1, which was not consistent with the outcome in the TCGA cohort. (Figure 14G).
Discussion
Emerging data have suggested that both the global m6A levels and the expression of m6A regulators are dysregulated in various types of cancers, which are associated with drug resistance and prognosis (42). Additionally, copious studies have shown that m6A take a key part in immune recognition and activation of immune responses (26, 43). Thus, we comprehensively evaluated the prognostic roles and the function of m6AIGs and revealed the latent relationship between m6AIGs with TME in GC.
In previous investigations, the immune-related genes or m6A-related regulators signatures for prognostic prediction have been studied in a variety of cancers, such as lung Adenocarcinoma (44, 45), hepatocellular carcinoma (46, 47), etc. Similarly, based on the differentially expressed immune-related genes or m6A-related regulators, several prognostic signatures have also been established to predict the outcome of GC patients. A three m6A-related regulators signature (FTO, RBM15, ALKBH5) could be used to effectively predict the clinicopathological features of GC patients (48), and a nine m6A-related lncRNA risk signature is an independent prognostic indicator for patients with GC, which can effectively predict survival status (49). Another ten immune-related genes signature has been constructed to evaluate the immune landscape of GC patients and found related regulatory mechanisms in GC (50). However, the immune-related genes–m6A-related regulators interaction in the GC prognostic model remains to be clarified. Here we report for the first time the m6AIGs signature for prognosis and immune landscape of GC populations. In addition, via a comprehensive bioinformatic method as previous studies (51, 52), we found different clusters based on the m6AIGs in GC, explored the risk of different clinicopathological features, TME scores, TIICs and ICGs, and acquired candidate small molecules for treating GC.
A total of 443 GC patients and 407 samples from the TCGA datasets, 23 m6A-related regulators and 3179 immune-related genes were included in our study. Fourteen m6AIGs were confirmed to have prognostic value, and GC patients were segmented into two clusters (clusters I and II) according to the expression of those m6AIGs. There were significant differences in OS rates, age, and tumor grade between these two clusters. Subsequently, four prognosis-related m6AIGs, namely PAEP, GLP2R, NPR1, and FANCC, were used to establish a prognostic signature for predicting the OS of GC patients. PAEP, a direct T cell inhibitor, seems to promote tumor growth by negatively regulating the anti-tumor immune response. For instance, the melanoma cell-secreted PAEP could suppress the activation and cytotoxicity of T lymphocytes, resulting in immune tolerance within the TME (53). There is little known about the relationship between GLP2R and cancer, but local activation of GLP2R diminishes islet inflammation by attenuating macrophage activation (54). NRP1 has been reported to be an oncogene by participating in the development and progression of cancers, such as lung adenocarcinoma (55), breast cancer (56), prostate cancer (57), and gastric cancer (58). Several studies have provided evidence that FANCC-deficient mononuclear phagocytes could produce multiple inflammatory cytokines (59), and FANCC disruption caused increased spontaneous chromosomal breakage, clastogenic damage on irradiation, and clastogenic damage (60). Significant differences in OS were observed between different risk subgroups under KM analyses and ROC curve analysis confirmed that m6AIGs-PS had a good predictive performance. Univariate Cox and multivariate Cox analyses demonstrated RS can be used as an independent prognostic factor for GC. The results indicated the specificity and sensitivity of m6AIGs-PS in GC. In addition, we established a nomogram comprising RS and clinical risk characteristics, which had particular importance in clinical practice. Furthermore, patients stratified by RS had different clinical characteristics, such as age, grade, stage M, and stage N. RS also could serve as a prognostic instrument for patients with diverse clinical features, especially age, sex, tumor grade G3, clinical stage, stages T3–T4, stage M0, and stage N.
TME has been identified as a key modulator of tumor progression and prognosis of cancer patients for more than a decade (61). ICGs are novel targets to develop treatments for tumors and have shown excellent clinical benefit, resulting from their roles in circumventing self-reactivity (62). Hence, the relationship between m6AIGs and the immune landscape including TME scores, TIICs, and ICGs expression was analyzed. The tumor purity decreased in high-risk groups and cluster II was associated with poorer OS, suggesting the malignant effect of stromal cells and the immune exhaustion in GC. In tumors, the coordinated intercellular interactions that exist in normal tissues are destroyed as the cancer cells obtain the capacity to chronically circumvent normalizing cues from the microenvironment (63). For example, a study using a mouse model of inflammation-associated GC demonstrated that cancer-associated fibroblasts promote GC cell growth and progression via secretion of CXCL12, Wnt5a, and IL-6 (9). Moreover, CXCL1 secreted by tumor-associated lymphatic endothelial cells promoted the migration, invasion, and adhesion of GC cells by upregulating MMP9, MMP2, and integrin β1 (64). Concerning TIICs, monocytes positively correlated with cluster II and the high-risk group. It has been well established that monocyte-derived tumor-associated macrophages could promote tumorigenesis by remodeling the extracellular matrix and immune suppression (65). Immune checkpoint inhibitors (ICIs) have revolutionized cancer treatment with excellent efficacy in different cancers (66). The analysis of ICGs showed that some prominent ICGs, such as CD28, CD86, CD40, TNFSF4, and TNFSF18, were significantly overexpressed in cluster II and the high-risk group.
Functional enrichment analysis was performed between different clusters or different risk subgroups to view the latent functions of m6AIGs. GO analysis results revealed that the DEGs in different risk subgroups and clusters were particularly enriched in some cancer-related biological processes, such as “extracellular matrix organization”, “collagen-containing”, and “extracellular matrix structural constituent” (67, 68). Collagen, the main ingredient of the extracellular matrix and the interstitial microenvironment, could offer a scaffold for tumor cells and cause tumor migration. Similarly, the results of KEGG pathways analysis also enriched in malignancy-associated pathways of GC, containing “PI3K-Akt signaling pathway”, and “Wnt signaling pathway”. The results of GSEA showed that cluster II and the high-risk group were enriched in some malignant pathways, such as “Focal adhesion”, “ECM−receptor interaction”, and “Cell adhesion molecules”.
Finally, some candidate drugs with the potential to reverse aberrant gene expression in GC were identified. The above-selected drugs are untraditional anti-tumor drugs, but there is lots of evidence of their effects on cancer cells. Ikarugamycin, isolated from mangrove-derived S. xiamenensis 318, could block glycolysis in pancreatic cancer by targeting HK2 (69) and induce apoptosis in HL-60 leukemia cells through genotoxicity (70). Therefore, the drugs with potential efficacy should be further studied and tried in the clinical trial.
Consequently, the m6AIGs-PS was helpful for the risk stratification of GC patients, and the nomogram had the latent force to be used as a quantitative instrument to predict OS. Besides, searching for effective therapeutic targets to improve the limitation of current immunotherapy for GC patients is urgent. In our research, we explored the immune-related genes–m6A-related regulators interaction, which provides a promising strategy with an important clinical implication for guiding individual therapy based on m6A RNA modification.
However, there are some limitations in our research. Firstly, our findings are based on the online database, and the predictive performance of m6AIGs-PS still needed to verify in the large-sample clinical cohort in the future. Secondly, our research mainly focused on bioinformatic analysis, more experimental studies exploring the specific role of m6AIGs in GC are in urgent need in future work.
Conclusion
The prognostic value and significance in the assessment of the immune landscape of m6AIGs in GC patients were systematically analyzed in this study. Two clusters based on 14 prognostic m6AIGs were identified. A prognostic signature based on 4 m6AIGs and a nomogram based on independent prognostic factors was constructed and validated. These results had significant value in predicting the OS of GC patients, clinicopathological features, and TME. Some biological processes and pathways associated with cancer and immune response were enriched, which provides a basis for further exploring the function of m6AIGs. Lastly, some potential small molecule drugs for the therapy of GC were identified.
Data availability statement
The original contributions presented in the study are included in the article/supplementary material. Further inquiries can be directed to the corresponding authors.
Ethics Statement
This study met the publication guidelines stated by TCGA (https://cancergenome.nih.Gov/publications/publicationguidelines). Ethics approval and informed consent were not required.
Author contributions
YH, YW, JL, and FL designed the study. YH, YZ, YT, and ZY organized the database, performed statistical analyses, and prepared the figures and tables. YH, YZ, and YW wrote the first draft of the manuscript. ZH, PL, FL, JL, and YW revised the manuscript. All authors contributed to the article and approved the submitted version.
Funding
This study was supported by The National Natural Science Foundation (No. 81904139, No. 81973819, No. 81904145, No. 82104602, and No. 81903963), Collaborative Innovation Team Project of First-Rate Universities and Disciplines and High-level University Discipline of Guangzhou University of Chinese Medicine (No. 2021xk47), The Natural Science Foundation of Guangdong Province (No. 2019A1515011145 and No. 2018A030310614), Guangdong Medical Science and Technology Research Fund (No. B2021089, No. A2020186), Guangzhou Science and Technology Project (No. 202102020535), Clinical Research Project of Innovation Hospital in the First Affiliated Hospital of Guangzhou University of Chinese Medicine (No. 2019IIT19) and Innovation Development project of the First Affiliated Hospital of Guangzhou University of Chinese Medicine (No. 2019QN01).
Acknowledgments
We appreciate TCGA database and the authors up-loaded their data. This work is supported by the Lingnan Medical Research Center of Guangzhou University of Chinese Medicine. We are grateful to acknowledge Dr. Hong Mi (Department of Gastroenterology, the First Affiliated Hospital of Guangzhou University of Chinese Medicine) for her valuable suggestions in revision.
Conflict of interest
The authors declare that the research was conducted in the absence of any commercial or financial relationships that could be construed as a potential conflict of interest.
Publisher’s note
All claims expressed in this article are solely those of the authors and do not necessarily represent those of their affiliated organizations, or those of the publisher, the editors and the reviewers. Any product that may be evaluated in this article, or claim that may be made by its manufacturer, is not guaranteed or endorsed by the publisher.
References
1. Bray F, Ferlay J, Soerjomataram I, Siegel RL, Torre LA, Jemal A. Global cancer statistics 2018: GLOBOCAN estimates of incidence and mortality worldwide for 36 cancers in 185 countries. CA Cancer J Clin (2018) 68:394–424. doi: 10.3322/caac.21492
2. Rugge M, Meggio A, Pravadelli C, Barbareschi M, Fassan M, Gentilini M, et al. Gastritis staging in the endoscopic follow-up for the secondary prevention of gastric cancer: A 5-year prospective study of 1755 patients. Gut (2019) 68:11–7. doi: 10.1136/gutjnl-2017-314600
3. Digklia A, Wagner AD. Advanced gastric cancer: Current treatment landscape and future perspectives. World J Gastroenterol (2016) 22:2403–14. doi: 10.3748/wjg.v22.i8.2403
4. Joshi SS, Badgwell BD. Current treatment and recent progress in gastric cancer. CA Cancer J Clin (2021) 71:264–79. doi: 10.3322/caac.21657
5. Barbieri I, Kouzarides T. Role of RNA modifications in cancer. Nat Rev Cancer (2020) 20:303–22. doi: 10.1038/s41568-020-0253-2
6. Jiang X, Liu B, Nie Z, Duan L, Xiong Q, Jin Z, et al. The role of m6A modification in the biological functions and diseases. Signal transduction targeted Ther (2021) 6:74. doi: 10.1038/s41392-020-00450-x
7. Yang Y, Hsu PJ, Chen YS, Yang YG. Dynamic transcriptomic m(6)A decoration: Writers, erasers, readers and functions in RNA metabolism. Cell Res (2018) 28:616–24. doi: 10.1038/s41422-018-0040-8
8. Nombela P, Miguel-López B, Blanco S. The role of m(6)A, m(5)C and Ψ RNA modifications in cancer: Novel therapeutic opportunities. Mol Cancer (2021) 20:18. doi: 10.1186/s12943-020-01263-w
9. Xie S, Chen W, Chen K, Chang Y, Yang F, Lin A, et al. Emerging roles of RNA methylation in gastrointestinal cancers. Cancer Cell Int (2020) 20:585. doi: 10.1186/s12935-020-01679-w
10. Wang Q, Chen C, Ding Q, Zhao Y, Wang Z, Chen J, et al. METTL3-mediated m(6)A modification of HDGF mRNA promotes gastric cancer progression and has prognostic significance. Gut (2020) 69:1193–205. doi: 10.1136/gutjnl-2019-319639
11. Sun Y, Li S, Yu W, Zhao Z, Gao J, Chen C, et al. N(6)-methyladenosine-dependent pri-miR-17-92 maturation suppresses PTEN/TMEM127 and promotes sensitivity to everolimus in gastric cancer. Cell Death Dis (2020) 11:836. doi: 10.1038/s41419-020-03049-w
12. Liu HT, Zou YX, Zhu WJ, Liu S, Zhang GH, Ma RR, et al. LncRNA THAP7-AS1, transcriptionally activated by SP1 and post-transcriptionally stabilized by METTL3-mediated m6A modification, exerts oncogenic properties by improving CUL4B entry into the nucleus. Cell Death Differ (2021):29(3):627–641. doi: 10.1038/s41418-021-00879-9
13. Gonzalez H, Hagerling C, Werb Z. Roles of the immune system in cancer: From tumor initiation to metastatic progression. Genes Dev (2018) 32:1267–84. doi: 10.1101/gad.314617.118
14. Yang Y. Cancer immunotherapy: Harnessing the immune system to battle cancer. J Clin Invest (2015) 125:3335–7. doi: 10.1172/JCI83871
15. Tan S, Li D, Zhu X. Cancer immunotherapy: Pros, cons and beyond. BioMed Pharmacother (2020) 124:109821. doi: 10.1016/j.biopha.2020.109821
16. Yang L, Li A, Lei Q, Zhang Y. Tumor-intrinsic signaling pathways: Key roles in the regulation of the immunosuppressive tumor microenvironment. J Hematol Oncol (2019) 12:125. doi: 10.1186/s13045-019-0804-8
17. Augustin RC, Delgoffe GM, Najjar YG. Characteristics of the tumor microenvironment that influence immune cell functions: Hypoxia, oxidative stress, metabolic alterations. Cancers (2020) 12:3802. doi: 10.3390/cancers12123802
18. Vinay DS, Ryan EP, Pawelec G, Talib WH, Stagg J, Elkord E, et al. Immune evasion in cancer: Mechanistic basis and therapeutic strategies. Semin Cancer Biol (2015) 35 Suppl:S185–98. doi: 10.1016/j.semcancer.2015.03.004
19. Oya Y, Hayakawa Y, Koike K. Tumor microenvironment in gastric cancers. Cancer Sci (2020) 111:2696–707. doi: 10.1111/cas.14521
20. Refolo MG, Lotesoriere C, Messa C, Caruso MG, D’Alessandro R. Integrated immune gene expression signature and molecular classification in gastric cancer: New insights. J Leukoc Biol (2020) 108:633–46. doi: 10.1002/JLB.4MR0120-221R
21. Li M, Cao W, Huang B, Zhu Z, Chen Y, Zhang J, et al. Establishment and analysis of an individualized immune-related gene signature for the prognosis of gastric cancer. Front Surg (2022) 9:829237. doi: 10.3389/fsurg.2022.829237
22. Zhang AZ, Yuan X, Liang WH, Zhang HJ, Li Y, Xie YF, et al. Immune infiltration in gastric cancer microenvironment and its clinical significance. Front Cell Dev Biol (2021) 9:762029. doi: 10.3389/fcell.2021.762029
23. Huo J, Wu L, Zang Y. Construction and validation of a universal applicable prognostic signature for gastric cancer based on seven immune-related gene correlated with tumor associated macrophages. Front Oncol (2021) 11:635324. doi: 10.3389/fonc.2021.635324
24. Gomez S, Tabernacki T, Kobyra J, Roberts P, Chiappinelli KB. Combining epigenetic and immune therapy to overcome cancer resistance. Semin Cancer Biol (2020) 65:99–113. doi: 10.1016/j.semcancer.2019.12.019
25. Lou X, Wang JJ, Wei YQ, Sun JJ. Emerging role of RNA modification N6-methyladenosine in immune evasion. Cell Death Dis (2021) 12:300. doi: 10.1038/s41419-021-03585-z
26. Shulman Z, Stern-Ginossar N. The RNA modification N(6)-methyladenosine as a novel regulator of the immune system. Nat Immunol (2020) 21:501–12. doi: 10.1038/s41590-020-0650-4
27. Han D, Liu J, Chen C, Dong L, Liu Y, Chang R, et al. Anti-tumour immunity controlled through mRNA m(6)A methylation and YTHDF1 in dendritic cells. Nature (2019) 566:270–4. doi: 10.1038/s41586-019-0916-x
28. Wang H, Hu X, Huang M, Liu J, Gu Y, Ma L, et al. Mettl3-mediated mRNA m(6)A methylation promotes dendritic cell activation. Nat Commun (2019) 10:1898. doi: 10.1038/s41467-019-09903-6
29. Bhattacharya S, Dunn P, Thomas CG, Smith B, Schaefer H, Chen J, et al. ImmPort, toward repurposing of open access immunological assay data for translational and clinical research. Sci Data (2018) 5:180015. doi: 10.1038/sdata.2018.15
30. Breuer K, Foroushani AK, Laird MR, Chen C, Sribnaia A, Lo R, et al. InnateDB: Systems biology of innate immunity and beyond–recent updates and continuing curation. Nucleic Acids Res (2013) 41:D1228–33. doi: 10.1093/nar/gks1147
31. Zhou KI, Shi H, Lyu R, Wylder AC, Matuszek Ż, Pan JN, et al. Regulation of co-transcriptional pre-mRNA splicing by m(6)A through the low-complexity protein hnRNPG. Mol Cell (2019) 76:70–81. doi: 10.1016/j.molcel.2019.07.005
32. Huang Y, Huang C, Jiang X, Yan Y, Zhuang K, Liu F, et al. Exploration of potential roles of m5C-related regulators in colon adenocarcinoma prognosis. Front Genet (2022) 13:816173. doi: 10.3389/fgene.2022.816173
33. Huang Y, Yang Z, Huang C, Jiang X, Yan Y, Zhuang K, et al. Identification of N6-Methylandenosine-Related lncRNAs for subtype identification and risk stratification in gastric adenocarcinoma. Front Oncol (2021) 11:725181. doi: 10.3389/fonc.2021.725181
34. Newman AM, Steen CB, Liu CL, Gentles AJ, Chaudhuri AA, Scherer F, et al. Determining cell type abundance and expression from bulk tissues with digital cytometry. Nat Biotechnol (2019) 37:773–82. doi: 10.1038/s41587-019-0114-2
35. Yoshihara K, Shahmoradgoli M, Martínez E, Vegesna R, Kim H, Torres-Garcia W, et al. Inferring tumour purity and stromal and immune cell admixture from expression data. Nat Commun (2013) 4:2612. doi: 10.1038/ncomms3612
36. Harrell FJ, Lee KL, Mark DB. Multivariable prognostic models: Issues in developing models, evaluating assumptions and adequacy, and measuring and reducing errors. Stat Med (1996) 15:361–87. doi: 10.1002/(SICI)1097-0258(19960229)15:4<361::AID-SIM168>3.0.CO;2-4
37. Lamb J, Crawford ED, Peck D, Modell JW, Blat IC, Wrobel MJ, et al. The connectivity map: Using gene-expression signatures to connect small molecules, genes, and disease. Science (2006) 313:1929–35. doi: 10.1126/science.1132939
38. Wang J, Sanmamed MF, Datar I, Su TT, Ji L, Sun J, et al. Fibrinogen-like protein 1 is a major immune inhibitory ligand of LAG-3. Cell (2019) 176:334–47. doi: 10.1016/j.cell.2018.11.010
39. Zhang Q, Bi J, Zheng X, Chen Y, Wang H, Wu W, et al. Blockade of the checkpoint receptor TIGIT prevents NK cell exhaustion and elicits potent anti-tumor immunity. Nat Immunol (2018) 19:723–32. doi: 10.1038/s41590-018-0132-0
40. Patel SJ, Sanjana NE, Kishton RJ, Eidizadeh A, Vodnala SK, Cam M, et al. Identification of essential genes for cancer immunotherapy. Nature (2017) 548:537–42. doi: 10.1038/nature23477
41. Nishino M, Ramaiya NH, Hatabu H, Hodi FS. Monitoring immune-checkpoint blockade: Response evaluation and biomarker development. Nat Rev Clin Oncol (2017) 14:655–68. doi: 10.1038/nrclinonc.2017.88
42. Huang H, Weng H, Chen J. M(6)A modification in coding and non-coding RNAs: Roles and therapeutic implications in cancer. Cancer Cell (2020) 37:270–88. doi: 10.1016/j.ccell.2020.02.004
43. Li M, Zha X, Wang S. The role of N6-methyladenosine mRNA in the tumor microenvironment. Biochim Biophys Acta Rev Cancer (2021) 1875:188522. doi: 10.1016/j.bbcan.2021.188522
44. Fan T, Li C, He J. Prognostic value of immune-related genes and comparative analysis of immune cell infiltration in lung adenocarcinoma: Sex differences. Biol Sex Differ (2021) 12:64. doi: 10.1186/s13293-021-00406-y
45. Wang X, Zhao C, Huang D, Liu Z, Liu M, Lin F, et al. A novel M6A-related genes signature can impact the immune status and predict the prognosis and drug sensitivity of lung adenocarcinoma. Front Immunol (2022) 13:923533. doi: 10.3389/fimmu.2022.923533
46. Yu J, Ma S, Tian S, Zhang M, Ding X, Liu Y, et al. Systematic construction and validation of a prognostic model for hepatocellular carcinoma based on immune-related genes. Front Cell Dev Biol (2021) 9:700553. doi: 10.3389/fcell.2021.700553
47. Du Y, Ma Y, Zhu Q, Liu T, Jiao Y, Yuan P, et al. An m6A-related prognostic biomarker associated with the hepatocellular carcinoma immune microenvironment. Front Pharmacol (2021) 12:707930. doi: 10.3389/fphar.2021.707930
48. Su Y, Huang J, Hu J. M(6)A RNA methylation regulators contribute to malignant progression and have clinical prognostic impact in gastric cancer. Front Oncol (2019) 9:1038. doi: 10.3389/fonc.2019.01038
49. Huang J, Chen W, Chen C, Jie Z, Xiao T. Comprehensive analysis and prognosis prediction of N6-Methyladenosine-Related lncRNAs in immune microenvironment infiltration of gastric cancer. Int J Gen Med (2022) 15:2629–43. doi: 10.2147/IJGM.S349399
50. Chen T, Yang C, Dou R, Xiong B. Identification of a novel 10 immune-related genes signature as a prognostic biomarker panel for gastric cancer. Cancer Med (2021) 10:6546–60. doi: 10.1002/cam4.4180
51. Huang J, Kang W, Pan S, Yu C, Jie Z, Chen C. NOL12 as an oncogenic biomarker promotes hepatocellular carcinoma growth and metastasis. Oxid Med Cell Longev (2022) 2022:6891155. doi: 10.1155/2022/6891155
52. Huang J, Chen W, Jie Z, Jiang M. Comprehensive analysis of immune implications and prognostic value of SPI1 in gastric cancer. Front Oncol (2022) 12:820568. doi: 10.3389/fonc.2022.820568
53. Ren S, Chai L, Wang C, Li C, Ren Q, Yang L, et al. Human malignant melanoma-derived progestagen-associated endometrial protein immunosuppresses T lymphocytes in vitro. PloS One (2015) 10:e119038. doi: 10.1371/journal.pone.0119038
54. He W, Rebello OD, Henne A, Nikolka F, Klein T, Maedler K. GLP-2 is locally produced from human islets and balances inflammation through an inter-Islet-Immune cell crosstalk. Front Endocrinol (Lausanne) (2021) 12:697120. doi: 10.3389/fendo.2021.697120
55. Fu R, Du W, Ding Z, Wang Y, Li Y, Zhu J, et al. HIF-1α promoted vasculogenic mimicry formation in lung adenocarcinoma through NRP1 upregulation in the hypoxic tumor microenvironment. Cell Death Dis (2021) 12:394. doi: 10.1038/s41419-021-03682-z
56. Vintonenko N, Pelaez-Garavito I, Buteau-Lozano H, Toullec A, Lidereau R, Perret GY, et al. Overexpression of VEGF189 in breast cancer cells induces apoptosis via NRP1 under stress conditions. Cell Adh Migr (2011) 5:332–43. doi: 10.4161/cam.5.4.17287
57. Yin L, Li J, Wang J, Pu T, Wei J, Li Q, et al. MAOA promotes prostate cancer cell perineural invasion through SEMA3C/PlexinA2/NRP1-cMET signaling. Oncogene (2021) 40:1362–74. doi: 10.1038/s41388-020-01615-2
58. Peng Y, Liu YM, Li LC, Wang LL, Wu XL. MicroRNA-338 inhibits growth, invasion and metastasis of gastric cancer by targeting NRP1 expression. PloS One (2014) 9:e94422. doi: 10.1371/journal.pone.0094422
59. Garbati MR, Hays LE, Keeble W, Yates JE, Rathbun RK, Bagby GC. FANCA and FANCC modulate TLR and p38 MAPK-dependent expression of IL-1β in macrophages. Blood (2013) 122:3197–205. doi: 10.1182/blood-2013-02-484816
60. Gallmeier E, Calhoun ES, Rago C, Brody JR, Cunningham SC, Hucl T, et al. Targeted disruption of FANCC and FANCG in human cancer provides a preclinical model for specific therapeutic options. Gastroenterology (2006) 130:2145–54. doi: 10.1053/j.gastro.2006.03.016
61. Kim SJ, Khadka D, Seo JH. Interplay between solid tumors and tumor microenvironment. Front Immunol (2022) 13:882718. doi: 10.3389/fimmu.2022.882718
62. Hu FF, Liu CJ, Liu LL, Zhang Q, Guo AY. Expression profile of immune checkpoint genes and their roles in predicting immunotherapy response. Brief Bioinform (2021) 22:bbaa176. doi: 10.1093/bib/bbaa176
63. Quail DF, Joyce JA. Microenvironmental regulation of tumor progression and metastasis. Nat Med (2013) 19:1423–37. doi: 10.1038/nm.3394
64. Wang Z, Wang Z, Li G, Wu H, Sun K, Chen J, et al. CXCL1 from tumor-associated lymphatic endothelial cells drives gastric cancer cell into lymphatic system via activating integrin β1/FAK/AKT signaling. Cancer Lett (2017) 385:28–38. doi: 10.1016/j.canlet.2016.10.043
65. Olingy CE, Dinh HQ, Hedrick CC. Monocyte heterogeneity and functions in cancer. J Leukoc Biol (2019) 106:309–22. doi: 10.1002/JLB.4RI0818-311R
66. Massari F, Santoni M, Ciccarese C, Santini D. The immunocheckpoints in modern oncology: The next 15 years. Expert Opin Biol Ther (2015) 15:917–21. doi: 10.1517/14712598.2015.1035251
67. Zhou ZH, Ji CD, Xiao HL, Zhao HB, Cui YH, Bian XW. Reorganized collagen in the tumor microenvironment of gastric cancer and its association with prognosis. J Cancer (2017) 8:1466–76. doi: 10.7150/jca.18466
68. Jang M, Koh I, Lee SJ, Cheong JH, Kim P. Droplet-based microtumor model to assess cell-ECM interactions and drug resistance of gastric cancer cells. Sci Rep (2017) 7:41541. doi: 10.1038/srep41541
69. Jiang SH, Dong FY, Da LT, Yang XM, Wang XX, Weng JY, et al. Ikarugamycin inhibits pancreatic cancer cell glycolysis by targeting hexokinase 2. FASEB J (2020) 34:3943–55. doi: 10.1096/fj.201901237R
Keywords: gastric cancer, N6-methyladenosine, immune genes, prognostic signature, tumor microenvironment
Citation: Huang Y, Zou Y, Tian Y, Yang Z, Hou Z, Li P, Liu F, Ling J and Wen Y (2022) N6-methylandenosine-related immune genes correlate with prognosis and immune landscapes in gastric cancer. Front. Oncol. 12:1009881. doi: 10.3389/fonc.2022.1009881
Received: 02 August 2022; Accepted: 16 November 2022;
Published: 29 November 2022.
Edited by:
Jian Zhang, Fourth Military Medical University, ChinaReviewed by:
Jianfeng Huang, The First Affiliated Hospital of Nanchang University, ChinaKechao Nie, Department of Integrated Traditional Chinese and Western Medicine, Central South University, China
Copyright © 2022 Huang, Zou, Tian, Yang, Hou, Li, Liu, Ling and Wen. This is an open-access article distributed under the terms of the Creative Commons Attribution License (CC BY). The use, distribution or reproduction in other forums is permitted, provided the original author(s) and the copyright owner(s) are credited and that the original publication in this journal is cited, in accordance with accepted academic practice. No use, distribution or reproduction is permitted which does not comply with these terms.
*Correspondence: Fengbin Liu, bGl1ZmIxNjNAMTYzLmNvbQ==; Jiasheng Ling, MTU4MTY0ODgxMjhAMTYzLmNvbQ==; Yi Wen, MjAxNzIxMDEwMzFAc3R1Lmd6dWNtLmVkdS5jbg==
†These authors have contributed equally to this work