
95% of researchers rate our articles as excellent or good
Learn more about the work of our research integrity team to safeguard the quality of each article we publish.
Find out more
ORIGINAL RESEARCH article
Front. Oncol. , 15 November 2022
Sec. Cancer Imaging and Image-directed Interventions
Volume 12 - 2022 | https://doi.org/10.3389/fonc.2022.1007874
This article is part of the Research Topic Artificial Intelligence in the Detection and Segmentation of Breast Cancers View all 4 articles
 Jeffrey P. Leal1
 Steven P. Rowe1,2*
 Vered Stearns2
 Roisin M. Connolly3
 Christos Vaklavas4
 Minetta C. Liu5Anna Maria Storniolo6Richard L. Wahl7Martin G. Pomper1,2
 Lilja B. Solnes1,2
Applications based on artificial intelligence (AI) and deep learning (DL) are rapidly being developed to assist in the detection and characterization of lesions on medical images. In this study, we developed and examined an image-processing workflow that incorporates both traditional image processing with AI technology and utilizes a standards-based approach for disease identification and quantitation to segment and classify tissue within a whole-body [18F]FDG PET/CT study.
Methods: One hundred thirty baseline PET/CT studies from two multi-institutional preoperative clinical trials in early-stage breast cancer were semi-automatically segmented using techniques based on PERCIST v1.0 thresholds and the individual segmentations classified as to tissue type by an experienced nuclear medicine physician. These classifications were then used to train a convolutional neural network (CNN) to automatically accomplish the same tasks.
Results: Our CNN-based workflow demonstrated Sensitivity at detecting disease (either primary lesion or lymphadenopathy) of 0.96 (95% CI [0.9, 1.0], 99% CI [0.87,1.00]), Specificity of 1.00 (95% CI [1.0,1.0], 99% CI [1.0,1.0]), DICE score of 0.94 (95% CI [0.89, 0.99], 99% CI [0.86, 1.00]), and Jaccard score of 0.89 (95% CI [0.80, 0.98], 99% CI [0.74, 1.00]).
Conclusion: This pilot work has demonstrated the ability of AI-based workflow using DL-CNNs to specifically identify breast cancer tissue as determined by [18F]FDG avidity in a PET/CT study. The high sensitivity and specificity of the network supports the idea that AI can be trained to recognize specific tissue signatures, both normal and disease, in molecular imaging studies using radiopharmaceuticals. Future work will explore the applicability of these techniques to other disease types and alternative radiotracers, as well as explore the accuracy of fully automated and quantitative detection and response assessment.
The application of deep learning (DL)-based artificial intelligence (AI) as a tool for automated interpretation of radiologic images is a fast-growing area of investigation (1, 2). However, many of these efforts have been focused on the application of AI to identify structural elements (either normal or abnormal anatomy) in computed tomography (CT) or magnetic resonance imaging (MRI) (3–7). Within the field of molecular imaging, the application of AI for advancing image acquisition and reconstruction (8–10), attenuation correction methods (8, 11), and lesion identification (8, 12, 13) are areas of active research.
Here we are expanding upon our earlier work (12) to investigate how DL-based AI may enhance automatic segmentation and classification of tissue based on location and avidity levels in 2-deoxy-2-[18F]fluoro-D-glucose ([18F]FDG) positron emission tomography (PET)/CT studies, with a specific focus on the detection of breast cancer.
Our approach utilizes a convolutional neural network (CNN) as the underlying DL engine. CNNs consist of an input layer (the source images, such as our PET/CT images), an output layer (a pixel classification map), and one or more ‘hidden’ layers connecting the two. Hidden layers are composed of interconnected ‘perceptrons’ (algorithms that decide if an input, or inputs, belong to a specific class) that provide connectivity between the different nodes in the network, essentially constructing a very high number of computational paths between an input image pixel and the output classifier pixel. They are called ‘convolutional’ networks when a convolutional operation is performed in at least one or more of the hidden layers. The network can be trained to classify specific pixels in an image if provided with enough input images that are paired with ‘ground truth’ classification data by iteratively adjusting the weights used by each perceptron until the system achieves a pre-determined level of accuracy predicting the provided ‘ground truth’ classifications.
It is our hypothesis that a workflow (Figure 1) that synthesizes existing standards-based techniques for data processing with an appropriately architected CNN can result in an AI system capable of clinical-level performance. We tested this hypothesis on breast cancer for this initial study based on the availability of a diverse collection of prospectively acquired imaging from two separate multi-institutional clinical trials.
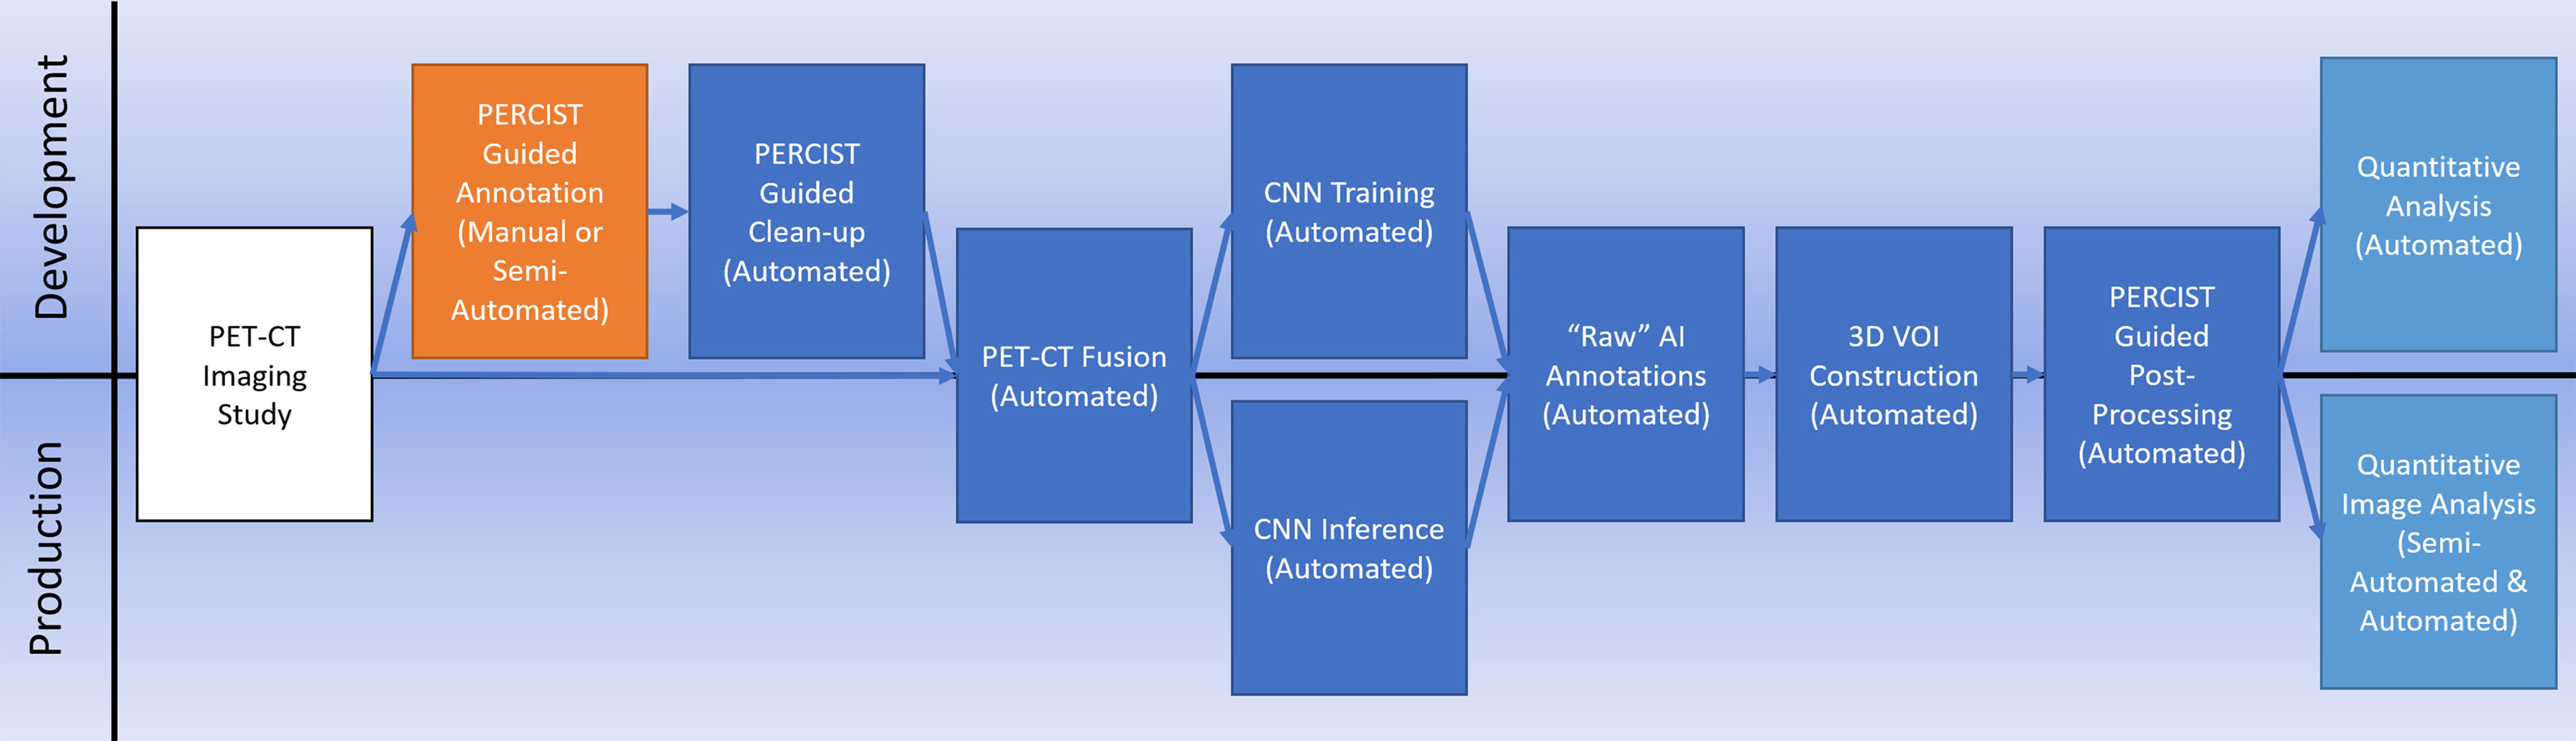
Figure 1 Our AI processing workflow illustrating both training and production pipelines.
For this study we used baseline [18F]FDG PET/CT imaging exams acquired as part of two separate multi-institutional clinical trials of patients with breast cancer. The first was TBCRC 008 (NCT00616967) (14), which examined the rate of complete response when using chemotherapy vs chemotherapy + vorinostat in cases of HER2-negative breast cancer. The second was TBCRC 026 (NCT01937117) (15), a trial that examined early changes in PET standardized uptake values corrected for lean body mass (SUL) as predictors of pathologic complete response in cases of HER2-positive breast cancer when treated with pertuzumab and trastuzumab. Although representing different clinical patient cohorts, this study only used the baseline PET studies, which were similar radiological cohorts. The patient characteristics for each study were similar [Table 1]. Only those patients from each study for which their PET/CT scans met technical requirements of uniformity in acquisition and who were able to undergo both the baseline and follow-up imaging were included in our study, resulting in a total of 130 cases total.
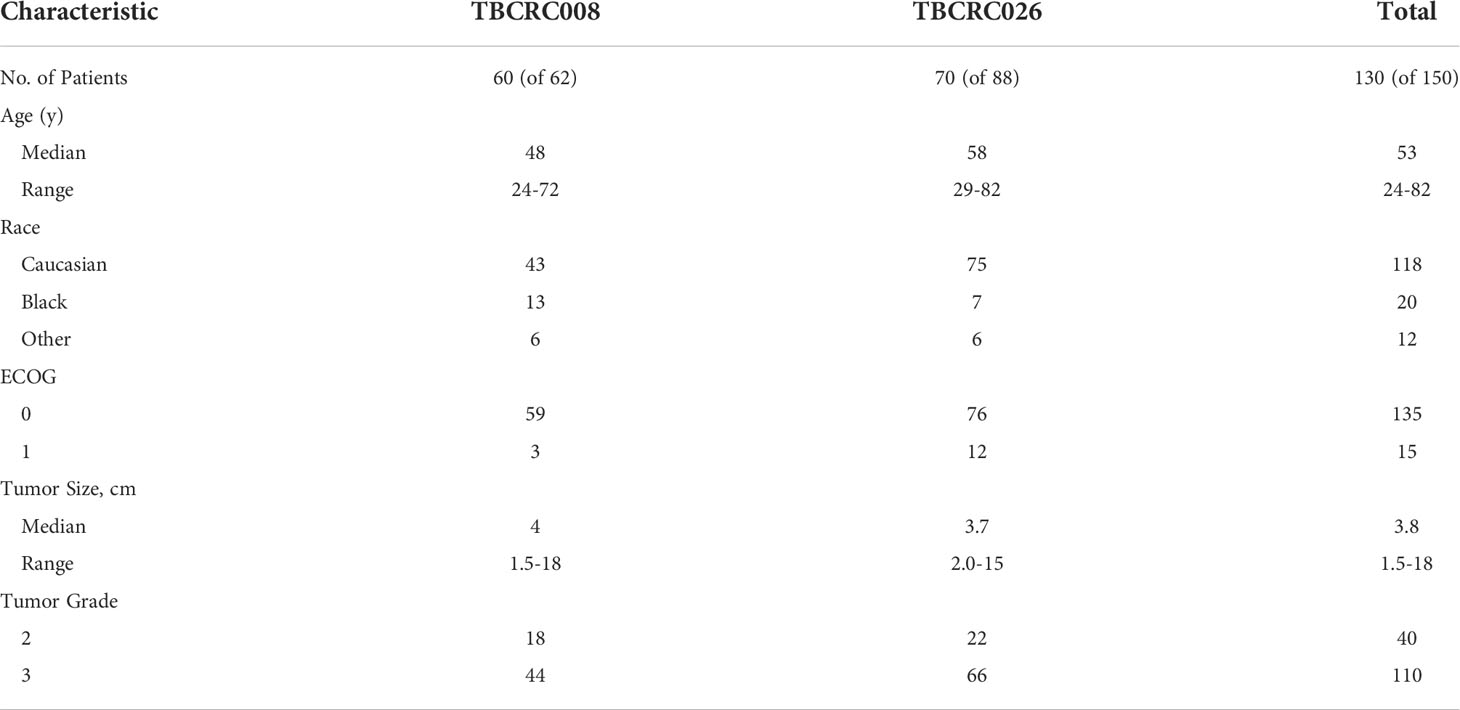
Table 1 Demographic and disease characteristics of patients included in this study.
A notable characteristic of this dataset was its multi-institutional sourcing. Images were obtained from 11 different institutions and were acquired on 8 different PET/CT scanners from 3 different manufacturers.
We used an HP G4 Z4 workstation equipped with a Zeon processor, 128 GB RAM, and an Nvidia A6000 GPU. For the neural network we used MATLAB (16) as well as in-house developed software (17, 18) using Java.
Preparation of the PET/CT image data and corresponding voxel classification maps was a multi-step process. The first step involved the generation of the initial training annotations and for this we used our in-house developed Auto-PERCIST (17) software. This software automates the mechanics of PERCIST v1.0 (19) analysis by transforming PET data into SUL and then calculating a global PERCIST baseline assessment threshold based on an automated measurement sampled from the liver for use as a global segmentation threshold. PERCIST v1.0 defines this baseline assessment threshold (19) as:
Equation 1 Baseline Assessment Threshold
All clusters of 7 or more connected voxels above that threshold were then automatically segmented and manually classified by a trained nuclear medicine physician to one of the tissue classes. A body contour was automatically generated using a partitioning threshold of 0.1 SUL. Voxels within the contour that were not otherwise classified were assigned the class of Nominal, with voxels outside the contour assigned the class Background. The auto-located 3 cm3 spherical Liver Volume of Interest (VOI) was assigned the class of Reference, which served as a proxy for the liver, although the liver’s avidity, by definition, was primarily below the threshold for segmentation [Figure 2] and, thus, not anatomically represented by the VOI.
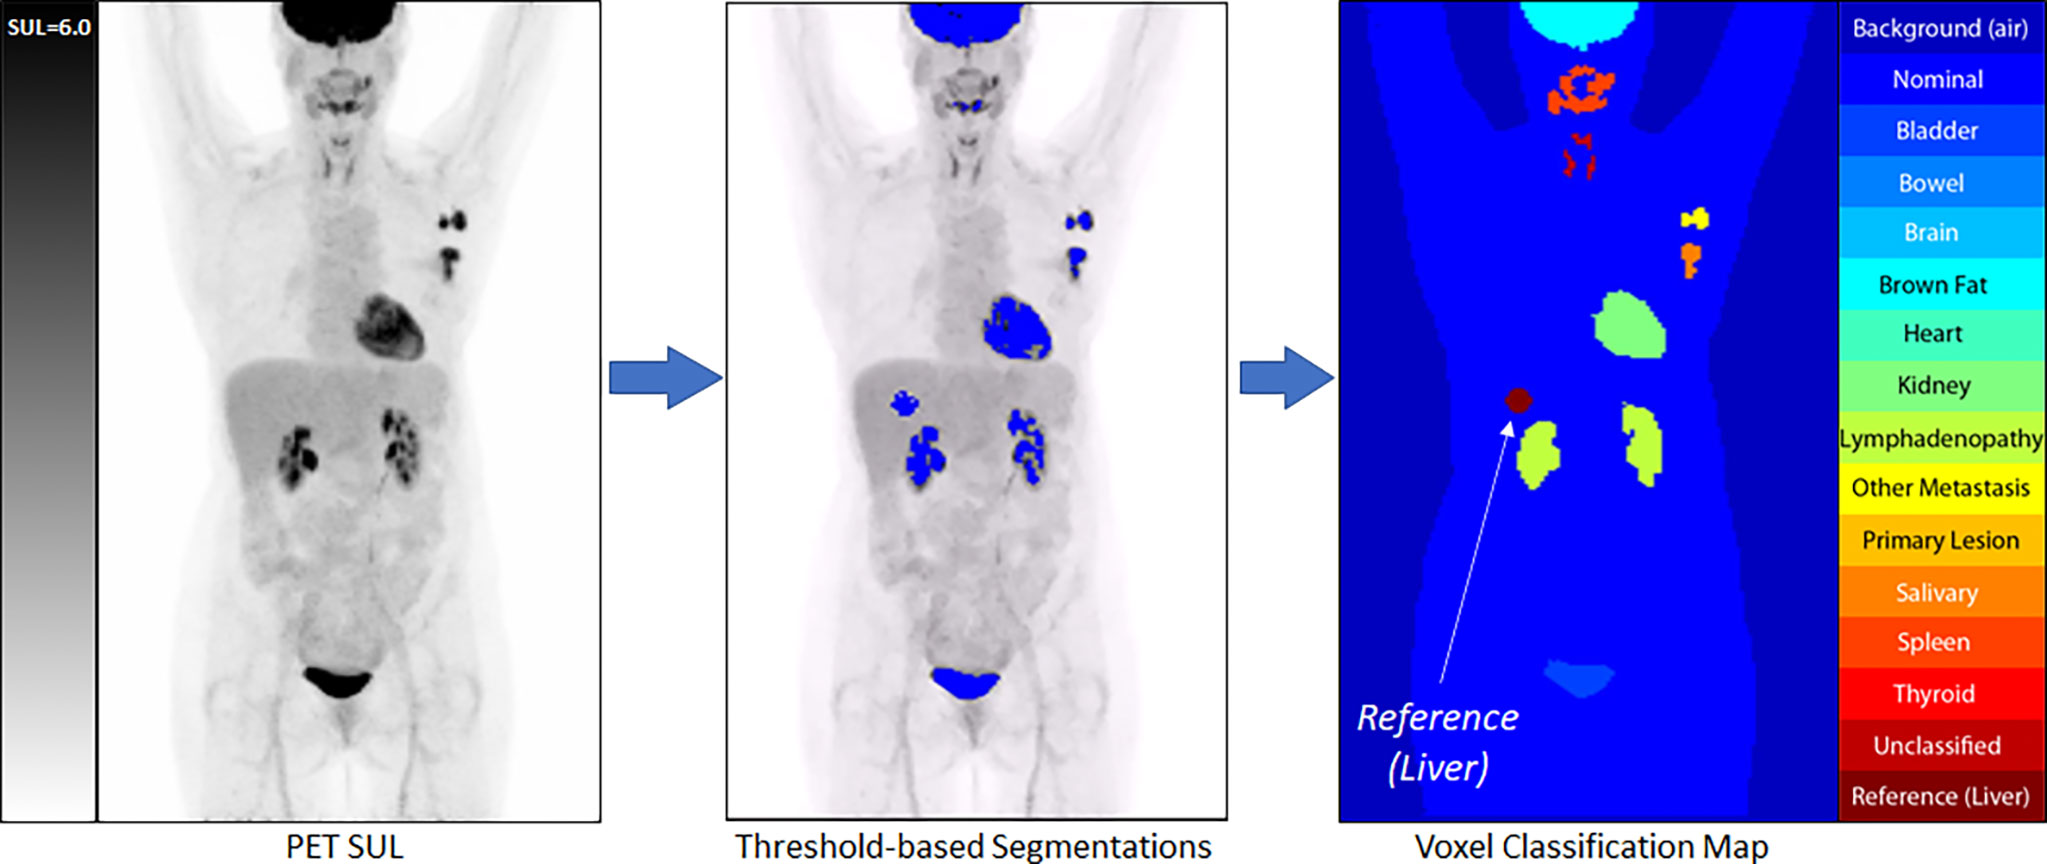
Figure 2 An example of our semi-automated threshold-based segmentation algorithm for the generation of training data.
With all PET voxels now assigned to a class, the matched PET, CT (re-sampled to match the PET images), and voxel classification images were exported as co-registered and voxel matched DICOM files. Each imaging study was then re-sampled in 3D to have isotropic voxels measuring 3.5 mm, and the transaxial image slices were center cropped to a final size of 128 x 128 voxels. These data were then re-processed using an automated data cleaning routine in which the PET component was filtered with a 3D spherical smoothing filter measuring 1 cm3 to reduce image noise. The Reference class voxels were then re-sampled, and a new reference mean and standard deviation were calculated. From these, a Reference Threshold was calculated.
Equation 2 Reference Threshold
Using the Reference threshold, the Reference region was allowed to grow into the pool of adjacent voxels which were equal to or greater than the threshold and not otherwise classified (Nominal voxels only). After each iteration of Reference region growth, the pool of eligible voxels was commensurately ‘shrunk’ by 1 voxel, constraining the pool of voxels eligible for Reference growth during the next growth cycle. This technique, which we called ‘Round-Robin’ region growing, provided a self-limiting constraint to region growth and allowed the Reference region to grow into a more anatomically correct configuration while minimizing the opportunity for growth beyond the anatomic boundary.
Once Reference region growth self-terminated, a new Reference (Liver) mean and standard deviation was measured, and a new tissue threshold was calculated using the PERCIST Follow-up assessment threshold (19).
Equation 3 Follow-Up Assessment Threshold
Using this new, slightly lower threshold than the one originally used, specific tissue classes were allowed to automatically grow into eligible (Nominal) adjacent voxels using the ‘Round-Robin’ approach used in the auto-growing of the Reference sample. As with the Reference region, the purpose of this second round of region growing was to allow the higher avidity-based segmentations to grow into the contour of their anatomy more closely. Once the annotation growing self-terminated, the corresponding PET, CT, and newly generated tissue annotations were exported for use in network training.
The PET data were exported in SUL units multiplied by 100 (e.g., a voxel with a value of 3.27 SUL was encoded in the training image as 327). The CT data were exported in Hounsfield (HU) units offset to a base value of ‘0’. Corresponding PET and CT transaxial slices were then concatenated into a single multi-channel 2D matrix and exported as a binary file for use in network training. The corresponding tissue annotations were exported as 8-bit indexed PNG format files. All files representing the same transaxial slice shared the same filename.
Of note, not every study contained voxels from every tissue class, as not every tissue (e.g., Brown_Fat) was present or expressed adequate avidity (e.g., Heart) in every study to be identified by the threshold-based method. In addition, the system was designed to process and learn from 2D transaxial plane images, so individual images used in the training could contain as few as two classes (Background and Nominal), or more [Figure 3].
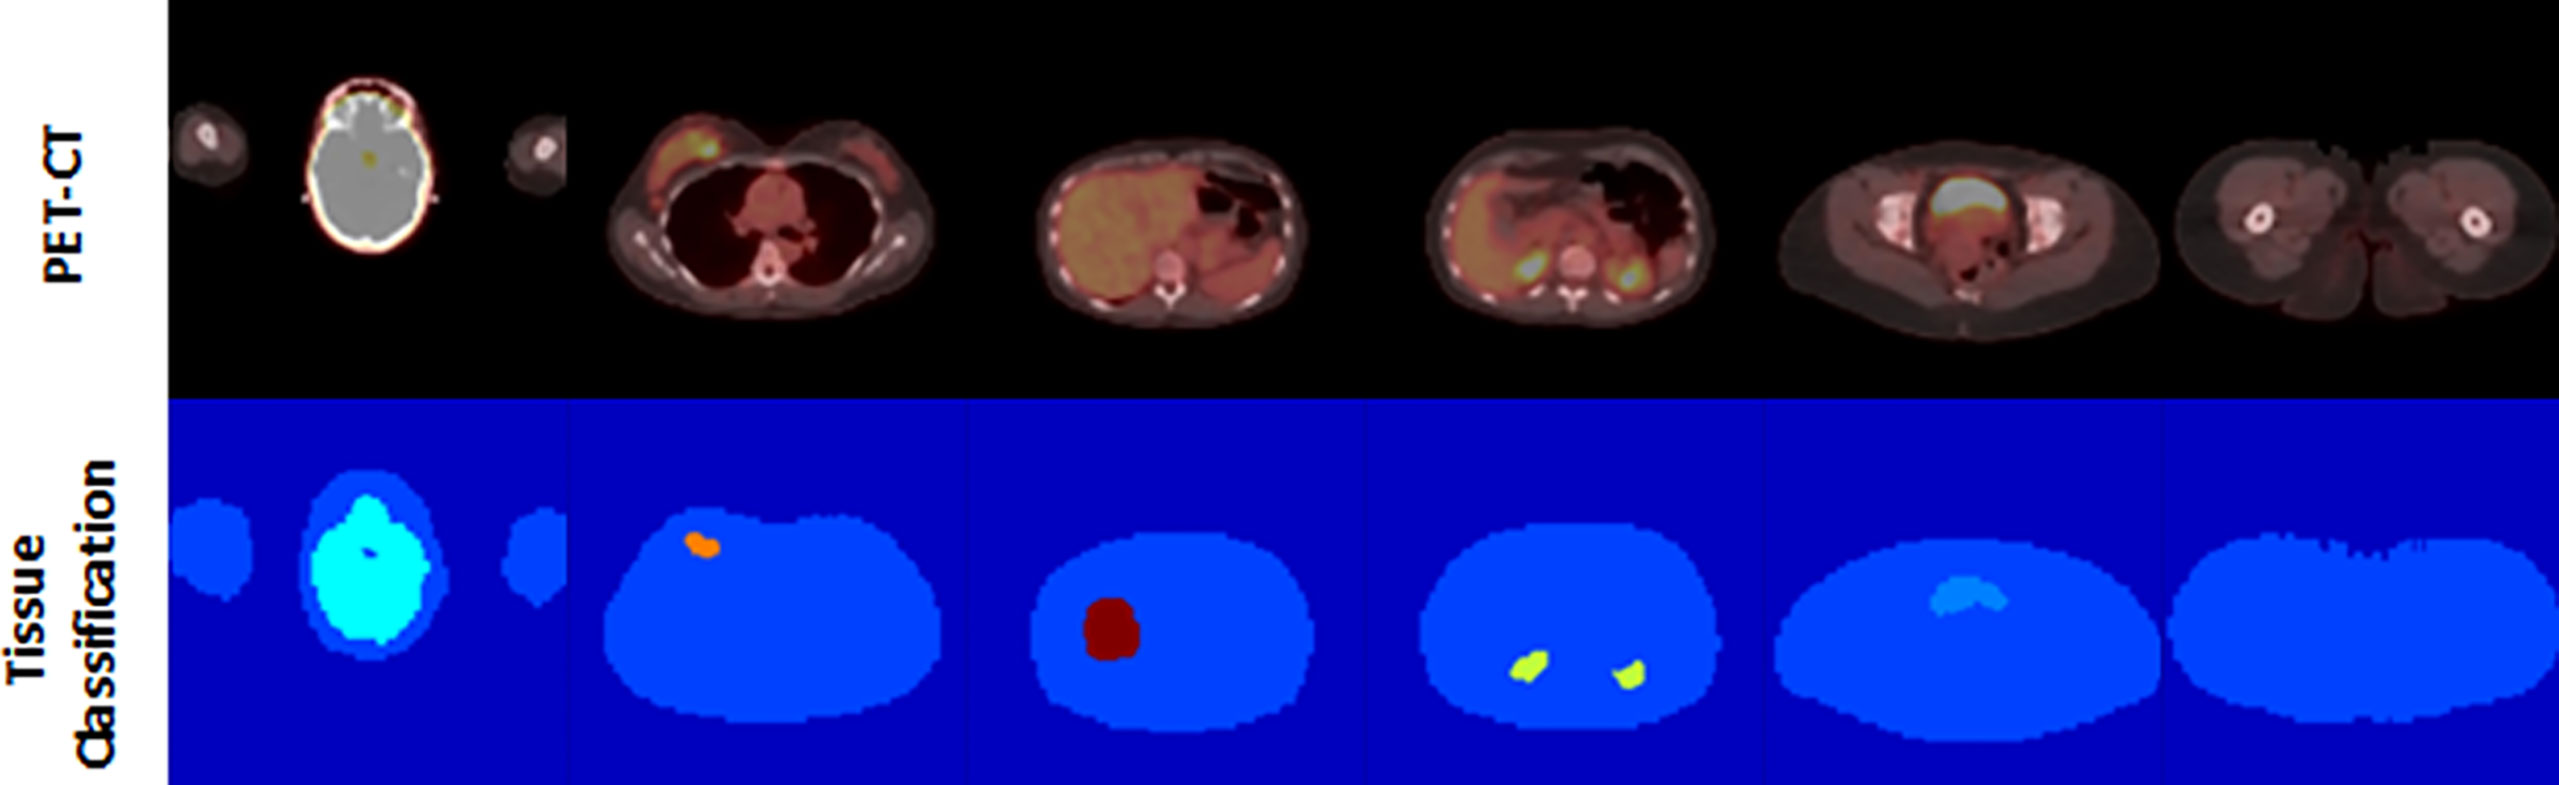
Figure 3 Example of PET/CT and tissue classification map pairings.
The assignment of voxels to tissue classes was not uniformly distributed throughout the training set, with the number of voxels assigned to Background and Nominal far outweighing the number assigned to the segmented organs and lesions. To remedy this imbalance, class weights were calculated based on the total number of voxels in each class versus the entire training set, and their reciprocal values applied as weights during training. These weights were then use by the loss function of network when performing final pixel classification.
Our CNN architecture [Figure 4] was modelled after a 2-dimensional (transaxial slice-based) multi-resolution U-Net (20). The network utilized 4 down-sampling layers [Figure 4B], and 4 up-sampling layers [Figure 4C]. The input layer had spatial dimension of 128 x 128 and a channel depth of 2, incorporating the PET and CT slices. The initial feature set size was 128. Each subsequent layer was reduced in spatial dimension by a factor of 2, while its feature size was increased by a factor of 2, until a bottleneck layer of size 8 x 8 x 2 x 2048 was achieved. We followed each convolutional layer with a pair of batch normalization and ReLu activation layers [Figure 4A]. The last layers of the network used a 1 x 1 convolutional layer with a reduction to 16 features, corresponding to our 16 tissue classes. This was followed by a batch normalization, SoftMax, and final pixel classification layer which used a class-weighted cross-entropy loss function.

Figure 4 Our CNN Multi-Resolution Architecture, with details of the core Convolutional Layer (A), the Down-Sampling Layer (B). and the Up-Sampling Layer (C) Multi-Resolution Compound Structures.
As previously described, a total of 130 baseline PET/CT imaging studies were utilized. A study-level K-Folds (K=5) validation strategy was followed for training, validation, and testing of our network architecture. This resulted in five separate training/validation/testing sets composed of 104/13/13 studies each. Using a study-level strategy insured that there was no mixing of same patient image slices between training/validation/testing data sets.
Network training utilized a stochastic gradient descent with momentum (SGDM) solver as well as image augmentation, where in-plane image translation of ± 5 pixels, in-plane image rotation of ± 10 degrees, and image scaling between 50% to 200% of the original size were each independently and randomly employed for each image during each training epoch.
The raw results obtained running the test data through the trained CNN were processed in a fully automated manner, not unlike the fully automated processing of the training data. The AI-generated annotations were first reconstructed in 3D. The Reference annotations were projected onto the PET image data and the mean and standard deviation were measured. A threshold was calculated using the follow-up assessment formula [Equation 3], and each tissue annotation was then cleared of voxels that were not equal to or greater than this threshold, with those voxels reassigned to the Nominal class. VOIs of the remaining annotated voxels were generated, and quantitative analysis of the resulting structures was performed.
The performance of our workflow was assessed at both the network level as well as the individual study level. At the network level, we calculated the confusion matrices for each K-Fold run. With the Lymphadenopathy class occurring in the training set at an average frequency of one-fifteenth the rate of the Primary_Lesion class, and both classes representing disease, we calculated the confusion matrices with the Primary_Lesion and Lymphadenopathy pooled into a single class, henceforth referred to as the Disease class.
At the study level, we calculated performance metrics for the automated detection of the aggregate Disease class. Metrics include Dice and Jaccard scores (measures of similarity to the ground truth), as well as a comparison of the measured SUL-Max.
Our network-level evaluation calculated performance metrics at the voxel level. The confusion matrices for each K-Fold session were assembled, with the True Positive (TP), False Positive (FP), True Negative (TN), and False Negative (FN) voxel classifications counted, and global performance metrics for each K-Fold calculated. This was performed on the raw CNN results, the raw auto-post-processed annotations, and again after pooling the Primary_Lesion and Lymphadenopathy classes into a single Disease class. Focusing on the post-processed results using the pooled Disease class, we calculated the mean values across the 5 K-Folds for the Sensitivity, Specificity, DICE, and Jaccard scores [Table 2] for each tissue class.
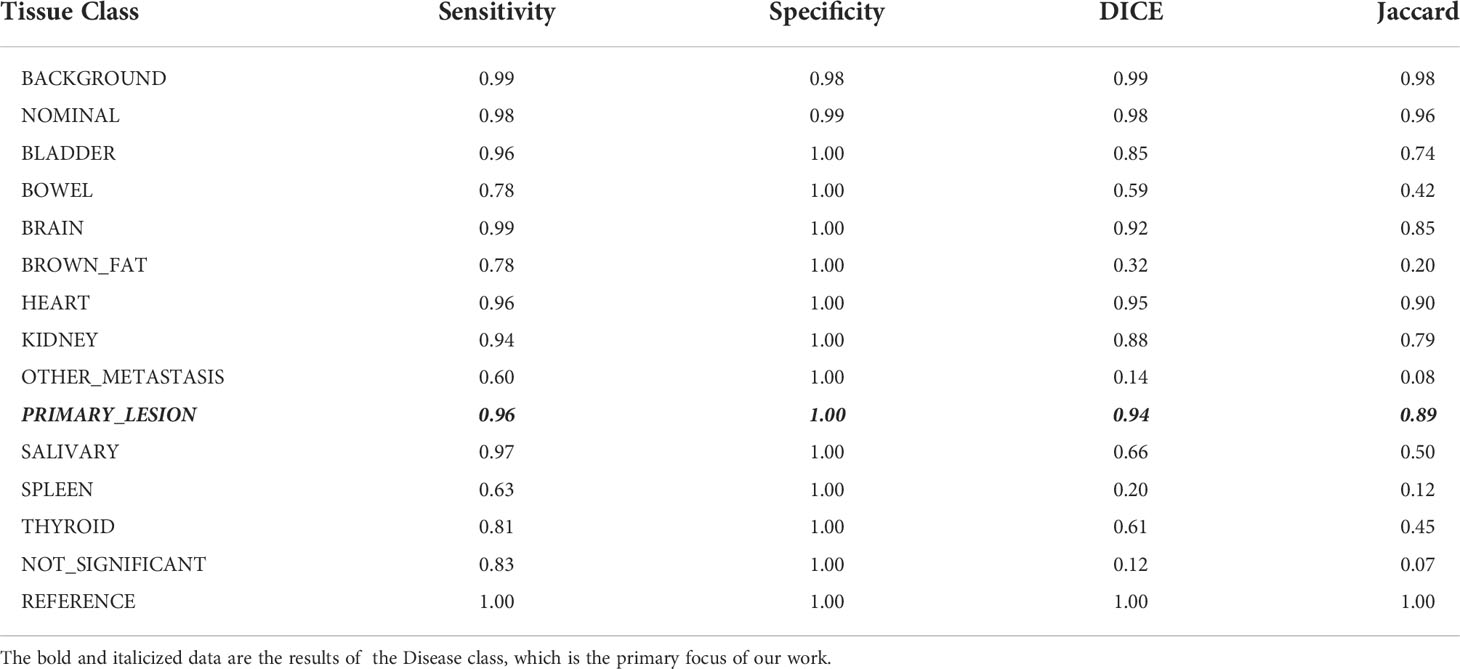
Table 2 Tissue specific performance metrics of the workflow in detecting and segmenting disease lesions in test studies averaged over all K-folds.
For the study-wise evaluation, each PET/CT study in the test set was separately analyzed for 3D DICE, Jaccard scores, and percent of difference in SUL-Max (%ΔSUL↑) for the Disease class only using the auto-post-processed results across each K-Fold. Representative examples illustrating “Truth” vs “AI” detections are presented here [Figure 5].
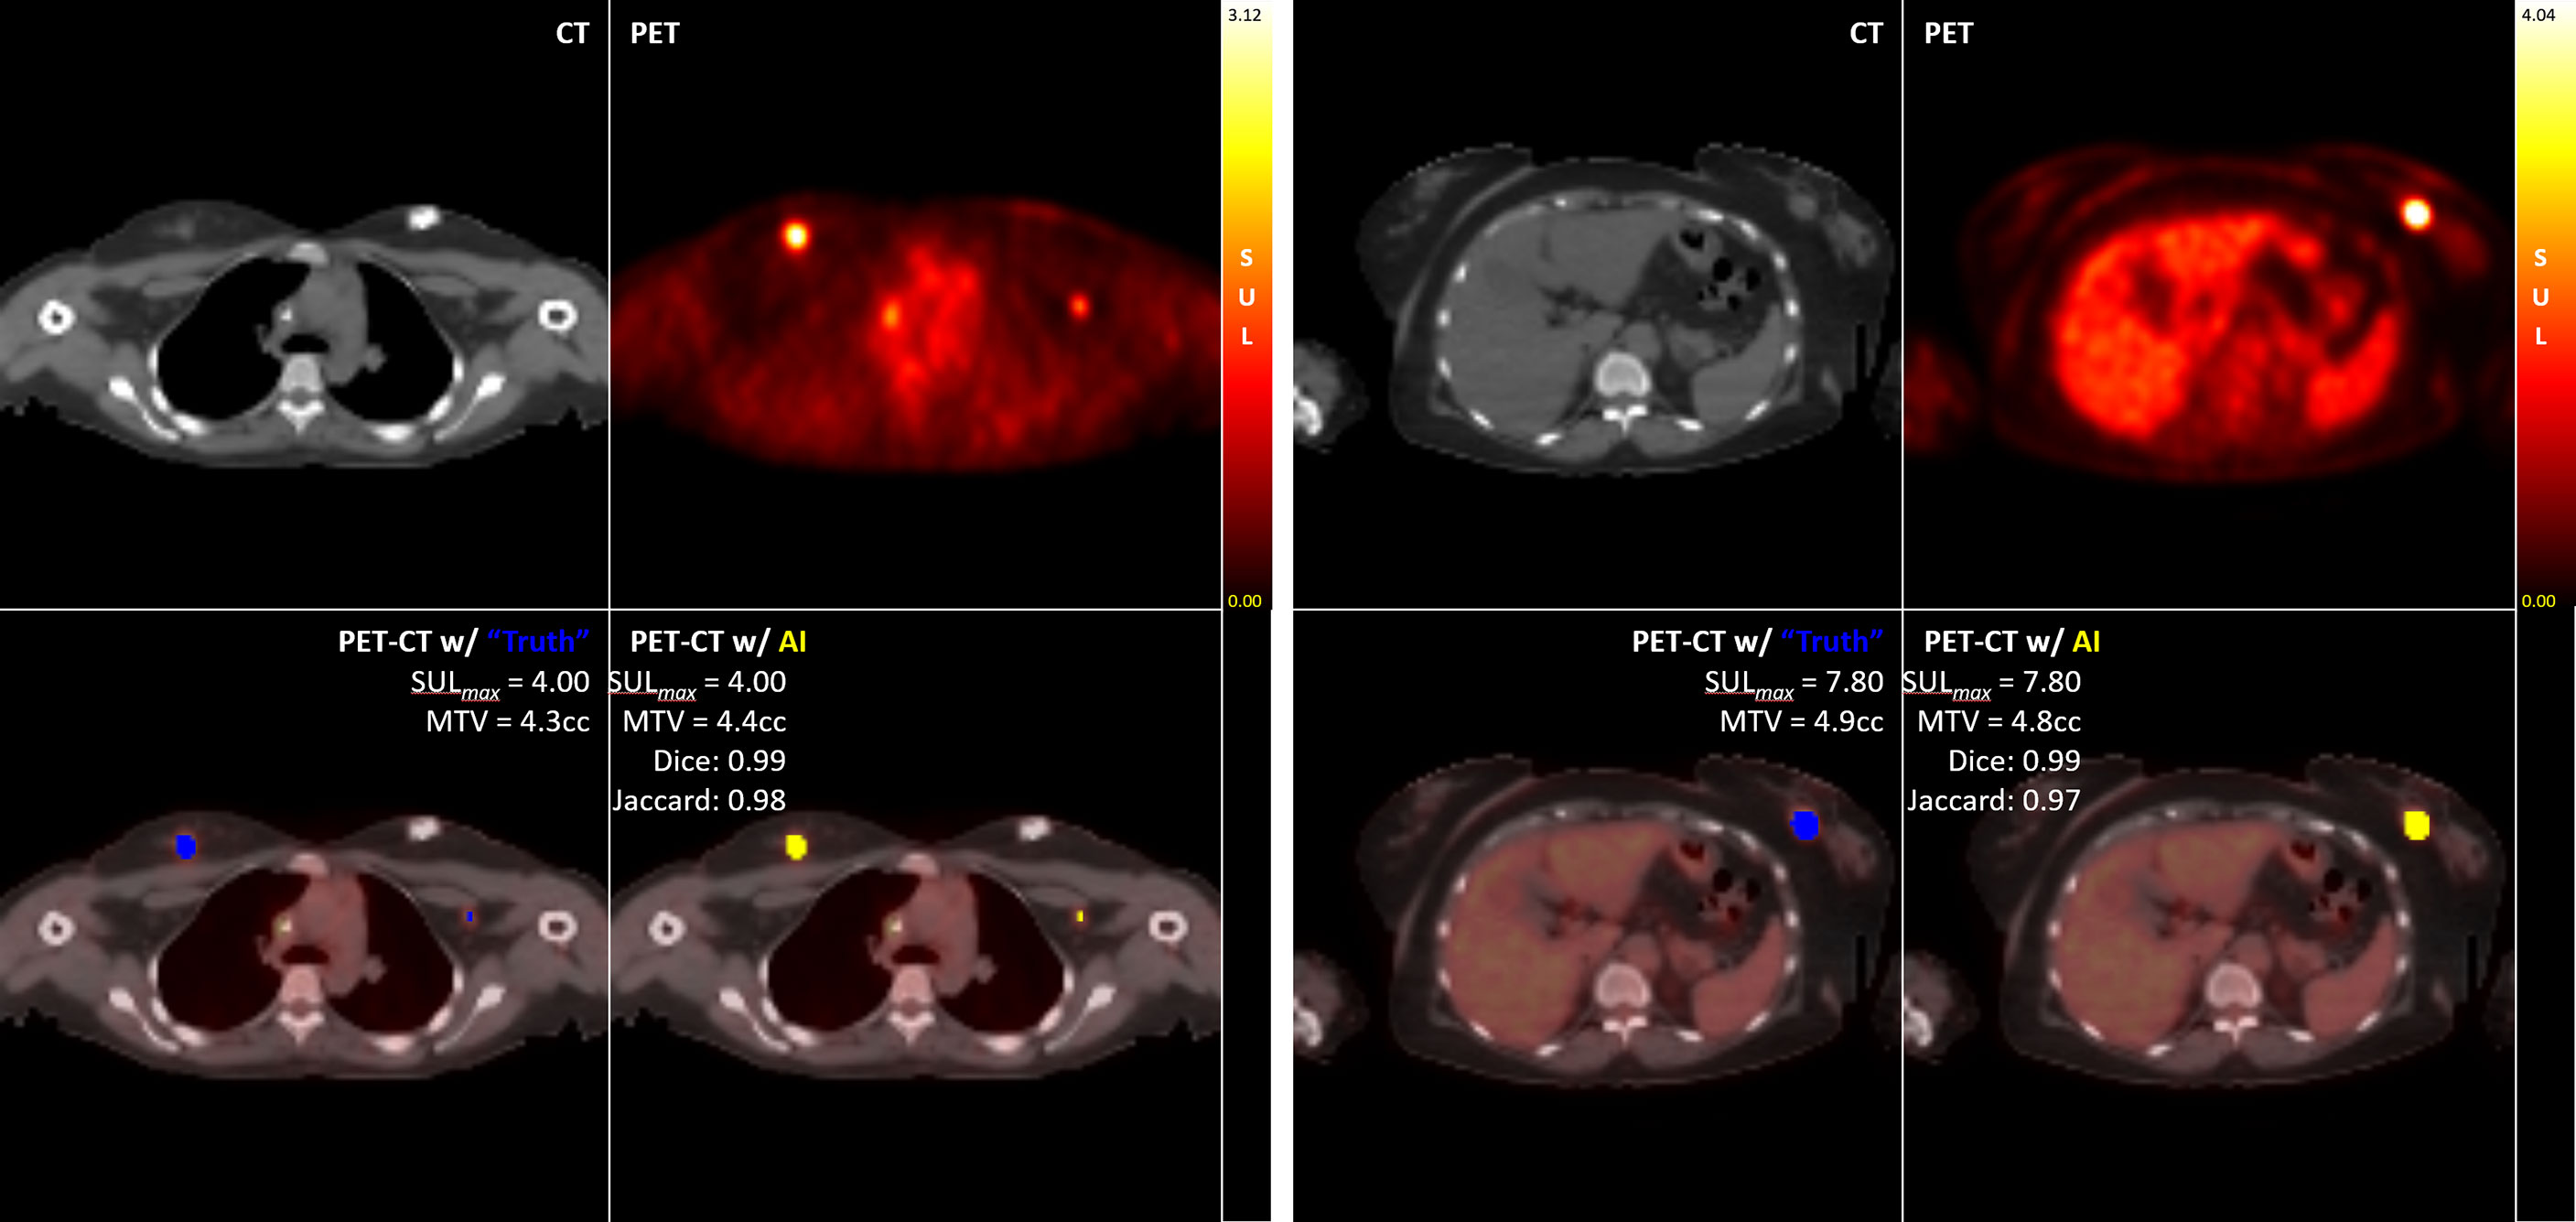
Figure 5 Examples of “Truth” vs “AI” detections and quantification of disease in two test cases.
Of the 65 total test cases (13 cases across 5 K-Folds), 4 cases failed to detect any Disease, which concurred with the case specific Ground Truth (no disease identified at the study-specific threshold). In addition, 2 other cases detected disease where Ground Truth failed. These 6 cases were independently reviewed by experienced nuclear medicine physicians, and the AI results were determined to accurately reflect the expected outcome of a typical, manually performed clinical review. For our analysis, we first calculated the DICE, Jaccard, and %ΔSUL↑ performance metrics by removing the studies with incalculable scores (‘CLEANED’) [Table 3], then again by replacing the incalculable scores with perfect scores for that metric (a value of ‘1.0’ for DICE and Jaccard scores, a value of ‘0%’ for the %ΔSUL↑) (‘CORRECTED’) [Table 4].
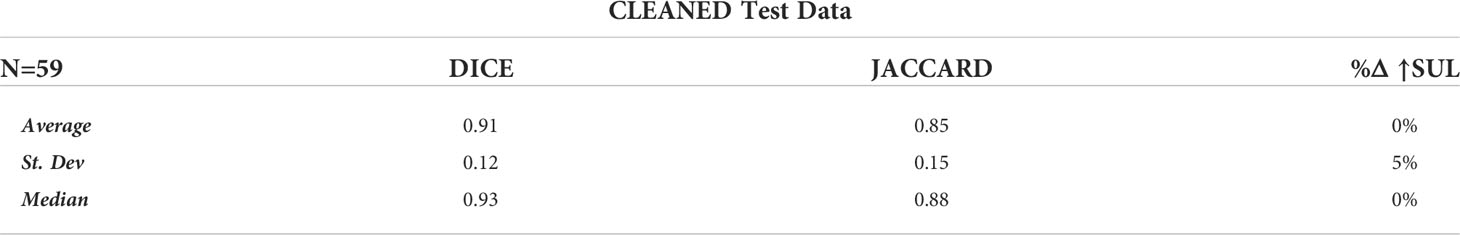
Table 3 Performance metrics for test data with non-scorable studies removed.
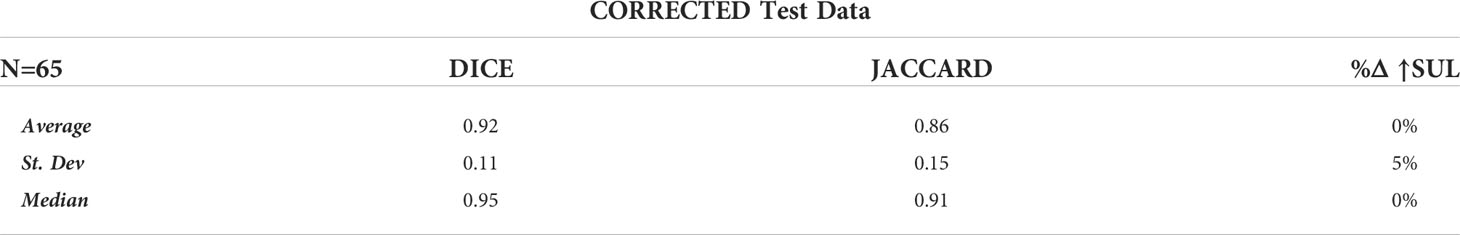
Table 4 Performance metrics for test data with non-scorable studies assigned perfect scores.
Artificial intelligence is increasingly playing a significant role in image analysis within the field of radiology (1). Many are building systems that can assist and augment radiologic interpretations (2). [18F]FDG PET/CT plays a significant role in detection and management of a variety of oncologic abnormalities (21). Breast cancer is often FDG-avid on PET/CT and is a leading cause of cancer and cancer-related mortality in women (22). While studies have shown that [18F]FDG PET/CT is not effective in the evaluation of local disease, it plays a significant role in the management of patients with locally advanced disease and inflammatory carcinoma (23). Patients with clinical stage IIB disease (T2N1/T3N0) or higher may also benefit from evaluation by [18F]FDG PET/CT (24). Finally, quantification by [18F]FDG uptake on PET/CT after initiating therapy may identify responders from non-responders early, allowing new therapies to be pursued for those non-responders (15, 19). AI-augmented analysis of PET examinations may, in addition to aiding radiologic detection and therapeutic monitoring, provide additional data that may not be discernable from qualitative analysis but that can direct therapeutic regimens for individual patients.
As evidenced by the results, our AI-based framework had a high rate of voxel-wise accuracy at classifying most FDG avidity. In the evaluation of the test data, conducted by trained readers, it demonstrated very high sensitivity and specificity at identifying avidity associated with breast cancer.
The performance of this framework was achieved utilizing traditional, standards-based image processing in concert with the DL-CNN. The combination of these methods, along with a heterogeneous training dataset, achieved a level of automated performance that neither method on its own could, especially considering the relatively low number of studies and samples per class used (25) (26). The PERCIST v1.0 framework provided an objective methodology for the generation of training data as well as the post-processing refinement of the AI-generated classifications. The DL-CNN provided the classification key that was necessary for automated analysis.
This pilot work has demonstrated the ability of an AI-based workflow, incorporating standards-based data processing paired with DL-CNNs, to specifically identify malignant breast tissue as demonstrated by [18F]FDG avidity in a PET/CT study. This supports the idea that AI can be trained to recognize specific tissue signatures in molecular imaging studies using radiopharmaceuticals. Future work will explore the applicability of these techniques to other disease types and alternative radiotracers, as well as explore the accuracy of fully automated quantitative analysis and response assessment.
The data analyzed in this study is subject to the following licenses/restrictions: Access to datasets for this study will be considered for serious researchers upon reasonable request. Requests to access these datasets should be directed to amxlYWwxQGpobWkuZWR1.
The studies involving human participants were reviewed and approved by Johns Hopkins Institutional Review Board. The patients/participants provided their written informed consent to participate in this study.
JL, SR, MP, and LS contributed to conception and design of the study. JL and LS performed the analysis. JL, VS, RC, CV, ML, AS, and RW collected the data. JL wrote the first draft of the manuscript. SR and LS wrote sections of the manuscript. All authors contributed to the article and approved the submitted version.
The authors wish to acknowledge the following for their support of this work: National Institutes of Health/National Cancer Institute P30CA006973, the National Institutes of Health/National Cancer Institute U01-CA140204, the Translational Breast Cancer Research Consortium, the funding support to the TBCRC from the AVON Foundation, The Breast Cancer Research Foundation, and Susan G. Komen, and the Nvidia Corporation GPU Grant Program.
The authors wish to acknowledge the following for their support of this work: National Institutes of Health/National Cancer Institute P30CA006973 the National Institutes of Health/National Cancer Institute U01-CA140204, the Translational Breast Cancer Research Consortium, the funding support to the TBCRC from the AVON Foundation, The Breast Cancer Research Foundation, and Susan G. Komen, and the Nvidia Corporation GPU Grant Program.
JL and SR are consultants of PlenaryAI. MP is a co-founder of PlenaryAI.
The remaining authors declare that the research was conducted in the absence of any commercial or financial relationships that could be construed as a potential conflict of interest.
All claims expressed in this article are solely those of the authors and do not necessarily represent those of their affiliated organizations, or those of the publisher, the editors and the reviewers. Any product that may be evaluated in this article, or claim that may be made by its manufacturer, is not guaranteed or endorsed by the publisher.
1. Hosny A, Parmar C, Quackenbush J, Schwartz LH, Aerts HJ. Artificial intelligence in radiology. Nat Rev Cancer (2018) 18:500–10. doi: 10.1038/s41568-018-0016-5
2. Liew C. The future of radiology augmented with artificial intelligence: A strategy for success. Eur J Radiol (2018) 102:152–6. doi: 10.1016/j.ejrad.2018.03.019
3. Barbosa EJM Jr., Lanclus M, Vos W, Holsbeke CV, De Backer W, De Backer J, et al. Machine learning algorithms utilizing quantitative CT features may predict eventual onset of bronchiolitus obliterans syndrom after lung transplantation. Acad Radiol (2018) 25:1201–12. doi: 10.1016/j.acra.2018.01.013
4. Küstner T, Gatidis S, Liebgott A, Schwartz M, Mauch L, Martirosian P, et al. A machine-learning framework for automatic reference-free quality assessment in MRI. Magnet Reson Imaging (2018) 53:134–47. doi: 10.1016/j.mri.2018.07.003
5. Prevedello LM, Erdal BS, Ryu JL, Little KJ, Demirer M, Qian S, et al. Automated critical test findings identification and online notificiation system using artificial intelligence in imaging. Radiology (2017) 285(3):923–31. doi: 10.1148/radiol.2017162664
6. Lugo-Fagundo C, Vogelstein B, Yuille A, Fishman E. Deep learning in radiology: Now the real work begins. J Am Coll Radiol (2018) 15:364–7. doi: 10.1016/j.jacr.2017.08.007
7. Chu LC, Park S, Kawamoto S, Wang Y, Zhou Y, Shen W, et al. Application of deep learning to pancreatic cancer detection: Lessons learned from our initial experience. J Am Coll Radiol (2019) 16:1338–42. doi: 10.1016/j.jacr.2019.05.034
8. Duffy IR, Boyle AJ, Vasdev N. Improving PET imaging acquisition and analysis with machine learning: A narrative review with focus on alzheimer's disease and oncology. Mol Imaging (2019) 18:1–11. doi: 10.1177/1536012119869070
9. Peng P, Judenhofer MS, Jones AQ, Cherry SR. Compton PET: a simulation study for a PET module with novel geometry and machine learning for position decoding. Biomed Phys Eng Express (2019) 5(1):015018. doi: 10.1088/2057-1976/aaef03
10. Gong K, Berg E, Cherry SR, Qi J. (2019). Machine learning in PET: From photon detection to quantitative image reconstruction. In: Proceedings of the IEEE; vol. 108, no. 1. (2020). p. 51-68. doi: 10.1109/JPROC.2019.2936809
11. Yang X, Wang T, Lei Y, Higgins K, Liu T, Shim H, et al. MRI-Based attenuation correct for brain PET/MRI based on anatomic signature and machine learning. Phys Med Biol (2019) 64(2):025001. doi: 10.1088/1361-6560/aaf5e0
12. Sadaghiani MS, Solnes L, Leal J. Experience with machine learning to detect breast CA and other tissue in PET/CT. J Nucl Med (2019) 60:1209.
13. Perk T, Bradshaw T, Chen S, H.-j. Im S, Perlman S, Liu G, et al. Automated classification of benign and malignant lesions in 18F-NaF PET-CT images using machine learning. Phys Med Biol (2018) 63:22. doi: 10.1088/1361-6560/aaebd0
14. Connolly RM, Leal JP, Goetz MP, Zhang Z, Zhou XC, Jacobs LK, et al. TBCRC 008: Early changes in 18F-FDG uptake in PET predicts response to preoperative systemic therapy in human epidermal growth factor receptor 2-negative primary operable breast cancer. J Nucl Med (2015) 56:31–7. doi: 10.2967/jnumed.114.144741
15. Connolly RM, Leal JP, Solnes L, Huang C-Y, Carpenter A, Gaffney K, et al. TBCRC026: Phase II trial correlating standardized uptake value with pathologic complete response to pertuzumab and trastuzumab in breast cancer. J Clin Oncol (2019) 37:714–22. doi: 10.1200/JCO.2018.78.7986
17. Leal J, Wahl R. Auto-PERCIST: Semi-automated response assessment of FDG-PET based on PERCIST 1.0 and other criteria. J Nucl Med (2015) 56(Suppl 3): 1913.
18. Rowe SP, Solnes LB, Yin Y, Kitchen G, Lodge MA, Karakatsanis NA, et al. Imager-4D: New software for viewing dynamic PET scans and extracting radiomic parameters from PET data. J Digital Imaging (2019) 32:1071–80. doi: 10.1007/s10278-019-00255-7
19. Wahl RL, Jacene H, Kasamon Y, Lodge MA. From RECIST to PERCIST: Evolving considerations for PET response criteria in solid tumors. J Nucl Med (2009) 50(Suppl 1):122S–50S. doi: 10.2967/jnumed.108.057307
20. Ibtehaz N, Rahman MS. MultiResNet: Rethinking the U-net architecture for multimodal biomedical image segmentation. Neural Networks (2020) 121:74–87. doi: 10.1016/j.neunet.2019.08.025
21. Zhu A, Lee D, Shim H. Metabolic PET imaging in cancer detection and therapy response. Semin Oncol (2010) 38:55–69. doi: 10.1053/j.seminoncol.2010.11.012
22. U.S. Department of Health and Human Services. Breast cancer statistics. In: Centers for disease control and prevention. Atlanta, Georgia: U.S. Department of Health & Human Services, Centers for Disease Control and Prevention (2022). Available at: https://www.cdc.gov/cancer/breast/statistics/index.htm.
23. Groheux D, Espié M, Giacchetti S, Hindié E. Performance of FDG PET/CT in the clinical management of breast cancer. Radiology (2013) 266:388–405. doi: 10.1148/radiol.12110853
24. Groheux D, Hindié E, Delord M. Prognostic impact of 18F-FDG PET-CT findings in clinical stage III and IIB breast cancer. J Natl Cancer Inst (2012) 104:1879–87. doi: 10.1093/jnci/djs451
25. Schnack HG, Kahn RS. Detecting neuroimaging biomarkers for psychiatric disorders: Sample size matters. Front Psychiatry (2016) 7. doi: 10.3389/fpsyt.2016.00050
Keywords: artificial intelligence, machine learning, deep learning, PERCIST v1.0, breast cancer
Citation: Leal JP, Rowe SP, Stearns V, Connolly RM, Vaklavas C, Liu MC, Storniolo AM, Wahl RL, Pomper MG and Solnes LB (2022) Automated lesion detection of breast cancer in [18F] FDG PET/CT using a novel AI-Based workflow. Front. Oncol. 12:1007874. doi: 10.3389/fonc.2022.1007874
Received: 31 July 2022; Accepted: 20 October 2022;
Published: 15 November 2022.
Edited by:
Annarita Fanizzi, National Cancer Institute Foundation (IRCCS), ItalyReviewed by:
Xiangxi Meng, Beijing Cancer Hospital, Peking University, ChinaCopyright © 2022 Leal, Rowe, Stearns, Connolly, Vaklavas, Liu, Storniolo, Wahl, Pomper and Solnes. This is an open-access article distributed under the terms of the Creative Commons Attribution License (CC BY). The use, distribution or reproduction in other forums is permitted, provided the original author(s) and the copyright owner(s) are credited and that the original publication in this journal is cited, in accordance with accepted academic practice. No use, distribution or reproduction is permitted which does not comply with these terms.
*Correspondence: Steven P. Rowe, c3Jvd2U4QGpobWkuZWR1
Disclaimer: All claims expressed in this article are solely those of the authors and do not necessarily represent those of their affiliated organizations, or those of the publisher, the editors and the reviewers. Any product that may be evaluated in this article or claim that may be made by its manufacturer is not guaranteed or endorsed by the publisher.
Research integrity at Frontiers
Learn more about the work of our research integrity team to safeguard the quality of each article we publish.