
95% of researchers rate our articles as excellent or good
Learn more about the work of our research integrity team to safeguard the quality of each article we publish.
Find out more
ORIGINAL RESEARCH article
Front. Oncol. , 15 December 2022
Sec. Hematologic Malignancies
Volume 12 - 2022 | https://doi.org/10.3389/fonc.2022.1007565
This article is part of the Research Topic Understanding Leukemia Biology Using Genome Editing Techniques View all 6 articles
 Jiamian Zheng1†
 Dan Qiu1,2†Xuan Jiang1†Yun Zhao1Haotian Zhao1Xiaofang Wu1Jie Chen3Jing Lai3‡Wenbin Zhang1Xutong Li4
 Yangqiu Li1*‡
 Xiuli Wu1*‡
 Zhenyi Jin1,5*‡
Problems: γδ T cells are essential for anti-leukemia function in immunotherapy, however, γδ T cells have different functional subsets, including regulatory cell subsets expressing the Foxp3. Whether they are correlated with immune-checkpoint mediated T cell immune dysfunction remains unknown in patients with acute myeloid leukemia (AML).
Methods: In this study, we used RNA-seq data from 167 patients in TCGA dataset to analyze the correlation between PD-1 and FOXP3 genes and these two genes’ association with the prognosis of AML patients. The expression proportion of Foxp3+/PD-1+ cells in γδ T cells and two subgroups Vδ1 and Vδ2 T cells were performed by flow cytometry. The expression level of FOXP3 and PD-1 genes in γδ T cells were sorted from peripheral blood by MACS magnetic cell sorting technique were analyzed by quantitative real-time PCR.
Results: We found that PD-1 gene was positively correlated with FOXP3 gene and highly co-expressed PD-1 and FOXP3 genes were associated with poor overall survival (OS) from TCGA database. Then, we detected a skewed distribution of γδ T cells with increased Vδ1 and decreased Vδ2 T cell subsets in AML. Moreover, significantly higher percentages of PD-1+ γδ, Foxp3+ γδ, and PD-1+Foxp3+ γδ T cells were detected in de novo AML patients compared with healthy individuals. More importantly, AML patients containing higher PD-1+Foxp3+ γδ T cells had lower OS, which might be a potential therapeutic target for leukemia immunotherapy.
Conclusion: A significant increase in the PD-1+Foxp3+ γδ T cell subset in AML was associated with poor clinical outcome, which provides predictive value for the study of AML patients.
Acute myeloid leukemia (AML) is an aggressive hematological malignancy characterized by the accumulation of immature myeloid precursors, ultimately resulting in inhibition of normal hematopoiesis. Although understanding of the classification, molecular mechanism, pathobiology, and genomic landscape of AML has advanced in recent years, the treatment standard has remained upfront induction chemotherapy followed by consolidation chemotherapy or hematopoietic stem cell transplantation (HSCT) (1–4). In addition, there is no regimen that can effectively protect against poor outcome with relapse/refractory disease and the achievement of sustained complete remission (CR) for AML patients (5, 6). According to the clinical trials, the median survival months of AML patients with relapse or refractory were less than 10 months (3, 7–11). In general, allogeneic HSCT achieves survival in 20%-35% of relapse/refractory AML patients at 4 years (12, 13). Thus, relapse after allogeneic HSCT is a common problem and occurs in 25%-55% of AML patients. It has been shown that leukemia cells induce the expression of immune checkpoint (IC) genes and the immune escape of leukemia cells is a key cause of relapse and refractory. Recently, blockades of immune-checkpoint inhibitors (ICIs), such as programmed death receptor (PD-1) and its ligand (PD-L1), T-cell immunoreceptor with immunoglobulin and immunoreceptor tyrosine-based inhibitory motif (ITIM) domain (TIGIT), and T cell immunoglobulin and mucin domain (Tim-3), have been proven to be successful in the treatment of solid tumors (14, 15). In contrast, the clinical effectiveness of such immune therapies appears to be relatively different for AML subtypes and clinical trials with different prognosis (16, 17). Therefore, effective and individualized ICI treatments are urgently needed for AML patients. T cell immunodeficiency is a common characteristic of AML, thus adoptive T cell immunotherapy has recently emerged as an effective and prospective strategy for improving anti-leukemia therapy (18). It is known that γδ T cells are a numerically small subset of T cells in human peripheral blood (PB), and upon activation, they perform the characteristic functions of both innate and adaptive immunity (19). Human γδ T cells have the ability to recognize a wide range of antigens in the absence of major histocompatibility complex molecules and can directly attack stressed cells via their cytotoxic activity or by indirectly enhancing the biological functions of other immune cells (20, 21). A growing body of evidence has demonstrated that γδ T cells could lead to cytotoxic activation in many types of solid tumors, including lymphoma, breast, prostate, and colon cancer (22, 23). Additionally, γδ T cells are essential for anti-leukemia function and have been proposed to have therapeutic potential for leukemia treatment (24, 25). However, not all of the γδ T cell subsets perform anti-leukemia functions. In contrast, some expanded γδ T cell clones and subsets may be related to poor outcome for leukemia (26). In addition, γδ T cells have different functional subsets, including regulatory T cell subsets that express the transcription factor forkhead box p3 (Foxp3) (27). Foxp3-positive αβ T cells are traditional Tregs, and these cells have been observed to possess an immune regulatory function in patients (28, 29). The regulatory subset of γδ T cells that express Foxp3, termed γδ regulatory T cells (γδ Tregs), has been reported to be at a low expression frequency in tumor-infiltrating leukocytes and human PB; however, the relevant underlying regulatory mechanism remains unclear.
It has been reported that Treg proliferation and its suppressive functions are regulated by the PD-1/PD-L1 pathway via a potentially novel mechanism (30). As it is known, PD-1 is an immunoreceptor expressed on activated T cells that negatively regulates antigen receptor signaling and mediates T cell suppression and dysfunction in leukemia (31). The PD-1/PD-L1 pathway plays a critical role in the prevention of abnormal autoimmune responses, and blockade of the PD-1/PD-L1 pathway was demonstrated to be an effective treatment for hematologic malignancies by clinical enhancement of the immune response (32, 33). Furthermore, the PD-1/PD-L1 pathway maintains Foxp3 stability by inhibiting degradation via downregulation of the endo-lysosomal protease asparaginyl endopeptidase (34). Our previous study reported that higher expression of ICIs in bone marrow (BM) leukemia cells in AML patients correlates with poor outcome (35, 36). Moreover, higher PD-1 expression was detected on exhausted CD8+ T cells in AML patients (37). However, whether PD-1 expression correlates with γδ Tregs and influences prognosis in AML needs to be further studied. In this study, we characterized increased PD-1+Foxp3+ γδ T cells in patients with de novo AML, which may be relevant to poor clinical outcome.
From the cancer genome atlas (TCGA; https://cancergenome.nih.gov/) database, level 3 RNA-seq data from 167 AML patients was downloaded using UCSC XENA (https://xenabrowser.net/datapages/) related data analysis (34). RNA-seq data are presented in the form of log2 (RPKM+1). Subsequently, RNA-seq data were assigned to a training group for analysis. Because the TCGA dataset is publicly available, no local ethics committee approval was required (Supplementary Table 1).
PB samples were collected with consent from 36 de novo AML patients, including 17 males and 19 females with a median age of 53.5 years (range: 18-86 years). PB from 25 age-matched healthy individuals (HIs) who had no acute or chronic infectious diseases, autoimmune diseases, or tumors, including 13 males and 12 females with a median age of 55 years (range: 25-70 years), were recruited as healthy controls. There are 21 PB samples were detected by flow cytometry and the remain 15 PB samples were used as the training cohort by quantitative real-time PCR (qRT-PCR). The overall survival was defined as the time from the date of diagnosis to the date of death or last follow- up time. The clinical information of AML patients was listed in Supplementary Table 2. All procedures were conducted according to the guidelines of the Medical Ethics committees of the health bureau of Guangdong Province in China, and ethical approval was obtained from the Ethics Committee of the First Affiliated Hospital of Jinan University.
Peripheral blood mononuclear cells (PBMCs) were isolated from AML patients and HIs and then incubated with the following antibodies: CD45-V450 (clone H130), CD3-Alexa Fluor® 700 (clone SP34-2), TCR γδ-PE-Cy7 (clone B1), Vδ1-FITC (clone TS8.2), Vδ2-PerCP (clone B6), PD-1-PE (clone EH12.2H7), Foxp3-Alexa Fluor® 647 (clone 150D), PE isotype control (clone MOPC-21), and Alexa Fluor® 647 isotype control (clone 259D/C7) (BioLegend, SanDiego, USA; BD Biosciences, San Jose, USA; Abcam Cambridge, UK). First, cells obtained from fresh PB samples were stained with surface markers including CD45, CD3, TCR γδ, Vδ1, Vδ2, and PD-1 at 4°C in the dark for 30 minutes. For Foxp3 expression detection, anti-Foxp3 antibody and Foxp3 Fix/Perm buffer were used according to the manufacturer’s instructions. The gating standards for PD-1 and Foxp3 were set using the isotype controls recommended by the manufacturer. A total of 30,000-50,000 CD3+ cells were collected with a BD FACS VERSE flow cytometer (BD Biosciences, San Jose, USA), and data were analyzed by Flowjo software (Flowjo LLC, USA) (38).
γδ T cells were sorted from PBMCs using a γδ T cell monoclonal antibody and the MACS magnetic cell sorting technique (Miltenyi Biotec, Bergisch Gladbach, Germany). RNA was reverse transcribed into first-strand cDNA with random hexamer primers. qRT-PCR using the SYBR Green I technique was used to examine the FOXP3 and PD-1 gene expression level in cDNA from γδ T cells with the β2 microglobulin gene serving as an endogenous reference. The primers were purchased from Invitrogen Biotechnology Co. Ltd. (Shanghai, China) (Supplementary Table 3). The relative mRNA expression level was calculated using the 2-△Ct× 100% method (39).
All data are represented as medians. Comparisons between the different γδ T cell populations and differences in mRNA expression between two groups were analyzed by the Mann Whitney U test for non-parametric values. Spearman rank correlations and linear regression analyses were used to estimate the correlation between quantitative parameters. Mann Whitney U test, Spearman rank correlations, and linear regression analyses were performed by the R package “ggplot2”. Cox regression analysis was used to explore associations between the frequencies of γδ T cells and their subsets and the outcome of patients with de novo AML. The explanatory variables included the proportions of the Foxp3+, PD-1+, and PD-1+Foxp3+ subsets in γδ T cells. Odds ratios and 95% confidence intervals were also calculated. Statistical analyses were performed with SPSS 13.0 statistical software and R package “ggplot2”. P < 0.05 was considered significant.
Previous studies from our research group have shown that higher PD-1 expression is related to poor OS for AML patients (34). In this study, we first explored the correlation between the expression and prognostic value of PD-1 and FOXP3 for AML patients by analyzing RNA-seq data from 167 AML patients in the TCGA database. According to the media expression levels of FOXP3/PD-1 genes, AML patients were divided into high-, low-, co-high, and co-low expression groups to plot and compare Kaplan-Meier curves. Our initial results demonstrated there was a positive correlation between PD-1 and FOXP3 (R = 0.376, P<0.001) (Figure 1A). Subsequently, we found no significant correlation between the FOXP3 gene expression level and OS (FOXP3high vs. FOXP3low, 24-month OS: 36% vs 53%, P = 0.368) (Figure 1B), while a significant association between the PD-1 gene and OS was found (PD-1high vs. PD-1low, 24-month OS: 35% vs 54%, P = 0.009) (Figure 1C). More importantly, AML patients with higher FOXP3 and PD-1 co-expression had worse OS (PD-1high FOXP3high vs. PD-1low FOXP3low, 24-month OS: 35% vs 65%, P = 0.018) (Figure 1D).
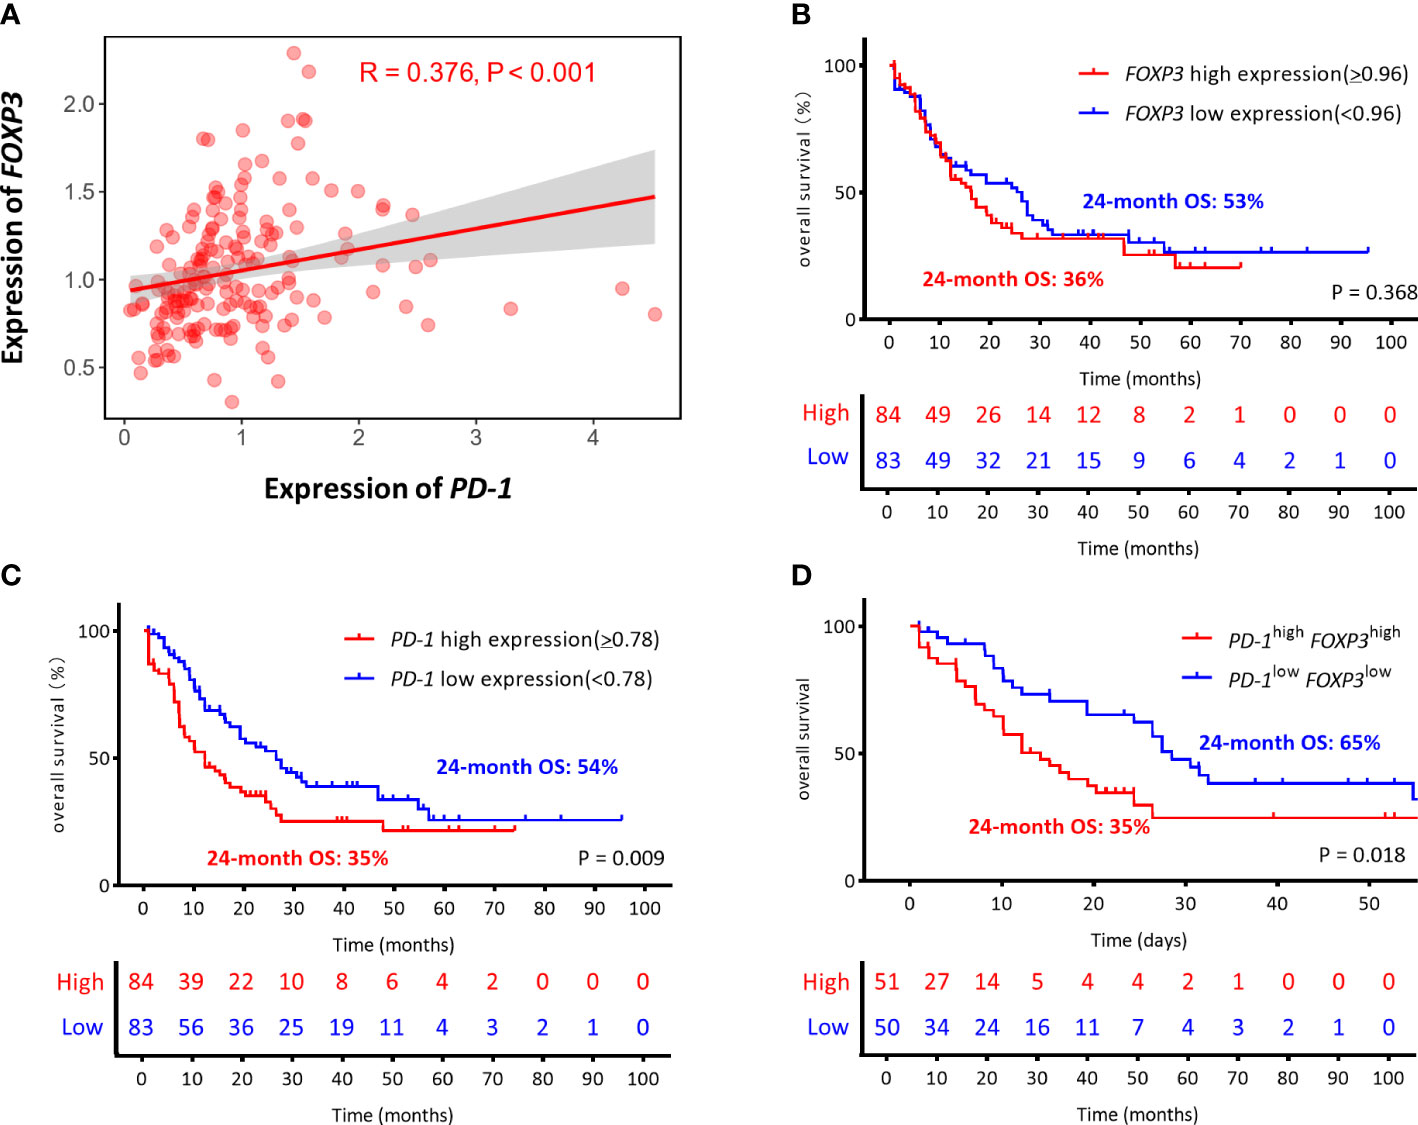
Figure 1 The correlation and the prognostic between the expression of PD-1 and FOXP3 genes in AML from the TCGA (The Cancer Genome Atlas). (A) Correlation of the expression levels of PD-1 and FOXP3. (B–D) The optimal cutoff values were based on the median gene expression levels, the FOXP3 and PD-1 genes were divided into high expression (red line) and low expression (blue line) groups, which were plotted in Kaplan-Meier curves (top) with the number at risk AML patients (bottom). Kaplan-Meier curves are shown for single FOXP3 high or low expression, single PD-1 high or low expression, and co-high or co-low expression of PD-1/FOXP3. (B) FOXP3high vs. FOXP3low, 24-month OS: 36% vs. 53% P = 0.368. (C) PD-1high vs. PD-1low, 24-month OS: 35% vs. 54% P = 0.009. (D) PD-1 high FOXP3high vs. PD-1 low FOXP3low, 24-month OS: 35% vs. 65% P = 0.018.
To compare the frequency of γδ T cells and their subsets in AML patients with that in HIs, seven different antibodies were used for detection. CD45high lymphocytes expressing CD3 and γδ TCRs were gated as CD3+ and γδ T cells, respectively. The γδ T cells were then divided into two subsets based on the expression of Vδ1 and Vδ2. A decreased trend for the total γδ T cell proportion in CD3+ T cells from 21 patients with de novo AML when compared with 15 HIs (Figures 2A, B) (median: 5.5% vs. 8.8%, P = 0.049) was found together with an increased proportion of the Vδ1 subgroup (median: 52.3% vs 17.7%, P = 0.004) and a decreased proportion of the Vδ2 T cell subgroup in the total γδ T cell population (median: 31.0% vs. 66.3%, P = 0.004) (Figures 2C, D). These results indicate a significantly decreased proportion of total γδ T cells with a higher frequency of the Vδ1 subset, and there was a lower trend for the Vδ2 subset in AML patients. Next, we examined the expression of Foxp3 in the γδ T cell subsets. A significantly higher percentage of Foxp3+ γδ T cells in the CD3+ T cell population (median: 6.7% vs. 4.2%, P = 0.007) and Foxp3+ Vδ1 in the γδ T cell population (median: 4.7% vs. 2.0%, P = 0.030) was found in AML patients. A high tendency for Foxp3+ Vδ2 in γδ T cells was also found; however, this did not appear to be statistically significant (median: 2.5% vs. 1.3%, P = 0.082) (Figures 2E, F). We further compared the PD-1 distribution in different γδ T cell subsets. It was noted that there was a dramatically increased trend in total PD-1+ γδ T cells in the CD3+ T cell population (median: 5.8% vs.2.4%), PD-1+ Vδ1 cells in the γδ T cell population (median: 18.4% vs. 6.6%), and PD-1+ Vδ2 cells in the γδ T cells population (median: 14.2% vs. 1.0%) (P = 0.030, P = 0.126, and P = 0.009, respectively) (Figures 2G–I).
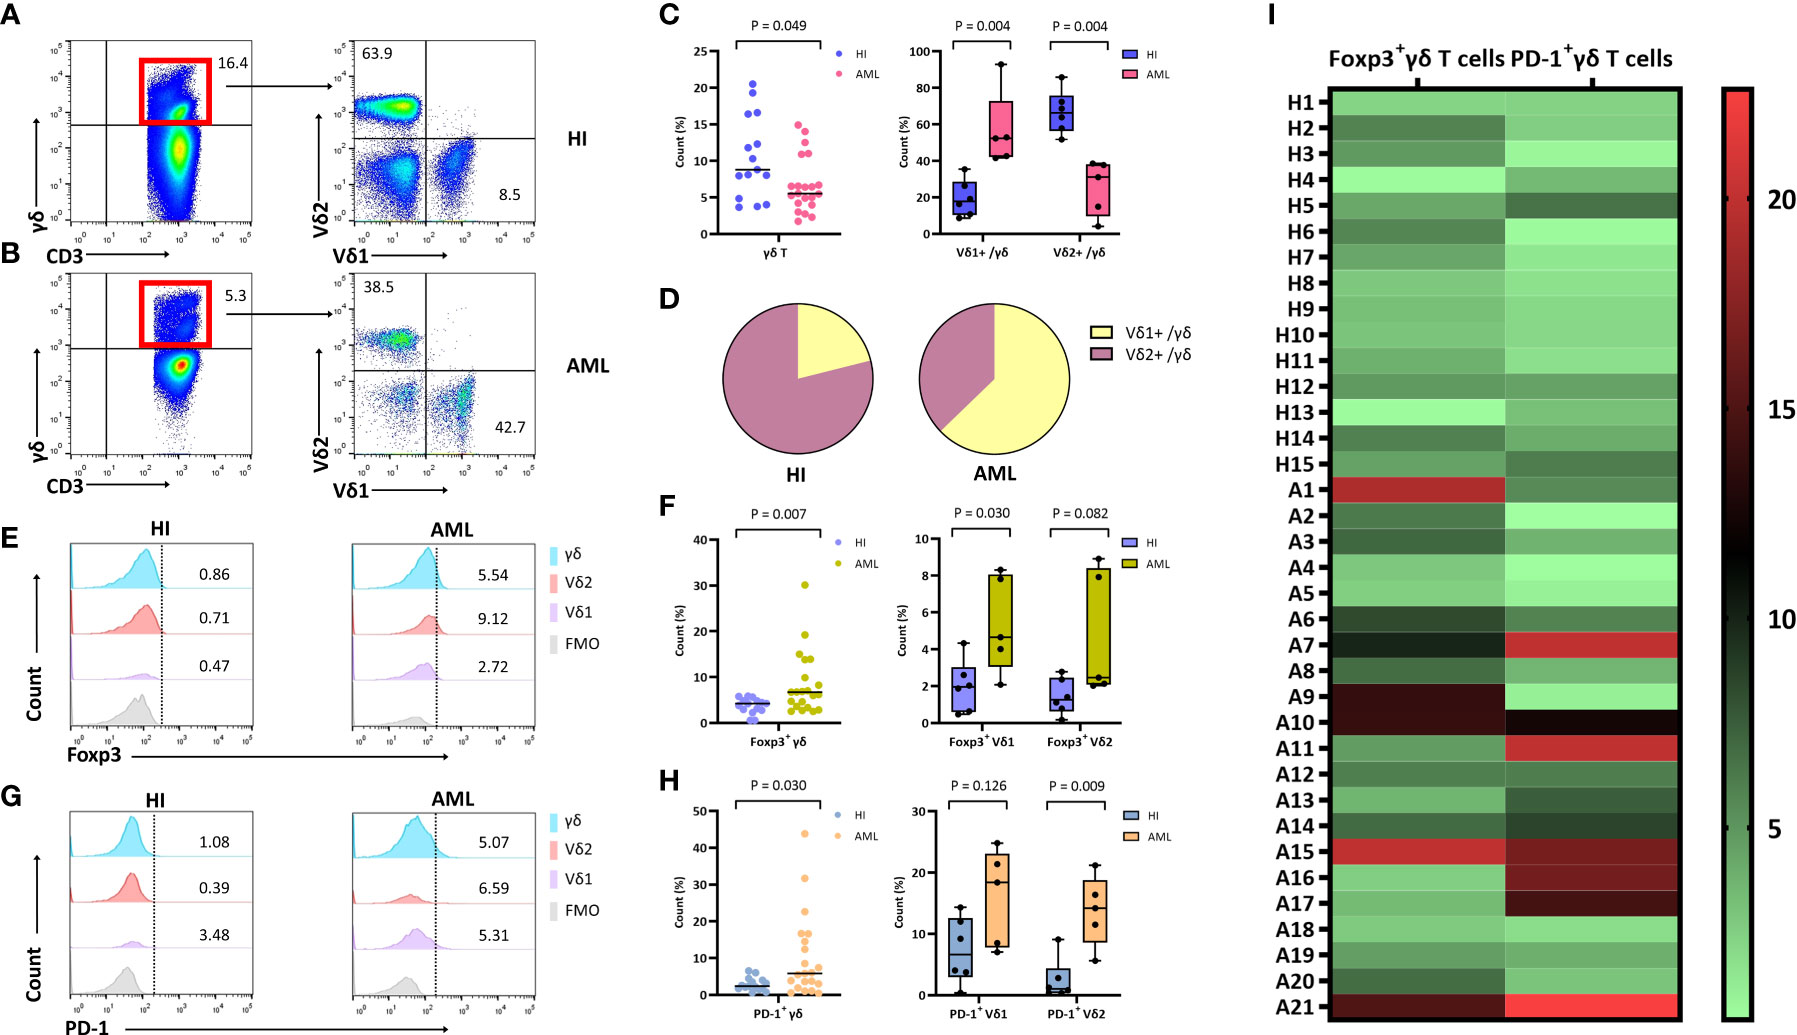
Figure 2 Distribution and frequency of Foxp3 and PD-1 expression in γδ, Vδ1, and Vδ2 cell subsets in PB from patients with de novo AML. (A, B) γδ T cells were gated by CD3+ T cells, further identifying Vδ1 and Vδ2 cell subsets from a healthy donor and a patient with de novo AML by flow cytometry analysis. (C) Comparison of the percentage of γδ, Vδ1, and Vδ2 cell subsets in AML patients compared with HIs. (D) The pie chart representing the distribution of Vδ1 and Vδ2 cells in AML patients and healthy individuals (HIs). (E) Detection of Foxp3 expression in γδ, Vδ1, and Vδ2 cell subsets from a healthy donor and an AML patient. (F) Comparison of the percentage of Foxp3+ γδ, Vδ1, and Vδ2 cell subsets in AML patients compared with HIs. (G) Detection of PD-1 expression in γδ, Vδ1, and Vδ2 cell subsets from a healthy donor and an AML patient. (H) Comparison of the percentage of PD-1+ γδ, Vδ1, and Vδ2 cell subsets in AML patients compared with HIs. (I) Heatmap representing the frequency of the Foxp3+ and PD-1+ γδ T subsets in patients with AML (A1-A21) compared with HIs (H1-H15).
To better understand PD-1 expression on Foxp3+ γδ T cells, we further examined and compared the frequency of PD-1 on this subset. We detected the percentage of PD-1+Foxp3+ γδ T cells in different samples by flow cytometry. Compared with HIs, the PD-1 proportion in the Foxp3+ γδ T cell population was significantly increased (median: 1.2% vs. 0.1%, P < 0.001), and the Foxp3+ Vδ2 subset was also increased in AML patients (median: 0.7% vs. 0.1%, P = 0.004) (Figures 3A, B). However, there was no significant difference in the Foxp3+ Vδ1 subset (median: 1.2% vs. 0.4%, P = 0.247) between AML patients and HIs (Figures 3B, C).
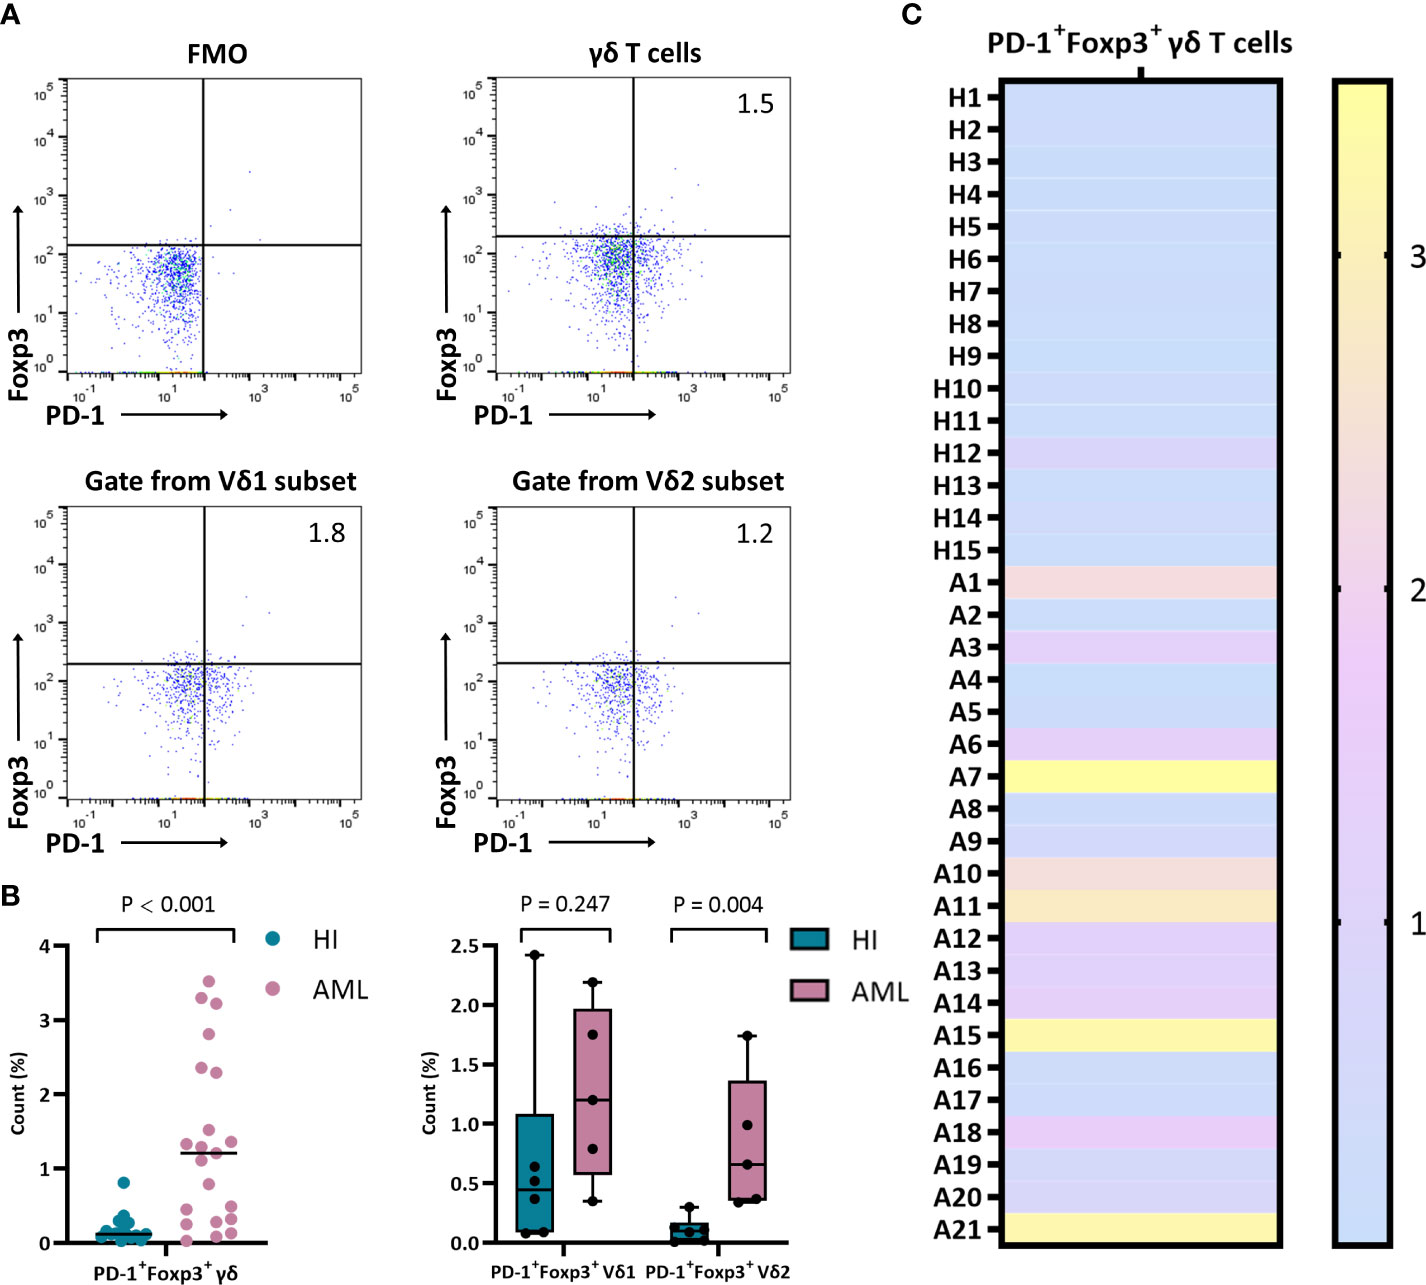
Figure 3 Distribution and frequency of co-expression with PD-1 and Foxp3 in γδ, Vδ1, and Vδ2 cell subsets. (A) Detection of co-expression with PD-1 and Foxp3 in γδ, Vδ1, and Vδ2 cell subsets from a patient with de novo AML by flow cytometry analysis. (B) Comparison of the percentage of PD-1+Foxp3+ in γδ, Vδ1, and Vδ2 cell subsets from de novo AML patients compared with HIs. (C) Heatmap representing the frequency of the PD-1+Foxp3+ γδ T subset in HIs (H1-H15) and patients with de novo AML (A1-A21).
Notably, we found a prominent positive correlation between PD-1+Foxp3+ γδ T cells and the Foxp3+ γδ T cell proportion (R = 0.627, P = 0.003) in AML patients, and there was no significant correlation between the proportions of those two groups (R = 0.430, P = 0.110) in HIs. Moreover, a positive correlation between the PD-1+Foxp3+ γδ and PD-1+ γδ T cell proportion was also found in the AML patients (R = 0.704, P < 0.001), while there was no significant correlation in HIs (R= 0.376, P = 0.167) (Figure 4A). We also analyzed the expression levels of the FOXP3 and PD-1 genes in γδ T cells from de novo AML patients and compared these results with that of HIs. Remarkably, higher PD-1 expression levels were detected in the de novo AML group compared with the HI group (P = 0.021), and a higher FOXP3 expression trend was also found (P = 0.680) (Figure 4B). Moreover, a positive correlation between FOXP3 and PD-1 gene expression in γδ T cells (R = 0.781, P = 0.002) from de novo AML patients was found, but there was no significant correlation in HIs (r = 0.399, P = 0.201) (Figure 4C). Overall, these results indicated a significantly higher proportion of γδ Treg cells and a novel Foxp3+ Vδ2 subset expressing PD-1 in patients with AML.
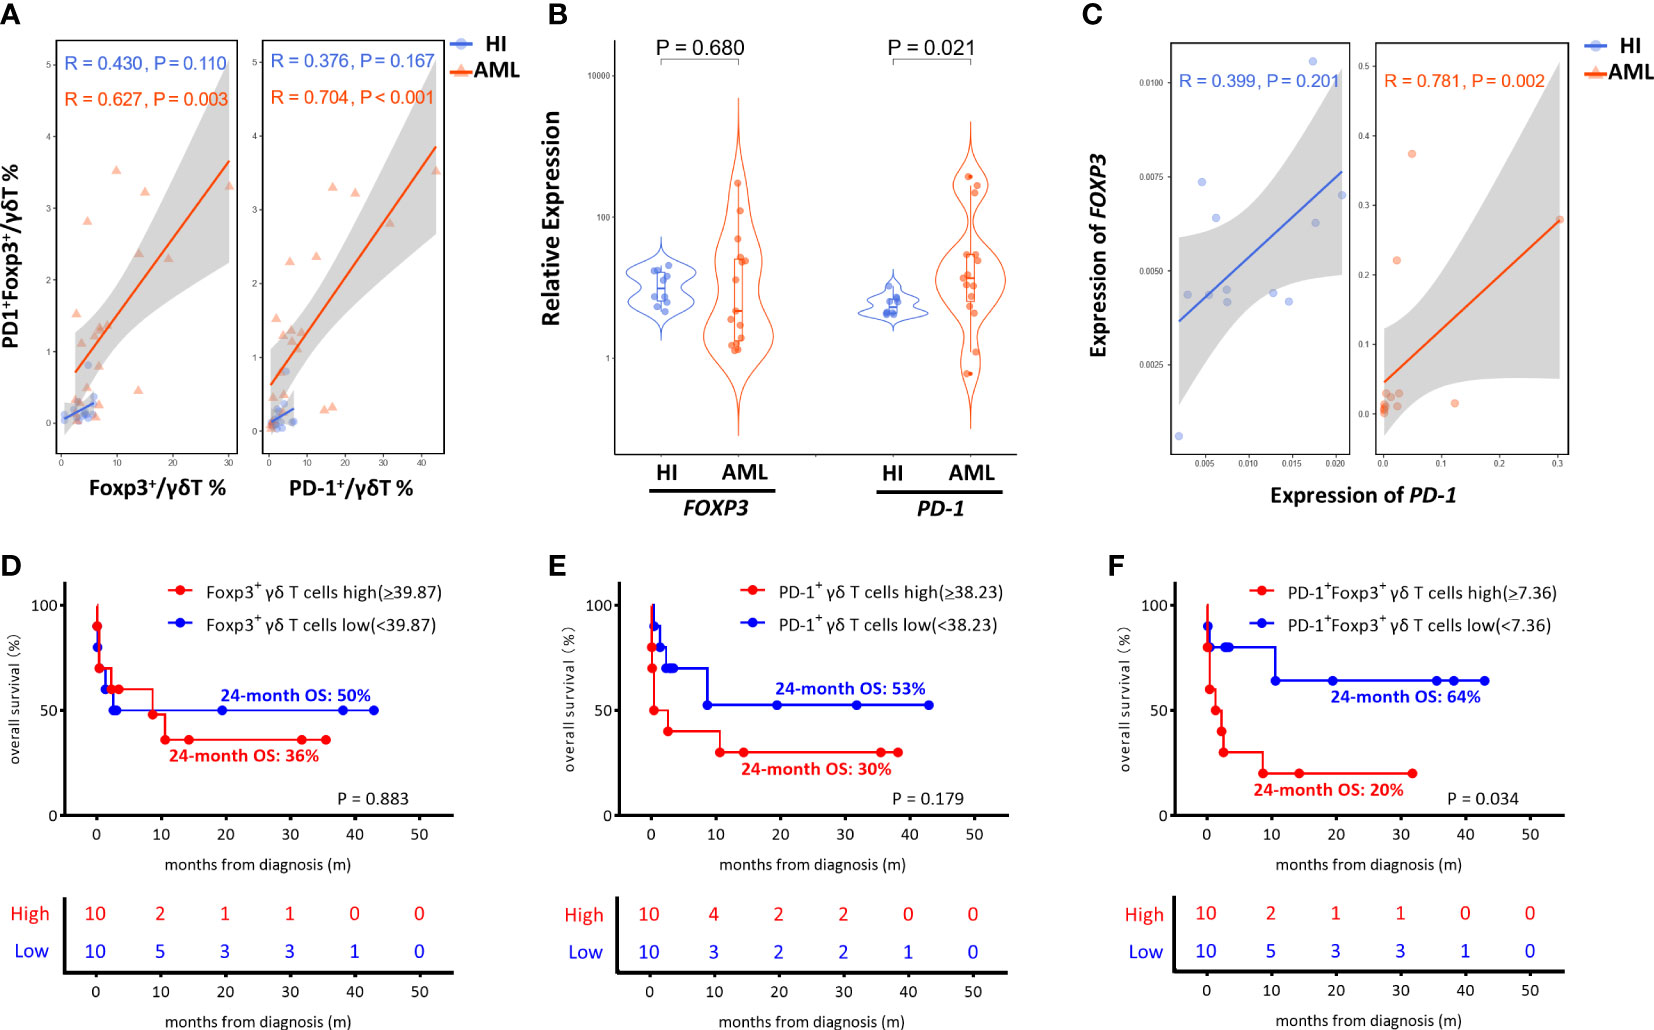
Figure 4 Correlation and OS analysis of PD-1 and Foxp3 in γδ T cells from de novo AML patients. (A) Correlation of the frequency of the Foxp3+, PD-1+, and PD-1+ Foxp3+ γδ T subsets between de novo AML patients and HIs. (B) The expression levels of the FOXP3 and PD-1 genes in γδ T cells from de novo AML patients compared to HIs. (C) Correlation analysis of the FOXP3 and PD-1 genes. (D–F) Correlation of the OS of de novo AML patients stratified by high and low Foxp3+ γδ T subsets, high and low PD-1+ γδ T subsets and high and low PD-1+ Foxp3+ γδ T subsets. (D) Foxp3+ high vs. Foxp3+ low, 24-month OS: 36% vs. 50% P = 0.883. (E) PD-1+high vs. PD-1+low, 24-month OS: 30% vs. 53% P = 0.179. (F) PD-1+ Foxp3+high vs. PD-1+ Foxp3+low, 24-month OS: 20% vs. 64% P = 0.034.
Despite the increased insight into the phenotype of γδ T cells, whether this phenotype correlates with clinical outcome remains poorly understood. It is unclear whether the increase in the novel PD-1+Foxp3+ γδ T cell subset affects AML clinical outcome. Therefore, we assessed the clinical outcomes of the 21 AML patients including one patient who refused therapy and voluntarily left the hospital. We further analyzed the association among AML outcome, OS, and proportions of the Foxp3+ population, PD-1+ population, and PD-1+Foxp3+ population in the γδ T cell subset. We divided the patients into high and low groups based on the median frequency of the γδ T cell subset. There was no significant difference in the Foxp3+ γδ and PD-1+ γδ T cell groups (Foxp3+high vs. Foxp3+low 24-month OS: 36% vs. 50% P = 0.883; PD-1+high vs. PD-1+low 24-month OS: 30% vs. 53%, P = 0.179) (Figures 4D, E). Strikingly, AML patients with a high level of PD-1+Foxp3+ γδ T cells were found to have poor OS (PD-1+Foxp3+high vs. PD-1+Foxp3+low, 24-month OS 20% vs. 64%, P = 0.034), suggesting that the high proportion of the PD-1+Foxp3+ γδ T subset was associated with poor clinical outcome (Figure 4F).
Although γδ T cells represent only a minor fraction of T cells in PB, the potent antitumor cytotoxic activity of these cells is crucial for establishing and initiating immune responses (40, 41). Several clinical trials involving γδ T cell-based immunotherapies have demonstrated promising effects in solid tumors and hematological malignancies (42, 43). However, the clinical benefits appear to be mild to moderate at best. γδ T cells might have dual effects, and researchers have turned their attention away from the well-known immune effector role of γδ T cells and toward the newfound immunosuppressive regulatory role. Increasing data have demonstrated the heterogeneity of γδ T cells; however, little is known about the distribution of γδ T cells and their subsets in AML patients. Our previous study found the altered expression pattern and clonality of the γδ T cell receptor repertoire and identified that some clonally expanded γδ T cell clones might be related to the immune response and clinical outcome of AML patients (44, 45). Our previous study described the prognostic value of immune checkpoint inhibitors for AML patients by analyzing RNA-seq from the TCGA database and further validated results indicated that high expression of PD-1, PD-L1, and PD-L2 in the BM leukemia cells of AML patients correlated with poor outcomes (34). To the best of our knowledge, we first explored the association between the expression levels of the PD-1 and FOXP3 genes and the OS in the BM leukemia cells AML patients based on the TCGA database and described the expression pattern correlated with the poor OS. Besides, our further study found that PD-1 on CD8+ T cells was generally expressed higher in PB and BM from de novo and relapse-refractory AML patients, while it was partially recovered in complete remission patients (36). These results may be due to a novel change in the expression patterns of ICIs in AML, which suggests that there are different roles of PD-1 on T cells and their subsets. However, the expression profiles and clinical prognosis correlation of PD-1 in γδ T cells and their subsets in AML patients have not been clearly defined.
Because PB was more beneficial to access to observation and evaluation, in this study, we comprehensively compared the proportions of γδ T cells from PB samples, and these data indicate a significantly decreased frequency of total γδ T cells with a higher proportion of the Vδ1+ subset, and there was a lower trend for the Vδ2+ subset in AML patients. It is well known that Vδ2 T cells play a critical role in anti-tumor effects, and the skewed distribution of γδ T cells with a low number of Vδ2+ T cells may be a reason for γδ T cell dysfunction in AML. This abnormal expression pattern was also reported to be associated with poor prognosis in chronic lymphocytic leukemia (46). Our results also demonstrate an increasing trend in the Foxp3+ T cell subsets in the Vδ1 and Vδ2 T cell populations, which might be related to the primary reason for leukemia immunosuppression. Brauneck et al. also reported that BM-infiltrating Vδ1 T cells showed an increased terminally differentiated cell population in AML in comparison to healthy donors with an aberrant subpopulation of CD27−CD45RA+ cells (47). Our previous study revealed that the co-inhibitory TIGIT axis may be involved in the regulation of Foxp3+ γδ Treg cells and indicate the clinical progression and prognosis of AML patients with different clinical statuses (48, 49). Thus, it would be worth further characterizing other inhibitory phenotypes of the γδ T cell subsets in newly diagnosed AML, which may be an advantage of receiving immunotherapy. Besides, it is important to compare the frequency of γδ T cells between PB and BM in AML patients in our further study.
Previously, we reported an increase in the PD-1 expression frequency in αβ+ T cells in AML patients, and the prognosis of these patients was significantly worse (50). However, the expression profiles and clinical prognosis correlation of PD-1 in γδ T cells and their subsets in AML patients have not been clearly defined. However, litter is known about the expression patterns of PD-1 and Foxp3 and whether there are immunosuppressive regulatory subgroups γδ T cells in patients with AML. Hence, we further sought to investigate the proportion of PD-1 on γδ Treg cells. A significantly higher proportion of γδ Treg cells and a novel Foxp3+ Vδ2 subset expressing PD-1 were observed. Recent research has also reported that Vδ2 γδ T cells exhibit the exhausted state via PD-1 upregulation at diagnosis in AML patients (51). Most importantly, the expression proportions of the PD1+ γδ T cell and γδ Treg subgroups were positively correlated with the PD1+ γδ Treg subgroup. Interestingly, the correlation and pattern of PD-1 and FOXP3 from the TCGA database were again confirmed and existed in the γδ T cells from AML PB samples. We found that a higher co-expression level of PD-1 and FOXP3 was associated with poor AML clinical outcomes. This result may be supported by the findings of Dyck et al. who found a positive correlation between high PD-1 expression and increased tumor-infiltrating Tregs, and blocking PD-1 could effectively enhance anti-tumor immunity (52). There were also similar results from Ahearne et al. who reported that infiltration by both the Foxp3+CD4+ and PD-1+CD4+ T cell subsets was correlated with the prognosis of patients with diffuse large B-cell lymphoma (53), and Suresh et al., who found that PD-1+ and Foxp3+ T cell reduction might correlate with survival and serve as a predictive biomarker for hepatocellular carcinoma patients undergoing sorafenib therapy (54). In addition, further studies should elucidate the complex mechanisms of the PD-1 axis in suppressing γδ T cell function in the tumor microenvironment.
Taken together, in addition to the previously reported increase in ICIs in αβ+ T cells and higher T cell exhaustion status in AML patients, we further speculate that the high frequency of the PD-1+Foxp3+ γδ T subset is associated with poor clinical outcomes, which could reinforce evidence of a link between PD-1 and Foxp3 in γδ T cells. These results support the idea that there is a diverse and functional heterogeneity of γδ T cells, and the combined application of PD-1 and Foxp3 in novel targeted therapies may improve AML patient survival. This finding may partially explain how γδ T cells may be polarized from anti-leukemia to protumor cells, which appears to be the likely reason for mild efficacy in response to leukemia cells.
We characterized the skewed distribution of γδ T cells with an inversion in the proportion of the Vδ1/Vδ2 T cell subset in AML patients, and we found a significant increase in the PD-1+Foxp3+ γδ T cell subset in AML, which was associated with poor clinical outcome (Figure 5). Our study facilitates a better understanding of the interaction of γδ T cells in AML patients and provides predictive value for the study of AML patients. However, more in vivo experiments are required to elucidate the function of the novel PD-1+Foxp3+ γδ T cell subset and investigate whether it could serve as a target for immunotherapy.

Figure 5 Overview of alterations in γδ T cell subsets in patients with AML.
The original contributions presented in the study are included in the article/Supplementary Material. Further inquiries can be directed to the corresponding authors.
The studies involving human participants were reviewed and approved by Ethics Committee of School of Medicine of Jinan University. The patients/participants provided their written informed consent to participate in this study.
YQL, XLW, and ZYJ contributed to the concept development and study design. DQ, YZ, HTZ, and XFW performed the laboratory studies. JC, JL, and XTL collected the clinical data. ZYJ, JMZ, DQ, XJ, and WBZ participated in the manuscript and figure preparation. YQL and XLW coordinated the study and helped draft the manuscript. All authors read and approved the final manuscript.
This study was supported by grants from the Science and Technology Program of Guangzhou City (No. 202201010164), the National Natural Science Foundation of China (Nos. 81800143, 81770150, 81200388, and 82170220), Natural Science Foundation of Guangdong Province (No. 2020A1515010817 and 2022A1515010313), Guangdong’s Innovation and Entrepreneurship Training Program for Undergraduate (Nos. 202010559081 and 202210559083), “Challenge Cup” National Undergraduate curricular academic science and technology works by race (No. 21112027) and Guangdong College Students’ Scientific and Technological Innovation (Nos. CX22438, CX22446, and CX21285).
We want to acknowledge the Flow Facility of Biological Translational Research Institute of Jinan University, and we also want to thank the healthy volunteers who donated blood for this project.
The authors declare that the research was conducted in the absence of any commercial or financial relationships that could be construed as a potential conflict of interest.
All claims expressed in this article are solely those of the authors and do not necessarily represent those of their affiliated organizations, or those of the publisher, the editors and the reviewers. Any product that may be evaluated in this article, or claim that may be made by its manufacturer, is not guaranteed or endorsed by the publisher.
The Supplementary Material for this article can be found online at: https://www.frontiersin.org/articles/10.3389/fonc.2022.1007565/full#supplementary-material
1. Kantarjian H, Kadia T, DiNardo C, Daver N, Borthakur G, Jabbour E, et al. Acute myeloid leukemia: Current progress and future directions. Blood Cancer J (2021) 11(2):41. doi: 10.1038/s41408-021-00425-3
2. Liu H. Emerging agents and regimens for aml. J Hematol Oncol (2021) 14(1):49. doi: 10.1186/s13045-021-01062-w
3. Döhner H, Wei AH, Appelbaum FR, Craddock C, DiNardo CD, Dombret H, et al. Diagnosis and management of aml in adults: 2022 recommendations from an international expert panel on behalf of the eln. Blood (2022) 140(12):1345–77. doi: 10.1182/blood.2022016867
4. Khoury JD, Solary E, Abla O, Akkari Y, Alaggio R, Apperley JF, et al. The 5th edition of the world health organization classification of haematolymphoid tumours: Myeloid and Histiocytic/Dendritic neoplasms. Leukemia (2022) 36(7):1703–19. doi: 10.1038/s41375-022-01613-1
5. Hourigan CS, Gale RP, Gormley NJ, Ossenkoppele GJ, Walter RB. Measurable residual disease testing in acute myeloid leukaemia. Leukemia (2017) 31(7):1482–90. doi: 10.1038/leu.2017.113
6. Yu J, Li Y, Zhang D, Wan D, Jiang Z. Clinical implications of recurrent gene mutations in acute myeloid leukemia. Exp Hematol Oncol (2020) 9(1):4. doi: 10.1186/s40164-020-00161-7
7. Stein EM, DiNardo CD, Pollyea DA, Fathi AT, Roboz GJ, Altman JK, et al. Enasidenib in mutant Idh2 relapsed or refractory acute myeloid leukemia. (2017) 130(6):722–31. doi: 10.1182/blood-2017-04-779405
8. DiNardo CD, Stein EM, de Botton S, Roboz GJ, Altman JK, Mims AS, et al. Durable remissions with ivosidenib in Idh1-mutated relapsed or refractory aml. (2018) 378(25):2386–98. doi: 10.1056/NEJMoa1716984
9. Cortes JE, Khaled S, Martinelli G, Perl AE, Ganguly S, Russell N, et al. Quizartinib versus salvage chemotherapy in relapsed or refractory Flt3-itd acute myeloid leukaemia (Quantum-r): A multicentre, randomised, controlled, open-label, phase 3 trial. Lancet Oncol (2019) 20(7):984–97. doi: 10.1016/S1470-2045(19)30150-0
10. Perl AE, Martinelli G, Cortes JE, Neubauer A, Berman E, Paolini S, et al. Gilteritinib or chemotherapy for relapsed or refractory Flt3-mutated aml. N Engl J Med (2019). 381(18):1728–40. doi: 10.1056/NEJMoa1902688
11. Stein EM, DiNardo CD, Fathi AT, Pollyea DA, Stone RM, Altman JK, et al. Molecular remission and response patterns in patients with mutant-Idh2 acute myeloid leukemia treated with enasidenib. Blood (2019) 133(7):676–87. doi: 10.1182/blood-2018-08-869008
12. Duval M, Klein JP, He W, Cahn JY, Cairo M, Camitta BM, et al. Hematopoietic stem-cell transplantation for acute leukemia in relapse or primary induction failure. J Clin Oncol Off J Am Soc Clin Oncol (2010) 28(23):3730–8. doi: 10.1200/jco.2010.28.8852
13. Schlenk RF, Döhner K, Mack S, Stoppel M, Király F, Götze K, et al. Prospective evaluation of allogeneic hematopoietic stem-cell transplantation from matched related and matched unrelated donors in younger adults with high-risk acute myeloid leukemia: German-Austrian trial Amlhd98a. J Clin Oncol Off J Am Soc Clin Oncol (2010) 28(30):4642–8. doi: 10.1200/jco.2010.28.6856
14. Liu D. Car-T "the living drugs", immune checkpoint inhibitors, and precision medicine: A new era of cancer therapy. J Hematol Oncol (2019) 12(1):113. doi: 10.1186/s13045-019-0819-1
15. Tan S, Li D, Zhu X. Cancer immunotherapy: Pros, cons and beyond. Biomedicine pharmacotherapy = Biomedecine pharmacotherapie (2020) 124:109821. doi: 10.1016/j.biopha.2020.109821
16. Hansrivijit P, Gale RP, Barrett J, Ciurea SO. Cellular therapy for acute myeloid leukemia - current status and future prospects. Blood Rev (2019) 37(1):100578. doi: 10.1016/j.blre.2019.05.002
17. Salik B, Smyth MJ, Nakamura K. Targeting immune checkpoints in hematological malignancies. J Hematol Oncol (2020) 13(1):111. doi: 10.1186/s13045-020-00947-6
18. Liu H, Pan C, Song W, Liu D, Li Z, Zheng L. Novel strategies for immuno-oncology breakthroughs with cell therapy. biomark Res (2021) 9(1):62. doi: 10.1186/s40364-021-00316-6
19. Vantourout P, Hayday A. Six-of-the-Best: Unique contributions of Γδ T cells to immunology. Nat Rev Immunol (2013) 13(2):88–100. doi: 10.1038/nri3384
20. Scheper W, Gründer C, Kuball J. Multifunctional Γδ T cells and their receptors for targeted anticancer immunotherapy. Oncoimmunology (2013) 2(5):e23974. doi: 10.4161/onci.23974
21. Hayday AC. Γδ T cell update: Adaptate orchestrators of immune surveillance. J Immunol (Baltimore Md 1950) (2019) 203(2):311–20. doi: 10.4049/jimmunol.1800934
22. Lafont V, Sanchez F, Laprevotte E, Michaud HA, Gros L, Eliaou JF, et al. Plasticity of Γδ T cells: Impact on the anti-tumor response. Front Immunol (2014) 5:622(1). doi: 10.3389/fimmu.2014.00622
23. Lo Presti E, Di Mitri R, Pizzolato G, Mocciaro F, Dieli F, Meraviglia S. Γδ cells and tumor microenvironment: A helpful or a dangerous liason? J leukocyte Biol (2018) 103(3):485–92. doi: 10.1002/jlb.5mr0717-275rr
24. Lo Presti E, Pizzolato G, Gulotta E, Cocorullo G, Gulotta G, Dieli F, et al. Current advances in Γδ T cell-based tumor immunotherapy. Front Immunol (2017) 8:1401(1). doi: 10.3389/fimmu.2017.01401
25. Siegers GM. Anti-leukemia activity of human gamma delta T cells. Oncoimmunology (2012) 1(2):237–9. doi: 10.4161/onci.1.2.18231
26. Jin Z, Lan T, Zhao Y, Du J, Chen J, Lai J, et al. Higher Tigit(+)Cd226(-) Γδ T cells in patients with acute myeloid leukemia. Immunol investigations (2022) 51(1):40–50. doi: 10.1080/08820139.2020.1806868
27. Kang N, Tang L, Li X, Wu D, Li W, Chen X, et al. Identification and characterization of Foxp3(+) gammadelta T cells in mouse and human. Immunol Lett (2009) 125(2):105–13. doi: 10.1016/j.imlet.2009.06.005
28. Li X, Kang N, Zhang X, Dong X, Wei W, Cui L, et al. Generation of human regulatory gammadelta T cells by tcrgammadelta stimulation in the presence of tgf-beta and their involvement in the pathogenesis of systemic lupus erythematosus. J Immunol (Baltimore Md 1950) (2011) 186(12):6693–700. doi: 10.4049/jimmunol.1002776
29. Peng G, Wang HY, Peng W, Kiniwa Y, Seo KH, Wang RF. Tumor-infiltrating gammadelta T cells suppress T and dendritic cell function Via mechanisms controlled by a unique toll-like receptor signaling pathway. Immunity (2007) 27(2):334–48. doi: 10.1016/j.immuni.2007.05.020
30. Hu ZQ, Zhao WH. Critical role of pd-1/Pd-L1 pathway in generation and function of follicular regulatory T cells. Cell Mol Immunol (2013) 10(4):286–8. doi: 10.1038/cmi.2013.15
31. Shi L, Chen S, Yang L, Li Y. The role of pd-1 and pd-L1 in T-cell immune suppression in patients with hematological malignancies. J Hematol Oncol (2013) 6(1):74. doi: 10.1186/1756-8722-6-74
32. Marin-Acevedo JA, Soyano AE, Dholaria B, Knutson KL, Lou Y. Cancer immunotherapy beyond immune checkpoint inhibitors. J Hematol Oncol (2018) 11(1):8. doi: 10.1186/s13045-017-0552-6
33. Sun JY, Zhang D, Wu S, Xu M, Zhou X, Lu XJ, et al. Resistance to pd-1/Pd-L1 blockade cancer immunotherapy: Mechanisms, predictive factors, and future perspectives. biomark Res (2020) 8(1):35. doi: 10.1186/s40364-020-00212-5
34. Chen C, Liang C, Wang S, Chio CL, Zhang Y, Zeng C, et al. Expression patterns of immune checkpoints in acute myeloid leukemia. J Hematol Oncol (2020) 13(1):28. doi: 10.1186/s13045-020-00853-x
35. Liang C, Zhao Y, Chen C, Huang S, Deng T, Zeng X, et al. Higher tox genes expression is associated with poor overall survival for patients with acute myeloid leukemia. Front Oncol (2021) 11:740642(1). doi: 10.3389/fonc.2021.740642
36. Xu L, Liu L, Yao D, Zeng X, Zhang Y, Lai J, et al. Pd-1 and tigit are highly Co-expressed on Cd8(+) T cells in aml patient bone marrow. Front Oncol (2021) 11:686156(1). doi: 10.3389/fonc.2021.686156
37. Huang J, Tan J, Chen Y, Huang S, Xu L, Zhang Y, et al. A skewed distribution and increased pd-1+Vβ+Cd4+/Cd8+ T cells in patients with acute myeloid leukemia. J leukocyte Biol (2019) 106(3):725–32. doi: 10.1002/jlb.Ma0119-021r
38. Tan J, Chen S, Huang J, Chen Y, Yang L, Wang C, et al. Increased exhausted Cd8(+) T cells with programmed death-1, T-cell immunoglobulin and mucin-Domain-Containing-3 phenotype in patients with multiple myeloma. Asia-Pacific J Clin Oncol (2018) 14(5):e266–e74. doi: 10.1111/ajco.13033
39. Liao Z, Lv X, Liu S, He Z, Chen S, Wang L, et al. Different aberrant expression pattern of immune checkpoint receptors in patients with ptcl and Nk/T-cl. Asia-Pacific J Clin Oncol (2018) 14(5):e252–e8. doi: 10.1111/ajco.12850
40. Van Acker HH, Anguille S, Van Tendeloo VF, Lion E. Empowering gamma delta T cells with antitumor immunity by dendritic cell-based immunotherapy. Oncoimmunology (2015) 4(8):e1021538. doi: 10.1080/2162402x.2015.1021538
41. Van Acker HH, Anguille S, Willemen Y, Van den Bergh JM, Berneman ZN, Lion E, et al. Interleukin-15 enhances the proliferation, stimulatory phenotype, and antitumor effector functions of human gamma delta T cells. J Hematol Oncol (2016) 9(1):101. doi: 10.1186/s13045-016-0329-3
42. Fisher JP, Heuijerjans J, Yan M, Gustafsson K, Anderson J. Γδ T cells for cancer immunotherapy: A systematic review of clinical trials. Oncoimmunology (2014) 3(1):e27572. doi: 10.4161/onci.27572
43. Nada MH, Wang H, Workalemahu G, Tanaka Y, Morita CT. Enhancing adoptive cancer immunotherapy with Vγ2vδ2 T cells through pulse zoledronate stimulation. J immunotherapy Cancer (2017) 5(1):9. doi: 10.1186/s40425-017-0209-6
44. Jin Z, Luo Q, Lu S, Wang X, He Z, Lai J, et al. Oligoclonal expansion of tcr vδ T cells may be a potential immune biomarker for clinical outcome of acute myeloid leukemia. J Hematol Oncol (2016) 9(1):126. doi: 10.1186/s13045-016-0353-3
45. Kong X, Zheng J, Liu X, Wang W, Jiang X, Chen J, et al. High trgv 9 subfamily expression marks an improved overall survival in patients with acute myeloid leukemia. Front Immunol (2022) 13:823352(1). doi: 10.3389/fimmu.2022.823352
46. Coscia M, Vitale C, Peola S, Foglietta M, Rigoni M, Griggio V, et al. Dysfunctional Vγ9vδ2 T cells are negative prognosticators and markers of dysregulated mevalonate pathway activity in chronic lymphocytic leukemia cells. Blood (2012) 120(16):3271–9. doi: 10.1182/blood-2012-03-417519
47. Brauneck F, Weimer P, Schulze Zur Wiesch J, Weisel K, Leypoldt L, Vohwinkel G, et al. Bone marrow-resident Vδ1 T cells Co-express tigit with pd-1, Tim-3 or Cd39 in aml and myeloma. Front Med (2021) 8:763773(1). doi: 10.3389/fmed.2021.763773
48. Jin Z, Ye W, Lan T, Zhao Y, Liu X, Chen J, et al. Characteristic of tigit and dnam-1 expression on Foxp3+ Γδ T cells in aml patients. BioMed Res Int (2020) 2020(1):4612952. doi: 10.1155/2020/4612952
49. Qiu D, Liu X, Wang W, Jiang X, Wu X, Zheng J, et al. Tigit axis: Novel immune checkpoints in anti-leukemia immunity. Clin Exp Med (2022) 1:1–10. doi: 10.1007/s10238-022-00817-0
50. Tan J, Yu Z, Huang J, Chen Y, Huang S, Yao D, et al. Increased pd-1+Tim-3+ exhausted T cells in bone marrow may influence the clinical outcome of patients with aml. biomark Res (2020) 8(1):6. doi: 10.1186/s40364-020-0185-8
51. Tang L, Wu J, Li CG, Jiang HW, Xu M, Du M, et al. Characterization of immune dysfunction and identification of prognostic immune-related risk factors in acute myeloid leukemia. Clin Cancer Res an Off J Am Assoc Cancer Res (2020) 26(7):1763–72. doi: 10.1158/1078-0432.Ccr-19-3003
52. Dyck L, Wilk MM, Raverdeau M, Misiak A, Boon L, Mills KH. Anti-Pd-1 inhibits Foxp3(+) treg cell conversion and unleashes intratumoural effector T cells thereby enhancing the efficacy of a cancer vaccine in a mouse model. Cancer immunology immunotherapy CII (2016) 65(12):1491–8. doi: 10.1007/s00262-016-1906-6
53. Ahearne MJ, Bhuller K, Hew R, Ibrahim H, Naresh K, Wagner SD. Expression of pd-1 (Cd279) and Foxp3 in diffuse Large b-cell lymphoma. Virchows Archiv an Int J Pathol (2014) 465(3):351–8. doi: 10.1007/s00428-014-1615-5
Keywords: acute myeloid leukemia, γδ T cells, PD-1, Foxp3, outcome, overall survival
Citation: Zheng J, Qiu D, Jiang X, Zhao Y, Zhao H, Wu X, Chen J, Lai J, Zhang W, Li X, Li Y, Wu X and Jin Z (2022) Increased PD-1+Foxp3+ γδ T cells associate with poor overall survival for patients with acute myeloid leukemia. Front. Oncol. 12:1007565. doi: 10.3389/fonc.2022.1007565
Received: 17 October 2022; Accepted: 21 November 2022;
Published: 15 December 2022.
Edited by:
Nirmalya Saha, University of Michigan, United StatesReviewed by:
Zhao Xiaosu, Peking University People’s Hospital, ChinaCopyright © 2022 Zheng, Qiu, Jiang, Zhao, Zhao, Wu, Chen, Lai, Zhang, Li, Li, Wu and Jin. This is an open-access article distributed under the terms of the Creative Commons Attribution License (CC BY). The use, distribution or reproduction in other forums is permitted, provided the original author(s) and the copyright owner(s) are credited and that the original publication in this journal is cited, in accordance with accepted academic practice. No use, distribution or reproduction is permitted which does not comply with these terms.
*Correspondence: Yangqiu Li, eWFuZ3FpdWxpQGhvdG1haWwuY29t; Xiuli Wu, c2l1bGllckAxNjMuY29t; Zhenyi Jin, amluemhlbnlpam51QDE2My5jb20=
†These authors have contributed equally to this work
‡ORCID: Jing Lai, orcid.org/0000-0002-9581-7325
Yangqiu Li, orcid.org/0000-0002-0974-4036
Xiuli Wu, orcid.org/0000-0002-5202-6515
Zhenyi Jin, orcid.org/0000-0002-3812-3626
Disclaimer: All claims expressed in this article are solely those of the authors and do not necessarily represent those of their affiliated organizations, or those of the publisher, the editors and the reviewers. Any product that may be evaluated in this article or claim that may be made by its manufacturer is not guaranteed or endorsed by the publisher.
Research integrity at Frontiers
Learn more about the work of our research integrity team to safeguard the quality of each article we publish.