 Dingyun Liu
 Jun Bai
 Qian Chen1,2
 Renbo Tan
 Zheng An
 Jun Xiao
 Yingwei Qu
 Ying Xu
94% of researchers rate our articles as excellent or good
Learn more about the work of our research integrity team to safeguard the quality of each article we publish.
Find out more
ORIGINAL RESEARCH article
Front. Oncol., 28 September 2022
Sec. Cancer Genetics
Volume 12 - 2022 | https://doi.org/10.3389/fonc.2022.1003715
Brain metastasis of a cancer is a malignant disease with high mortality, but the cause and the molecular mechanism remain largely unknown. Using the samples of primary tumors of 22 cancer types in the TCGA database, we have performed a computational study of their transcriptomic data to investigate the drivers of brain metastases at the basic physics and chemistry level. Our main discoveries are: (i) the physical characteristics, namely electric charge, molecular weight, and the hydrophobicity of the extracellular structures of the expressed transmembrane proteins largely affect a primary cancer cell’s ability to cross the blood-brain barrier; and (ii) brain metastasis may require specific functions provided by the activated enzymes in the metastasizing primary cancer cells for survival in the brain micro-environment. Both predictions are supported by published experimental studies. Based on these findings, we have built a classifier to predict if a given primary cancer may have brain metastasis, achieving the accuracy level at AUC = 0.92 on large test sets.
The general understanding about cancer is that given time, a vast majority of cancer biomasses will migrate and then metastasize to distal locations. Among the most observed metastasized organs are bone (accounting for 20% of all the distally metastasized cancers), brain (10% of the metastases), liver (20% of the metastases), and lung (15% of the metastases) (1). While multiple proposals have been made regarding the main factors that dictate where a primary cancer may metastasize to in the past 100+ years (2), it remains elusive about what molecular factors may determine the final destinations of a metastasizing cancer. Among the proposals, the seed-soil hypothesis made by Stephan Paget over 130 years ago remains a popular one, which essentially states: a primary cancer may metastasize to any organ via the circulatory systems, and it is the level of match between the functional capabilities (the seed) and the characteristics of the destination site (the soil) that dictate whether the newly arrived cells can survive the new environment (3). Another main proposal different from the seed-soil hypothesis is the anatomical-mechanical-based theory of metastasis, which lays the emphasis on the relevance of the vascular connections between the primary tumor and the target organ of metastasis (4).
The main question we address here is: what molecular factors may dictate if a primary cancer can metastasize to brain and thrive as a secondary tumor? The state of the art of understanding about brain metastases is that it requires at least two conditions, namely (a) the tumor cells should be able to cross the blood-brain barrier (BBB), possibly the most challenging step for tumor cells metastasizing into brain (5, 6), and (b) the brain-metastasized tumor cells must be able to adapt to the brain microenvironment to survive and thrive (7, 8). Following this guiding information, a number of studies have been published regarding the genomic and transcriptomic characteristics tumors relevant to (a) and (b). For example, (i) genetic mutations in COX2, EGFR, HBEG, ST6GALNAC5 (9), and MMP2, 3, 9 are found to be associated with the increased ability to penetrate the BBB (6, 10), particularly for breast cancer, the most studied primary cancer type in relevance to brain metastasis; and (ii) enhanced expressions of IL1b, HES5 (11), PCDH7 (12), γ-aminobutyric acid-related genes (13), and the activated Notch signaling pathway (7) can increase the ability of the arriving cancer cells to survive in the brain microenvironment.
We have conducted a computational study here aiming to elucidate the common and distinguishing features of primary cancer cells of different types having brain metastases. To do this, we have retrieved the transcriptomic data of all tissue samples of 22 cancer types from the TCGA database, 44 primary cancer samples known to have metastasized to brain, and 529 primary cancer samples known to have metastasized to other organs. We have then carried out a classification analysis focused on the physical features of the transmembrane proteins that are differentially expressed in primary cancers metastasized to brain vs. those to other organs. Then a second classification analysis is conducted for the same problem but utilizing expressed intracellular enzymes. Together the two classification analyses provide novel insights about the molecular factors that will enable metastasizing cancer cells to cross the BBB and that help the metastasizing cells to survive and thrive in the brain microenvironment.
Our predictions are largely supported by published studies. The insights gained here have considerably extended the state-of-the-art understanding about brain metastasis. In addition, these insights generalize the seed-soil hypothesis by Stephan Paget as the study shows that it requires more than just the level of match between the seed and the soil as the ability to get to the destination is an independent and a key factor. The tools developed here could be used to predict the potential for brain metastasis for given transcriptomic data of primary cancers.
RNA-seq data of 573 primary tumor samples of 22 cancer types, known to have metastasized, are retrieved from TCGA (Read-count and TPM values) (14). Of these, 44 have brain metastasis, denoted as BMPs (brain-metastasized primary tumors) and 529 have metastasized to bone, liver, and lung but not brain, denoted as NBMPs (non-brain-metastasized primary tumors). The NBMP samples are further divided into three subgroups according to the destination organ of the metastasis, denoted by NBMP-bone (113 samples), NBMP-liver (215 samples), and NBMP-lung (261 samples), respectively. In addition, 146 samples of primary brain cancer: glioblastoma multiforme (TCGA-GBM) are also downloaded from TCGA and used for comparison purposes. The detailed information about these samples is given in Supplementary Table S1.
The amino acid sequences in the extracellular regions of each plasma transmembrane protein are collected from Uniprot (15). The 2,779 human enzyme genes are collected from BioCyc (16). The detailed reaction information catalyzed by each enzyme is retrieved from Uniprot, whose functional information is collected from Human Protein Atlas (17) and GeneCards (18).
Normalization of the RNA-seq data from different sources is done using Recount3 (19). The R function “DESeq” in package “DESeq2” is used for calculation of the differentially expressed genes (DEGs) between two group of samples. For read-count data, genes with |log2 FC| ≥ 1 having P-values< 0.05 are considered as DEGs, with FC being for fold change.
Function “corr.test” in the R package “psych” is used to calculate the Pearson correlation coefficient (PCC) between the expression profiles of two genes. Expression pairs with PCC > 0.6 having P-value< 0.0001 are deemed as being statistically co-expressed. The R function “GSVA” in package “GSVA” (20) is used to estimate the expression level of a gene set. This function is utilized to estimate the level of Fenton reaction using a set of 64 genes obtained from (21) (see Section 3.2)
Pathway enrichment is conducted over a given set of genes against three databases: KEGG (22), REACTOME (23), and GO Biological Process (24). Enriched pathways with P-value< 0.0001 are utilized in our analyses.
Function “SVC” in Python is used to build a support vector machine (SVM)-based classifier to classify between the BMP and NBMP samples in terms of the provided data, including gene expressions. A Gaussian kernel is applied, with the parameter “class_weight” set to “balanced”. Before the classification analysis, function “RFE”, for executing the support vector machine-recursive feature elimination (SVM-RFE) algorithm, is used to rank the contribution by each enzyme gene to the BMP/NBMP classification result and to select the most contributing factors for the final classification. A five-fold cross validation is utilized to validate the classification model. Receiver operating characteristic (ROC) curves and the area under the curve (AUC) are used to evaluate the classification performance.
Two key characteristics, namely specific physical features of the extracellular components of the expressed transmembrane proteins and the activity levels of selected intracellular enzymes, are found to be able to well distinguish between cancers that can metastasize to brain and those that cannot. Details follow.
Our hypothesis is that cancer cells that metastasize to brain must be able to go through the BBB. Published studies have shown that it is relatively easy for lipophilic molecules with low molecular weights and overall positive charges to cross the BBB (25–27). The reason for such results is that all cells’ plasma membrane, including the BBB endothelial cells, is lipophilic and negatively charged; and the tight junctions connecting such cells generally permit only small molecules (25–27). However, little is known about what characteristics a cell must have for it to go through the BBB. Our goal here is to identify features that can distinguish primary cancer cells that metastasize to brain vs. those that cannot, focusing on cell-surface proteins.
We have examined all the differentially expressed genes between BMP and NBMP samples (Table S2A), totaling 100 transmembrane proteins with 97 being downregulated and three upregulated in BMP vs. NBMP, as shown in Table S2B. We have then calculated the following features of the extracellular components of each such protein: the number of charges, the total molecular weight, and the hydropathy index, as defined in (1) - (5):
where EP(i) denotes the number of positive charges in the extracellular component of the ith transmembrane protein (NOTE: subsequences with< 10 amino acids are omitted since their locations are too close to the cell membrane to be useful for the classification, which is determined empirically), and NR(i), NH(i) and NK(i) represent the numbers of the amino acids arginine, histidine, and lysine in the extracellular parts of the protein, respectively, covering all amino acids each carrying a positive charge (Table S2C); similarly, EN(i) denotes the number of negative charges in the extracellular space of the ith transmembrane protein; and ND(i) and NE(i) are for the numbers of aspartate and glutamate, respectively, each carrying a negative charge; EW(i) denotes the total molecular weight of the extracellular components in the ith transmembrane protein, with vector W representing the molecular weight for each of the 20 amino acids (Table S2C), vector N(i) being the number of each of the 20 amino acids in the extracellular parts of the ith protein, and “·” for the inner product; and similarly, EH(i) represents the total extracellular hydropathy index of the ith transmembrane protein, with vector H being the hydropathy index for each of the 20 amino acids (Table S2C). The calculation results for the two classes of samples are shown in Table S2B and Table 1.
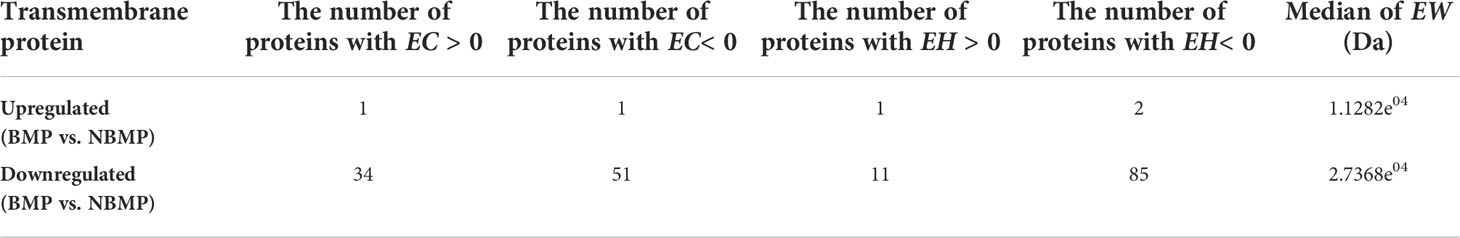
Table 1 Statistics of the extracellular physical characteristics of differentially expressed transmembrane proteins between BMPs and NBMPs.
We note from Table 1 that more than 50% (51/97) of the downregulated transmembrane proteins in BMP have negative total charges in their extracellular region, while 35% (34/97) and 12% (12/97) of them have positive and neutral total charges, respectively. In addition, more than 85% (85/97) of the downregulated proteins have negative EH values. Furthermore, the median EW value of the downregulated proteins is more than 20,000 Da, which is more than twice of that of the upregulated transmembrane proteins. These results indicate that BMP cells tend to have reduced or even inhibited cell-surface molecules with negative charges, of hydrophilic, and higher molecular weights in their expressed transmembrane proteins.
It is noteworthy that only three of the 100 differentially expressed transmembrane proteins are upregulated in BMP vs. NBMP: DLL3, OPRD1, and PLP1, where both DLL3 and OPRD1 play inhibitory roles in neurogenesis and neural activities, and PLP1 is a proteolipid protein that can covalently link with lipids (17).
Overall, the above data suggest that BMPs tend to reduce the physical characteristics that prevent cells from going through the BBB (25–27). Our pathway enrichment analyses over the 97 downregulated transmembrane proteins reveal that the most suppressed functions are transporters and channels (60/116 pathways), followed by cell-cell adhesion and communications (19/116 pathways), and complex neural functions such as synapse activities and muscle contraction (15/116 pathways), accounting for over 81% of all the repressed pathways (Table S2D). As a summary, (i) cancers tend to suppress cell polarity genes, which include the transportation system and cell-cell adhesion (28) and; (ii) the synapse activity and muscle contraction (28, 29), hence consistent with the above feature-based analyses as well as the published studies (25–27).
Based on the analysis results, we have calculated the following four values as the main features for the BMP vs. NBMP classification:
where SEP and SEN denote the total extracellularly positive and negative charges carried by the 100 differentially expressed transmembrane proteins, respectively, with Pibeing the gene expression of the ith transmembrane protein; and S
EW and SEH are for the total molecular weight and hydropathy index values of the 100 proteins, respectively. The medians of SEP, SEN, SEW, and SEH for BMP, NBMP, NBMP-bone, NBMP-liver, and NBMP-lung samples are given in Table S2E, showing that the BMP samples have the lowest median value for all of the four features, among the five groups, and hence indicating that each of the selected physical characteristics is highly discerning in separating BMPs from each of the three NBMP groups. In addition, the median SEP is higher than that of SEN for BMP samples, indicating the 100 transmembrane proteins have a positive total charge on the extracellular components of BMP cells, which is different from that of each NBMP subgroup. The median of the four features on GBM samples show patterns similar to those of NBMPs rather than BMPs. This is presumably because the primary brain cancer cells grow directly in brain central nervous system (CNS) and do not need to cross the BBB.
We have then conducted a classification analysis between BMPs and NBMPs based on these four features calculated for each sample, using an SVM-based classifier (see Method). A five-fold cross validation shows that this model achieves an AUC = 0.74, as shown in Figure 1A. This provides strong evidence that the above identified physical features play a key role in dictating if a cancer can metastasize to brain or not. Our next question is: are there other independent features that may further define the characteristics of primary cancer cells that can metastasize to brain or not?
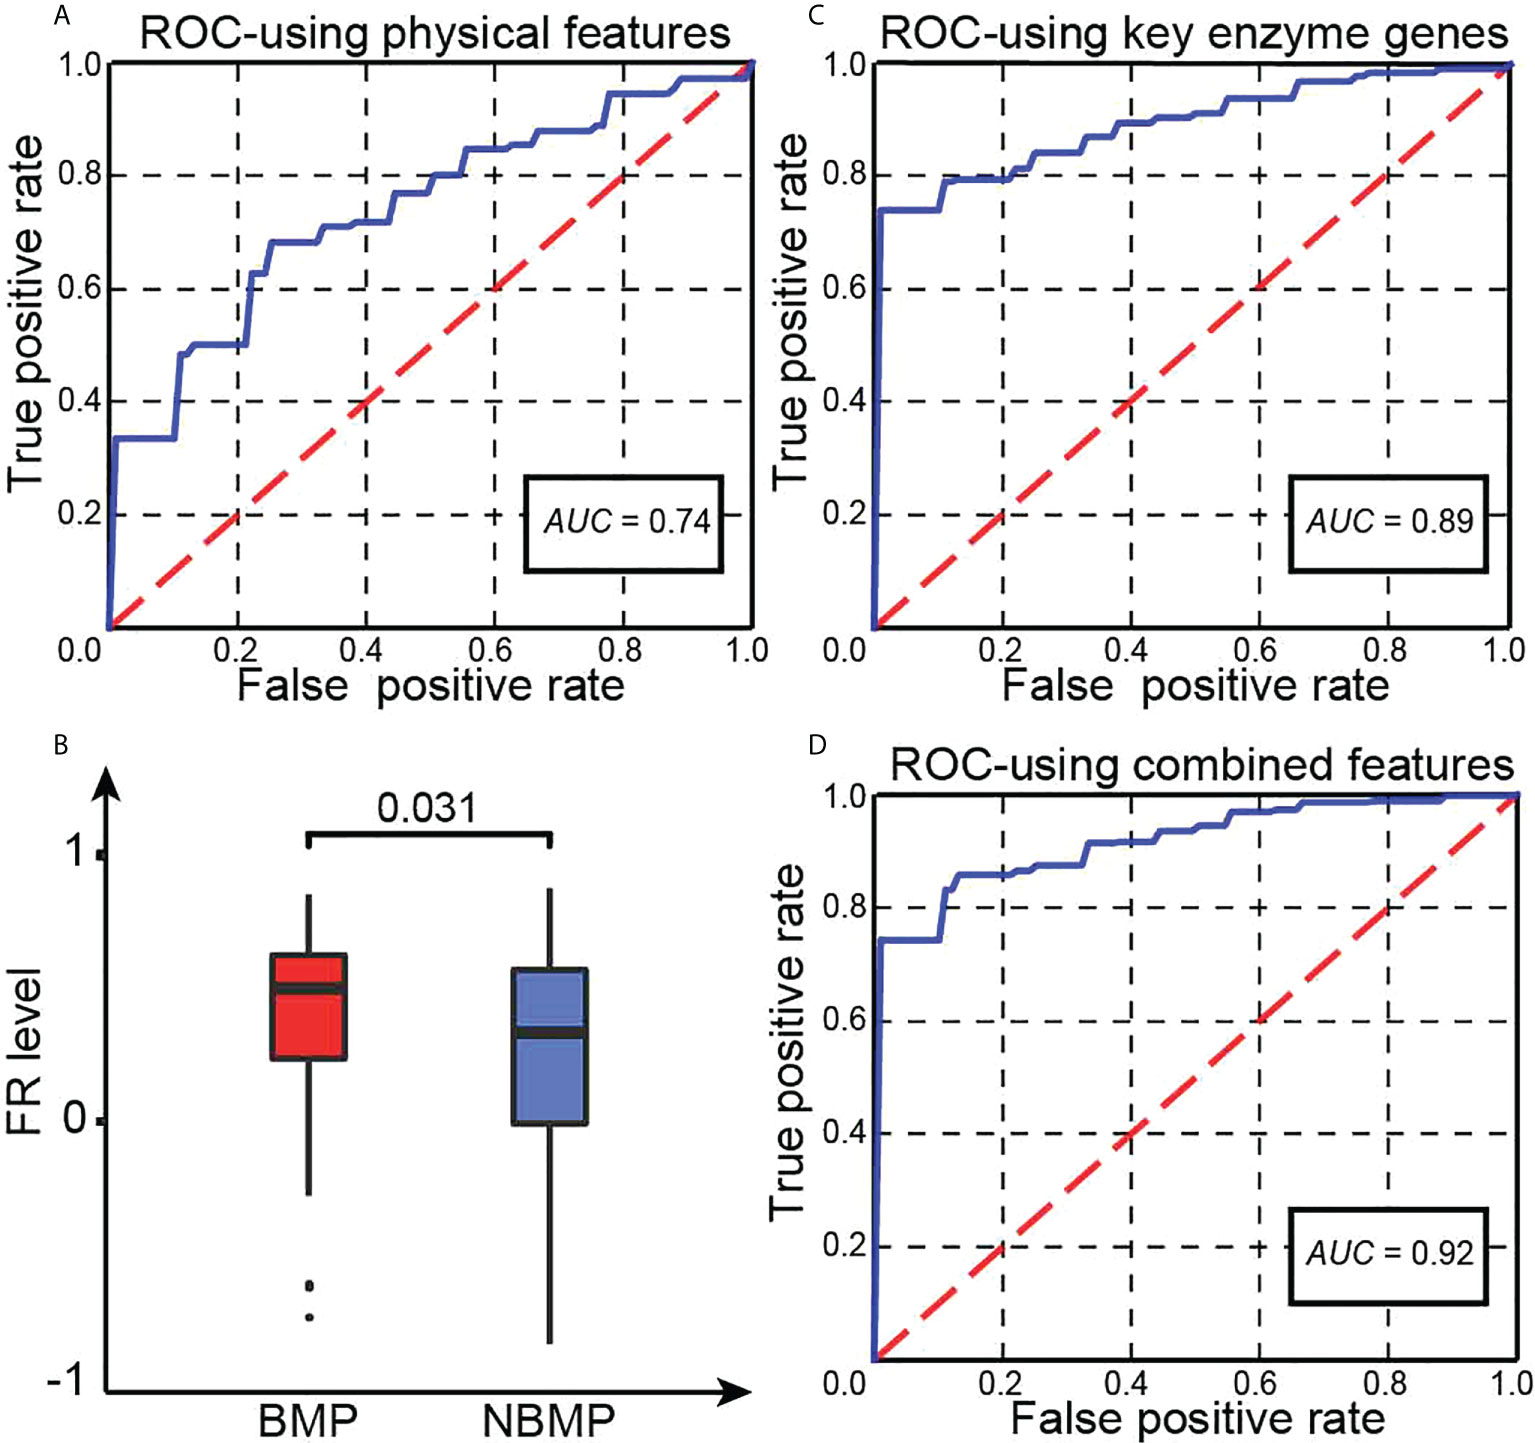
Figure 1 Key statistics. (A) The ROC curve of our trained classifier using four physical features. (B) Predicted FR levels in BMPs and NBMPs. (C) The ROC curve of our second classifier based on the expressions of the 20 selected enzymes. (D) The ROC curve of the integrated classifier using the combined features.
While the above analyses are focused on identification of distinguishing cell-surface characteristics of BMPs vs. NBMPs, we study here if the metastasized cancer cells to brain may possess specific functionalities, defined by their activated enzymes, which make the brain-metastasized cells fit well with the brain microenvironment, as Stephen Paget proposed over 130 years ago about cancer metastasis (3).
We have previously demonstrated that most, possibly all, cancers are under persistent intracellular alkalosis, ultimately due to chronical inflammation coupled with iron overload at the tumor sites, which gives rise to a (repeated) inorganic reaction, called Fenton reaction (FR): Fe2+ + H2O2 → Fe3+ + OH– + HO· to continuously producing OH- when reducing molecules of Fe3+ are available around the reaction, which are largely superoxide () released by innate immune cells (21, 30). As response, the affected cells activate a range of reprogrammed metabolisms (RMs) to produce protons collectively at a comparable rate of OH- production by repeated Fenton reactions, which can be rewritten as with Fe2+ as a catalyst. Our analyses have revealed that while different cancer cells in TCGA may employ a distinct set of proton-producing RMs, they share a number of RMs, such as de novo nucleotide biosynthesis and biosynthesis and deployment of sialic acids (30). The study has provided strong evidence that the distinct set of RMs employed by different subtypes of cancers results in the unique behaviors of individual subtypes of cancers (21, 30, 31).
We have examined the levels of cytosolic FR in BMP and NBMP samples, using the gene set obtained in (21) (Table S3A), with results summarized in Figure 1B. We note: BMPs have a considerably higher average level of FRs than that in NBMPs (P-value< 0.05), revealing that BMPs are facing stronger alkalosis, hence stronger neutralizing RMs.
To identify the set of unique enzymes induced to respond to the alkalosis in BMPs, we have utilized SVM-RFE (see Methods) to conduct a classification along with feature selection between BMPs and NBMPs to identify a minimal set of enzymes whose gene expressions can collectively best distinguish the two sets of tumor samples. Using this method, we have obtained the following 20 most discerning enzymes: ARSA, CANT1, CASK, CERK, EPHA4, EPHX2, EYA4, EZH2, FMO6P, FYN, GCAT, GLYATL2, MYO3A, NMNAT2, PDE11A, PDE3A, PGLS, ULK1, XDH, YARS1, out of all the 2,779 expressed enzyme genes (Table S3B). The median TPM values of these 20 genes for BMP, NBMP, NBMP-bone, NBMP-liver, and NBMP-lung samples are recorded in Table S3C, showing that the BMP group tend to have the highest expressions for most of these enzymes. The subsequent five-fold cross validation of the classification result using the expressions of the 20 enzymes achieves an AUC = 0.89, as shown in Figure 1C. The functions of the 20 enzymes are summarized in Table S3D.
To gain a cellular level understanding about the distinct functions offered collectively by these enzymes, detailed functional analyses are conducted. First, 16 of the 20 enzymes each catalyze H+-producing reactions based on the information from Uniprot (15), shown in Tables 2 and S3D, and all the 16 enzymes have higher expressions in BMPs vs. NBMPs (Figure 2 and Table 2). Furthermore, all the 20 enzymes are expressed in brain or the CNS (Table S3D) and play roles that could potentially help their host cells to better survive in the brain environment. It is noteworthy that these results highly consistent with the results summarized in Table S3C and Figure 2 as the CNS-originated GBMs have the highest expressions for most of the 20 enzymes.
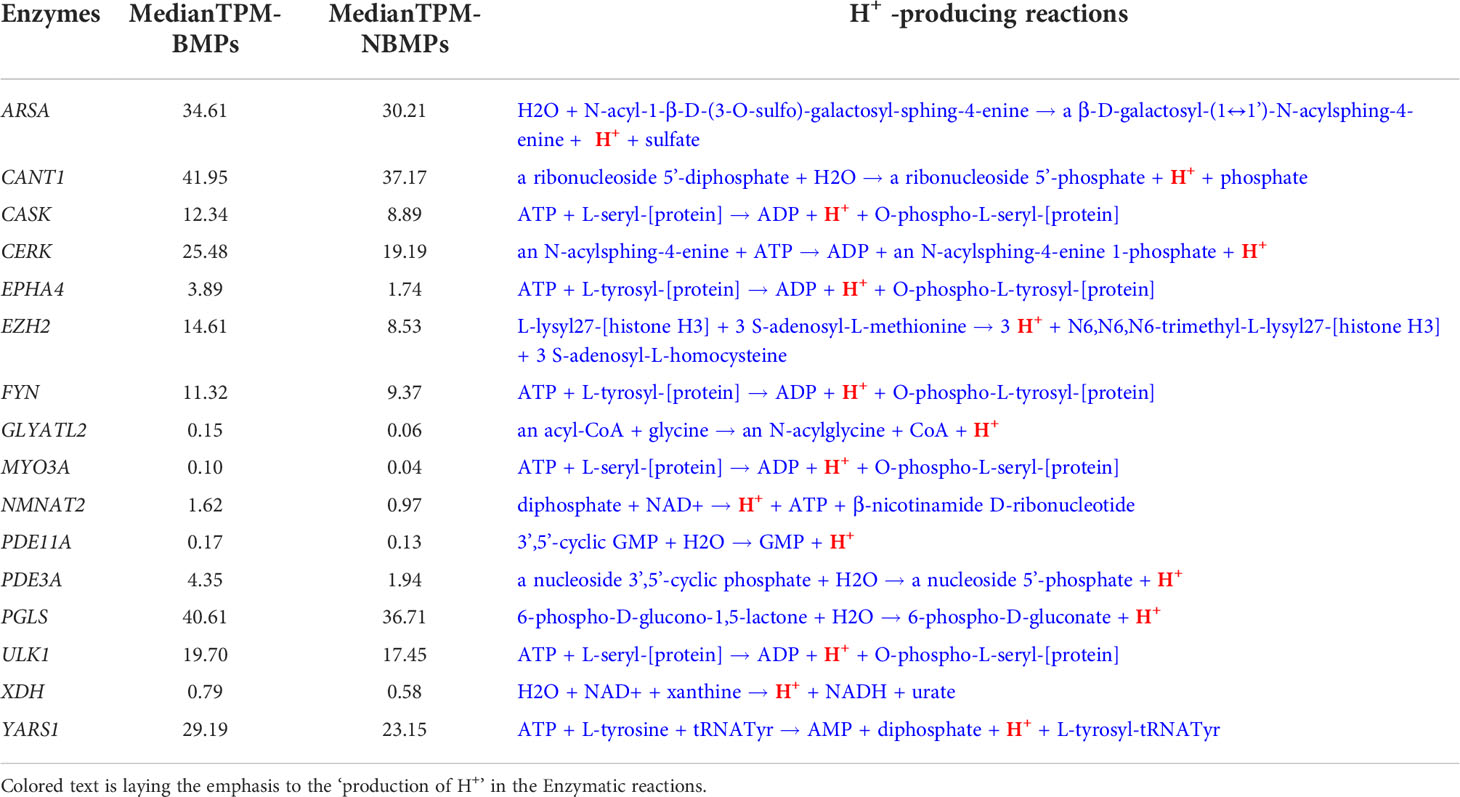
Table 2 H+ -producing reactions catalyzed by 16 selected enzymes.
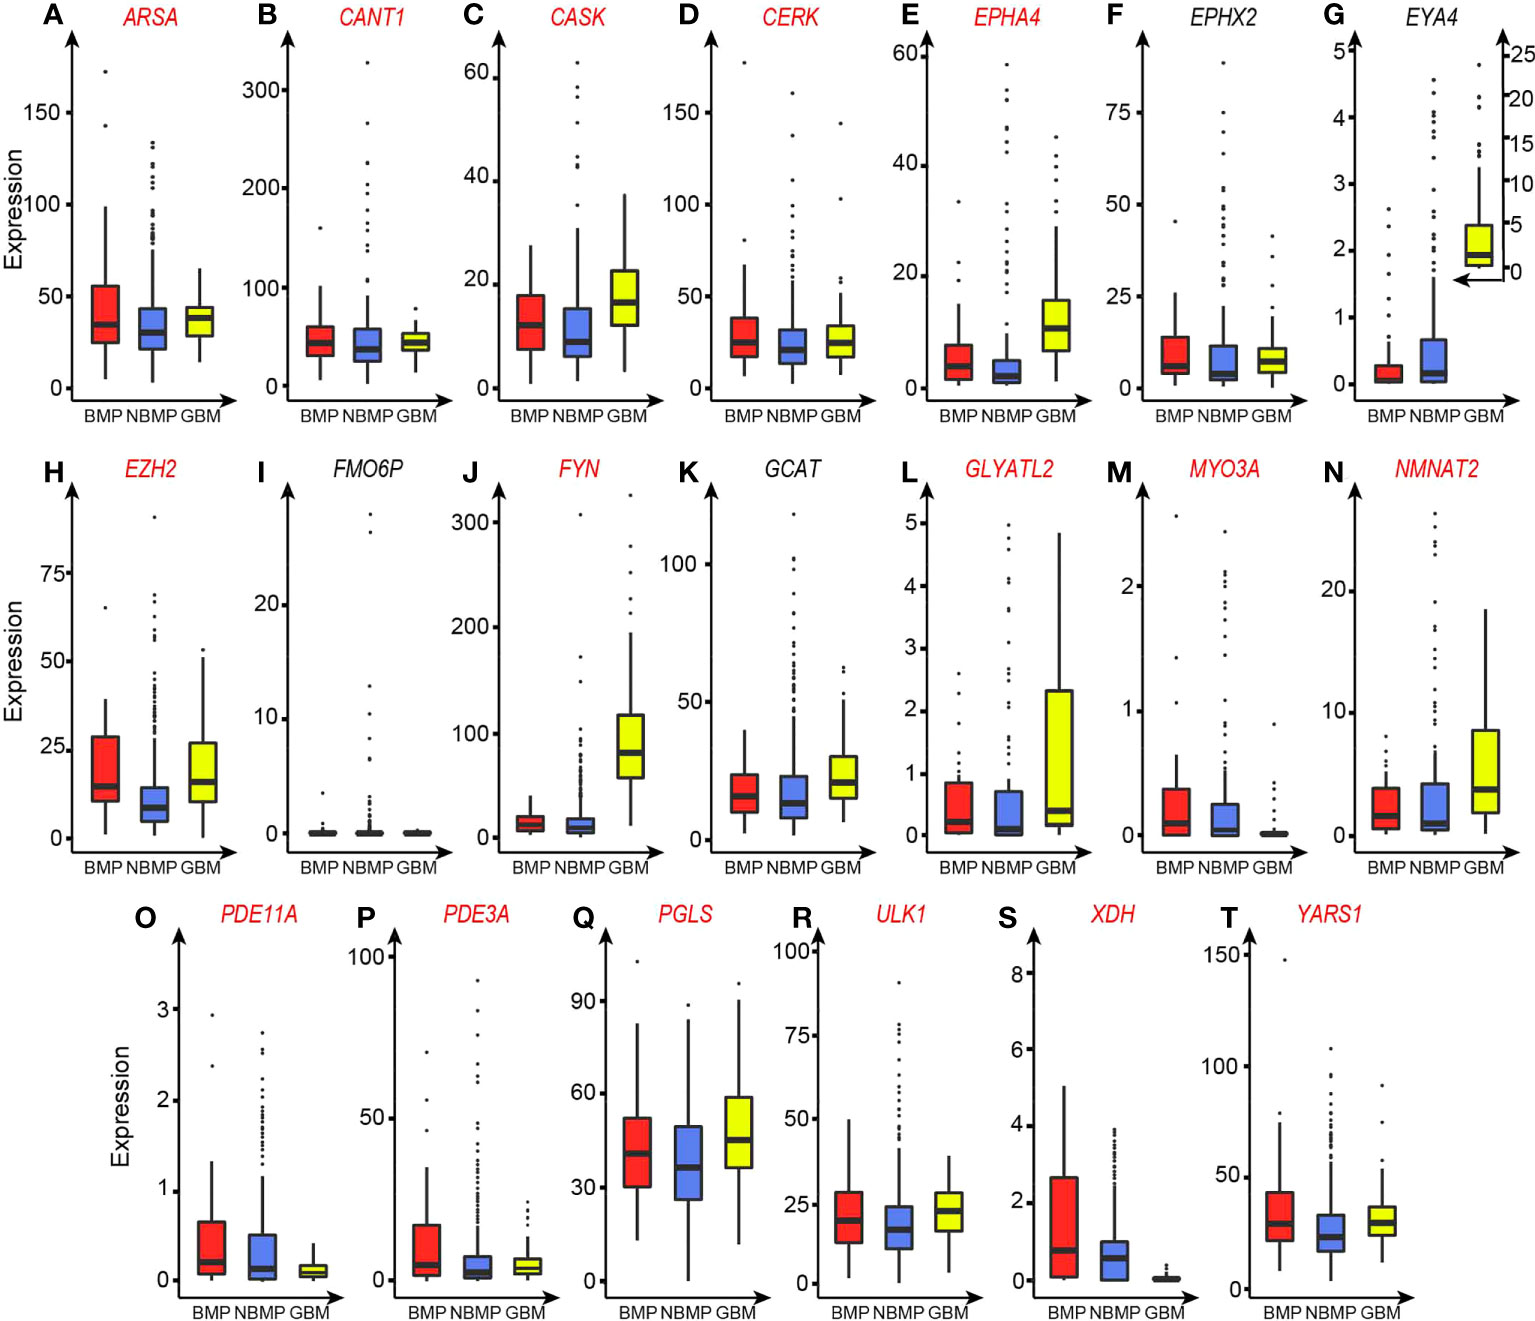
Figure 2 TPM-based expression levels of the 20 selected enzyme genes. Enzymes that catalyze H+-producing reactions are marked in red. (A) ARSA. (B) CANT1. (C) CASK. (D) CERK. (E) EPHA4. (F) EPHX2. (G) EYA4. (H) EZH2. (I) FMO6P. (J) FYN. (K) GCAT. (L) GLYATL2. (M) MYO3A. (N) NMNAT2. (O) PDE11A. (P) PDE3A. (Q) PGLS. (R) ULK1. (S) XDH. (T) YARS1.
Published studies suggest that brain-metastasizing tumor cells need to alter their metabolisms to gain brain-like and neuron-like properties for brain metastasis (13, 32–34). For example, brain metastasized tumor cells need to overcome stressors from the antimetastatic behaviors by reactive astrocytes in brain CNS, through increasing their brain-like and neuron-like properties to evade attacks from the reactive astrocytes and even to transform to chemo-protectors (7, 13, 33). In addition, metabolic changes have been demonstrated to serve as the foundation for enhanced cancerous cell division and survival in brain CNS (32).
We have checked the functions of the 20 enzymes (Table S3D). ARSA, a regulator of neuron myelination, can boost the neuronal survival and differentiation (35). CASK regulates the development of brain neurons (36), hence providing a range of capabilities for cell survival. CERK is highly expressed in cerebellar Purkinje cells and converts ceramide to a sphingolipid (37), which is known to play powerful roles in dealing with oxidative stress (38). EPHA4 meditates motor neuron death and regulates axon guidance and proliferation of neural stem cells (39), hence having the capabilities for overcoming stresses. EPHX2 alters neuronal susceptibility to ischemic cell death (40), another survival related gene. EZH2 is important for neuronal survival and regulates the self-renewal and differentiation of cells in the cerebral cortex (41, 42). FYN tempers excitatory and inhibitory synaptic transmission stimuli of neurons (43) and is a key responder to oxidative stress (44). NMNAT2 acts as an essential axon maintenance factor of neurons (45) and its overexpression can ameliorate oxidative stress (46). PDE11A is highly expressed in hippocampus and plays key roles in inflammation modulation (47). ULK1 works in brain iron accumulation and regulates the autophagy-mediated cell survival of brain-metastasized tumor cells (48). XDH is needed for neuronal survival via maintenance of cold tolerance (49). PGLS is a marker gene for brain-derived cells, associated with cell redox homeostasis, and regulates the viability of breast tumor cells in the brain microenvironment (32). These indicate that all these genes have capabilities in cell survival, stress adaption, and inflammation management. In addition, literature reviews show that most of these enzymes have been reported to be relevant to cancer metastasis, especially brain metastasis, as summarized in Table S3D.
To further investigate the functions of these 20 enzymes in BMPs, we have conducted a co-expression analysis between the 20 enzymes genes and all the other expressed enzyme genes in BMPs, and obtained 27 additional enzyme genes that strongly co-express with at least one of the 20 genes (Table S3E), which is followed by a pathway-enrichment analysis over the 47 genes, giving rise to 170 upregulated pathways (no downregulated pathway are obtained), listed in Table S3F.
We note from the table that the 170 pathways fall largely into two groups, cell-cycle related pathways (74/170) and metabolic pathways (58/170). The enriched cell-cycle activities are consistent with the published studies reporting that brain metastases generally require highly increased cell-cycle activities (32–34). Out of the 58 metabolic pathways, 27 are related to nucleotide metabolism; 8 are relevant to epigenomic activities, such as histone modification and methyltransferase; 13 related to phosphorylation/dephosphorylation; and 10 are involved in second messenger signaling.
Our previous study has established that nucleotide biosynthesis is the most powerful proton-producer (21), which is induced by vast majority, possibly all cancers in TCGA, to neutralize the persistently produced OH- by FRs; and the rate of cell division is predominantly dictated by the rate of nucleotide biosynthesis (30), hence the observed increased nucleotide metabolism is consistent with the elevated cell-cycle progression and faster cell division.
The higher levels of epigenomic activities suggest that more stress-response activities are induced in the BMPs compared to NBMPs. It is well known that the increased epigenomic activities tend to be induced to assist the host cells to cope with persistent and severe stressors (50). Therefore, cells in BMPs are prepared better to cope with new stressors in the brain microenvironment.
Furthermore, it has long been observed that cancers tend to overexpress a large number of kinases (51), which is a result of alkalosis-responding metabolic reprogramming as each phosphorylation act creates one net proton (30). The increased phosphorylation will activate more enzymes, which makes the overall metabolism more active. We postulate that the more activated enzymatic functions in BMPs will equip the host cells with more capabilities to overcome the new stressors in the brain environment.
The cAMP and cGMP signaling system is a key second messenger and involved in a wide range of cellular functions. This system is mostly repressed in primary cancers since it involves the E3 ubiquitin ligases, which are known to be generally repressed in cancer (52, 53). The unique feature of upregulated cAMP and cGMP signaling may make the host cells more adaptable to the stressful CNS microenvironment (54, 55). The unique feature of BMPs over-expressing and utilizing the system may give the host cells a powerful way to utilize a wide range of cellular functions, which may be limited in other primary cancer cells.
Overall, our analyses have revealed that the BMPs have a unique collection of functional capabilities that can help the host cells to better survive the brain microenvironment.
We have conducted a classification prediction between the BMP and NBMP samples based on the physical features as shown in Equations (6) - (9) along with the expression data of the 20 selected enzymes, using an SVM model. Five-fold cross validation shows that the model achieves AUC = 0.92, as shown in Figure 1D. This AUC is higher than individual models trained on the physical features and on the enzyme expressions, separately, hence indicating that information from both categories contributes to the classification performance between BMPs and NBMPs.
Based on this, we predict that the physical features define largely the types of metastasizing cells can go through the BBBs to reach the internal parts of a brain and the enzymes may define the characteristics of primary cancer cells that survive and thrive in the brain microenvironment. Compared with published studies on prediction of brain metastasis for primary tumors, our model shows higher or comparable accuracy (56, 57), but has two key superiorities: (i) the features used in our model are strongly supported by published studies and provide strong information about the key mechanisms of brain metastasis; and (ii) the primary locations of BMPs are not limited to one organ instead any organs, strongly suggesting that our predicted mechanism captures something fundamental.
Through modeling of the extracellular amino acid sequences of transmembrane proteins and gene-expressions of specifically expressed intracellular enzymes in BMPs, we have identified discerning features that can well distinguish BMPs from NBMPs, from which we have predicted the distinguishing characteristics of BMPs, namely (i) the physical features of the expressed transmembrane proteins that BMPs should have; and (ii) the expression patterns that specific enzymes should have. Our predictions are highly consistent with a wide range of published literature and extend the current model of BMP cancers. In addition, a key novelty of this work is that we have examined the question of brain metastasis at the basic physics and chemistry level, rather than the typical approaches that study cancer biology at the biomolecular levels, namely signaling, mutations and regulatory events. We anticipate that the approach used here should be applicable to elucidation of molecular basis for other cancer subtyping problems, including metastases to other organs, cancers of different levels of malignancy, cancers with distinct levels of drug resistance among possibly others.
Information gained here could possibly applied to drug target identification for stopping brain metastases through inhibiting the most contributing transmembrane proteins and/or intracellular enzymes in BMPs via drug repurposing as multiple proteins and enzymes identified in our study have known drugs, such as Amitriptyline for protein OPRD1, Suramin for enzyme ARSA, and Tazemetostat for enzyme EZH2 (15).
Further improvement will involve quantification of the statistical and qualitative models developed here, which has limited the level of resolution of our results. For example, our analyses have revealed that a key property of the identified enzymes in BMPs is that they mostly catalyze H+-producing reactions. However, we could not inform the relative levels of H+ productions by different enzymes in BMP cancer cells, while such information could prove to be essential for drug target identification for possibly stopping brain metastases. One possible way to make our models more quantitative is through representing the models as a set of Michaelis-Menten equations as done in our previous studies (21, 58).
The original contributions presented in the study are included in the article/Supplementary Material. Further inquiries can be directed to the corresponding author.
DL is for design of methods, programming, paper writing and revising. JB is for design of methods and programming. YX is for design of methods and paper writing and revising. QC, RT, ZA, JX, and YQ are for data collection and processing. All authors contributed to the article and approved the submitted version.
The correspondence author thanks Georgia Research Alliance for continuous support to his lab since 2003.
The authors declare that the research was conducted in the absence of any commercial or financial relationships that could be construed as a potential conflict of interest.
All claims expressed in this article are solely those of the authors and do not necessarily represent those of their affiliated organizations, or those of the publisher, the editors and the reviewers. Any product that may be evaluated in this article, or claim that may be made by its manufacturer, is not guaranteed or endorsed by the publisher.
The Supplementary Material for this article can be found online at: https://www.frontiersin.org/articles/10.3389/fonc.2022.1003715/full#supplementary-material
1. Riihimaki M, Thomsen H, Sundquist K, Sundquist J, Hemminki K. Clinical landscape of cancer metastases. Cancer Med (2018) 7(11):5534–42. doi: 10.1002/cam4.1697
2. Fares J, Fares MY, Khachfe HH, Salhab HA, Fares Y. Molecular principles of metastasis: A hallmark of cancer revisited. Signal Transduct Target Ther (2020) 5(1):28. doi: 10.1038/s41392-020-0134-x
3. Paget S. The distribution of secondary growths in cancer of the breast. 1889. Cancer Metastasis Rev (1989) 8(2):98–101. doi: 10.1016/S0140-6736(00)49915-0
4. Rusciano D, Burger MM. Why do cancer cells metastasize into particular organs? Bioessays (1992) 14(3):185–94. doi: 10.1002/bies.950140309
5. Ballabh P, Braun A, Nedergaard M. The blood-brain barrier: An overview: Structure, regulation, and clinical implications. Neurobiol Dis (2004) 16(1):1–13. doi: 10.1016/j.nbd.2003.12.016
6. Martin TA. The role of tight junctions in cancer metastasis. Semin Cell Dev Biol (2014) 36:224–31. doi: 10.1016/j.semcdb.2014.09.008
7. Wasilewski D, Priego N, Fustero-Torre C, Valiente M. Reactive astrocytes in brain metastasis. Front Oncol (2017) 7:298. doi: 10.3389/fonc.2017.00298
8. Boire A, Brastianos PK, Garzia L, Valiente M. Brain metastasis. Nat Rev Cancer (2020) 20(1):4–11. doi: 10.1038/s41568-019-0220-y
9. Bos PD, Zhang XH, Nadal C, Shu W, Gomis RR, Nguyen DX, et al. Genes that mediate breast cancer metastasis to the brain. Nature (2009) 459(7249):1005–9. doi: 10.1038/nature08021
10. Cheng X, Hung MC. Breast cancer brain metastases. Cancer Metastasis Rev (2007) 26(3-4):635–43. doi: 10.1007/s10555-007-9083-x
11. Xing F, Kobayashi A, Okuda H, Watabe M, Pai SK, Pandey PR, et al. Reactive astrocytes promote the metastatic growth of breast cancer stem-like cells by activating notch signalling in brain. EMBO Mol Med (2013) 5(3):384–96. doi: 10.1002/emmm.201201623
12. Valiente M, Obenauf AC, Jin X, Chen Q, Zhang XH, Lee DJ, et al. Serpins promote cancer cell survival and vascular Co-option in brain metastasis. Cell (2014) 156(5):1002–16. doi: 10.1016/j.cell.2014.01.040
13. Neman J, Termini J, Wilczynski S, Vaidehi N, Choy C, Kowolik CM, et al. Human breast cancer metastases to the brain display gabaergic properties in the neural niche. Proc Natl Acad Sci U.S.A. (2014) 111(3):984–9. doi: 10.1073/pnas.1322098111
14. Tomczak K, Czerwinska P, Wiznerowicz M. The cancer genome atlas (Tcga): An immeasurable source of knowledge. Contemp Oncol (Pozn) (2015) 19(1A):A68–77. doi: 10.5114/wo.2014.47136
15. UniProt C. Uniprot: A hub for protein information. Nucleic Acids Res (2015) 43(Database issue):D204–12. doi: 10.1093/nar/gku989
16. Karp PD, Billington R, Caspi R, Fulcher CA, Latendresse M, Kothari A, et al. The biocyc collection of microbial genomes and metabolic pathways. Brief Bioinform (2019) 20(4):1085–93. doi: 10.1093/bib/bbx085
17. Uhlen M, Fagerberg L, Hallstrom BM, Lindskog C, Oksvold P, Mardinoglu A, et al. Proteomics. tissue-based map of the human proteome. Science (2015) 347(6220):1260419. doi: 10.1126/science.1260419
18. Safran M, Dalah I, Alexander J, Rosen N, Iny Stein T, Shmoish M, et al. Genecards version 3: The human gene integrator. Database (Oxford) (2010) 2010:baq020. doi: 10.1093/database/baq020
19. Wilks C, Zheng SC, Chen FY, Charles R, Solomon B, Ling JP, et al. Recount3: Summaries and queries for Large-scale rna-seq expression and splicing. Genome Biol (2021) 22(1):323. doi: 10.1186/s13059-021-02533-6
20. Hanzelmann S, Castelo R, Guinney J. Gsva: Gene set variation analysis for microarray and rna-seq data. BMC Bioinf (2013) 14:7. doi: 10.1186/1471-2105-14-7
21. Sun H, Zhang C, Cao S, Sheng T, Dong N, Xu Y. Fenton reactions drive nucleotide and atp syntheses in cancer. J Mol Cell Biol (2018) 10(5):448–59. doi: 10.1093/jmcb/mjy039
22. Kanehisa M, Goto S. Kegg: Kyoto encyclopedia of genes and genomes. Nucleic Acids Res (2000) 28(1):27–30. doi: 10.1093/nar/28.1.27
23. Fabregat A, Jupe S, Matthews L, Sidiropoulos K, Gillespie M, Garapati P, et al. The reactome pathway knowledgebase. Nucleic Acids Res (2018) 46(D1):D649–55. doi: 10.1093/nar/gkx1132
24. Ashburner M, Ball CA, Blake JA, Botstein D, Butler H, Cherry JM, et al. Gene ontology: Tool for the unification of biology. the gene ontology consortium. Nat Genet (2000) 25(1):25–9. doi: 10.1038/75556
25. Bellettato CM, Scarpa M. Possible strategies to cross the blood-brain barrier. Ital J Pediatr (2018) 44(Suppl 2):131. doi: 10.1186/s13052-018-0563-0
26. Tajes M, Ramos-Fernandez E, Weng-Jiang X, Bosch-Morato M, Guivernau B, Eraso-Pichot A, et al. The blood-brain barrier: Structure, function and therapeutic approaches to cross it. Mol Membr Biol (2014) 31(5):152–67. doi: 10.3109/09687688.2014.937468
27. Pardridge WM. Blood-brain barrier delivery. Drug Discov Today (2007) 12(1-2):54–61. doi: 10.1016/j.drudis.2006.10.013
28. Wodarz A, Nathke I. Cell polarity in development and cancer. Nat Cell Biol (2007) 9(9):1016–24. doi: 10.1038/ncb433
29. Amano M, Nakayama M, Kaibuchi K. Rho-Kinase/Rock: A key regulator of the cytoskeleton and cell polarity. Cytoskeleton (Hoboken) (2010) 67(9):545–54. doi: 10.1002/cm.20472
30. Sun H, Zhou Y, Skaro MF, Wu Y, Qu Z, Mao F, et al. Metabolic reprogramming in cancer is induced to increase proton production. Cancer Res (2020) 80(5):1143–55. doi: 10.1158/0008-5472.CAN-19-3392
31. Zhou Y, Chang W, Lu X, Wang J, Zhang C, Xu Y. Acid-base homeostasis and implications to the phenotypic behaviors of cancer. Genomics Proteomics Bioinf (2022) S1672-0229(22):00080-8. doi: 10.1016/j.gpb.2022.06.003
32. Chen EI, Hewel J, Krueger JS, Tiraby C, Weber MR, Kralli A, et al. Adaptation of energy metabolism in breast cancer brain metastases. Cancer Res (2007) 67(4):1472–86. doi: 10.1158/0008-5472.CAN-06-3137
33. Van Swearingen AE, Siegel MB, Anders CK. Breast cancer brain metastases: Evidence for neuronal-like adaptation in a 'Breast-to-Brain' transition? Breast Cancer Res (2014) 16(3):304. doi: 10.1186/bcr3651
34. Wingrove E, Liu ZZ, Patel KD, Arnal-Estape A, Cai WL, Melnick MA, et al. Transcriptomic hallmarks of tumor plasticity and stromal interactions in brain metastasis. Cell Rep (2019) 27(4):1277–92.e7. doi: 10.1016/j.celrep.2019.03.085
35. Doerr J, Bockenhoff A, Ewald B, Ladewig J, Eckhardt M, Gieselmann V, et al. Arylsulfatase a overexpressing human ipsc-derived neural cells reduce cns sulfatide storage in a mouse model of metachromatic leukodystrophy. Mol Ther (2015) 23(9):1519–31. doi: 10.1038/mt.2015.106
36. Huang TN, Hsueh YP. Calcium/Calmodulin-dependent serine protein kinase (Cask), a protein implicated in mental retardation and autism-spectrum disorders, interacts with T-Brain-1 (Tbr1) to control extinction of associative memory in Male mice. J Psychiatry Neurosci (2017) 42(1):37–47. doi: 10.1503/jpn.150359
37. Mitsutake S, Yokose U, Kato M, Matsuoka I, Yoo JM, Kim TJ, et al. The generation and behavioral analysis of ceramide kinase-null mice, indicating a function in cerebellar purkinje cells. Biochem Biophys Res Commun (2007) 363(3):519–24. doi: 10.1016/j.bbrc.2007.09.010
38. Andrieu-Abadie N, Gouaze V, Salvayre R, Levade T. Ceramide in apoptosis signaling: Relationship with oxidative stress. Free Radic Biol Med (2001) 31(6):717–28. doi: 10.1016/s0891-5849(01)00655-4
39. Chen Q, Song H, Liu C, Xu J, Wei C, Wang W, et al. The interaction of Epha4 with pdgfrbeta regulates proliferation and neuronal differentiation of neural progenitor cells in vitro and promotes neurogenesis in vivo. Front Aging Neurosci (2020) 12:7. doi: 10.3389/fnagi.2020.00007
40. Koerner IP, Jacks R, DeBarber AE, Koop D, Mao P, Grant DF, et al. Polymorphisms in the human soluble epoxide hydrolase gene Ephx2 linked to neuronal survival after ischemic injury. J Neurosci (2007) 27(17):4642–9. doi: 10.1523/JNEUROSCI.0056-07.2007
41. Pereira JD, Sansom SN, Smith J, Dobenecker MW, Tarakhovsky A, Livesey FJ. Ezh2, the histone methyltransferase of Prc2, regulates the balance between self-renewal and differentiation in the cerebral cortex. Proc Natl Acad Sci USA (2010) 107(36):15957–62. doi: 10.1073/pnas.1002530107
42. Wever I, von Oerthel L, Wagemans C, Smidt MP. Ezh2 influences mdda neuronal differentiation, maintenance and survival. Front Mol Neurosci (2018) 11:491. doi: 10.3389/fnmol.2018.00491
43. Matrone C, Petrillo F, Nasso R, Ferretti G. Fyn tyrosine kinase as harmonizing factor in neuronal functions and dysfunctions. Int J Mol Sci (2020) 21(12):4444. doi: 10.3390/ijms21124444
44. Sanguinetti AR, Cao H, Corley Mastick C. Fyn is required for oxidative- and hyperosmotic-Stress-Induced tyrosine phosphorylation of caveolin-1. Biochem J (2003) 376(Pt 1):159–68. doi: 10.1042/BJ20030336
45. Gilley J, Coleman MP. Endogenous Nmnat2 is an essential survival factor for maintenance of healthy axons. PloS Biol (2010) 8(1):e1000300. doi: 10.1371/journal.pbio.1000300
46. Wu X, Hu F, Zeng J, Han L, Qiu D, Wang H, et al. Nmnat2-mediated nad(+) generation is essential for quality control of aged oocytes. Aging Cell (2019) 18(3):e12955. doi: 10.1111/acel.12955
47. Kelly MP. A role for phosphodiesterase 11a (Pde11a) in the formation of social memories and the stabilization of mood. Adv Neurobiol (2017) 17:201–30. doi: 10.1007/978-3-319-58811-7_8
48. Maiti A, Hait NC. Autophagy-mediated tumor cell survival and progression of breast cancer metastasis to the brain. J Cancer (2021) 12(4):954–64. doi: 10.7150/jca.50137
49. Takagaki N, Ohta A, Ohnishi K, Kawanabe A, Minakuchi Y, Toyoda A, et al. The mechanoreceptor deg-1 regulates cold tolerance in caenorhabditis elegans. EMBO Rep (2020) 21(3):e48671. doi: 10.15252/embr.201948671
50. Baylin SB, Jones PA. Epigenetic determinants of cancer. Cold Spring Harb Perspect Biol (2016) 8(9):a019505. doi: 10.1101/cshperspect.a019505
51. Cicenas J, Zalyte E, Bairoch A, Gaudet P. Kinases and cancer. Cancers (Basel) (2018) 10(3):63. doi: 10.3390/cancers10030063
52. Lignitto L, Arcella A, Sepe M, Rinaldi L, Delle Donne R, Gallo A, et al. Proteolysis of Mob1 by the ubiquitin ligase Praja2 attenuates hippo signalling and supports glioblastoma growth. Nat Commun (2013) 4:1822. doi: 10.1038/ncomms2791
53. Rinaldi L, Delle Donne R, Catalanotti B, Torres-Quesada O, Enzler F, Moraca F, et al. Feedback inhibition of camp effector signaling by a chaperone-assisted ubiquitin system. Nat Commun (2019) 10(1):2572. doi: 10.1038/s41467-019-10037-y
54. Abdollahi M, Bahreini-Moghadam A, Emami B, Fooladian F, Zafari K. Increasing intracellular camp and cgmp inhibits cadmium-induced oxidative stress in rat submandibular saliva. Comp Biochem Physiol C Toxicol Pharmacol (2003) 135C(3):331–6. doi: 10.1016/s1532-0456(03)00120-0
55. Podda MV, Grassi C. New perspectives in cyclic nucleotide-mediated functions in the cns: The emerging role of cyclic nucleotide-gated (Cng) channels. Pflugers Arch (2014) 466(7):1241–57. doi: 10.1007/s00424-013-1373-2
56. Koh YW, Han JH, Haam S, Lee HW. An immune-related gene expression signature predicts brain metastasis in lung adenocarcinoma patients after surgery: Gene expression profile and immunohistochemical analyses. Transl Lung Cancer Res (2021) 10(2):802–14. doi: 10.21037/tlcr-20-1056
57. Kamer I, Steuerman Y, Daniel-Meshulam I, Perry G, Izraeli S, Perelman M, et al. Predicting brain metastasis in early stage non-small cell lung cancer patients by gene expression profiling. Transl Lung Cancer Res (2020) 9(3):682–92. doi: 10.21037/tlcr-19-477
Keywords: brain metastasis, metabolic reprogramming, brain microenvironment, seed-soil hypothesis, blood-brain barrier
Citation: Liu D, Bai J, Chen Q, Tan R, An Z, Xiao J, Qu Y and Xu Y (2022) Brain metastases: It takes two factors for a primary cancer to metastasize to brain. Front. Oncol. 12:1003715. doi: 10.3389/fonc.2022.1003715
Received: 26 July 2022; Accepted: 12 September 2022;
Published: 28 September 2022.
Edited by:
Hua Tan, National Human Genome Research Institute (NIH), United StatesReviewed by:
Juan Bautista Menendez Gonzalez, Harvard University, United StatesCopyright © 2022 Liu, Bai, Chen, Tan, An, Xiao, Qu and Xu. This is an open-access article distributed under the terms of the Creative Commons Attribution License (CC BY). The use, distribution or reproduction in other forums is permitted, provided the original author(s) and the copyright owner(s) are credited and that the original publication in this journal is cited, in accordance with accepted academic practice. No use, distribution or reproduction is permitted which does not comply with these terms.
*Correspondence: Ying Xu, eHluQHVnYS5lZHU=
Disclaimer: All claims expressed in this article are solely those of the authors and do not necessarily represent those of their affiliated organizations, or those of the publisher, the editors and the reviewers. Any product that may be evaluated in this article or claim that may be made by its manufacturer is not guaranteed or endorsed by the publisher.
Research integrity at Frontiers
Learn more about the work of our research integrity team to safeguard the quality of each article we publish.