 Lei Yang1†
 Tianyu Liu
 Huanwen Chen
- 1Department of Cardiothoracic Surgery, The First Affiliated Hospital of Chongqing Medical University, Chongqing, China
- 2Department of Thoracic Surgery, Army Medical Center of People’s Liberation Army of China (PLA), Chongqing, China
Background: Genetic studies have previously reported that single-nucleotide polymorphisms (SNPs) in CHRNA genes (such as CHRNA3, CHRNA4, CHRNA5, or CHRNA3-CHRNA5-CHRNB4 clusters) are linked to the risk of neoplastic and non-neoplastic diseases. However, these conclusions were controversial and no systematic research synopsis has been available. We aimed to synthesize current knowledge of variants in the CHRNA genes on the risk of diseases.
Methods: We systematically searched for publications using PubMed, Medline, and Web of Science on or before 25 August 2021. A total of 1,818 publications were identified, of which 29 were deemed eligible for inclusion that could be used to perform meta-analysis based on at least three data sources to assess whether the morbidity associated with neoplastic and non-neoplastic diseases can be attributed to SNPs in CHRNA genes. To further evaluate the authenticity of cumulative evidence proving significant associations, the present study covered the Venice criteria and false-positive report probability tests. Through the Encyclopedia of DNA Elements (ENCODE) project, we created functional annotations for strong associations.
Results: Meta-analyses were done for nine genetic variants with two diseases {chronic obstructive pulmonary disease (COPD) and lung cancer (LC)}that had at least three data sources. Interestingly, eight polymorphisms were significantly related to changes in the susceptibility COPD and LC (p < 0.05). Of these, strong evidence was assigned to six variants (28 significant associations): CHRNA3 rs1051730, CHRNA3 rs6495309, and CHRNA5 rs16969968 with COPD risk, and CHRNA3 rs1051730, CHRNA3 rs578776, CHRNA3 rs6495309, CHRNA3 rs938682, CHRNA5 rs16969968, and CHRNA5 rs588765 with LC risk; moderate evidence was assigned to five SNPs (12 total associations) with LC or COPD risk. Data from ENCODE and other public databases showed that SNPs with strong evidence may be located in presumptive functional regions.
Conclusions: Our study summarized comprehensive evidence showing that common mutations in CHRNA genes are strongly related to LC and COPD risk. The study also elucidated the vital function of CHRNA genes in genetic predispositions to human diseases.
1. Introduction
Worldwide, many diseases, including neoplastic and non-neoplastic illnesses, have become significant obstacles to the progress of human society. Although lung cancer (LC) has been surpassed by female breast cancer and is the second most commonly diagnosed cancer, the maximum number of deaths in cancerous people is attributed to LC (1). According to a report in 2020, the mortality rate of LC is 18%, with an estimated 1.8 million deaths per year, which exceeds other cancers by far (1). Chronic obstructive pulmonary disease (COPD) is another common global disease. The disease is considered preventable and remediable, and it is characterized by irreversible airway obstruction (2). According to various studies, environmental factors (such as tobacco smoking, ionizing radiation, occupational exposures, and air pollution for LC, and tobacco smoke, occupational dust, vapours, and fumes air pollutants for COPD) and variations in genes facilitate the advancement of LC and COPD (3, 4). Furthermore, more than 80% of LC patients have smoked, and about 50% of COPD cases are related to tobacco smoke worldwide (5–7). However, not everyone exposed to these risk factors develops LC, COPD, or other diseases, and only 20% of smokers are confirmed to have LC or COPD. In fact, previous studies have suggested that genetic variants may be responsible for susceptibility to LC and COPD (8, 9).
According to existing studies, the CHRNA gene can encode nicotine receptors that are expressed in many cells. These receptors can combine with their ligands (e.g., acetylcholine) to transmit biological information. Nicotine is an alkaloid found in tobacco that mimics acetylcholine (10). According to published articles, there are abundant nicotine receptors, which are thought to be the reason for nicotine addiction, in the brain core (11). In addition, because nicotine receptors consist of lung epithelial lung cells, tobacco carcinogens are presumed to act as risk factors for the onset of LC, and the receptors’ signal transduction pathway may facilitate tumor metastasis (12–14). In previous papers, CHRNA3 and CHRNA5 have been proven to have significant correlations with smokers’ susceptibility to LC for their polymorphisms (15). The hypomethylation in the promoter region of CHRNB4 on 15q25 resulted in tumors’ transcript overexpressing, and there were significant hypermethylation expression changes in CHRNA3 and telomerase reverse transcriptase (TERT) and potential tumor suppressor genes that played out due to frequent methylation events (16, 17). Genome-wide association studies (GWAS) have also demonstrated that single-nucleotide polymorphisms (SNPs, such as CHRNA3, CHRNA5, and IREB2) in an area of chromosome 15q25 are closely related to COPD (18, 19). Cigarette smoking, the primary risk factor for the development of COPD, causes the chronic inflammatory process that promotes the structural changes in the small airways and parenchyma (20). The exchange of CHRNA5 transcript expression may have influenced the inflammatory response to smoking (21).
In 2003, Chou et al. reported that neuronal nicotinic acetylcholine receptor subunit alpha 4 (CHRNA4) polymorphisms can play a role in febrile convulsions (22). In 2008, Amos et al. performed a GWAS in Caucasians and found that rs1051730 in CHRNA3 was significantly related to LC susceptibility (23). In 2009, a study by Falvella et al. determined that both CHRNA3 (a slight downgrade) and CHRNA5 (a significant increase) expressed differently in lung adenocarcinoma tissue, which further explains the role of CHRNA SNPs in LC onset (24). Since then, studies have revealed the relationship between LC susceptibility and CHRNA SNPs, including rs12914385, rs3743073, rs578776, rs6495309, rs8042374, and rs938682 in CHRNA3 and rs16969968 and rs588765 in CHRNA5. In 2012, Yang et al. declared that the rs6495309 CC genotype and rs6495309 CT/CC variant genotypes could increase the morbidity of LC and COPD in China (25). In the same year, Lee et al. reported that the CT or TT genotypes of rs6495309 in CHRNA3 could significantly decrease the risk of COPD in the Korean population (26).
Although several studies have reported significant associations between CHRNA SNPs and the risk of cancerous or non-cancerous diseases, some studies have held controversial or disputed opinions about the same CHRNA SNPs. The possible reasons may have included small sample sizes or inauthentic positive associations. Because a comprehensive research synopsis with systematic functional annotation has yet to measure the epidemiological evidence of genetic associations between CHRNA genes and susceptibility to cancerous or non-cancerous diseases, the present study aimed to account for the effect of studied CHRNA SNPs on the risk of all types of cancerous or non-cancerous diseases. First, we conducted a meta-analysis using data collected from all relevant existing studies. We then detected the statistical power of the generated significant evidence. Finally, we conducted a systematic functional annotation to detect the molecular mechanisms of the approved connections.
2. Methods
This study was performed under the guidance of the Preferred Reporting Items for Systematic Reviews and Meta-Analyses Statement guidelines (Supplementary Table S1) and the Human Genome Epidemiology Network for the systematic review of genetic association studies (27, 28).
2.1 Literature search
We used PubMed, Web of Science, and Medline to search for relevant papers delivered before 25 Aug 2021 by employing the following terms: CHRNA3 or CHRNA4 or CHRNA5 or CHRNA3-CHRNA5-CHRNB4 cluster and variant or variation or polymorphism or genotype or single-nucleotide polymorphism or SNP or mutation or rs. The published years ranged from 2008 to 2020. In addition, the references of the qualified articles were checked to acquire other related data.
2.2 Criteria for inclusion and exclusion
We selected qualified studies that met the following criteria: (i) studies that discussed relationships between CHRNA SNPs with the risk of neoplastic or non-cancerous disease with case–control or cohort designed studies of humanity; (ii) studies that provided the sample sizes of cases and controls, respectively; when necessary, studies could provide the amount of genotype and/or allelic distributions to compute the values of odds ratios (ORs) and 95% confidence intervals (95% CIs); and (iii) the full text of the journals was written completely in English. Any article that satisfied any of the following criteria were excluded: (i) studies without sufficient relevant data; (ii) studies in the form of conference abstracts, meetings, or letters to editors; and (iii) studies focused only on the prognoses and survival of cancer patients rather than on cancer morbidity.
2.3 Data extraction
We assigned two different authors to collect correlative information and cross-check each other. Any nonconformity was discussed with the corresponding author and eventually resolved. The following details would be recorded when the qualified SNPs were found: publication year, first author, SNP number, ethnicity, study design, gene name, gene variation, sample sizes of cases and controls, genotype counts, and minor allelic frequency. Ethnicity comprised four categories: Asians (East Asian descent), Caucasians (European descent), Africans (African descent), or others (including people from other countries, such as Indians, Native Hawaiians, Latinos, Hispanics, or mixed). More than 80% of the study’s subjects belonged to one of the above-mentioned groups, and the overall population was composed of two or more of these groups. In addition, we selected the study that had been published most recently, which had the most complete sample of participants and the greatest amount of at least two studies that included the same study population. Because the presentation forms of results were usually inconsonant when identical genetic variants were studied in different research, we collated it at the NCBI site (https://www.ncbi.nlm.nih.gov/snp/) and then chose the most up-to-date and consistent one.
2.4 Statistical analysis
This study employed three models—the allelic model, the dominant model, and the recessive model (Supplementary Table S2)—to put the comprehensive meta-analyses into effect. An ethnicity-based subgroup analysis was also implemented as needed. The heterogeneity among the different publications was evaluated with the I2 statistic and Cochran’s Q test (29, 30). Three different ranges of I²values were given different means: ≤25% (without or little heterogeneity), 25%–50% (middling heterogeneity), and ≥50% (abundant heterogeneity). A different kind of model was employed according to the p-value generated from the Q statistic. The random effect model was adopted if the p-value was < 0.1, and the fixed effect model was used if the p-value was > 0.1. In order to further evaluate the reliability of the significant ORs, we worked out sensitivity analyses for all SNPs with significant associations by excluding a single study (or dataset), the controls of studies that did not match the Hardy–Weinberg equilibrium (HWE), and the first published study. The study evaluated potential publication bias and small-study bias according to Begg’s test and Egger’s test, respectively (31, 32). The study also calculated the chance of collecting too many statistical findings for an independent meta-analysis (with a significance level of p < 0.1) (33). The small-study bias and potential publication bias were evaluated by adopting Begg’s test and a modified version of Egger’s test (with a significance level of p < 0.1, as recommended) (30, 31). Stata version 12 was used to conduct the statistical analyses (Stata, College Station, TX, USA).
2.5 Evaluation of cumulative evidence
To assess the epidemiological credibility of nominally statistical associations proved by meta-analyses, the present study used the Venice criteria to rate the cumulative evidence via three levels (strong, moderate, or weak) (34). The criteria consist of the amount of evidence, protection from bias, and replication of association (graded as A, B, or C, respectively). First, there were three levels for the quantity of evidence based on the total quantity of alleles or genotypes among the cases and controls. These levels were distinguished as follows: >1,000 (level A), 100–1,000 (level B), and <100 (level C). Similarly, the replication of association was evaluated by heterogeneity statistics (I2) and was rated according to the following three levels: I2 ≤ 25% (level A), 25% < I2 < 50% (level B), and I2 ≥ 50% (level C). Finally, we used sensitivity analysis, publication bias, the chance of collecting too many statistical findings, and small-study bias to assess the protection from bias. Importantly, associations without observable biases were assigned to grade A, and a grade A criterion meant that making an association clear was improbable. Grade B was chosen if an association lacked crucial information on identifying evidence without the presence of distinct bias (35). Finally, an association was assigned to grade C if the bias was explicit or the act of making the association clear was improbable.
The Venice criteria also cover an abundant checklist for checking the sources of bias in different options (see supplementary information notes). In addition, the confidence level of an association is related to the evaluation of protection from bias. To illustrate, a summary OR of an association of <1.15 (OR > 0.87 in a protection effect) was categorized as level C unless the relationship had been proven in other studies without obvious publication bias (primarily, GWAS or GWAS meta-analyses from collaborative studies). Finally, cumulative epidemiological evidence of nominally statistical associations was divided into three groups: strong associations (all three grades were A), weak associations (at least one grade of C), and moderate associations (apart from the above).
As Wacholder et al. recommended, a prior probability of 0.05 and a false-positive report probability (FPRP) cutoff value of 0.2 in the FPRP assay must be calculated to find potentially false-positive results among statistical associations and to discuss whether they are supposed to be excluded (36). We used the Excel spreadsheet acquired from the website to calculate FPRP values (35). We considered an association notable when the FPRP value was below the prespecified noteworthiness value of 0.2, indicating that the association might be true. The true evidence was graded by FPRP values of <0.05, 0.05–0.2, and >0.2, indicating strong, moderate, and weak, respectively. With a strong magnitude of FPRP, the credibility of the evidence would be upgraded from weak to moderate or from moderate to strong. If the FPRP was assigned as weak, we would downgrade the credibility of association.
2.6 Functional annotation
The underlying functional role of variants in CHRNA genes was evaluated with information from the Encyclopedia of DNA Elements (ENCODE) tool, HaploReg v. 4.1, and the UCSC Genome browser (http://genome.ucsc.edu/) (37). Furthermore, the present work explored genome-wide cis-eQTL data in multiple tissues from the Genotype-Tissue Expression Project and the Multiple Tissue Human Expression Resource Project databases to reveal whether these genes could account for the observed findings in these loci (38, 39).
3. Results
3.1 Characteristics of eligible studies
We initially searched for 1,818 studies using PubMed, Medline, and Web of Science (Figure 1). Of these, 1,706 papers were excluded because the titles and abstracts were duplicates or lacked correlation, and 92 papers were excluded due to insufficient information (such as about the number of variants in a genotype) in the full text. In addition, nine papers were included from meta-analyses, review articles, or references. The present study included a total of 29 publications with 70,960 cases and 124,838 controls to evaluate the relationship between nine CHRNA SNPs and LC or COPD susceptibility (eight SNPs with a relationship to LC and three SNPs with a relationship to COPD, respectively) after filtering out SNPs with no more than two datasets. The demographic characteristics of all available publications are summarized in Supplementary Table S3. Multiple diseases (such as epilepsy, Parkinson’s disease, and Alzheimer’s disease) were not evaluated by meta-analysis because there was only one dataset for each disease.

Figure 1 Flow diagram of literature search and study selection.
3.2 Main meta-analyses
Meta-analyses were performed to evaluate the associations between nine CHRNA SNPs and the risk of COPD or LC (Table 1). Of these, eight SNPs were statistically associated with the risk of LC or COPD risk; three SNPs were nominally statistically related to COPD risk (rs1051730 and rs6495309 in CHRNA3 and rs16969968 in CHRNA5); and eight SNPs were nominally statistically associated with LC risk (rs1051730, rs12914385, rs578776, rs6495309, rs8042374, and rs938682 in CHRNA3 and rs16969968 and rs588765 in CHRNA5).
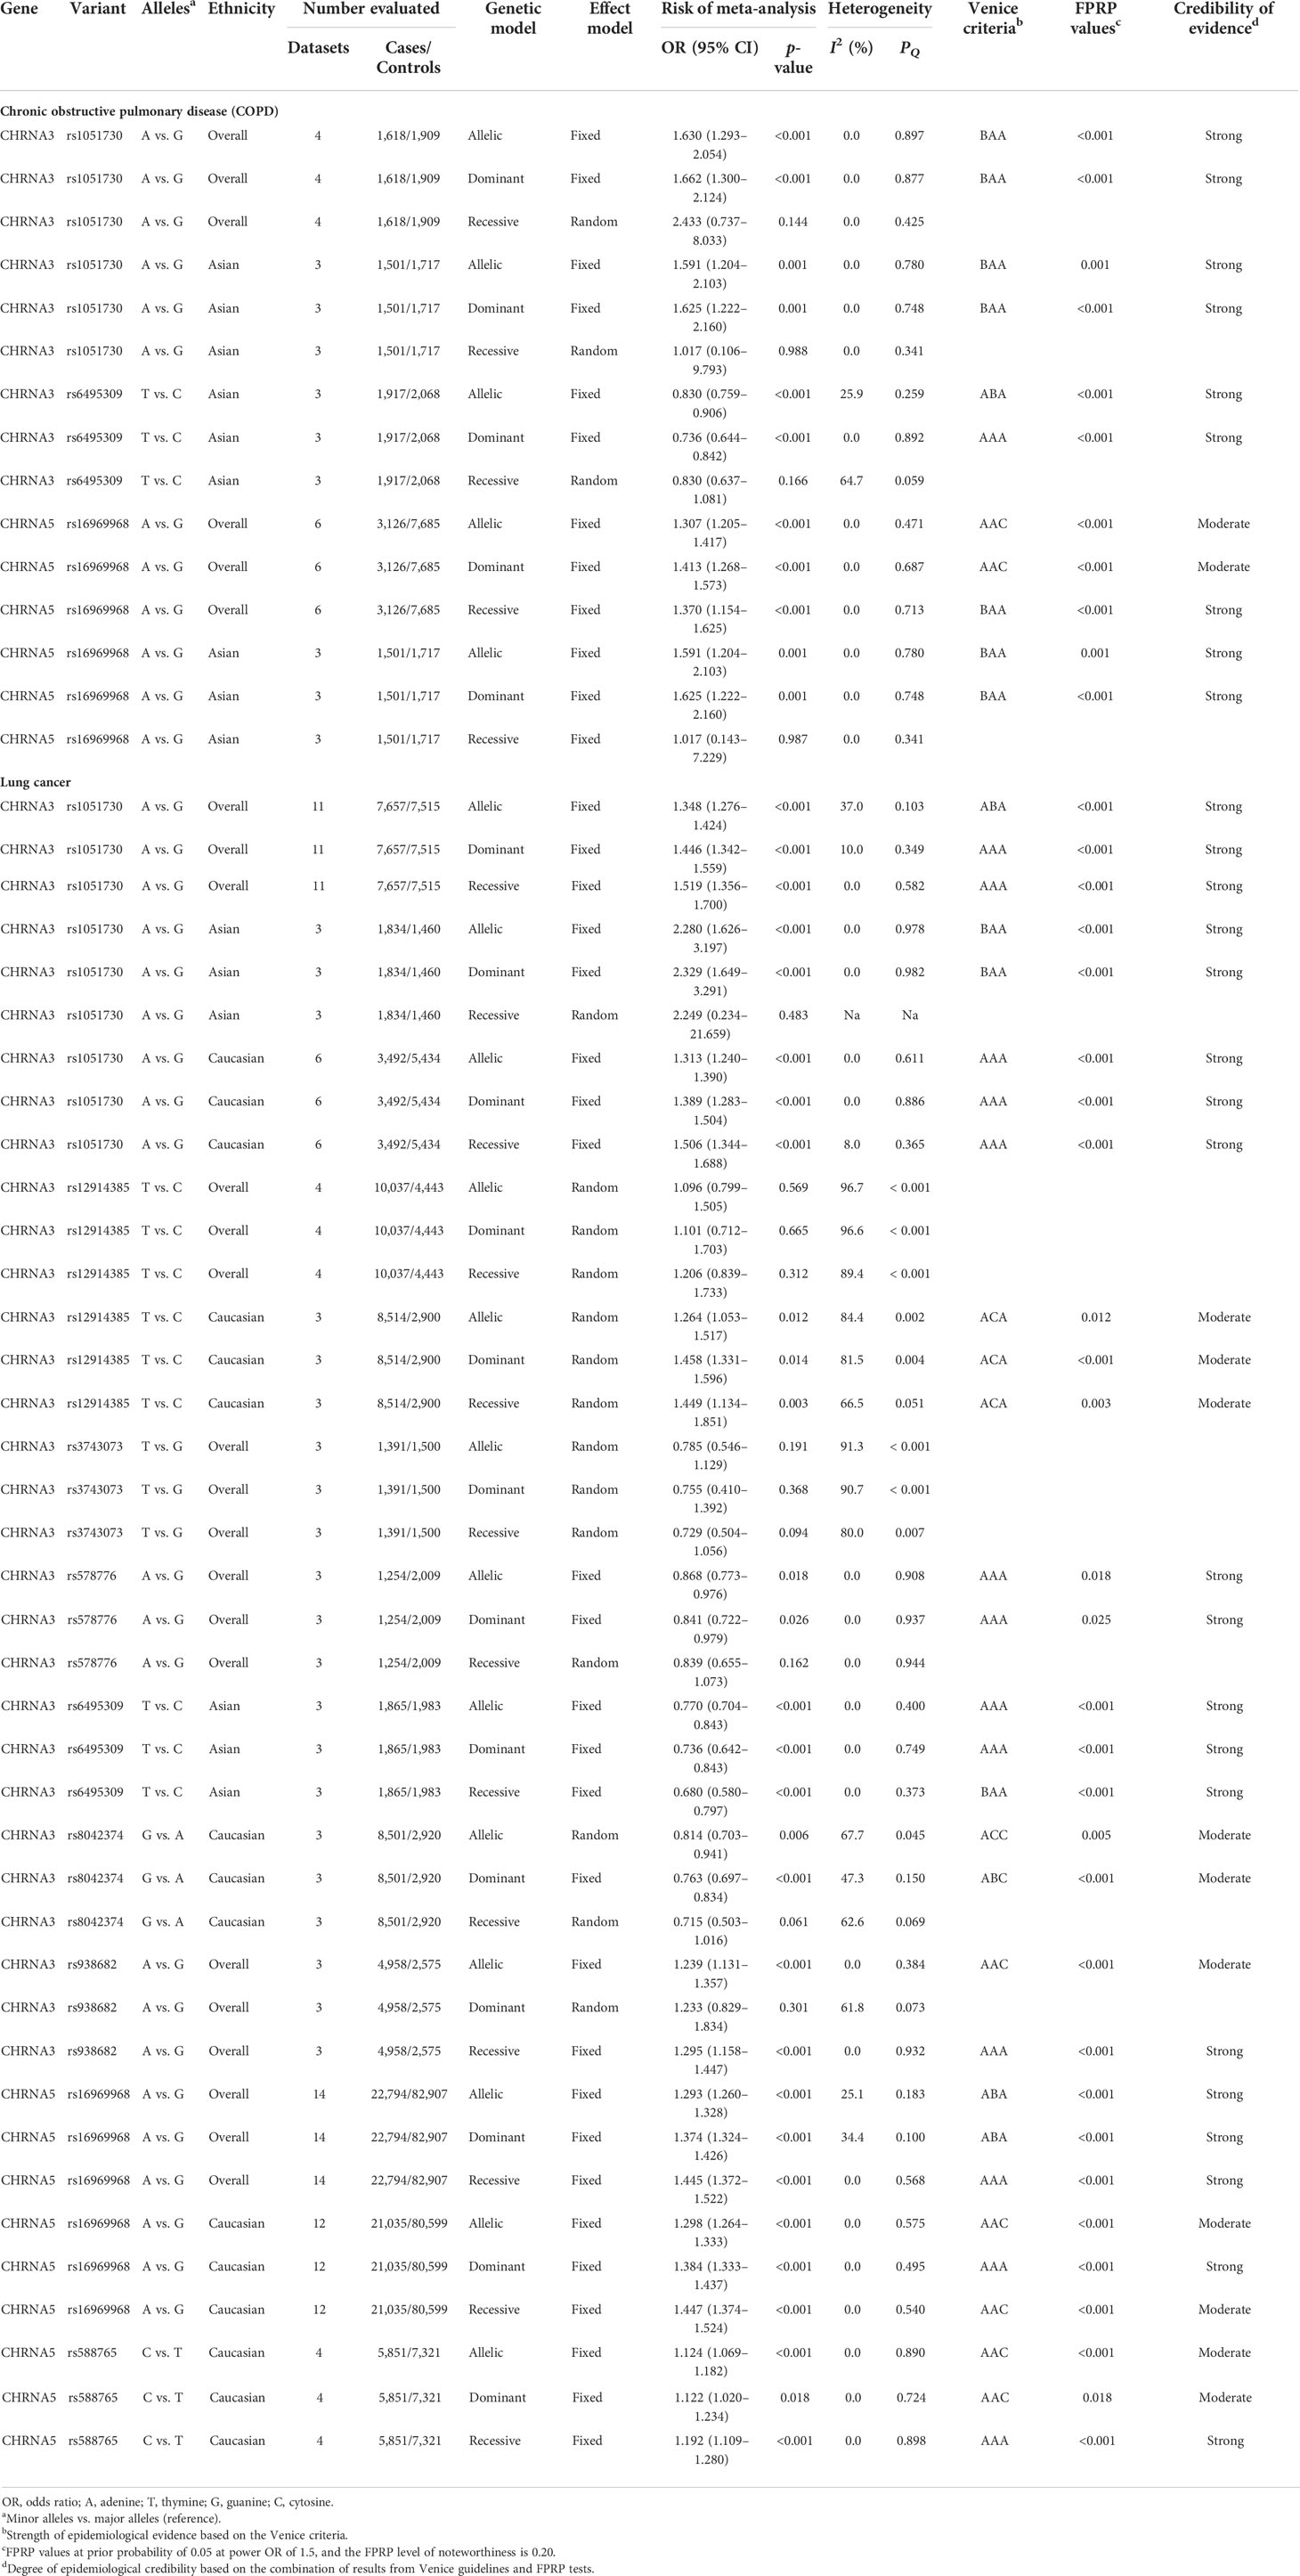
Table 1 Genetic variants showing summary ORs for different disease risks in main meta-analyses in all three genetic models.
3.2.1 COPD
We identified a nominally statistical association between CHRNA3 rs1051730 and COPD risk under the allelic and dominant models in all populations (allelic model: OR = 1.630, 95% CI = 1.293–2.054, p < 0.001; dominant model: OR = 1.662, 95% CI = 1.300–2.124, p < 0.001), a nominally significant association under the allelic and dominant models in Asians (allelic model: OR = 1.591, 95% CI = 1.204–2.103, p = 0.001; dominant model: OR = 1.625, 95% CI = 1.222–2.160, p = 0.001), and a null association under all three models in Caucasians. Regarding CHRNA5 rs16969968, we found a nominally statistical association between SNP rs16969968 and COPD risk under the three genetic models in all populations (allelic model: OR = 1.307, 95% CI = 1.205–1.417, p < 0.001; dominant model: OR = 1.413, 95% CI = 1.268–1.573, p < 0.001; recessive model: OR = 1.370, 95% CI = 1.154–1.625, p < 0.001) and a nominal association under the allelic and dominant models in Asians (allelic model: OR = 1.591, 95% CI = 1.204–2.103, p = 0.001; dominant model: OR = 1.625, 95% CI = 1.222–2.160, p = 0.001). We discovered a null association between CHRNA5 rs16969968 and Caucasians under the three genetic models. In addition, we found that SNP rs6495309 was statistically related to COPD risk under the allelic and dominant models in Asians (allelic model: OR = 0.830, 95% CI = 0.759–0.906, p < 0.001; dominant model: OR = 0.736, 95% CI = 0.644–0.842, p = 0.001).
3.2.2 Lung cancer
We detected a nominally statistical association between CHRNA3 rs1051730 and LC risk under the three models in all populations (allelic model: OR = 1.348, 95% CI = 1.276–1.424, p < 0.001; dominant model: OR = 1.446, 95% CI = 1.342–1.559, p < 0.001; recessive model: OR = 1.519, 95% CI = 1.356–1.700, p < 0.001) and a nominally statistical association under the allelic and dominant models in Asians (allelic model: OR = 2.280, 95% CI = 1.626–3.197, p < 0.001; dominant model: OR = 2.329, 95% CI = 1.649–3.291, p < 0.001). There was also a nominally significant association under the three models in Caucasians (allelic model: OR = 1.313, 95% CI = 1.240–1.390, p < 0.001; dominant model: OR = 1.389, 95% CI = 1.283–1.504, p < 0.001; recessive model: OR = 1.506, 95% CI = 1.344–1.688, p < 0.001). For CHRNA3 rs12914385, we presented no statistical association between rs12914385 and LC risk under the three models in all populations but a nominally conspicuous relationship with LC risk under the three models in Caucasians (allelic model: OR = 1.264, 95% CI = 1.053–1.517, p = 0.012; dominant model: OR = 1.458, 95% CI = 1.331–1.596, p = 0.014; recessive model: OR = 1.449, 95% CI = 1.134–1.851, p = 0.003) and a null relationship between CHRNA3 rs12914385 and LC risk under the three models in Asians.
Regarding CHRNA3 rs578776, we identified a nominally statistical relationship between SNP rs578776 and LC risk under two models in all populations, including Asians and Caucasians (allelic model: OR = 0.868, 95% CI = 0.773–0.976, p = 0.018; dominant model: OR = 0.841, 95% CI = 0.722–0.979, p = 0.026). We also demonstrated that CHRNA3 rs6495309 likely had a statistical relationship with LC risk under the three models in Asians (allelic model: OR = 0.770, 95% CI = 0.704–0.843, p < 0.001; dominant model: OR = 0.736, 95% CI = 0.642–0.843, p < 0.001; recessive model: OR = 0.680, 95% CI = 0.580–0.797, p < 0.001). For CHRNA3 rs8042374, we found a nominally statistical association between SNP rs8042374 and LC risk under two models in Caucasians (allelic model: OR = 0.814, 95% CI = 0.703–0.941, p = 0.006; dominant model: OR = 0.763, 95% CI = 0.697–0.834, p < 0.001). For CHRNA3 rs938682, we detected a nominally statistical association between SNP rs938682 and LC risk under two models in all populations (allelic model: OR = 1.239, 95% CI = 1.131–1.357, p < 0.001; recessive model: OR = 1.295, 95% CI = 1.158–1.447, p < 0.001). In addition, CHRNA3 rs3743073 was revealed to have no statistical relationship with LC risk under the three models in all populations, though this finding was not verified in Asians or Caucasians.
A nominally statistical association between CHRNA5 rs16969968 and LC risk was shown under the three models in all populations (allelic model: OR = 1.293, 95% CI = 1.260–1.328, p < 0.001; dominant model: OR = 1.374, 95% CI = 1.324–1.426, p < 0.001; recessive model: OR = 1.445, 95% CI = 1.372–1.522, p < 0.001), and a nominally statistical association between CHRNA5 rs16969968 and LC risk was identified under the three models in Caucasians (allelic model: OR = 1.293, 95% CI = 1.264–1.333, p < 0.001; dominant model: OR = 1.384, 95% CI = 1.333–1.437, p < 0.001; recessive model: OR = 1.447, 95% CI = 1.374–1.524, p < 0.001). In addition, a nominally statistical association was identified between SNP rs588765 and LC risk under the three models in Caucasians (allelic model: OR = 1.124, 95% CI = 1.069–1.182, p < 0.001; dominant model: OR = 1.122, 95% CI = 1.020–1.234, p = 0.018; recessive model: OR = 1.192, 95% CI = 1.109–1.280, p < 0.001).
Moreover, our study also found that some SNPs had no association with risk of disease. For example, our study found that rs12914385 in CHRNA3 gene had a non-significant association with risk of LC in all populations under any genetic model, but had significant associations in Caucasians. rs12914385 in CHRNA3 gene had no association with risk of LC in all populations.
3.3 Cumulative evidence of association
We initially used the Venice criteria to assess the cumulative epidemiological evidence for the eight SNPs that showed significant relationships to LC or COPD risk. More information on this evidence is listed in Supplementary Table S4 and Table 1. For the Venice criteria test, we first assigned 30 A grades, 10 B grades, and 0 C grades to further assess the authenticity of evidence according to the amount of evidence. We then assigned 31 A grades, 5 B grades, and 4 C grades to evaluate their replication. Finally, we assigned 31 A grades, 0 B grades, and 9 C grades to assess protection from bias. Ultimately, the relationship to COPD risk could be rated according to three groups: strong (included CHRNA3 rs6495309 under the dominant model in Asians), moderate (reflected eight associations, including CHRNA3 rs1051730 under the allelic and dominant models in all populations and the allelic and dominant models in Asians, CHRNA3 rs6495309 under the allelic model in Asians and CHRNA5 rs16969968 under the recessive model in all populations, and the allelic and dominant models in Asians), and weak (represented two associations, including CHRNA5 rs16969968 under the allelic and dominant models in all populations).
In terms of LC risk, the strong group was rated for 13 associations (including CHRNA3 rs1051730 under the dominant and recessive models in all populations and under all three models in Caucasians, CHRNA3 rs578776 under the allelic and dominant models in all populations, CHRNA3 rs6495309 under the allelic and dominant models in Asians, CHRNA3 rs938682 under the recessive model in all populations, CHRNA5 rs16969968 under the recessive model in all populations and under the dominant model in Caucasians, and CHRNA5 rs588765 under the recessive model in Caucasians); the moderate group was rated for 6 associations (including CHRNA3 rs1051730 under the allelic model in all populations and in Asians, CHRNA3 rs6495309 under the recessive model in Asians, and CHRNA5 rs16969968 under the allelic and dominant models in all populations); and the weak group was rated for 10 associations (including CHRNA3 rs12914385 under all three models in Caucasians, CHRNA3 rs8042374 under the allelic and dominant models in Caucasians, CHRNA3 rs938682 under the allelic model in all populations, CHRNA5 rs16969968 under the allelic and recessive models in Caucasians, and CHRNA5 rs588765 under the allelic and dominant models in Caucasians). In addition, we calculated the FPRP values of these nominally statistical associations to evaluate the probability of a precisely significant relationship between SNPs and LC or COPD risk. Of note, the p-values of the FPRP assay above all nominally significant associations between SNPs and LC or COPD risk were less than 0.05.
Finally, strong evidence was assigned to six variants with LC or COPD risk (28 significant associations). A strong association was identified between CHRNA3 rs1051730 and COPD risk under the allelic and dominant models in all populations and in Asians; between CHRNA3 rs6495309 and COPD risk under the allelic and dominant models in Asians; between CHRNA5 rs16969968 and COPD risk under the recessive model in all populations and under the allelic and dominant models in Asians; between CHRNA3 rs1051730 and LC risk under all three models in all populations and in Caucasians and under the allelic and dominant models in Asians; between CHRNA3 rs578776 and LC risk under the allelic and dominant models in all populations; between CHRNA3 rs6495309 and LC risk under all three models in Asians; between CHRNA3 rs938682 and LC risk under the recessive model in all populations; between CHRNA5 rs16969968 and LC risk under all three models in all populations and under the dominant model in Caucasians; and between CHRNA5 rs588765 and LC risk under the recessive model in Caucasians. Moderate evidence was assigned to five SNPs (12 associations) with risk of LC or COPD. A moderate relationship was identified between CHRNA5 rs16969968 and COPD risk under the allelic and dominant models in all populations; between CHRNA3 rs12914385 and LC risk under all three models in Caucasians; between CHRNA3 rs8042374 and LC risk under the allelic and dominant models in Caucasians; between CHRNA3 rs938682 and LC risk under the allelic model in all populations; between CHRNA5 rs16969968 and LC risk under the allelic and dominant models in Caucasians; and between CHRNA5 rs588765 and LC risk under the allelic and dominant models in Caucasians.
3.4 Heterogeneity, bias, and sensitivity analyses
We performed assessments of heterogeneity, bias, and sensitivity analyses (Supplementary Table S4 and Table 1). For nominally significant associations between SNPs and COPD risk, low heterogeneity was found for associations of CHRNA3 rs1051730 in all populations (allelic model: I2 = 0.0%, p = 0.897; dominant model: I2 = 0.0%, p = 0.877) and in Asians (allelic model: I2 = 0.0%, p = 0.780; dominant model: I2 = 0.0%, p = 0.748); for associations of CHRNA3 rs6495309 in Asians (dominant model: I2 = 0.0%, p = 0.892); and for associations of CHRNA5 rs16969968 in all populations (allelic model: I2 = 0.0%, p = 0.471; dominant model: I2 = 0.0%, p = 0.687; recessive model: I2 = 0.0%, p = 0.713) and in Asians (allelic model: I2 = 0.0%, p = 0.780; dominant model: I2 = 0.0%, p = 0.748). Moderate heterogeneity was detected only for associations of CHRNA3 rs6495309 (allelic model: I2 = 25.9%, p = 0.259). In addition, we found little proof of publication bias for nominally significant associations between SNPs and COPD risk (p > 0.10), except in the case of CHRNA5 rs16969968 under the allelic and dominant models in all populations (p < 0.10). Furthermore, we evaluated the robustness of these nominally significant associations by performing a sensitivity analysis that removed single studies (or datasets). The removal of studies that had been published first or studies deviating from HWE in COPD control groups did not alter the summary ORs. We did not test the excess of significant findings due to the unavailability of genotype amounts in most studies.
For nominally significant associations between SNPs and LC risk, the following associations were considered to have low heterogeneity: CHRNA3 rs1051730 in all populations (dominant model: I2 = 10.0%, p = 0.349; recessive model: I2 = 0.0%, p = 0.582), in Asians (allelic model: I2 = 0.0%, p = 0.978; dominant model: I2 = 0.0%, p = 0.982), and in Caucasians (allelic model: I2 = 0.0%, p = 0.611; dominant model: I2 = 0.0%, p = 0.886; recessive model: I2 = 8.0%, p = 0.365); CHRNA3 rs578776 in all populations (allelic model: I2 = 0.0%, p = 0.908; dominant model: I2 = 0.0%, p = 0.937); CHRNA3 rs6495309 in Asians (allelic model: I2 = 0.0%, p = 0.400; dominant model: I2 = 0.0%, p = 0.749; recessive model: I2 = 0.0%, p = 0.373); CHRNA3 rs938682 in all populations (allelic model: I2 = 0.0%, p = 0.384; recessive model: I2 = 0.0%, p = 0.932); CHRNA5 rs16969968 in all populations (recessive model: I2 = 0.0%, p = 0.568) and in Caucasians (allelic model: I2 = 0.0%, p = 0.575; dominant model: I2 = 0.0%, p = 0.495; recessive model: I2 = 0.0%, p = 0.540); and CHRNA5 rs588765 in Caucasians (allelic model: I2 = 0.0%, p = 0.890; dominant model: I2 = 0.0%, p = 0.724; recessive model: I2 = 0.0%, p = 0.898). Four associations were found to have moderate heterogeneity: CHRNA3 rs1051730 in all populations (allelic model: I2 = 37.0%, p = 0.103); CHRNA3 rs8042374 in Caucasians (dominant model: I2 = 47.3%, p = 0.150); and CHRNA5 rs16969968 in all populations (allelic model: I2 = 25.1%, p = 0.183; dominant model: I2 = 34.4%, p = 0.100). Another four associations were found to have large heterogeneity: CHRNA3 rs12914385 in Caucasians (allelic model: I2 = 84.4%, p = 0.002; dominant model: I2 = 81.5%, p = 0.004; recessive model: I2 = 66.5%, p = 0.051) and CHRNA3 rs8042374 in Caucasians (allelic model: I2 = 67.7%, p = 0.045).
As with the associations connected to COPD risk, we also performed a publication bias test. The test showed little confidence for nominally significant associations between SNPs and LC risk (p > 0.10), except in CHRNA3 rs8042374 under the allelic and dominant models in Caucasians, CHRNA3 rs938682 under the allelic model in all populations, CHRNA5 rs16969968 under the allelic and recessive models in Caucasians, and CHRNA5 rs588765 under the allelic and dominant models in Caucasians (p < 0.10). Regarding sensitivity analysis, the summary ORs were not modified by removing studies that had been published first or studies deviating from HWE in LC control groups, except CHRNA5 rs588765 under the dominant model in Caucasians due to the removal of a study that had been published first. We did not test the excess of significant findings due to the unavailability of genotype amounts in most studies.
3.5 Functional annotation
By referring to the data gained from the ENCODE tool, HaploReg v. 4.1, we analyzed the functional roles of the six variants strongly associated with LC or COPD risk (Table 2). The results showed that rs938682 and rs588765 mapped to intronic regions, rs578776 mapped to 3’UTR, rs1051730 was annotated as a synonymous variant, and rs16969968 was annotated as missense. Six SNPs could be considered expression quantitative trait loci (eQTLs) for numerous genes in various tissue types, six SNPs could be situated in the histone modification regions of enhancers, four SNPs could be located in promoters, and one SNP could be found in sites exhibiting DNase I hypersensitivity. We also found that four SNPs (rs1051730, rs6495309, rs578776, and rs938682) may be involved in transcriptional regulatory element activity. Moreover, linkage disequilibrium (LD) plots showed that regions delegated by significant SNPs had distinct genetic structures among European, Asian, and African ancestries (Figure 2). The Genotype-Tissue Expression Project revealed that rs1051730, rs16969968, and rs588765 are eQTLs for CHRNA3 and CHRNA5. In brief, while rs1051730, rs16969968, and rs588765 are associated with a decrease of CHRNA3 and CHRNA5 gene expression in lung tissue, rs6495309, rs6495309, and rs938682 are associated with an increase in IREB2 gene expression in lung tissue (Supplementary Table 5).
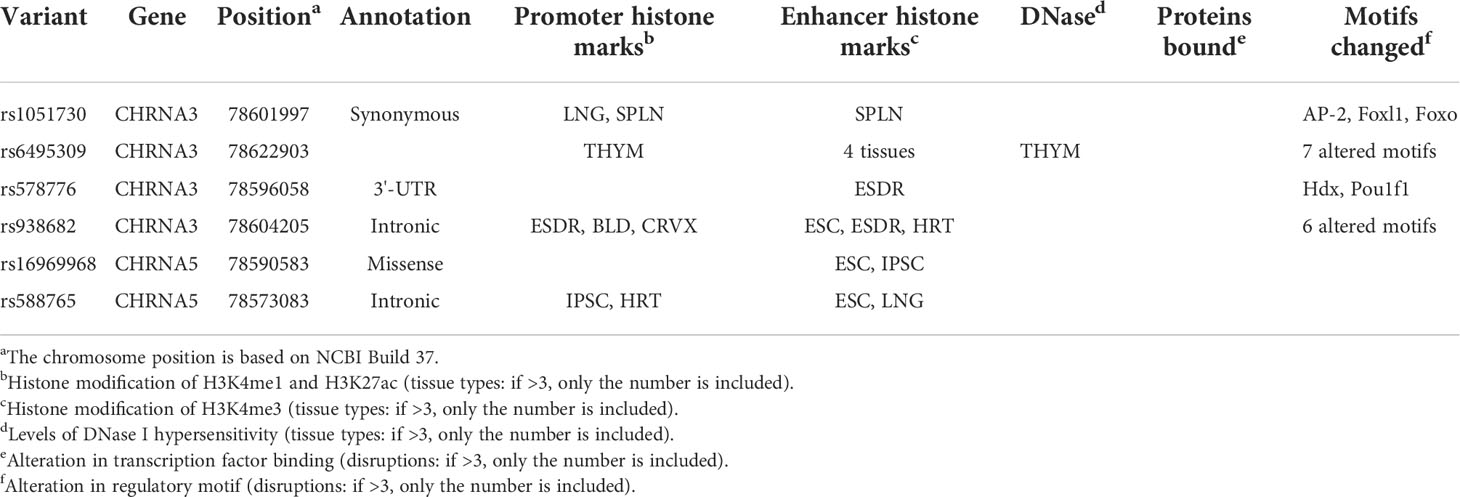
Table 2 Summary of functional annotations for six SNPs in CHRNA genes with diseases risk (strong epidemiological credibility).
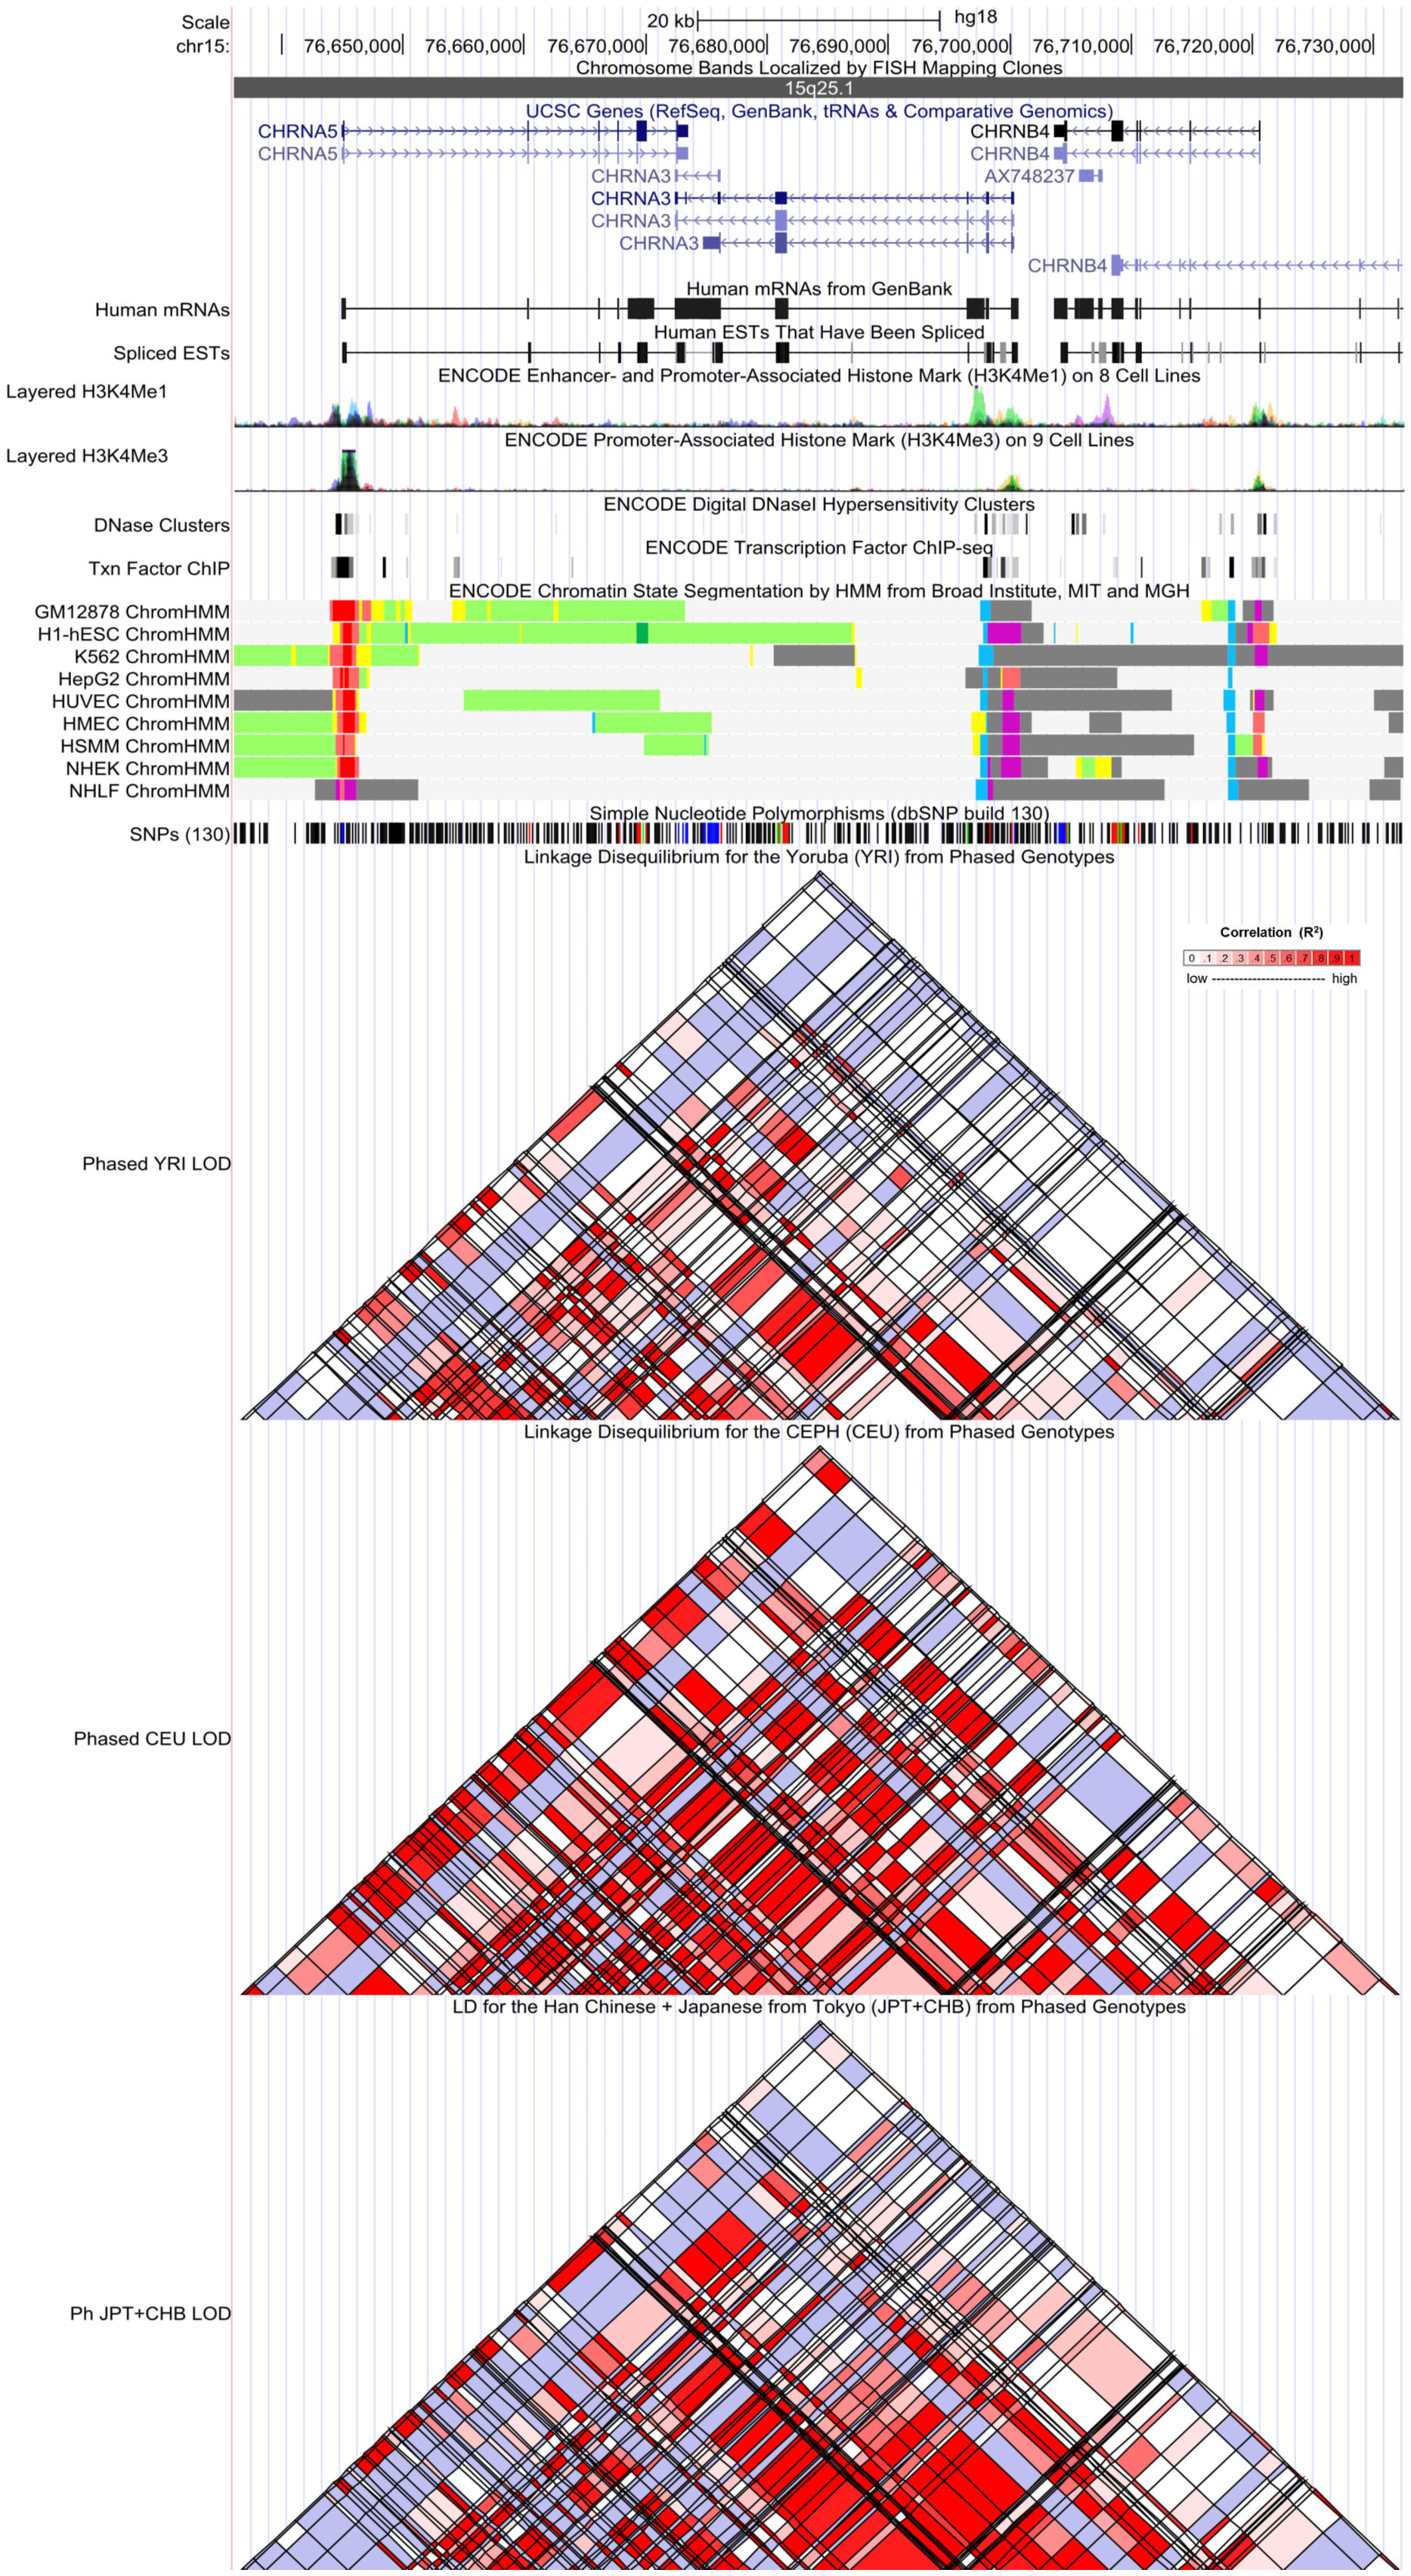
Figure 2 Evidence from the Encyclopedia of DNA Elements (ENCODE) data for the regulatory function of variants in 15q25.1 using the UCSC Genome Browser. The plot represents 15q25.1 within a 20-kb window centered on the CHRNA5–CHRNA3 gene region. Tracks (from top to bottom) in each of the plots are Genome Base Position, Chromosome Bands, UCSC Genes, Human messenger RNAs from GenBank, Human expressed sequence tag (ESTs) That Have Been Spliced, ENCODE Enhancer and Promoter-Associated Histone Mark (H3K4Me1) on 8 Cell Lines, ENCODE Promoter-Associated Histone Mark (H3K4Me3) on 9 Cell Lines, ENCODE Digital DNaseI Hypersensitivity Clusters, ENCODE Transcription Factor ChIP-seq, ENCODE Chromatin State Segmentation by Hidden Markov Model (HMM) from Broad Institute (bright red, active promoter; light red, weak promoter; purple, inactive/poised promoter; orange, strong enhancer; yellow, weak/poised enhancer; blue, insulator; dark green, transcriptional transition/elongation; light green, weak transcribed; gray, polycomb-repressed; light gray, heterochromatin/low signal/repetitive/copy number variation), Simple Nucleotide Polymorphisms (dbSNP build 130), Linkage Disequilibrium for the Yoruba (YRI) from Phased Genotypes, Linkage Disequilibrium for the CEPH (CEU) from Phased Genotypes, and LD for the Han Chinese + Japanese from Tokyo (JPT+CHB) from Phased Genotypes.
4. Discussion
Although numerous existing studies have confirmed potential associations between CHRNA SNPs and LC or COPD risk, their results are inconsistent and controversial. To our knowledge, this is the first study to comprehensively elucidate whether the studied variants of CHRNA genes are related to the risk of cancerous or non-cancerous diseases and to evaluate the credibility of significant epidemiological evidence using the Venice criteria and FPRP tests. This meta-analysis assessed 29 papers with 70,960 cases and 124,838 controls. The study also evaluated the associations between nine SNPs and the risk of LC or COPD. Among these SNPs, eight were found to be statistically related to the risk of LC or COPD. In addition, two approaches (the Venice guidelines and FPRP tests) were used for the first time to assess these significant associations. The cumulative evidence for associations between six variants and LC or COPD risk was shown to be strong (28 significant associations: CHRNA3 rs1051730, CHRNA3 rs6495309, and CHRNA5 rs16969968 with COPD risk and CHRNA3 rs1051730, CHRNA3 rs578776, CHRNA3 rs6495309, CHRNA3 rs938682, CHRNA5 rs16969968, and CHRNA5 rs588765 with LC risk), and the cumulative evidence for associations between five SNPs (12 associations) and LC or COPD risk was moderate. The current study also constructed functional annotations for the six SNPs with strong evidence using information from the ENCODE project and other public databases, revealing that these mutations may lie in several putative regulatory areas. In brief, this research provided comprehensive epidemiological evidence that familiar variants in CHRNA genes show an association with a predisposition to LC or COPD.
The CHRNA3 gene (Gene ID: 1136) and CHRNA5 gene (Gene ID: 1138), which are located in chromosome 15q25.1, were found to be related to the risk of LC and COPD (14, 15, 18). Many published papers, including GWAS, have demonstrated a significant relationship between CHRNA and COPD risk (15, 18). Some studies have indicated that the nicotine receptors expressed in lung epithelial cells can facilitate cancer cell proliferation and metastases (11–13). In the present study, six variants were shown to present with strong cumulative evidence in their associations with LC or COPD risk (CHRNA3 rs1051730, CHRNA3 rs6495309, and CHRNA5 rs16969968 with COPD risk, and CHRNA3 rs1051730, CHRNA3 rs578776, CHRNA3 rs6495309, CHRNA3 rs938682, CHRNA5 rs16969968, and CHRNA5 rs588765 with LC risk).
For the evaluation of COPD, three SNPs showed strong associations with the risk of COPD. Phase 3 of the 1000 Genomes Project (Supplementary Table 6) suggested that CHRNA3 rs1051730 is uncorrelated with CHRNA3 rs6495309 in both Asians and Africans (r2 < 0.05), and these SNPs showed weak LD in Europeans (r2 = 0.1751) (40). Furthermore, CHRNA5 rs16969968 was uncorrelated with CHRNA3 rs6495309 in both Asians and Africans (r2 < 0.05), and these SNPs were weak in Europeans (r2 = 0.1729). According to the results, different causal mutations and functional mechanisms may exist in the relationships between COPD risk and mutations in the CHRNA3 and/or CHRNA5 genes. Moreover, while CHRNA5 rs16969968 showed strong LD with CHRNA3 rs1051730 in both Asians and Europeans (r2 > 0.9), it showed weak LD in Africans (r2 = 0.2520). Based on the results, the functional mechanisms of the two variants may change among different ethnic groups and partially answer to ethnic differences among variants related to disease, such as COPD risk.
For the assessment of LC, six SNPs were strongly related to LC risk (rs1051730, rs578776, rs6495309, and rs938682 in the CHRNA3 gene and rs16969968 and rs588765 in the CHRNA5 gene). Phase 3 of the 1000 Genomes Project (Supplementary Table 6) suggested that CHRNA3 rs6495309 showed a strong LD with CHRNA3 rs938682 in both Asians and Europeans (r2 > 0.8) and a moderate LD in Africans (r2 = 0.5143). While CHRNA3 rs578776 showed a strong LD with CHRNA3 rs938682 in Europeans (r2 > 0.8), these SNPs showed weak LD in both Asians (r2 = 0.2185) and Africans (r2 = 0.2991). Furthermore, CHRNA3 rs6495309 showed moderate LD with CHRNA3 rs578776 in Europeans (r2 = 0.7556), but these SNPs showed weak LD in both Asians (r2 = 0.1698) and Africans (r2 = 0.1289). Finally, although CHRNA5 rs16969968 showed moderate LD with CHRNA5 rs588765 in Europeans (r2 = 0.3601), these SNPs were uncorrelated in both Asians and Africans (r2 < 0.05). Based on the results, the functional mechanisms of the three variants related to the risk of LC may be different across ethnic groups and may partially answer the ethnic differences of some variants related to disease. Finally, rs1051730 showed weak LD or was uncorrelated with three SNPs (rs6495309, rs578776, and rs938682), indicating that different causal mutations and functional mechanisms may exist in the relationships between LC risk and CHRNA3 gene mutations.
Current evidence has indicated that both CHRNA3 rs1051730 and CHRNA5 rs16969968 have excellent responses to nicotinic agonists in vitro (41). When compared to smokers without these two SNPs, these polymorphisms are generally present in heavy smokers who have higher levels of nitrosamines and other derivatives due to the combustion of tobacco, which can trigger an inflammatory response to COPD and elevated cellular proliferation in lung tissue, resulting in the development of LC or COPD (14). CHRNA3 rs6495309 can change the binding ability of the transcriptional factor Oct-1, which has been shown to repress gene transcription, leading to alterations in CHRNA3 RNA expression. This influences the ability of cells to progress into apoptosis, thereby impacting LC risk (17). Interestingly, the rs6495309 T allele has a decreased susceptibility to COPD due to reduced promoter activity, which diminishes CHRNA3 expression and the inflammatory response to smoking exposure (25). A previous study showed that the rs578776 A allele could reduce the risk of nicotine dependence and the risk of LC in Caucasians (42). Moreover, the SNP rs588765 was reported to be linked to changes in CHRNA5 mRNA expression in lung tissue and to show a strong relationship with nicotine dependence (23, 43). In European, Asian, and African populations, four variants in the CHRNA3 gene were shown to be uncorrelated or show weak LD with two mutations in the CHRNA5 gene. According to the results, different causal mutants and functional mechanisms exist in the relationships between mutations in the CHRNA3 and CHRNA5 genes and LC susceptibility.
Moreover, this study showed that some SNPs had no association with LC risk. Briefly, our study analyzing the same SNP from different groups yielded inconsistent results due to the selection of association models, ethnicity, and variations in sample size. For the inconsistent results in different genetic models, the existence of different genetic backgrounds such as age and gender of patients, subtypes of cancers, and environmental factors were not taken into consideration and may present as sources of variation in the result. The minor allele frequency of SNP had differences among different races, and studies with smaller sample sizes had low statistical power, which may explain why these associations produced inconsistent results in different ethnicities.
While this study provides the largest sample and a comprehensive evaluation of variants related to the risk of cancerous and non-cancerous diseases, it contains several limitations. First, although comprehensive research was conducted on databases, some publications may have been missed, and certain papers may have lacked sufficient data, such as the genotype amount, resulting in an incomplete assessment of other malignancies and non-cancerous diseases. Second, sufficient data could not be provided for assessments of the interactions between different variants and the adjusted effect of environmental factors, including smoking and H. pylori infection. Third, a detailed subgroup analysis of cancer types ascribed to the heterogeneity of cancer typing among eligible studies was not completed. Fourth, the excess of significant findings was not alternatively evaluated due to insufficient data. Finally, some of the significant findings were identified with moderate credibility. Because this was partially due to the small sample of subgroups related to ethnicity under different genetic models, studies with sufficient subgroups are recommended to validate the current research’s findings.
In this extensively updated meta-analysis, eight SNPs were proven to be significantly related to LC and COPD risk; of these, six variants were graded to show strong cumulative evidence for LC or COPD predisposition (CHRNA3 rs1051730, CHRNA3 rs6495309, and CHRNA5 rs16969968 with COPD risk and CHRNA3 rs1051730, CHRNA3 rs578776, CHRNA3 rs6495309, CHRNA3 rs938682, CHRNA5 rs16969968, and CHRNA5 rs588765 with LC risk), and five SNPs were graded to show moderate cumulative evidence for LC or COPD risk. This study also provides a basis for further understanding of the genetic predisposition of LC and COPD susceptibility. Our findings could inspire further studies to elucidate the cause of LC and COPD and may lead to the development of screening and prevention strategies for clinical management.
Data availability statement
The original contributions presented in the study are included in the article/Supplementary Material. Further inquiries can be directed to the corresponding author.
Author contributions
LY and HC designed this work. LY and XL integrated and analyzed the data. LY and HC wrote this manuscript. LY, CZ, XL, TL, ZY and CJ finished the related tables and figures. LY and HC edited and revised the manuscript. All authors contributed to the article and approved the submitted version.
Funding
This study was supported by funding from the Chongqing Natural Science Foundation (grant no. cstc2020jcyj-msxmX0257).
Conflict of interest
The authors declare that the research was conducted in the absence of any commercial or financial relationships that could be construed as a potential conflict of interest.
Publisher’s note
All claims expressed in this article are solely those of the authors and do not necessarily represent those of their affiliated organizations, or those of the publisher, the editors and the reviewers. Any product that may be evaluated in this article, or claim that may be made by its manufacturer, is not guaranteed or endorsed by the publisher.
Supplementary material
The Supplementary Material for this article can be found online at: https://www.frontiersin.org/articles/10.3389/fonc.2022.1001864/full#supplementary-material
References
1. Bray F, Ferlay J, Soerjomataram I, Siegel RL, Torre LA, Jemal A. Global cancer statistics 2018: GLOBOCAN estimates of incidence and mortality worldwide for 36 cancers in 185 countries. CA Cancer J Clin (2018) 68(6):394–424. doi: 10.3322/caac.21492
2. Asia Pacific COPD Roundtable Group. Global initiative for chronic obstructive lung disease strategy for the diagnosis, management and prevention of chronic obstructive pulmonary disease: an Asia-pacific perspective. Respirology (2005) 10(1):9–17. doi: 10.1111/j.1440-1843.2005.00692.x
3. Malhotra J, Malvezzi M, Negri E, La Vecchia C, Boffetta P. Risk factors for lung cancer worldwide. Eur Respir J (2016) 48(3):889–902. doi: 10.1183/13993003.00359-2016
4. Mannino DM, Buist AS. Global burden of COPD: Risk factors, prevalence, and future trends. Lancet (2007) 370(9589):765–73. doi: 10.1016/S0140-6736(07)61380-4
5. Granville CA, Dennis PA. An overview of lung cancer genomics and proteomics. Am J Respir Cell Mol Biol (2005) 32(3):169–76. doi: 10.1165/rcmb.F290
6. Lamprecht B, McBurnie MA, Vollmer WM, Gudmundsson G, Welte T, Nizankowska-Mogilnicka E, et al. COPD in never smokers: Results from the population-based burden of obstructive lung disease study. Chest (2011) 139(4):752–63. doi: 10.1378/chest.10-1253
7. Minna JD, Roth JA, Gazdar AF. Focus on lung cancer. Cancer Cell (2002) 1(1):49–52. doi: 10.1016/s1535-6108(02)00027-2
8. Nakamura H. Genetics of COPD. Allergol Int (2011) 60(3):253–8. doi: 10.2332/allergolint.11-RAI-0326
9. Wang J, Liu Q, Yuan S, Xie W, Liu Y, Xiang Y, et al. Genetic predisposition to lung cancer: Comprehensive literature integration, meta-analysis, and multiple evidence assessment of candidate-gene association studies. Sci Rep (2017) 7(1):8371. doi: 10.1038/s41598-017-07737-0
10. Saccone SF, Hinrichs AL, Saccone NL, Chase GA, Konvicka K, Madden PA, et al. Cholinergic nicotinic receptor genes implicated in a nicotine dependence association study targeting 348 candidate genes with 3713 SNPs. Hum Mol Genet (2007) 16(1):36–49. doi: 10.1093/hmg/ddl438
11. Bierut LJ, Stitzel JA, Wang JC, Hinrichs AL, Grucza RA, Xuei X, et al. Variants in nicotinic receptors and risk for nicotine dependence. Am J Psychiatry (2008) 165(9):1163–71. doi: 10.1176/appi.ajp.2008.07111711
12. Minna JD. Nicotine exposure and bronchial epithelial cell nicotinic acetylcholine receptor expression in the pathogenesis of lung cancer. J Clin Invest (2003) 111(1):31–3. doi: 10.1172/JCI17492
13. Tsurutani J, Castillo SS, Brognard J, Granville CA, Zhang C, Gills JJ, et al. Tobacco components stimulate akt-dependent proliferation and NFkappaB-dependent survival in lung cancer cells. Carcinogenesis (2005) 26(7):1182–95. doi: 10.1093/carcin/bgi072
14. Schuller HM. Is cancer triggered by altered signalling of nicotinic acetylcholine receptors? Nat Rev Cancer (2009) 9(3):195–205. doi: 10.1038/nrc2590
15. Le Marchand L, Derby KS, Murphy SE, Hecht SS, Hatsukami D, Carmella SG, et al. Smokers with the CHRNA lung cancer-associated variants are exposed to higher levels of nicotine equivalents and a carcinogenic tobacco-specific nitrosamine. Cancer Res (2008) 68(22):9137–40. doi: 10.1158/0008-5472.CAN-08-2271
16. Stephens SH, Hoft NR, Schlaepfer IR, Young SE, Corley RC, McQueen MB, et al. Externalizing behaviors are associated with SNPs in the CHRNA5/CHRNA3/CHRNB4 gene cluster. Behav Genet (2012) 42(3):402–14. doi: 10.1007/s10519-011-9514-x
17. Sun Y, Li J, Zheng C, Zhou B. Study on polymorphisms in CHRNA5/CHRNA3/CHRNB4 gene cluster and the associated with the risk of non-small cell lung cancer. Oncotarget (2017) 9(2):2435–44. doi: 10.18632/oncotarget.23459
18. DeMeo DL, Mariani T, Bhattacharya S, Srisuma S, Lange C, Litonjua A, et al. Integration of genomic and genetic approaches implicates IREB2 as a COPD susceptibility gene. Am J Hum Genet (2009) 85(4):493–502. doi: 10.1016/j.ajhg.2009.09.004
19. Pillai SG, Ge D, Zhu G, Kong X, Shianna KV, Need AC, et al. A genome-wide association study in chronic obstructive pulmonary disease (COPD): Identification of two major susceptibility loci. PloS Genet (2009) 5(3):e1000421. doi: 10.1371/journal.pgen.1000421
20. Hogg JC, Timens W. The pathology of chronic obstructive pulmonary disease. Annu Rev Pathol (2009) 4:435–59. doi: 10.1146/annurev.pathol.4.110807.092145
21. Gwilt CR, Donnelly LE, Rogers DF. The non-neuronal cholinergic system in the airways: An unappreciated regulatory role in pulmonary inflammation? Pharmacol Ther (2007) 115(2):208–22. doi: 10.1016/j.pharmthera.2007.05.007
22. Chou IC, Lee CC, Huang CC, Wu JY, Tsai JJ, Tsai CH, et al. Association of the neuronal nicotinic acetylcholine receptor subunit alpha4 polymorphisms with febrile convulsions. Epilepsia (2003) 44(8):1089–93. doi: 10.1046/j.1528-1157.2003.t01-1-44702.x
23. Amos CI, Wu X, Broderick P, Gorlov IP, Gu J, Eisen T, et al. Genome-wide association scan of tag SNPs identifies a susceptibility locus for lung cancer at 15q25.1. Nat Genet (2008) 40(5):616–22. doi: 10.1038/ng.109
24. Falvella FS, Galvan A, Frullanti E, Spinola M, Calabrò E, Carbone A, et al. Transcription deregulation at the 15q25 locus in association with lung adenocarcinoma risk. Clin Cancer Res (2009) 15(5):1837–42. doi: 10.1158/1078-0432.CCR-08-2107
25. Yang L, Qiu F, Lu X, Huang D, Ma G, Guo Y, et al. Functional polymorphisms of CHRNA3 predict risks of chronic obstructive pulmonary disease and lung cancer in Chinese. PloS One (2012) 7(10):e46071. doi: 10.1371/journal.pone.0046071
26. Lee JY, Yoo SS, Kang HG, Jin G, Bae EY, Choi YY, et al. A functional polymorphism in the CHRNA3 gene and risk of chronic obstructive pulmonary disease in a Korean population. J Korean Med Sci (2012) 27(12):1536–40. doi: 10.3346/jkms.2012.27.12.1536
27. Moher D, Liberati A, Tetzlaff J, Altman DG, PRISMA Group. Preferred reporting items for systematic reviews and meta-analyses: the PRISMA statement. PloS Med (2009) 6(7):e1000097. doi: 10.1371/journal.pmed.1000097
28. Sagoo GS, Little J, Higgins JP. Systematic reviews of genetic association studies. Human genome epidemiology network. PloS Med (2009) 6(3):e28. doi: 10.1371/journal.pmed.1000028
29. Lau J, Ioannidis JP, Schmid CH. Quantitative synthesis in systematic reviews. Ann Intern Med (1997) 127(9):820–6. doi: 10.7326/0003-4819-127-9-199711010-00008
30. Higgins JP, Thompson SG. Quantifying heterogeneity in a meta-analysis. Stat Med (2002) 21(11):1539–58. doi: 10.1002/sim.1186
31. Begg CB, Mazumdar M. Operating characteristics of a rank correlation test for publication bias. Biometrics (1994) 50(4):1088–101.
32. Egger M, Davey Smith G, Schneider M, Minder C. Bias in meta-analysis detected by a simple, graphical test. BMJ (1997) 315(7109):629–34. doi: 10.1136/bmj.315.7109.629
33. Ioannidis JP, Trikalinos TA. An exploratory test for an excess of significant findings. Clin Trials (2007) 4(3):245–53. doi: 10.1177/1740774507079441
34. Ioannidis JP, Boffetta P, Little J, O’Brien TR, Uitterlinden AG, Vineis P, et al. Assessment of cumulative evidence on genetic associations: Interim guidelines. Int J Epidemiol (2008) 37(1):120–32. doi: 10.1093/ije/dym159
35. Khoury MJ, Bertram L, Boffetta P, Butterworth AS, Chanock SJ, Dolan SM, et al. Genome-wide association studies, field synopses, and the development of the knowledge base on genetic variation and human diseases. Am J Epidemiol (2009) 170(3):269–79. doi: 10.1093/aje/kwp119
36. Wacholder S, Chanock S, Garcia-Closas M, El Ghormli L, Rothman N. Assessing the probability that a positive report is false: An approach for molecular epidemiology studies. J Natl Cancer Inst (2004) 96(6):434–42. doi: 10.1093/jnci/djh075
37. Ward LD, Kellis M. HaploReg v4: Systematic mining of putative causal variants, cell types, regulators and target genes for human complex traits and disease. Nucleic Acids Res (2016) 44(D1):D877–81. doi: 10.1093/nar/gkv1340
38. Carithers LJ, Ardlie K, Barcus M, Branton PA, Britton A, Buia SA, et al. A novel approach to high-quality postmortem tissue procurement: The GTEx project. Biopreserv Biobank (2015) 13(5):311–9. doi: 10.1089/bio.2015.0032
39. Grundberg E, Small KS, Hedman ÅK, Nica AC, Buil A, Keildson S, et al. Mapping cis- and trans-regulatory effects across multiple tissues in twins. Nat Genet (2012) 44(10):1084–9. doi: 10.1038/ng.2394
40. Machiela MJ, Chanock SJ. LDlink: A web-based application for exploring population-specific haplotype structure and linking correlated alleles of possible functional variants. Bioinformatics (2015) 31(21):3555–7. doi: 10.1093/bioinformatics/btv402
41. Saccone NL, Wang JC, Breslau N, Johnson EO, Hatsukami D, Saccone SF, et al. The CHRNA5-CHRNA3-CHRNB4 nicotinic receptor subunit gene cluster affects risk for nicotine dependence in African-americans and in European-americans. Cancer Res (2009) 69(17):6848–56. doi: 10.1158/0008-5472.CAN-09-0786
42. Hansen HM, Xiao Y, Rice T, Bracci PM, Wrensch MR, Sison JD, et al. Fine mapping of chromosome 15q25.1 lung cancer susceptibility in African-americans. Hum Mol Genet (2010) 19(18):3652–61. doi: 10.1093/hmg/ddq268
Keywords: CHRNA, genetic variants, lung cancer, COPD, susceptibility
Citation: Yang L, Yang Z, Zuo C, Lv X, Liu T, Jia C and Chen H (2022) Epidemiological evidence for associations between variants in CHRNA genes and risk of lung cancer and chronic obstructive pulmonary disease. Front. Oncol. 12:1001864. doi: 10.3389/fonc.2022.1001864
Received: 24 July 2022; Accepted: 21 September 2022;
Published: 06 October 2022.
Edited by:
Zhanjun Guo, Fourth Hospital of Hebei Medical University, ChinaReviewed by:
Namarta Kalia, University of California, San Diego, United StatesJie Tian, Sichuan University, China
Copyright © 2022 Yang, Yang, Zuo, Lv, Liu, Jia and Chen. This is an open-access article distributed under the terms of the Creative Commons Attribution License (CC BY). The use, distribution or reproduction in other forums is permitted, provided the original author(s) and the copyright owner(s) are credited and that the original publication in this journal is cited, in accordance with accepted academic practice. No use, distribution or reproduction is permitted which does not comply with these terms.
*Correspondence: Huanwen Chen, Y29vbHN0YXJjaHc5NTI3QDE2My5jb20=
†These authors have contributed equally to this work