 Haolin Yin
 Yu Jiang
 Zihan Xu3
 Wenjun Huang
 Tianwu Chen
 Guangwu Lin
- 1Department of Radiology, Huadong Hospital Affiliated to Fudan University, Shanghai, China
- 2Department of Radiology, West China Hospital, Sichuan University, Chengdu, China
- 3Lung Cancer Center, Cancer Center and State Key Laboratory of Biotherapy, West China Hospital of Sichuan University, Chengdu, China
- 4Department of Radiology, Affiliated Hospital of North Sichuan Medical College, Nanchong, China
Background and Purpose: Breast ductal carcinoma in situ (DCIS) has no metastatic potential, and has better clinical outcomes compared with invasive breast cancer (IBC). Convolutional neural networks (CNNs) can adaptively extract features and may achieve higher efficiency in apparent diffusion coefficient (ADC)-based tumor invasion assessment. This study aimed to determine the feasibility of constructing an ADC-based CNN model to discriminate DCIS from IBC.
Methods: The study retrospectively enrolled 700 patients with primary breast cancer between March 2006 and June 2019 from our hospital, and randomly selected 560 patients as the training and validation sets (ratio of 3 to 1), and 140 patients as the internal test set. An independent external test set of 102 patients during July 2019 and May 2021 from a different scanner of our hospital was selected as the primary cohort using the same criteria. In each set, the status of tumor invasion was confirmed by pathologic examination. The CNN model was constructed to discriminate DCIS from IBC using the training and validation sets. The CNN model was evaluated using the internal and external tests, and compared with the discriminating performance using the mean ADC. The area under the curve (AUC), sensitivity, specificity, and accuracy were calculated to evaluate the performance of the previous model.
Results: The AUCs of the ADC-based CNN model using the internal and external test sets were larger than those of the mean ADC (AUC: 0.977 vs. 0.866, P = 0.001; and 0.926 vs. 0.845, P = 0.096, respectively). Regarding the internal test set and external test set, the ADC-based CNN model yielded sensitivities of 0.893 and 0.873, specificities of 0.929 and 0.894, and accuracies of 0.907 and 0.902, respectively. Regarding the two test sets, the mean ADC showed sensitivities of 0.845 and 0.818, specificities of 0.821 and 0.829, and accuracies of 0.836 and 0.824, respectively. Using the ADC-based CNN model, the prediction only takes approximately one second for a single lesion.
Conclusion: The ADC-based CNN model can improve the differentiation of IBC from DCIS with higher accuracy and less time.
Introduction
Breast cancer is the most common malignant tumor in women worldwide and has the highest mortality rate among all malignant tumors in women (1). Breast ductal carcinoma in situ (DCIS) is the proliferation of malignant epithelial cells in ducts without involving the basement membrane (2). DCIS has no metastatic potential and has better clinical outcomes compared with invasive breast cancer (IBC) (3). Mammographic screening programs in many countries have led to a substantial increase in the early detection of DCIS, which accounts for 20–30% of newly detected breast cancers (4, 5). Higher detection rates have triggered anxiety concerning the problem of overdiagnosis and subsequent overtreatment. Therefore, the feasibility of pharmacological intervention may be taken into consideration, and another option would be watchful waiting rather than immediate surgery. However, approximately one-quarter of lesions diagnosed as DCIS via core needle biopsy may be upgraded to IBCs on the final pathology with surgical specimens because the limited number, size, and location of samples may miss IBCs (6, 7). Some patients with a missed diagnosis of IBCs may elect to forgo surgery and pursue watchful waiting, but this management strategy is not safe for these patients (8).
Magnetic resonance imaging (MRI) is a powerful tool for discriminating breast lesions. MRI can noninvasively cover the whole breast with high-spatial-resolution images. Diffusion-weighted imaging (DWI) can provide a surrogate marker for tissue microstructure and cell density by measuring the random movement of water molecules (9). A previous study showed that the apparent diffusion coefficient (ADC) obtained with DWI could be used as a valuable noninvasive quantitative biomarker to assess breast cancer invasiveness (10). However, it is not easy for radiologists to select a representative region of interest (ROI) of a lesion, particularly for nonmass lesions. Differences in ROIs may lead to ADCs that do not truly reflect the lesion microstructure and cell density. Furthermore, tumors interact with the tumor microenvironment, and peritumoral tissue has been indicated to provide helpful information for the diagnosis and prognosis of tumors (11–13), while the conventional method of ADC measurement usually ignores the additional peritumoral information that helps assess invasion.
Deep learning algorithms have displayed excellent performance in image recognition tasks (14). Many convolutional neural network (CNN) models with superior performance exist in deep learning, such as ResNet, AlexNet, VGG, and InceptionV3. CNNs can scan all the pixels of the images using convolution kernels and perceive the global information of the images. Thus, CNNs may offer a promising alternative to discriminate between DCIS and IBCs because of their advantages of being efficient, accurate, and reproducible. Accordingly, this study aimed to determine whether CNN applied to breast DWI can aid in the preoperative differentiation of DCIS and IBCs.
Materials and Methods
Patients
This study was approved by the ethics committee of our hospital. The requirement for obtaining informed consent from patients was waived. We retrospectively searched for breast MRI examinations using the picture archiving and communication system. The inclusion criteria for this study were as follows: 1) histologically confirmed pure DCIS or pure IBC; 2) preoperative dynamic contrast-enhanced MRI examination. The exclusion criteria were as follows: 1) preoperative endocrine therapy, chemotherapy, or radiotherapy; 2) preoperative invasive breast operation; 3) incomplete clinical data; 4) obvious artifacts in MR images (Figure 1). From March 2006 to June 2019, 700 lesions from 700 patients with primary breast cancers were included, of which 400 lesions were IBCs and 300 lesions were DCIS. We randomly selected 560 lesions as the training and validation sets (ratio of 3 to 1) and 140 lesions as the internal test set. From July 2019 to May 2021, an independent external test cohort of 102 patients with primary breast cancers from our hospital was selected as the primary cohort with the same criteria. A total of 102 lesions from these patients were included in this study.
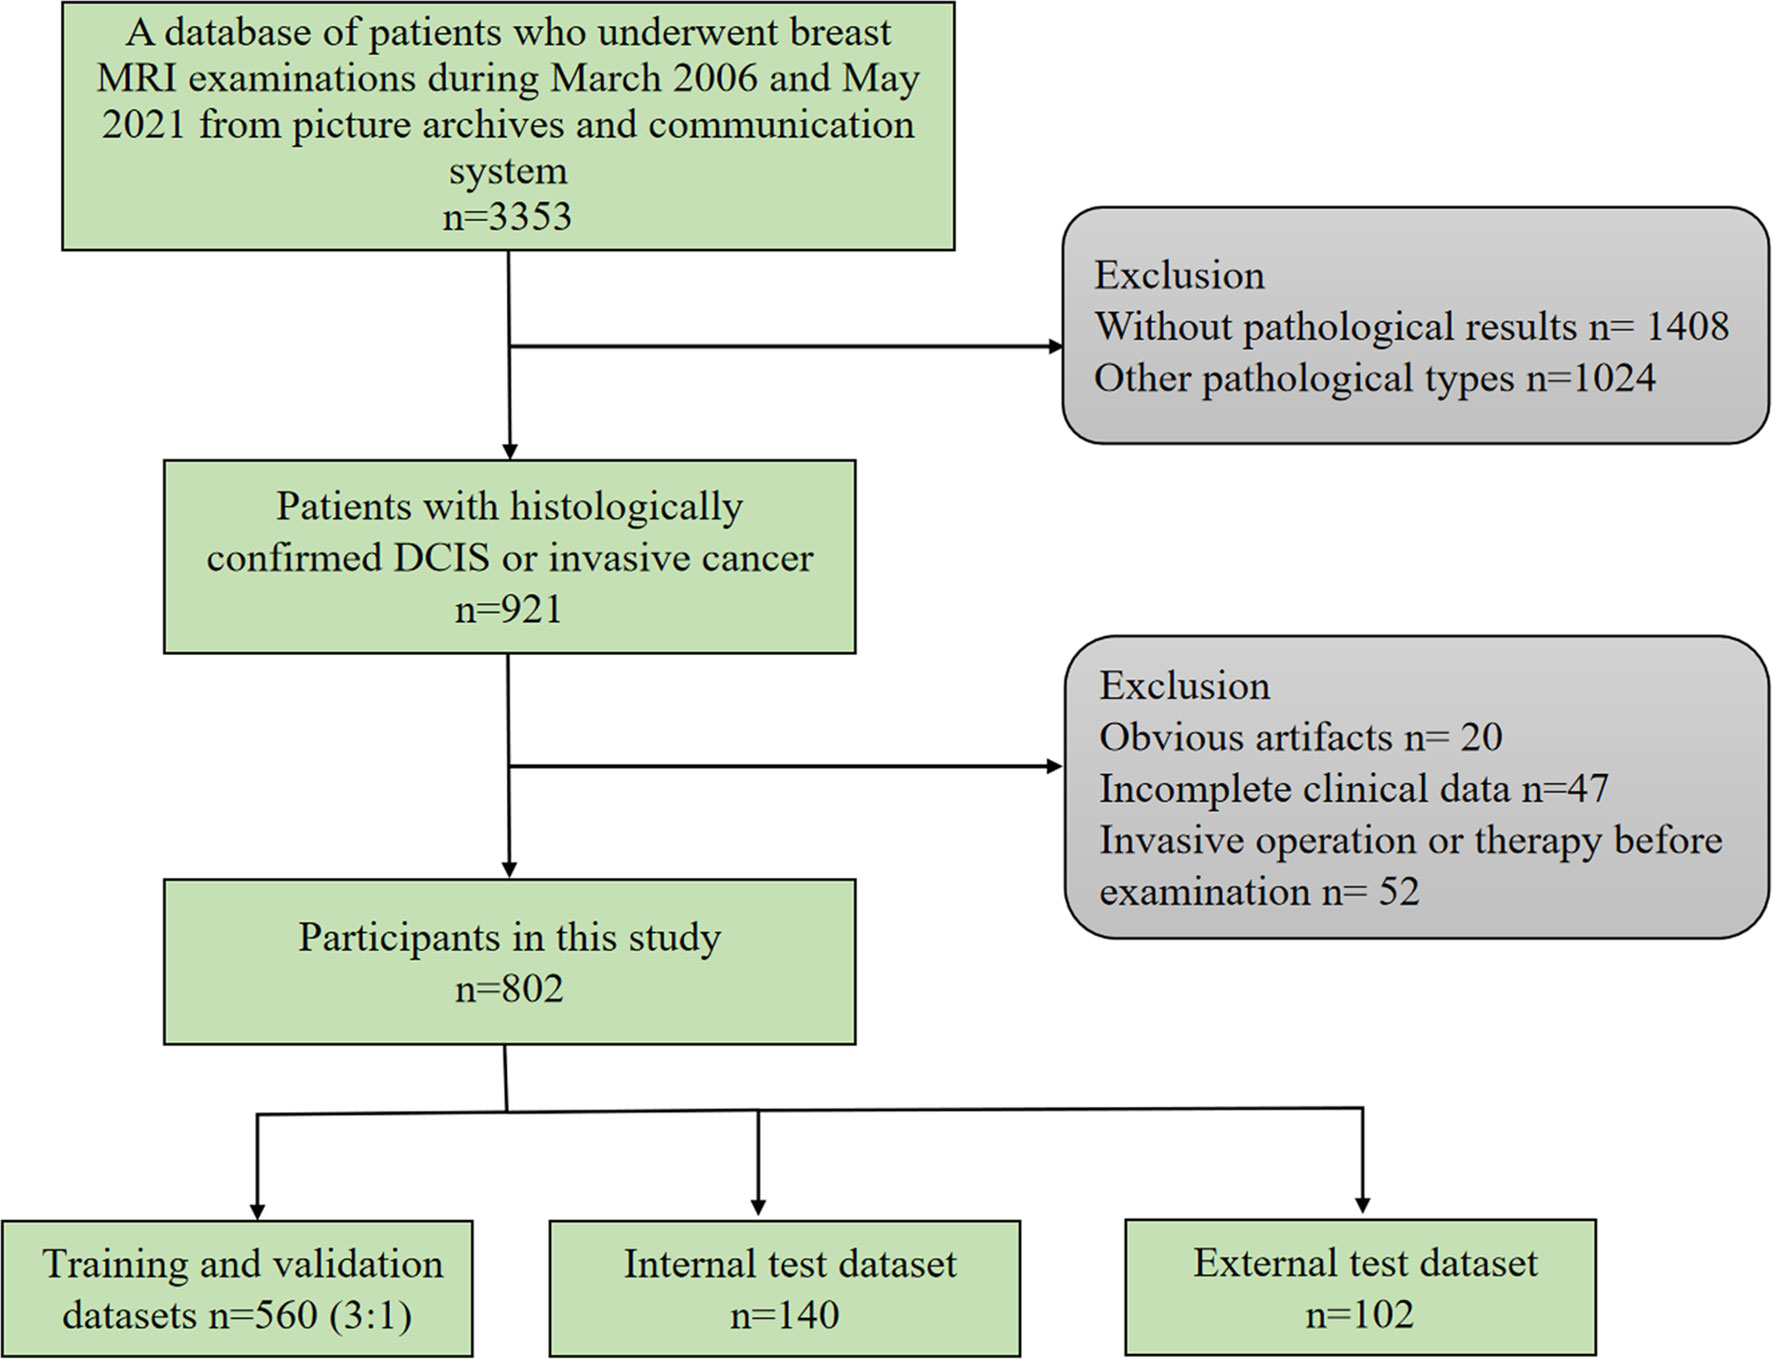
Figure 1 Flowchart of inclusion and exclusion.
MR Image Acquisition
Breast MRI examinations of the primary cohort were performed using 3.0 T superconducting MR scanners (Verio or Trio; Siemens Medical Systems, Erlangen, Germany) with a dedicated breast surface coil (4-channel or 4-channel coils). All the breast MRI examinations of the external test cohort were performed using 3.0 T superconducting MR scanners (Prisma; Siemens Medical Systems, Erlangen, Germany) with a dedicated breast surface coil (18-channel coils). All the patients were scanned in the prone position. After the standard bilateral T2-weighted (T2W) axial and DWI fat-saturated axial sequences with T1-weighted (T1W) gradient-echo VIEWS sequences, a dynamic protocol was performed with six dynamic acquisitions, one before and five immediately after an elbow vein bolus injection of gadolinium-dimeglumine (GE Healthcare) equal to 0.1 mmol per kg body weight, followed by a 20 ml saline flush. The scanning parameters of DWI are summarized in Table 1.
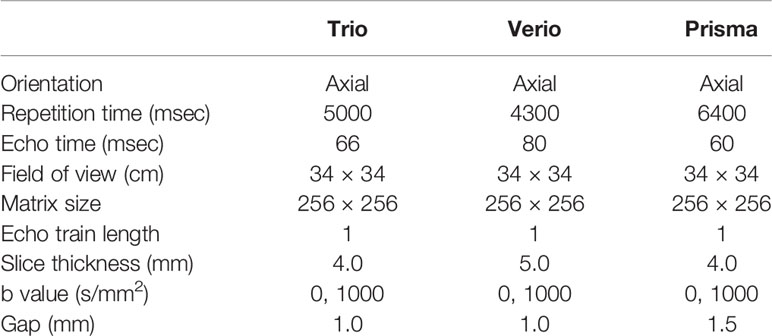
Table 1 Scanning parameters of diffusion-weighted imaging protocols on 3.0 Tesla scanners.
Definition of ROIs and Mean ADC
For the delineation and confirmation of ROIs of the lesions on ADC images, the images of T1W, T2W, and dynamic contrast-enhanced sequences were referred. Open-source software (3D Slicer; https://www.slicer.org/) was used to draw polygon ROIs for the CNN model. The polygon ROIs were drawn to cover whole lesion slice-by-slice by a radiologist with five years of experience in breast MRI analysis blinded to information about histopathology. An example of polygon ROIs is shown in Figure 2. Next, the polygon ROIs were confirmed by a radiologist with more than 15 years of experience in breast MRI analysis. To measure the mean ADCs of the breast lesions, round ROIs with sizes ranging from 16 to 225 mm2 were manually placed slice-by-slice for the whole lesion volume by the radiologist with over 15 years of experience, while cystic, necrotic, fatty, and hemorrhagic areas were avoided. The ADCs were measured directly from the picture archiving and communication system of the hospital. The mean ADCs were defined as the sum of the ADCs of all ROIs divided by the number of ROIs.
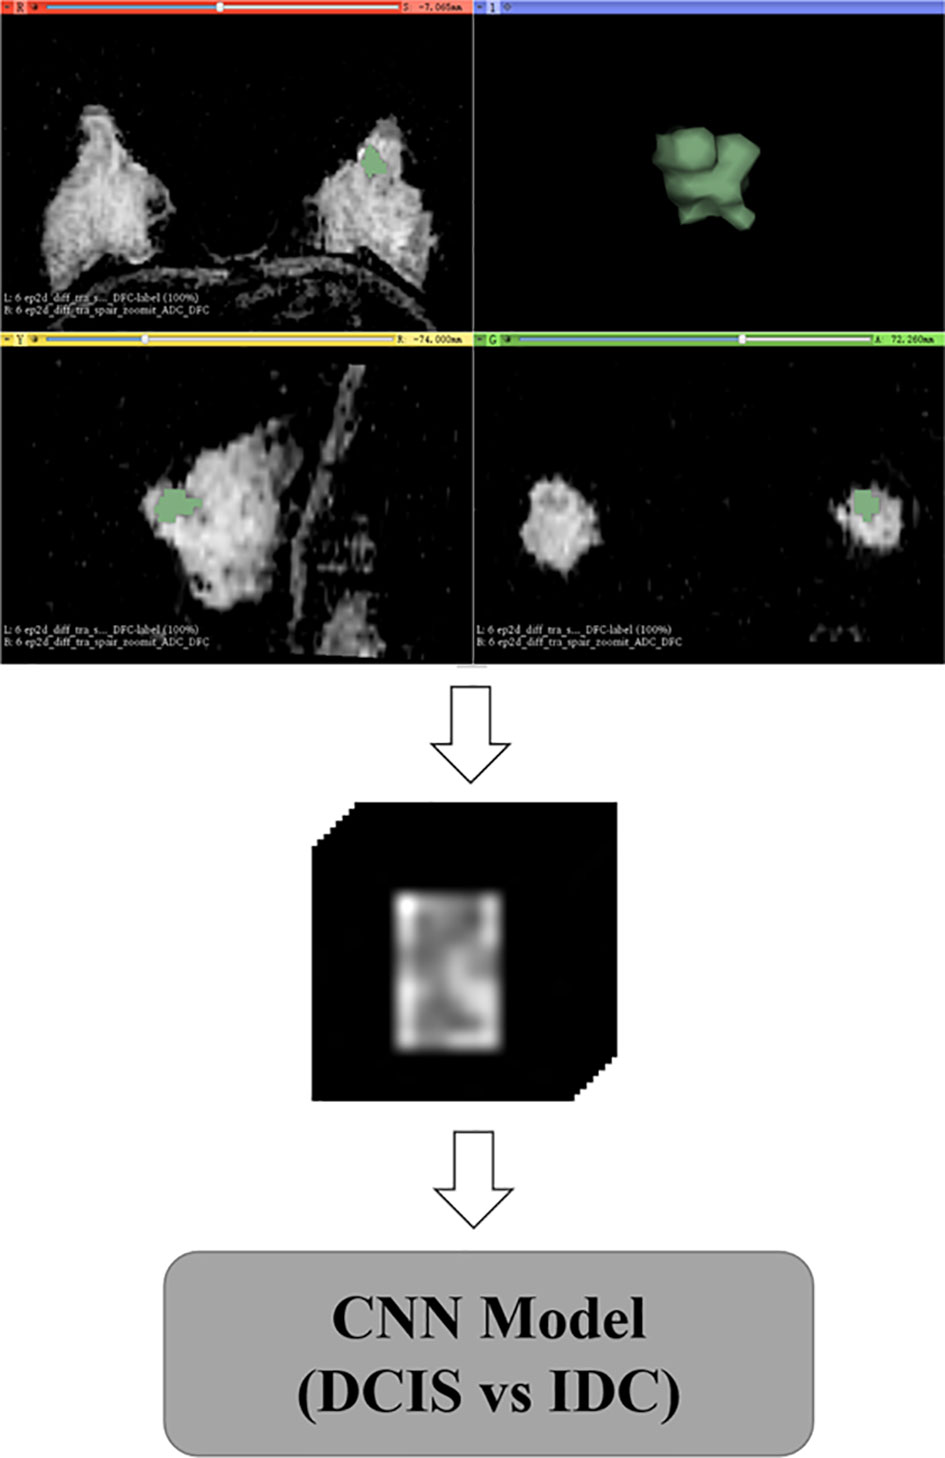
Figure 2 Delineation and preprocessing of regions of interest on apparent diffusion coefficient images.
Data Preprocessing
Data augmentation was applied to the training and validation sets during the training, with random rotation from -10 to 10 degrees, stretching from 0.8 to 1.2, and shifting from -10 to 10 pixels. After the geometric image transformations, the original size of the training and validation sets was expanded five times. The data augmentation strategy can help prevent network overfitting and avoid interference from various sources of noise to improve the robustness of the model (15, 16). Based on polygon ROIs of each lesion, a block centered at the center of the lesion containing the whole lesion region was cropped from MR images, and all blocks were reshaped to a size of 128×128×22 by zero-padding (Figure 2).
Network Architecture
The architecture of the network is shown in Figure 3. It comprised two convolution layers, four residual blocks, four max-pooling layers, two fully connected layers, and one softmax layer. Dropout was performed for the first fully connected layers to avoid overfitting. Finally, the softmax layer was used to obtain the probability of classification. The residual block was inspired by ResNet (17). All convolution layers were followed by a batch normalization (BN) layer (18), and a leaky rectified linear unit (LReLU) was used as the activation function.
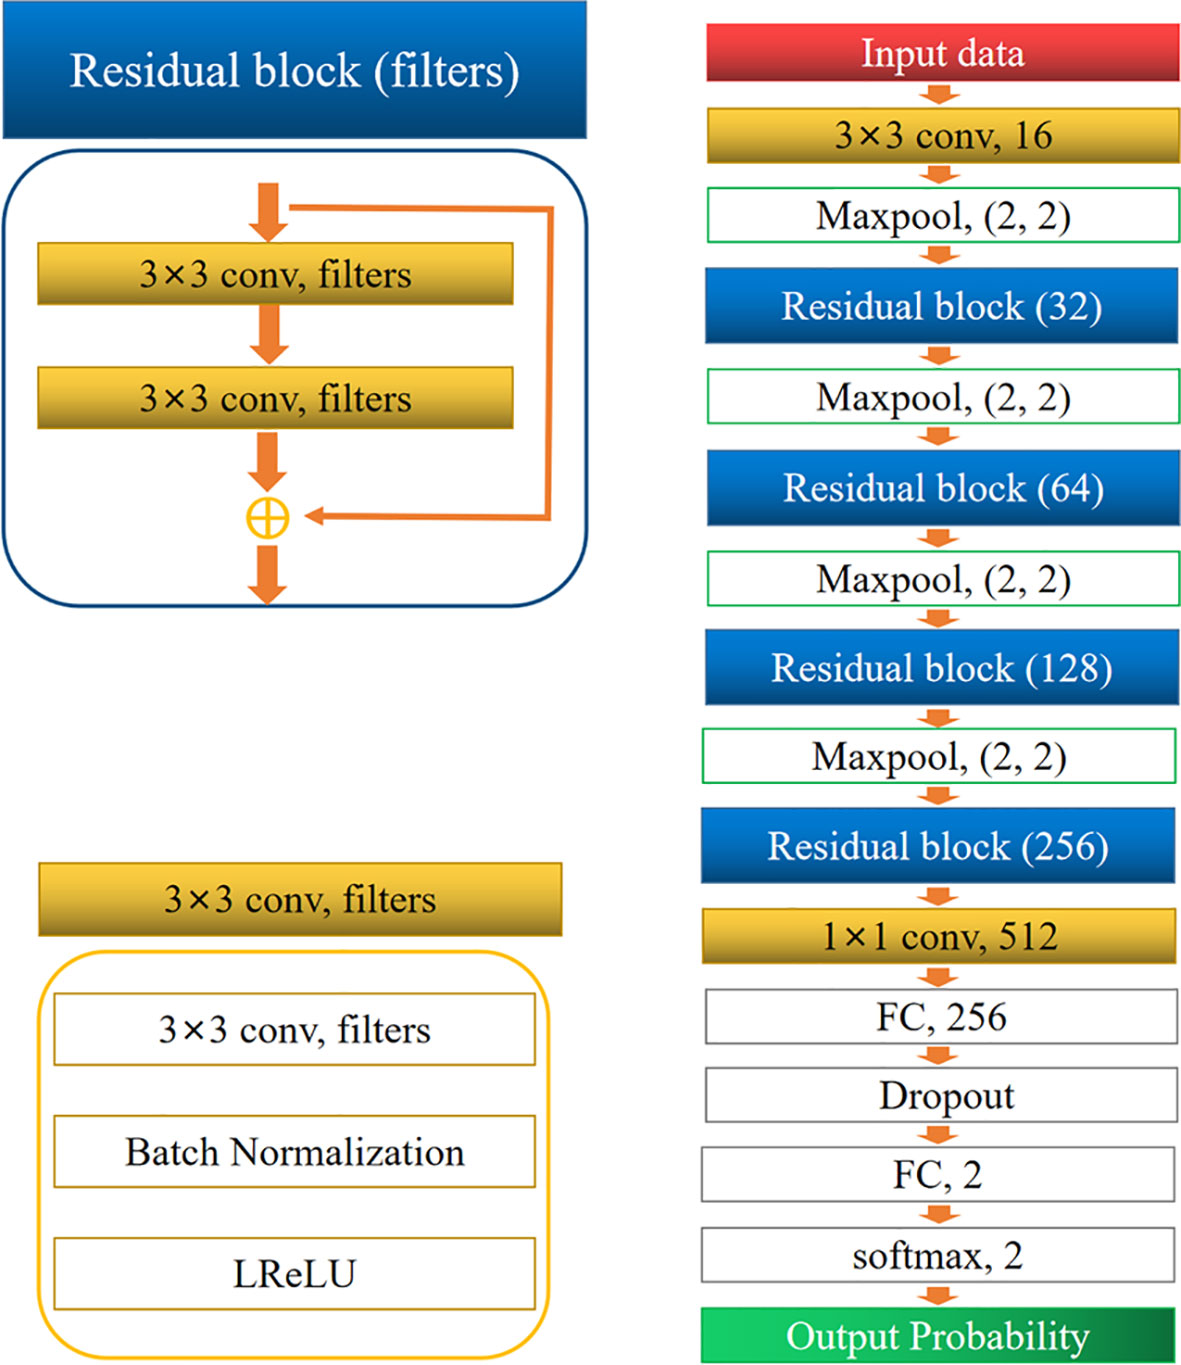
Figure 3 Architecture of the convolutional neural network.
Model Training and Testing
All preprocessing was conducted in Python (version 3.7.0; Python Software Foundation, Wilmington, Del) using PyTorch (version 1.4.0). The blocks from the training sets were fed into the network to adjust the weight of the network. Before feeding into the network, all the blocks were standardized by subtracting the mean and dividing by the standard deviation. During the training process, the ADAM algorithm with a learning rate of 0.001 was used to minimize the loss (cross-entropy) function, with a mini-batch size of 32. Finally, the model with the lowest validation loss was selected. During the training phase, an L2 regularization strategy on weight and bias was applied to prevent overfitting. The blocks from the two test sets were fed into the network to output the predicted probability of every class, and the class with the highest probability was chosen as the classification result. All the experiments were performed using a workstation equipped with two NVIDIA TITAN XP GPUs.
Statistical Analysis
All statistical analyses were performed using SPSS (IBM SPSS Statistics for Windows, v.25.0, Armonk, NY) and Python. We compared the diagnostic performance of the CNN model and mean ADC on the internal test set and external test set. The gold standard for the diagnosis of breast lesions was the postoperative histopathology result, and the classification results derived from the CNN models and the mean ADC were compared with the postoperative histopathology results. The area under the curve (AUC) and its 95% confidence interval (CI), sensitivity, specificity, positive predictive value (PPV), negative predictive value (NPV), F1 score, kappa value, and accuracy were calculated. The cutoff value was determined by maximizing Youden’s index. Significant differences between AUCs were compared by DeLong’s test (19). We analyzed the clinical characteristics of patients with primary breast cancers. Welch’s t test or Student’s t test was used for continuous variables, and Pearson’s chi-squared test was used for categorical variables. A p value < 0.05 was considered statistically significant.
Results
Clinicopathologic Data
The mean age was 48.5 years (range, 29–84 years) for patients in the training and validation sets, 50.4 years (range, 31–79 years) for patients in the internal test set, and 50.7 years (range, 35–74 years) for patients in the external test set. Among all 802 patients, 448 (55.8%) had undergone lumpectomy, and 354 (44.2%) had undergone mastectomy. Surgical specimens revealed 253 (31.5%) invasive lobular cancers, 202 (25.2%) invasive ductal cancers, and 347 (43.3%) DCIS cases. Among all the lesions, 688 (85.8%) presented as mass lesions, whereas 114 (14.2%) were nonmass lesions. The clinicopathological characteristics of all participants are listed in Table 2.
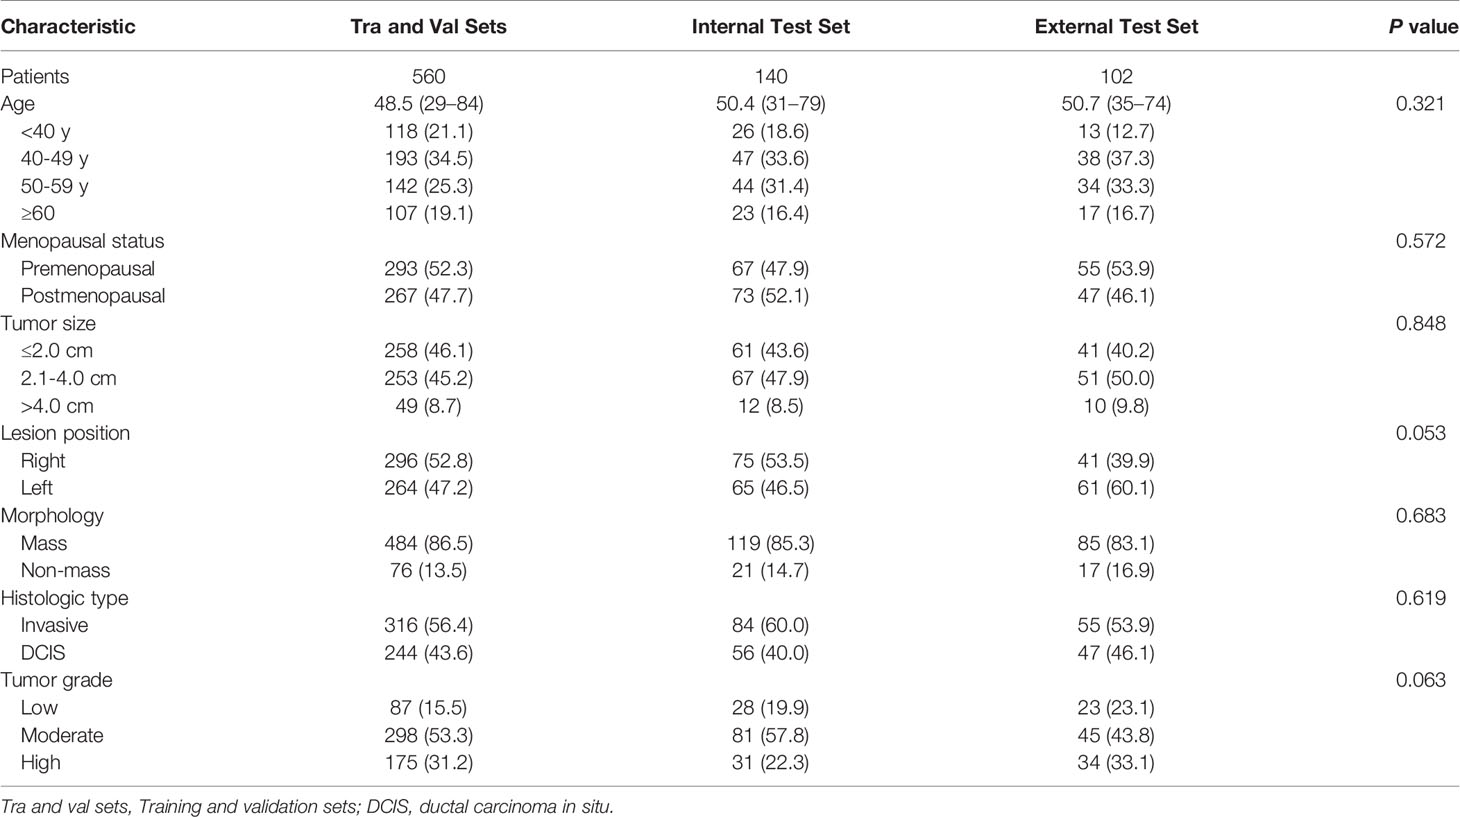
Table 2 Clinicopathological characteristics of the participants.
CNN Model and Mean ADC
An overview of the performance of the CNN model and mean ADC is shown in Table 3. Regarding the differentiation of IBC and DCIS in 140 patients in the internal test set, the CNN model yielded excellent performance, with an AUC of 0.977 (95% CI: 0.957, 0.998), a sensitivity of 0.893, a specificity of 0.929, a PPV of 0.949, an NPV of 0.852, an F1 score of 0.908, a kappa value of 0.809 and an accuracy of 0.907. In the internal test set, the mean ADC of the IBC group was 0.859×10⁻³ mm2/s (standard deviation, 0.148×10⁻³ mm2/s); in the DCIS group, it was 1.118×10⁻³ mm2/s (standard deviation, 0.169×10⁻³ mm2/s) (Figure 4A). IBC showed significantly lower ADCs than DCIS (P < 0.001). The optimal threshold for an ADC of 0.980×10⁻³ mm2/s was applied to the internal test set (Figure 4D), and the mean ADC at this threshold showed an AUC of 0.866 (95% CI: 0.805, 0.927), a sensitivity of 0.845, a specificity of 0.821, a PPV of 0.877, an NPV of 0.780, an F1 score of 0.836, a kappa value of 0.661 and an accuracy of 0.836. As shown in Figure 5A, the performance of the CNN model was significantly better than that of the mean ADC (P = 0.001).
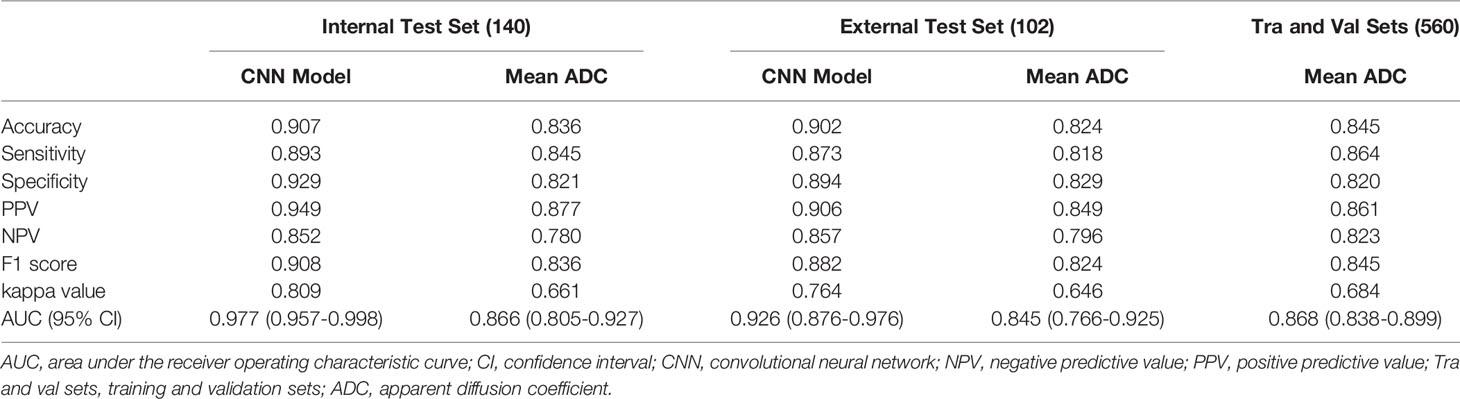
Table 3 Performance of the CNN model and mean ADC.
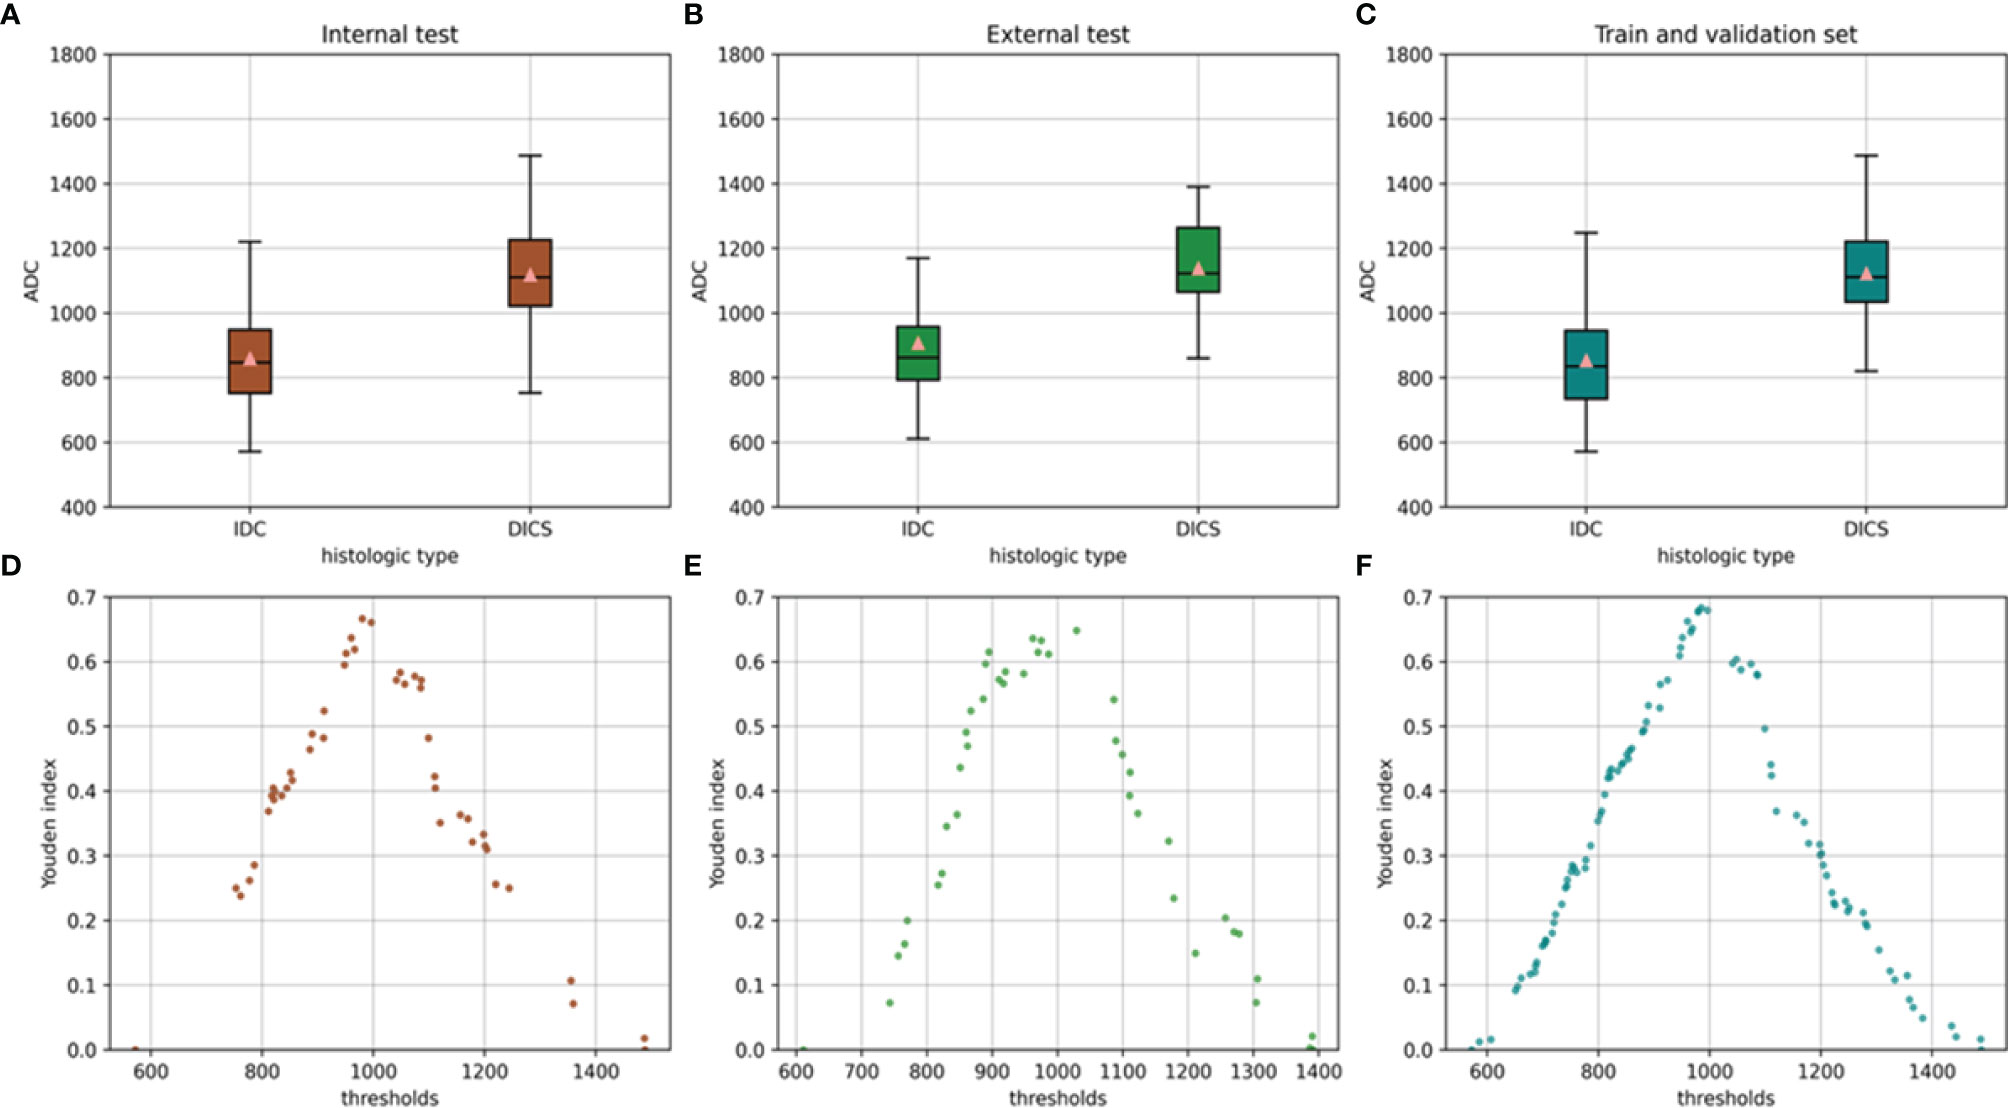
Figure 4 Mean ADC of the invasive breast cancer group and breast ductal carcinoma in situ group in the internal test set (A) external test set (B) and training and validation sets (C). Relationship between the Youden index and threshold in the internal test set (D) external test set (E) and training and validation sets (F).
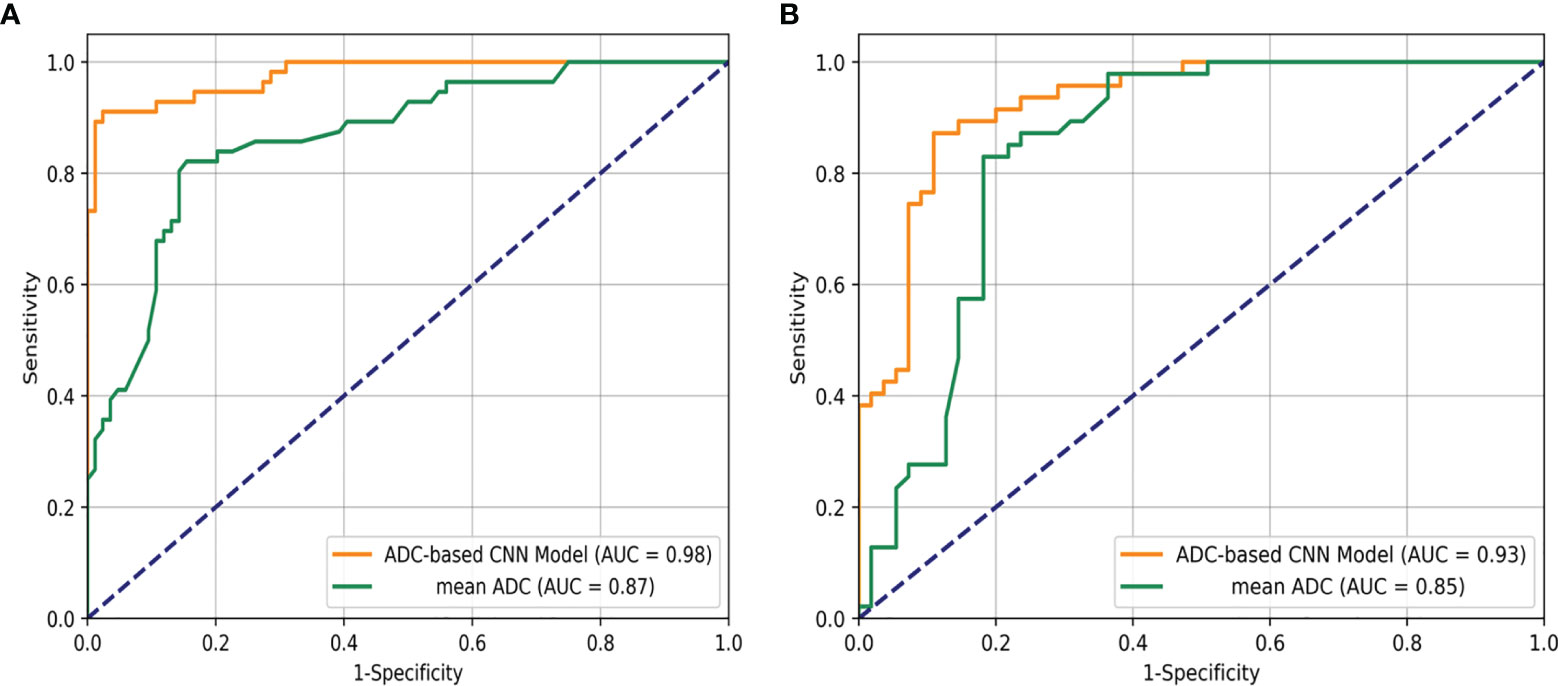
Figure 5 Receiver operating characteristic curve analysis for the differentiation of breast ductal carcinoma in situ and invasive breast cancers in the internal test set (A) and the external test set (B).
Regarding the identification of IBC and DCIS in 102 patients in the external test set, the CNN model also achieved good performance, with an AUC of 0.926 (95% CI: 0.876, 0.976), a sensitivity of 0.873, a specificity of 0.894, a PPV of 0.906, an NPV of 0.857, an F1 score of 0.882, a kappa value of 0.764 and an accuracy of 0.902. The mean ADC was also significantly lower in the IBC group than in the DCIS group in the external test set (P < 0.001). The mean ADC in the IBC group was 0.907×10⁻³ mm2/s (standard deviation, 0.178×10⁻³ mm2/s), while the mean ADC in the DCIS group was 1.138×10⁻³ mm2/s (standard deviation, 0.139×10⁻³ mm2/s) (Figure 4B). The optimal threshold for an ADC of 1.029 × 10⁻³ mm2/s was applied to the external test set (Figure 4E), and the mean ADC at this threshold showed an AUC of 0.845 (95% CI: 0.766, 0.925), a sensitivity of 0.818, a specificity of 0.829, a PPV of 0.849, an NPV of 0.796, an F1 score of 0.824, a kappa value of 0.646 and an accuracy of 0.824. As shown in Figure 5B, the performance of the CNN model was slightly better than that of the mean ADC, while there was no significant difference between them (P = 0.096).
Regarding the identification of IBC and DCIS in 560 patients in the training and validation sets, the mean ADC in the IBC group was 0.853×10⁻³ mm2/s (standard deviation, 0.159×10⁻³ mm2/s). In the DCIS group, the mean ADC was 1.123×10⁻³ mm2/s (standard deviation, 0.169×10⁻³ mm2/s) (Figure 4C). IBC showed significantly lower ADCs than DCIS (P < 0.001). The optimal threshold for an ADC of 0.985×10⁻³ mm2/s was applied to the training and validation sets (Figure 4F), and the mean ADC at this threshold showed an AUC of 0.868 (95% CI: 0.838, 0.899), a sensitivity of 0.864, a specificity of 0.820, a PPV of 0.861, an NPV of 0.823, an F1 score of 0.845, a kappa value of 0.684 and an accuracy of 0.845.
The training and validation curves of the CNN model that reflect the process of training are shown in Figure 6. As the training epoch continued, the accuracy curves of the training and validation sets gradually became stable after the rapid rise and slow rise, and the loss curves of the training and validation sets gradually became stable after the rapid decline and slow decline. The similar trends of the two loss curves suggest that the CNN model was not overfitted. The training was performed for 160 epochs, and the CNN model learned the entire training set once at each epoch. The CNN model achieved the best accuracy at the 60th epoch, and the assessments on the internal test set and external test set were based on this best model. For the CNN model, the training of the model took approximately 48 hours, and the prediction took approximately one second for a single lesion. For the mean ADC, it took approximately 3 to 8 minutes to perform the measurement and calculation for a single lesion.
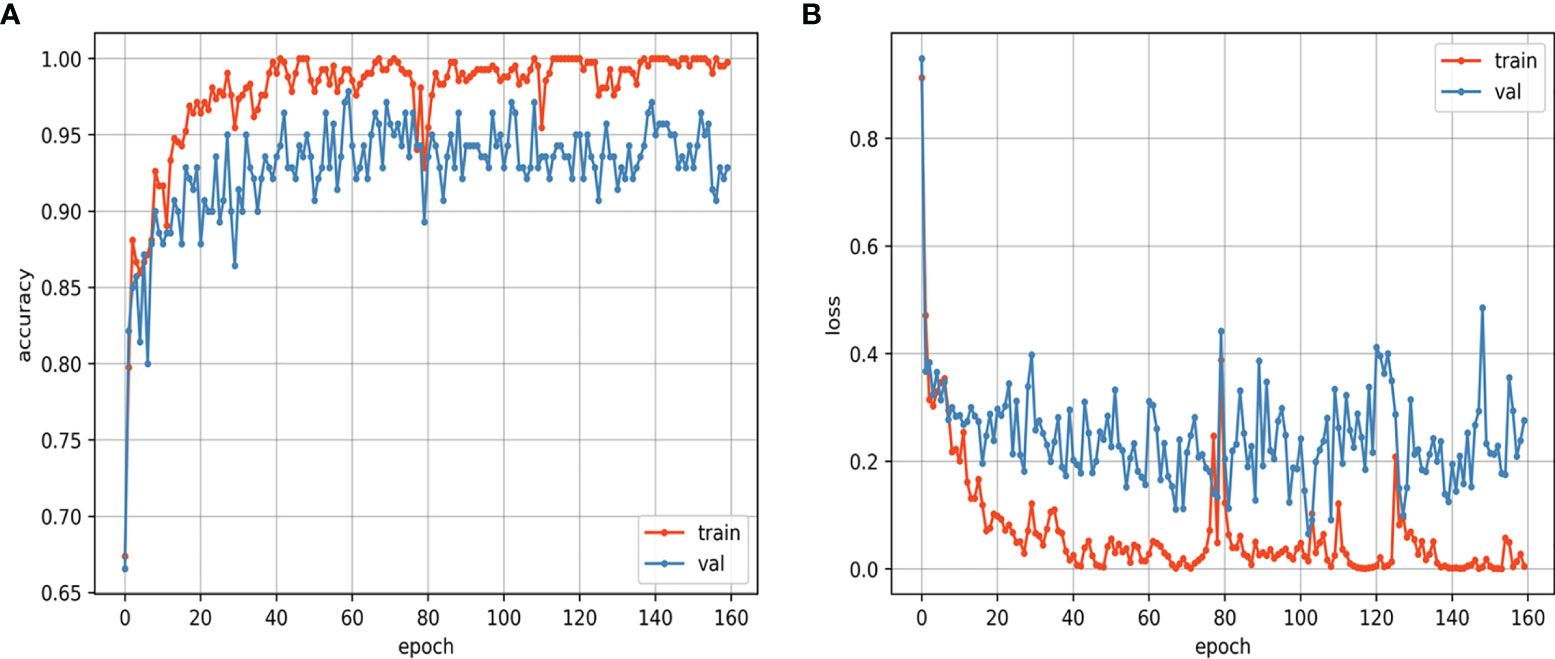
Figure 6 Loss curves (A) and accuracy curves (B) of the training and validation sets.
Discussion
This study showed the exciting utility of the CNN model in identifying IBC and DCIS. The CNN model showed good performance, with AUCs of 0.977 and 0.926, sensitivities of 0.893 and 0.873, and specificities of 0.929 and 0.894 for the internal test set and the external test set, respectively. The mean ADCs of DCIS were significantly higher than those of IBC in our study. This finding is in concurrence with those of previous studies (20). The mean ADC of the internal test set and external test set showed AUCs of 0.866 and 0.845, sensitivities of 0.845 and 0.818, and specificities of 0.821 and 0.829, respectively. Overall, the performance of the CNN model was better than that of the mean ADC. Our study successfully developed a model for discriminating IBC and DCIS in patients with breast cancer using CNN, and our results showed an improved performance in the assessment of pathological subtypes of breast cancer based on ADC images from the preoperative scans of the patients.
DWI is a quantitative measurement technique that depicts the Brownian motion of water molecules, and the ADC indirectly shows the integrity of cell membranes and degree of cell crowding (21). Therefore, the ADC provides some insight into the biological characteristics of breast lesions. Although the mean ADC has helped considerably to differentiate the pathological subtypes of breast cancer, it represents only the average measurement of voxels in the ROI area and does not consider the spatial relationship among voxels. The CNN model obtained a significantly higher AUC than the mean ADC in both the internal test set and external test set, indicating that much spatial information hidden in the ADC images of patients with primary breast cancer is useful to differentiate among pathological subtypes. This finding was also observed in a previous study (22).
ADC is an objectively and quantitatively measured variable that is less dependent on reader and interobserver variabilities than conventional morphologic features, such as shape, margin, or distribution pattern (10, 23). However, the variability of the ADC in breast DWI due to the signal-to-noise ratio, motion, off-isocenter effects, different field strengths, sequence variants of the different platforms, and inconsistencies in the ROI definition cannot be ignored (24, 25). In our study, for both the internal test set and external test set, the mean ADC achieved satisfactory performance, but the mean ADC and optimal thresholds were quite different. Our findings were consistent with those of some previous studies, which showed significant differences in the ADCs of lesions between IBC (ranging from 0.65 to 1.31×10⁻³ mm2/s) and DCIS (ranging from 0.83 to 1.59 × 10⁻³ mm2/s) (20, 26, 27). These substantial heterogeneities indicate that standardized measurement protocols, centralized quality control and centralized analyses are needed for different medical institutions, and different thresholds will be needed for ADC images of patients with primary breast cancer obtained from different scanners, protocols, and field strengths (28, 29).
In our study, the CNN model eliminated the challenge of artificially selecting the optimal ADC cutoff value and had similar performance on the internal test set and external test set. ADC images were normalized to the range from 0 to 1. The normalization method can partially eliminate the difference in data obtained from different scanners. Additionally, unlike the MRI signal of T1W and T2W sequences, which is nonlinearly related to proton density, relaxation time, time of repetition, and time of echo, ADC is an inherent physical value (22). Each ADC of a pixel-by-pixel volume has the same drift tendency when using different scanners, protocols, and field strengths. The advantage of the CNN model is that it considers the spatial relationship of a pixel-by-pixel volume in the task of identification and, may further ignore the differences from the grayscale drift of ADC images. Therefore, ADC images may be less affected by different scanners and could be good candidates to construct CNN models using data from multiple sources.
Although the manual placement of round ROIs slice-by-slice is a common method of measurement, the definition of these ROIs is very tedious and time-consuming. Additionally, operator variability in the definition of these ROIs is a significant factor currently limiting the reproducibility of ADC measurements. In our study, the blocks were generated based on polygon ROIs for the CNN model, and these blocks contained some peritumoral parenchyma. This method not only ensures a certain degree of repeatability but also obtains additional peritumoral information that helps predict invasion. The peritumoral/tumor ADC ratio is likely related to the extensive hyaluronan accumulation and biological aggressiveness of breast cancer (30). The peritumoral environment contain critical and rich information related to tumor invasiveness, including lymphovascular invasion, angiogenesis, lipids, and inflammatory components, which can be used for diagnosis or prediction (13, 31). Previous studies have confirmed that combining intratumoral and peritumoral regions can achieve significantly better performance in different tasks (32, 33).
This study has several limitations. First, this study had a retrospective design, and our results were based on a limited number of patients. Therefore, larger sample size studies are needed in the future to confirm the results. Second, selection bias may be present in our study, because these patients were not consecutive cases. Third, although the possible benefits of additional information from the peritumoral regions were considered, the blocks were not the best choice for sampling peritumoral information. An automatic segmentation algorithm based on certain standards is a promising solution, but the accuracy and stability of these algorithms still need improvement.
Conclusion
In summary, the ADC-based CNN model can improve the differentiation of IBC from DCIS with higher accuracy and less time. This strategy seems to be an effective alternative, valuable, noninvasive method to assess breast cancer invasiveness. Thus, our ADC-based CNN model has great potential to reduce overdiagnosis and is a potentially useful decision support tool in clinical applications.
Data Availability Statement
The data analyzed in this study is subject to the following licenses/restrictions: The datasets presented in this article are not readily available because of the privacy of patient information. Requests to access these datasets should be directed to corresponding author GL.
Ethics Statement
The studies involving human participants were reviewed and approved by The Institutional Review Board of Huadong Hospital ffiliated with Fudan University. Written informed consent for participation was not required for this study in accordance with the national legislation and the institutional requirements.
Author Contributions
GL and TC: study conception and design. HY and WH: data collection and analysis. HY and ZX: image processing and modeling. HY: manuscript writing. YJ: statistical analysis. All authors contributed to the article and approved the submitted version.
Funding
This work was financially supported by National Natural Science Foundation of China (81771816).
Conflict of Interest
The authors declare that the research was conducted in the absence of any commercial or financial relationships that could be construed as a potential conflict of interest.
Publisher’s Note
All claims expressed in this article are solely those of the authors and do not necessarily represent those of their affiliated organizations, or those of the publisher, the editors and the reviewers. Any product that may be evaluated in this article, or claim that may be made by its manufacturer, is not guaranteed or endorsed by the publisher.
References
1. Sung H, Ferlay J, Siegel RL, Laversanne M, Soerjomataram I, Jemal A, et al. Global Cancer Statistics 2020: GLOBOCAN Estimates of Incidence and Mortality Worldwide for 36 Cancers in 185 Countries. CA Cancer J Clin (2021) 71(3):209–49. doi: 10.3322/caac.21660
2. Silverstein MJ. Ductal Carcinoma in Situ of the Breast. Annu Rev Med (2000) 51:17–32. doi: 10.1146/annurev.med.51.1.17
3. van Roozendaal LM, Goorts B, Klinkert M, Keymeulen K, De Vries B, Strobbe LJA, et al. Sentinel Lymph Node Biopsy Can Be Omitted in DCIS Patients Treated With Breast Conserving Therapy. Breast Cancer Res Treat (2016) 156(3):517–25. doi: 10.1007/s10549-016-3783-2
4. Weaver DL, Rosenberg RD, Barlow WE, Ichikawa L, Carney PA, Kerlikowske K, et al. Pathologic Findings From the Breast Cancer Surveillance Consortium: Population-Based Outcomes in Women Undergoing Biopsy After Screening Mammography. Cancer (2006) 106(4):732–42. doi: 10.1002/cncr.21652
5. Sanders ME, Schuyler PA, Simpson JF, Page DL, Dupont WD. Continued Observation of the Natural History of Low-Grade Ductal Carcinoma in Situ Reaffirms Proclivity for Local Recurrence Even After More Than 30 Years of Follow-Up. Mod Pathol (2015) 28(5):662–9. doi: 10.1038/modpathol.2014.141
6. Oseni TO, Smith BL, Lehman CD, Vijapura CA, Pinnamaneni N, Bahl M. Do Eligibility Criteria for Ductal Carcinoma In Situ (DCIS) Active Surveillance Trials Identify Patients at Low Risk for Upgrade to Invasive Carcinoma? Ann Surg Oncol (2020) 27(11):4459–65. doi: 10.1245/s10434-020-08576-6
7. Brennan ME, Turner RM, Ciatto S, Marinovich ML, French JR, Macaskill P, et al. Ductal Carcinoma in Situ at Core-Needle Biopsy: Meta-Analysis of Underestimation and Predictors of Invasive Breast Cancer. Radiology (2011) 260(1):119–28. doi: 10.1148/radiol.11102368
8. Grimm LJ, Ryser MD, Partridge AH, Thompson AM, Thomas JS, Wesseling J, et al. Surgical Upstaging Rates for Vacuum Assisted Biopsy Proven DCIS: Implications for Active Surveillance Trials. Ann Surg Oncol (2017) 24(12):3534–40. doi: 10.1245/s10434-017-6018-9
9. Spick C, Pinker-Domenig K, Rudas M, Helbich TH, Baltzer PA. MRI-Only Lesions: Application of Diffusion-Weighted Imaging Obviates Unnecessary MR-Guided Breast Biopsies. Eur Radiol (2014) 24(6):1204–10. doi: 10.1007/s00330-014-3153-6
10. Bickel H, Pinker-Domenig K, Bogner W, Spick C, Bago-Horvath Z, Weber M, et al. Quantitative Apparent Diffusion Coefficient as a Noninvasive Imaging Biomarker for the Differentiation of Invasive Breast Cancer and Ductal Carcinoma in Situ. Invest Radiol (2015) 50(2):95–100. doi: 10.1097/RLI.0000000000000104
11. Wu JS, Sheng SR, Liang XH, Tang YL. The Role of Tumor Microenvironment in Collective Tumor Cell Invasion. Future Oncol (2017) 13(11):991–1002. doi: 10.2217/fon-2016-0501
12. Freed M, Storey P, Lewin AA, Babb J, Moccaldi M, Moy L, et al. Evaluation of Breast Lipid Composition in Patients With Benign Tissue and Cancer by Using Multiple Gradient-Echo MR Imaging. Radiology (2016) 281(1):43–53. doi: 10.1148/radiol.2016151959
13. Cheon H, Kim HJ, Kim TH, Ryeom HK, Lee J, Kim GC, et al. Invasive Breast Cancer: Prognostic Value of Peritumoral Edema Identified at Preoperative MR Imaging. Radiology (2018) 287(1):68–75. doi: 10.1148/radiol.2017171157
14. LeCun Y, Bengio Y, Hinton G. Deep Learning. Nature (2015) 521(7553):436–44. doi: 10.1038/nature14539
15. Roth HR, Lu L, Liu J, Yao J, Seff A, Cherry K, et al. Improving Computer-Aided Detection Using Convolutional Neural Networks and Random View Aggregation. IEEE Trans Med Imaging (2016) 35(5):1170–81. doi: 10.1109/TMI.2015.2482920
16. Kayalibay B, Jensen G, van der Smagt P. CNN-Based Segmentation of Medical Imaging Data (2017). Available at: https://ui.adsabs.harvard.edu/abs/2017arXiv170103056K (Accessed October 2, 2021).
17. He K, Zhang X, Ren S, Sun J. Deep Residual Learning for Image Recognition. In: 2016 IEEE Conference on Computer Vision and Pattern Recognition (CVPR) Las Vegas, NV, USA: Institute of Electrical and Electronics Engineers (IEEE) (2016). p. 770–8. doi: 10.1109/CVPR.2016.90
18. Ioffe S, Szegedy C. Batch Normalization: Accelerating Deep Network Training by Reducing Internal Covariate Shift (2015). Available at: https://ui.adsabs.harvard.edu/abs/2015arXiv150203167I.
19. DeLong ER, DeLong DM, Clarke-Pearson DL. Comparing the Areas Under Two or More Correlated Receiver Operating Characteristic Curves: A Nonparametric Approach. Biometrics (1988) 44(3):837–45. doi: 10.2307/2531595
20. Partridge SC, Mullins CD, Kurland BF, Allain MD, DeMartini WB, Eby PR, et al. Apparent Diffusion Coefficient Values for Discriminating Benign and Malignant Breast MRI Lesions: Effects of Lesion Type and Size. AJR Am J Roentgenol (2010) 194(6):1664–73. doi: 10.2214/AJR.09.3534
21. Partridge SC, McDonald ES. Diffusion Weighted Magnetic Resonance Imaging of the Breast: Protocol Optimization, Interpretation, and Clinical Applications. Magn Reson Imaging Clin N Am (2013) 21(3):601–24. doi: 10.1016/j.mric.2013.04.007
22. Zhu HT, Zhang XY, Shi YJ, Li XT, Sun YS. A Deep Learning Model to Predict the Response to Neoadjuvant Chemoradiotherapy by the Pretreatment Apparent Diffusion Coefficient Images of Locally Advanced Rectal Cancer. Front Oncol (2020) 10:574337. doi: 10.3389/fonc.2020.574337
23. Ikeda DM, Hylton NM, Kinkel K, Hochman MG, Kuhl CK, Kaiser WA, et al. Development, Standardization, and Testing of a Lexicon for Reporting Contrast-Enhanced Breast Magnetic Resonance Imaging Studies. J Magn Reson Imaging (2001) 13(6):889–95. doi: 10.1002/jmri.1127
24. Newitt DC, Zhang Z, Gibbs JE, Partridge SC, Chenevert TL, Rosen MA, et al. Test-Retest Repeatability and Reproducibility of ADC Measures by Breast DWI: Results From the ACRIN 6698 Trial. J Magn Reson Imaging (2019) 49(6):1617–28. doi: 10.1002/jmri.26539
25. Dale BM, Braithwaite AC, Boll DT, Merkle EM. Field Strength and Diffusion Encoding Technique Affect the Apparent Diffusion Coefficient Measurements in Diffusion-Weighted Imaging of the Abdomen. Invest Radiol (2010) 45(2):104–8. doi: 10.1097/RLI.0b013e3181c8ceac
26. Tozaki M, Fukuma E. 1h MR Spectroscopy and Diffusion-Weighted Imaging of the Breast: Are They Useful Tools for Characterizing Breast Lesions Before Biopsy? AJR Am J Roentgenol (2009) 193(3):840–9. doi: 10.2214/AJR.08.2128
27. Baltzer PA, Renz DM, Herrmann KH, Dietzel M, Krumbein I, Gajda M, et al. Diffusion-Weighted Imaging (DWI) in MR Mammography (MRM): Clinical Comparison of Echo Planar Imaging (EPI) and Half-Fourier Single-Shot Turbo Spin Echo (HASTE) Diffusion Techniques. Eur Radiol (2009) 19(7):1612–20. doi: 10.1007/s00330-009-1326-5
28. Giannotti E, Waugh S, Priba L, Davis Z, Crowe E, Vinnicombe S. Assessment and Quantification of Sources of Variability in Breast Apparent Diffusion Coefficient (ADC) Measurements at Diffusion Weighted Imaging. Eur J Radiol (2015) 84(9):1729–36. doi: 10.1016/j.ejrad.2015.05.032
29. Clauser P, Marcon M, Maieron M, Zuiani C, Bazzocchi M, Baltzer PA. Is There a Systematic Bias of Apparent Diffusion Coefficient (ADC) Measurements of the Breast If Measured on Different Workstations? An Inter- and Intra-Reader Agreement Study. Eur Radiol (2016) 26(7):2291–6. doi: 10.1007/s00330-015-4051-2
30. Kettunen T, Okuma H, Auvinen P, Sudah M, Tiainen S, Sutela A, et al. Peritumoral ADCs in Breast Cancer: Region of Interest Selection, Associations With Hyaluronan Intensity, and Prognostic Significance. Eur Radiol (2020) 30(1):38–46. doi: 10.1007/s00330-019-06361-y
31. Shin HJ, Park JY, Shin KC, Kim HH, Cha JH, Chae EY, et al. Characterization of Tumor and Adjacent Peritumoral Stroma in Patients With Breast Cancer Using High-Resolution Diffusion-Weighted Imaging: Correlation With Pathologic Biomarkers. Eur J Radiol (2016) 85(5):1004–11. doi: 10.1016/j.ejrad.2016.02.017
32. Wu X, Dong D, Zhang L, Fang M, Zhu Y, He B, et al. Exploring the Predictive Value of Additional Peritumoral Regions Based on Deep Learning and Radiomics: A Multicenter Study. Med Phys (2021) 48(5):2374–85. doi: 10.1002/mp.14767
33. Braman NM, Etesami M, Prasanna P, Dubchuk C, Gilmore H, Tiwari P, et al. Intratumoral and Peritumoral Radiomics for the Pretreatment Prediction of Pathological Complete Response to Neoadjuvant Chemotherapy Based on Breast DCE-MRI. Breast Cancer Res (2017) 19(1):57. doi: 10.1186/s13058-017-0846-1
Keywords: breast cancer, ductal carcinoma in situ, diffusion-weighted imaging, magnetic resonance imaging, deep learning
Citation: Yin H, Jiang Y, Xu Z, Huang W, Chen T and Lin G (2022) Apparent Diffusion Coefficient-Based Convolutional Neural Network Model Can Be Better Than Sole Diffusion-Weighted Magnetic Resonance Imaging to Improve the Differentiation of Invasive Breast Cancer From Breast Ductal Carcinoma In Situ. Front. Oncol. 11:805911. doi: 10.3389/fonc.2021.805911
Received: 31 October 2021; Accepted: 24 December 2021;
Published: 14 January 2022.
Edited by:
Yanhui Guo, University of Illinois at Springfield, United StatesReviewed by:
Fredrik Wärnberg, University of Gothenburg, SwedenChunling Liu, Guangdong Provincial People’s Hospital, China
Copyright © 2022 Yin, Jiang, Xu, Huang, Chen and Lin. This is an open-access article distributed under the terms of the Creative Commons Attribution License (CC BY). The use, distribution or reproduction in other forums is permitted, provided the original author(s) and the copyright owner(s) are credited and that the original publication in this journal is cited, in accordance with accepted academic practice. No use, distribution or reproduction is permitted which does not comply with these terms.
*Correspondence: Guangwu Lin, bGluZ3cwMTAwMEAxNjMuY29t; Tianwu Chen, Y2hlbnR3QGFsaXl1bi5jb20=
†These authors have contributed equally to this work