 Jing Ren
 Jinmin Sun
 Mengwei Li
 Zifan Zhang
 Dejun Yang
 Haowei Cao
94% of researchers rate our articles as excellent or good
Learn more about the work of our research integrity team to safeguard the quality of each article we publish.
Find out more
ORIGINAL RESEARCH article
Front. Oncol. , 06 December 2021
Sec. Cancer Immunity and Immunotherapy
Volume 11 - 2021 | https://doi.org/10.3389/fonc.2021.793025
This article is part of the Research Topic Diverse roles of MAP4K4 in MAP Kinase signalling and its implication for cancer therapeutics View all 5 articles
Glioma is the most common primary brain tumor that causes significant morbidity and mortality. MAPK activated protein kinase 3 (MAPKAPK3/MK3) is a serine/threonine protein kinase regulating various cellular responses and gene expression. However, the role of MK3 in tumor progress, prognosis, and immunity for glioma remains unclear. Here, we determined the expression and prognostic values of MK3. We further analyzed the correlation of MK3 expression with immune infiltrations by using the biochemical methods and bioinformatic approaches with available databases. We find that MK3 is aberrantly upregulated in glioma. In addition, the higher MK3 expression is closely linked to the poor clinicopathologic features of glioma patients. Importantly, MK3 expression is negatively correlated with the prognosis of patients with glioma. Mechanistically, we demonstrated that the correlated genes of MK3 were mainly enriched in pathways that regulate tumor immune responses. The MK3 level was significantly associated with tumor-infiltrating immune cells and positively correlated with the majority of tumor immunoinhibitors, chemokines, and chemokine receptors in glioma. Thus, these findings suggest the novel prognostic roles of MK3 and define MK3 as a promising target for glioma immunotherapy.
Glioma is known as the most common primary brain and spinal cord tumor (1), with an estimated annual incidence rate of 6.57 per 100,000 persons in the United States (2). Despite their relatively rare rate, glioma usually causes significant morbidity and mortality because of the low treatment success rate and poor overall survival (OS) rate. Among the newly diagnosed glioma, glioblastoma (GBM) is the most malignant form of brain cancer accounting for about 50% (3), with a 5-year survival rate of approximately 5% (4). So far, the main therapeutic options for glioma patients include surgery resection (5), chemotherapy (6), radiotherapy (7), and immunotherapy (8). However, the glioma, especially GBM, still remains incurable with poor prognosis, which imposes enormous pressure on society, although some clinically relevant epigenetic biomarkers such as IDH status, O-6-methylguanine-DNA methyltransferase (MGMT) promoter methylation status, histone code, and chromatin organization have been used for classification of glioma and treatment decisions (9). Thus, searching for the novel specific biomarker for advancing the prognosis of glioma remains an imperative challenge.
MAPK activated protein kinase 3 (MAPKAPK3/MK3) was first reported in 1996, located on human chromosome band 3p21.2 (10). MK3 belongs to the Ser/Thr protein kinase family, which functions as mitogen-activated protein kinase (MAPK)-activated protein. MK3 shares a highly similar sequence to MAPK activated protein kinase 2 (MAPKAPK2/MK2), possessing 72% nucleotide and 75% amino acid identity (11). MK3 is primarily activated by the MAPKs p38 α/β (12), ERK1/2, and JNK1/2 (10). MK3 plays an important role in regulating cytokine production (13), endocytosis (14), interferon therapy (15), autophagy (16), inflammation (17), intimal hyperplasia (18), chromatin remodeling (19), and transcription regulation (20). MK3 has been associated with several diseases, such as glomerulonephritis (21), skin disease (22), influenza A virus infection (23), and diabetes (24).
A previous study has reported that MK3 could act as a reliable prognostic indicator for colorectal cancer patients (25) as well as regulate NK cell cytotoxicity and CD4 T-cell development (23). However, the expression, clinical significance, biological roles, and potential molecular mechanisms of MK3 in glioma have yet not been investigated. Here, we revealed that MK3 was aberrantly overexpressed in glioma tissues and cell lines. We reported that the MK3 expression was closely associated with the poor clinicopathologic features and prognosis of glioma. Through the function and pathway enrichment analyses, we demonstrated that the correlated genes of MK3 were mainly enriched in immune regulatory pathways. Finally, we recovered the close correlation of MK3 expression with immune infiltration, immune-related genes, and immune checkpoints in glioma. Together, our study deciphered the essential role of MK3 in glioma prognosis and tumor immunoregulation.
We collected 92 glioma tissues that were identified by the pathologists according to the 2016 WHO classification criteria from the Department of Pathology of the Affiliated Hospital of Xuzhou Medical University between 2016 and 2017. We obtained the ethical review and approval from the institutional ethics committee of Affiliated Hospital of Xuzhou Medical University (ethical review no. XYFY2018-KL056-01).
Human GBM cell lines (U118, U87, U251, T98G, and LN229), human normal brain glial cells (HEB), and normal human astrocyte (NHA) were originally obtained from the American Type Culture Collection (ATCC). All these cell lines were cultured with Dulbecco’s modified Eagle’s medium (DMEM; KeyGen Biotech, China) containing 10% fetal bovine serum (FBS, Takara, Japan) at 37°C within a humid atmosphere containing 5% CO2.
We analyzed the MK3 expression with the “Single Gene Analysis” module of Gene Expression Profiling Interactive Analysis (GEPIA) web (http://gepia.cancer-pku.cn/) and observed the differential expression of MK3 between tumor and adjacent normal tissues for the different tumors or specific tumor subtypes of The Cancer Genome Atlas (TCGA). RNA-sequencing (RNA-seq) data of 689 GBM and low-grade glioma (LGG) tissues from TCGA dataset (https://www.cancer.gov/about-nci/organization/ccg/research/structural-genomics/tcga) and 1,157 normal tissues from Genotype-Tissue Expression (GTEx) (https://www.genome.gov/Funded-Programs-Projects/Genotype-Tissue-Expression-Project) were used for MK3 expression analyses. RNA-seq data of 413 glioma tissues (batch I) and 273 glioma tissues (batch II) datasets after deletion of incomplete data from the Chinese Glioma Genome Atlas (CGGA) dataset were also utilized for the expression analyses. In addition, we analyzed the expression of MK3 in glioma by using the Gene Expression Omnibus (GEO) database, GSE4290, and GSE7696 (https://www.ncbi.nlm.nih.gov/geo/). t-Test was used for the expression analyses by using R package “ggplot2.”
Cells were lysed with radioimmunoprecipitation assay (RIPA) extraction reagent [50 mM of Tris-HCl, pH 8.0, 150 mM of NaCl, 0.5% sodium deoxycholate, 1% NP-40, and 0.1% sodium dodecyl sulfate (SDS)] containing the protease inhibitors (Roche, Germany). Total protein was separated using 10% polyacrylamide gel electrophoresis and transferred to NC membrane (Millipore, USA). The membrane was blocked with 5% bovine serum albumin (BSA) in TBST for 1 h at room temperature and then incubated with the primary antibodies against MK3 (1:200, Santa Cruz, USA) and GAPDH (1:10,000, ProteinTech, USA) at 4°C overnight. Then the membrane was washed three times using 0.1% TBST buffer and incubated with the horseradish peroxidase (HRP)-conjugated secondary antibodies for 1 h at room temperature, followed by three times TBST buffer washing. Finally, the signal was detected with enhanced chemiluminescence reagent.
The 4-μm-thick glioma sections were stained with a specific primary antibody against MK3 (1:50, Santa Cruz, USA) at 4°C overnight. Then the sections were incubated with secondary antibody (ZSGB-BIO, China) for 1 h and DAB for 2–5 min at room temperature, followed by hematoxylin staining. The images were acquired by Olympus microscopy and scored by two experienced pathologists without knowing the patients’ characteristics. Scores were calculated based on the intensity and percentage of positive tumor cells within the whole tissue, which were evaluated by using the German semiquantitative scoring method. The intensity score of cytoplasmic staining of each specimen was defined as follows: 0, negative; 1, weak; 2, moderate; and 3, strong. The percentage of positive cells was evaluated with 0.0% staining; 1, 1%–24 % staining; 2, 25%–49% staining; 3, 50%–74% staining; and 4, 75%–100% staining. The final immunoreactive score was calculated by the multiplication of the intensity scores and proportion scores.
We obtained the survival and clinical phenotype data of each sample from TCGA and CGGA datasets. The Kaplan–Meier (KM) curve analyses were conducted by the R package “survival” and “survminer.” Cox analysis was used for survival analyses by using the R package “survival.” The receiver operating characteristic (ROC) analysis was performed with the R package “pROC.”
Univariate and multivariate Cox analyses were conducted by using the R package “survival.” The WHO grade, IDH status, 1p/19q codeletion, primary therapy outcome, gender, age, and MK3 expression were included in these analyses.
We searched the MK3 with the query of protein name (“MK3”) and organism (“Homo sapiens”) on the STRING website (https://string-db.org/). The basic setting parameters were the network type (“full STRING network”), meaning of network edges (“evidence”), active interaction sources (“experiments”), minimum required interaction score (“low confidence (0.150)”), and max number of interactors to show (“no more than 50 interactors in 1st shell”).
Gene expression data of GBM and LGG in HTSeq-Counts were downloaded from TCGA website for further analysis. The correlated genes of MK3 were screened with Pearson’s correlation coefficients (|r| >0.4 and p < 0.001) with R package “deseq2.” Gene Ontology (GO) and Kyoto Encyclopedia of Genes and Genome (KEGG) analysis were conducted on MK3 correlated genes with R package “clusterProfiler” to identify the possible biological functions and signaling pathways affected by MK3. The biological process (BP), cellular component (CC), and molecular function (MF) were applied in GO analysis.
The Gene Set Enrichment Analysis (GSEA) was performed to dissect the cancer-related pathways by using the MSigDB Collection (c2.cp.v7.2.symbols.gmt) of the clusterProfiler R package. The gene sets with normal p. adjust value and false discovery rate (FDR) q value both less than 0.05 were considered as significantly enriched.
We obtained the single-cell RNA-seq data from the Single CellBETA PORTAL website (https://singlecell.broadinstitute.org/single_cell/study/SCP393/single-cell-rna-seq-of-adult-and-pediatric-glioblastoma#study-download), (https://singlecell.broadinstitute.org/single_cell/study/SCP50/single-cell-rna-seq-analysis-of-astrocytoma), and (https://singlecell.broadinstitute.org/single_cell/study/SCP147/single-cell-analysis-in-pediatric-midline-gliomas-with-histone-h3k27m-mutation#study-visualize) (26) to explore the distribution of MK3 from the tumor samples.
The immune cell infiltration levels from tumors were quantified by the single-sample GSEA (ssGSEA) with the R package “GSVA” (27). The correlation between the MK3 expression and immunoinhibitors, chemokines, and chemokine receptors across human cancers was determined on the Tumor-Immune System Interaction Database (TISIDB) website (http://cis.hku.hk/TISIDB/index.php). The correlation analysis between the expression of MK3 and immunoinhibitors, chemokines, and chemokine receptor genes of the glioma was evaluated by using the R-package “ggplot2.”
The correlation of MK3 expression with immune checkpoint expression from glioma was analyzed on the Tumor IMmune Estimation Resource (TIMER) website (https://cistrome.shinyapps.io/timer/) and adjusted by the tumor purity.
All gene expression data were normalized with log2 transformation. Statistical analyses were conducted by R (3.6.3). The survival data from the CGGA database were acquired by KM. The correlation analysis was evaluated by chi-square (χ2) test, Pearson’s correlation, or Spearman’s correlation analysis. Student’s t-test was used to determine the statistical significance of differences between groups, and the differences between more than two groups were analyzed by one-way ANOVA or the Kruskal–Wallis test. A two-sided Mann–Whitney test was used for non-parametric data. p-Value < 0.05 was considered statistically significant. *p < 0.05, **p < 0.01, and ***p < 0.001.
To determine the MK3 expression in glioma, we analyzed the GEPIA database that contains the gene expression profile information across all tumor samples and paired normal tissues. The MK3 was aberrantly overexpressed in GBM (n = 163) and LGG (n = 518) tissues compared with the normal brain tissues (n = 207) that had a low level of MK3 mRNA expression among different normal human organs (Figures 1A, B). We further validated the data by using the GEO database; a similar overexpression pattern was observed in the glioma tissues compared with the non-tumor (GSE4290) or normal (GSE7696) tissues (Figures 1C, D). We also assessed the MK3 expression levels in glioma tissues by immunohistochemistry (IHC) staining. The staining results showed a similar MK3 expression pattern from the tumor tissues when compared with the para-tumor tissues (Figures 1E, F).
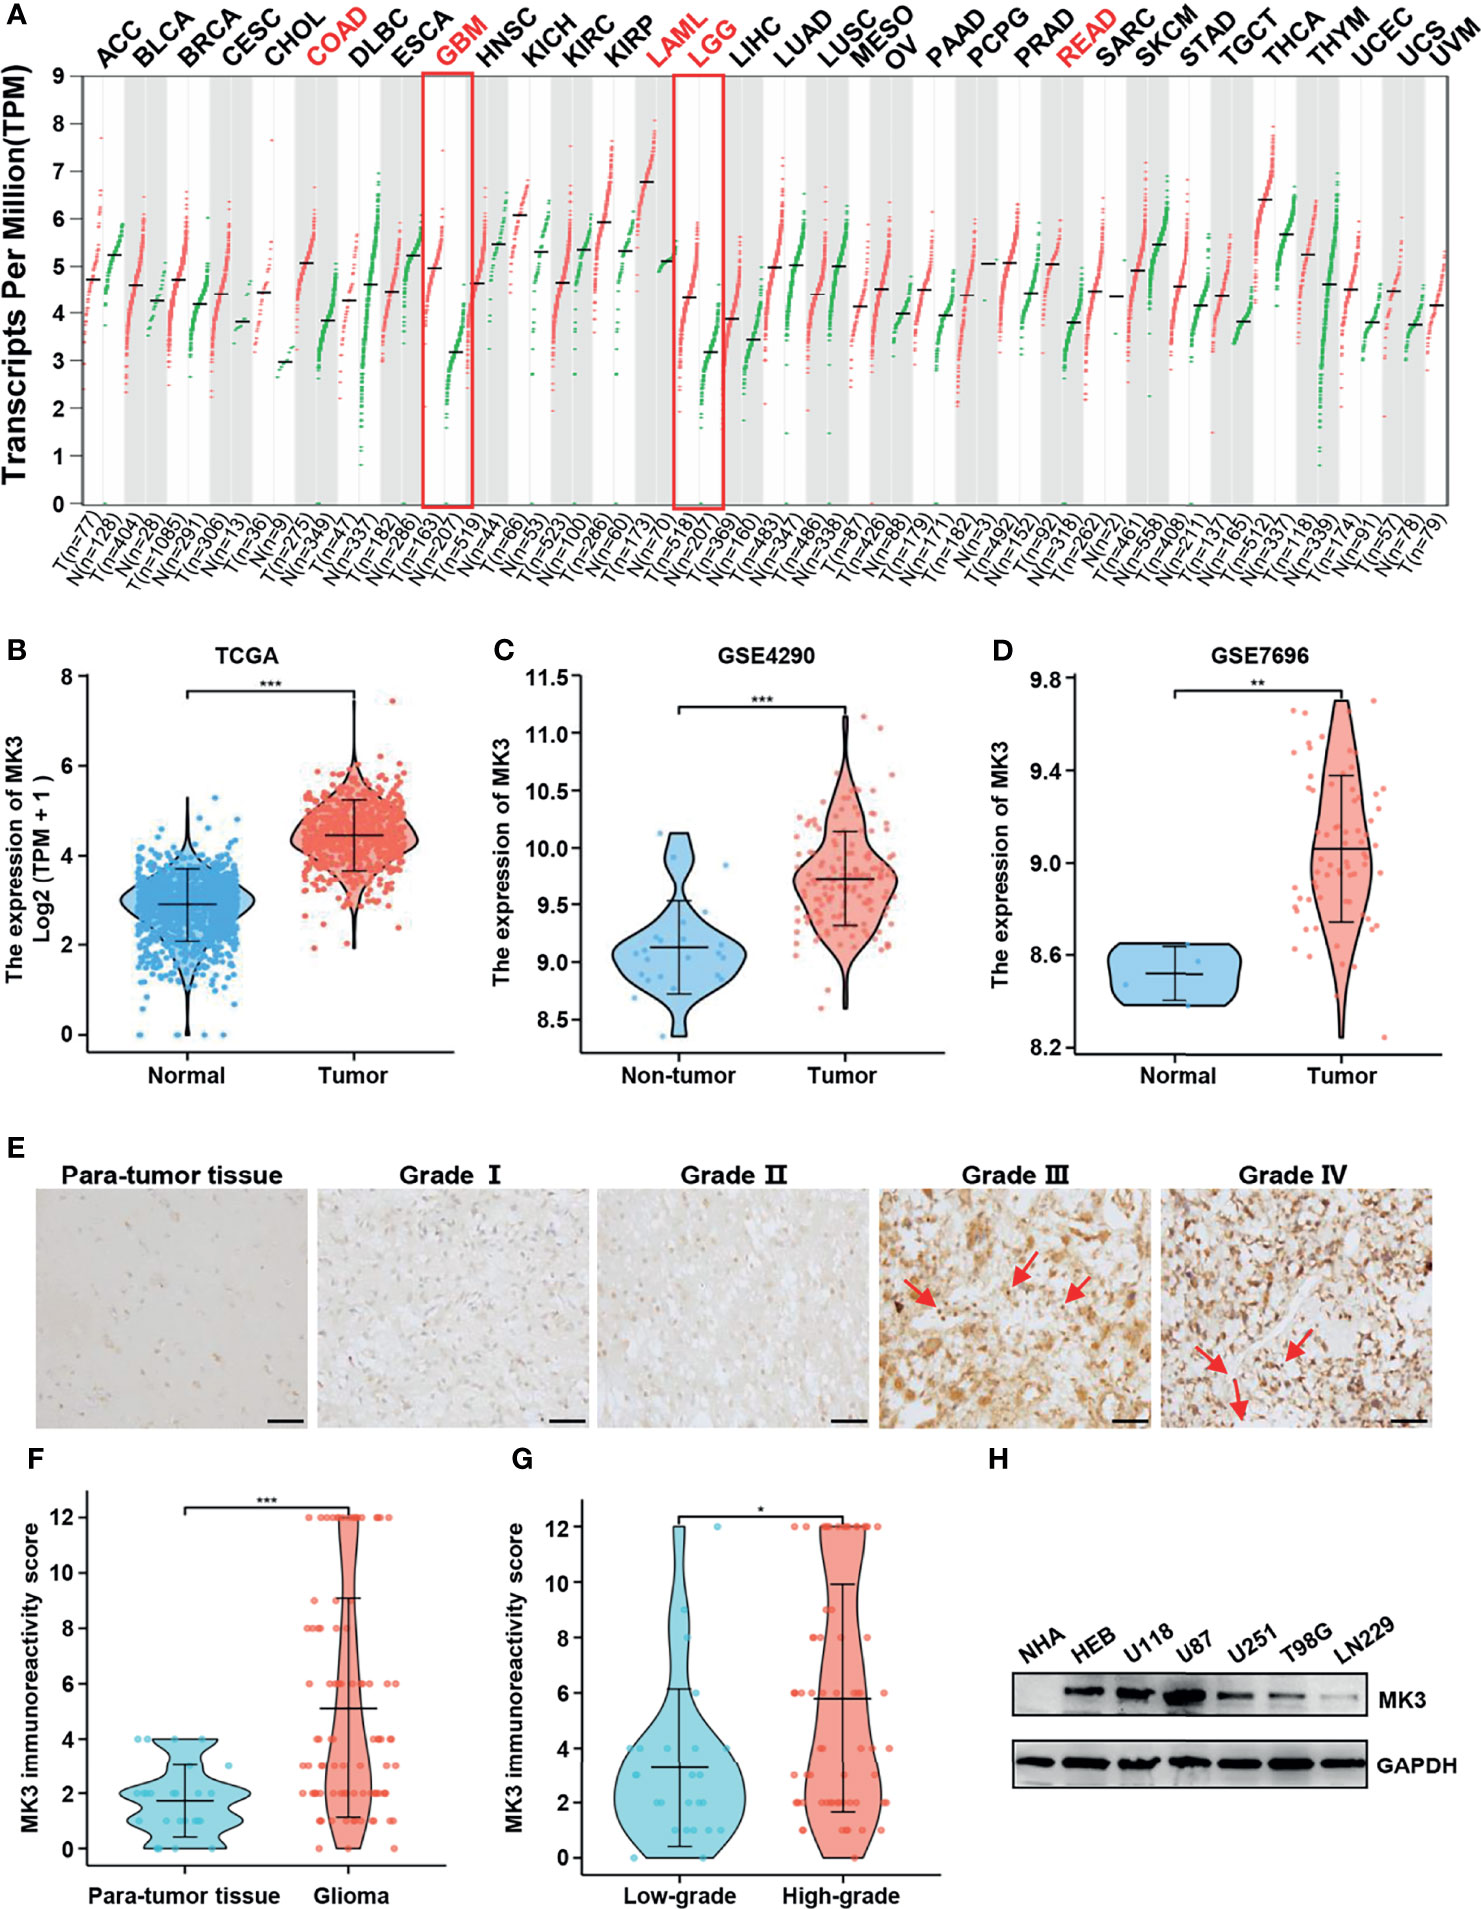
Figure 1 MK3 was aberrantly upregulated in glioma. (A) MK3 mRNA expression in different normal human tissues and tumor tissues from TCGA and the GTEx projects. (B) Comparison of MK3 mRNA expression in GBM, LGG tissues (n = 1,157), and normal brain tissues (n = 689) from TCGA and GTEx databases. (C) Higher MK3 mRNA expression was observed in glioma samples compared with non-tumor samples in GSE4290 dataset. (D) Higher MK3 mRNA expression was observed in glioblastoma tissues compared with normal brain tissues in GSE7696 dataset. (E) The immunohistochemical staining of MK3 in human glioma specimens. Scale bar: 50 μm. Red arrows indicate the immune cells. (F) The MK3 immunoreactivity score of para-tumor tissues and glioma tissues. (G) The MK3 immunoreactivity score of low-grade and high-grade glioma tissues. (H) The protein expression levels of MK3 were examined in five glioma cell lines, HEB, and NHA human astrocytes by Western blotting analysis. GAPDH was used as loading control. TCGA, The Cancer Genome Atlas; GTEx, Genotype-Tissue Expression; GBM, glioblastoma; LGG, low-grade glioma; HEB, human normal brain glial cells; NHA, normal human astrocyte. *p < 0.05, **p < 0.01, and ***p < 0.001.
Furthermore, we measured the protein expression levels of MK3 in five glioma cell lines (U118, U87, U251, T98G, and LN229), HEB, and NHA cell lines by Western blotting analysis. We observed that the protein levels of MK3 were also higher in the majority of the glioma cell lines (Figure 1H). Collectively, our results suggest that MK3 is aberrantly overexpressed in glioma.
The significant positive correlation between the MK3 level and WHO grade in glioma tissues (Figures 1E, G, Table 1) suggested a potential role of MK3 in the clinicopathologic features of glioma patients. To determine the clinical implication of MK3 expression, we segmented the patients of GBM and LGG in TCGA database into low or high MK3 expression groups according to the median value. As shown in Table 2, MK3 overexpression was significantly correlated with the WHO grade, IDH status, 1p/19q codeletion, and age. We also analyzed the expression of MK3 with OS, progression-free interval (PFI), and disease-specific survival (DSS) event of GBM and LGG, and the results showed that the expression of MK3 was lower from alive patients (Figures 2A–C). Moreover, we determined the clinical implication of MK3 expression from human GBM and LGG samples in TCGA database, and the significant differences were found in 1p/19q codeletion (Figure 2D), WHO grade (Figure 2E), and IDH status (Figure 2F). The results were also validated with the CGGA database (Figures 2G–L). Altogether, we demonstrate that MK3 expression is closely correlated with the poor clinicopathologic features of glioma patients.
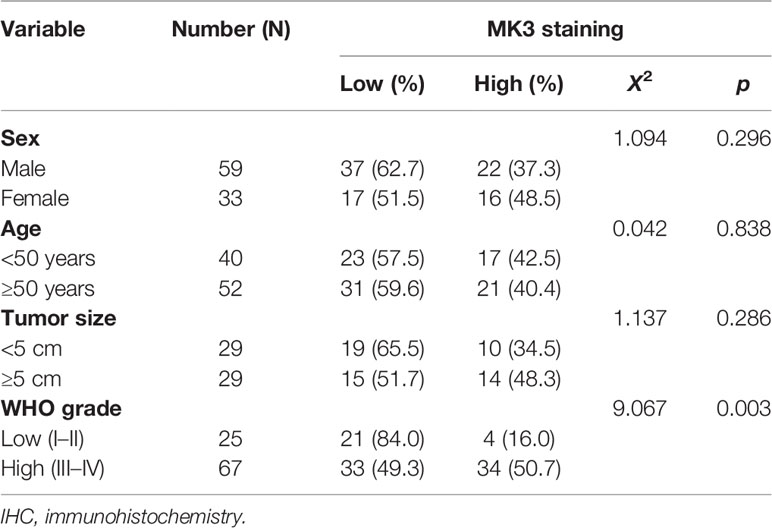
Table 1 MK3 IHC staining and clinicopathologic characteristics of glioma patients.
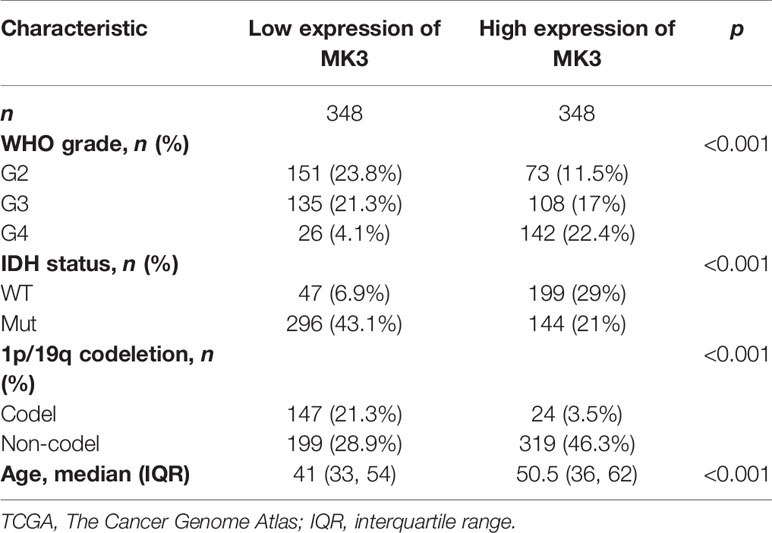
Table 2 The association between MK3 expression and the clinical parameters in glioma patients in TCGA.
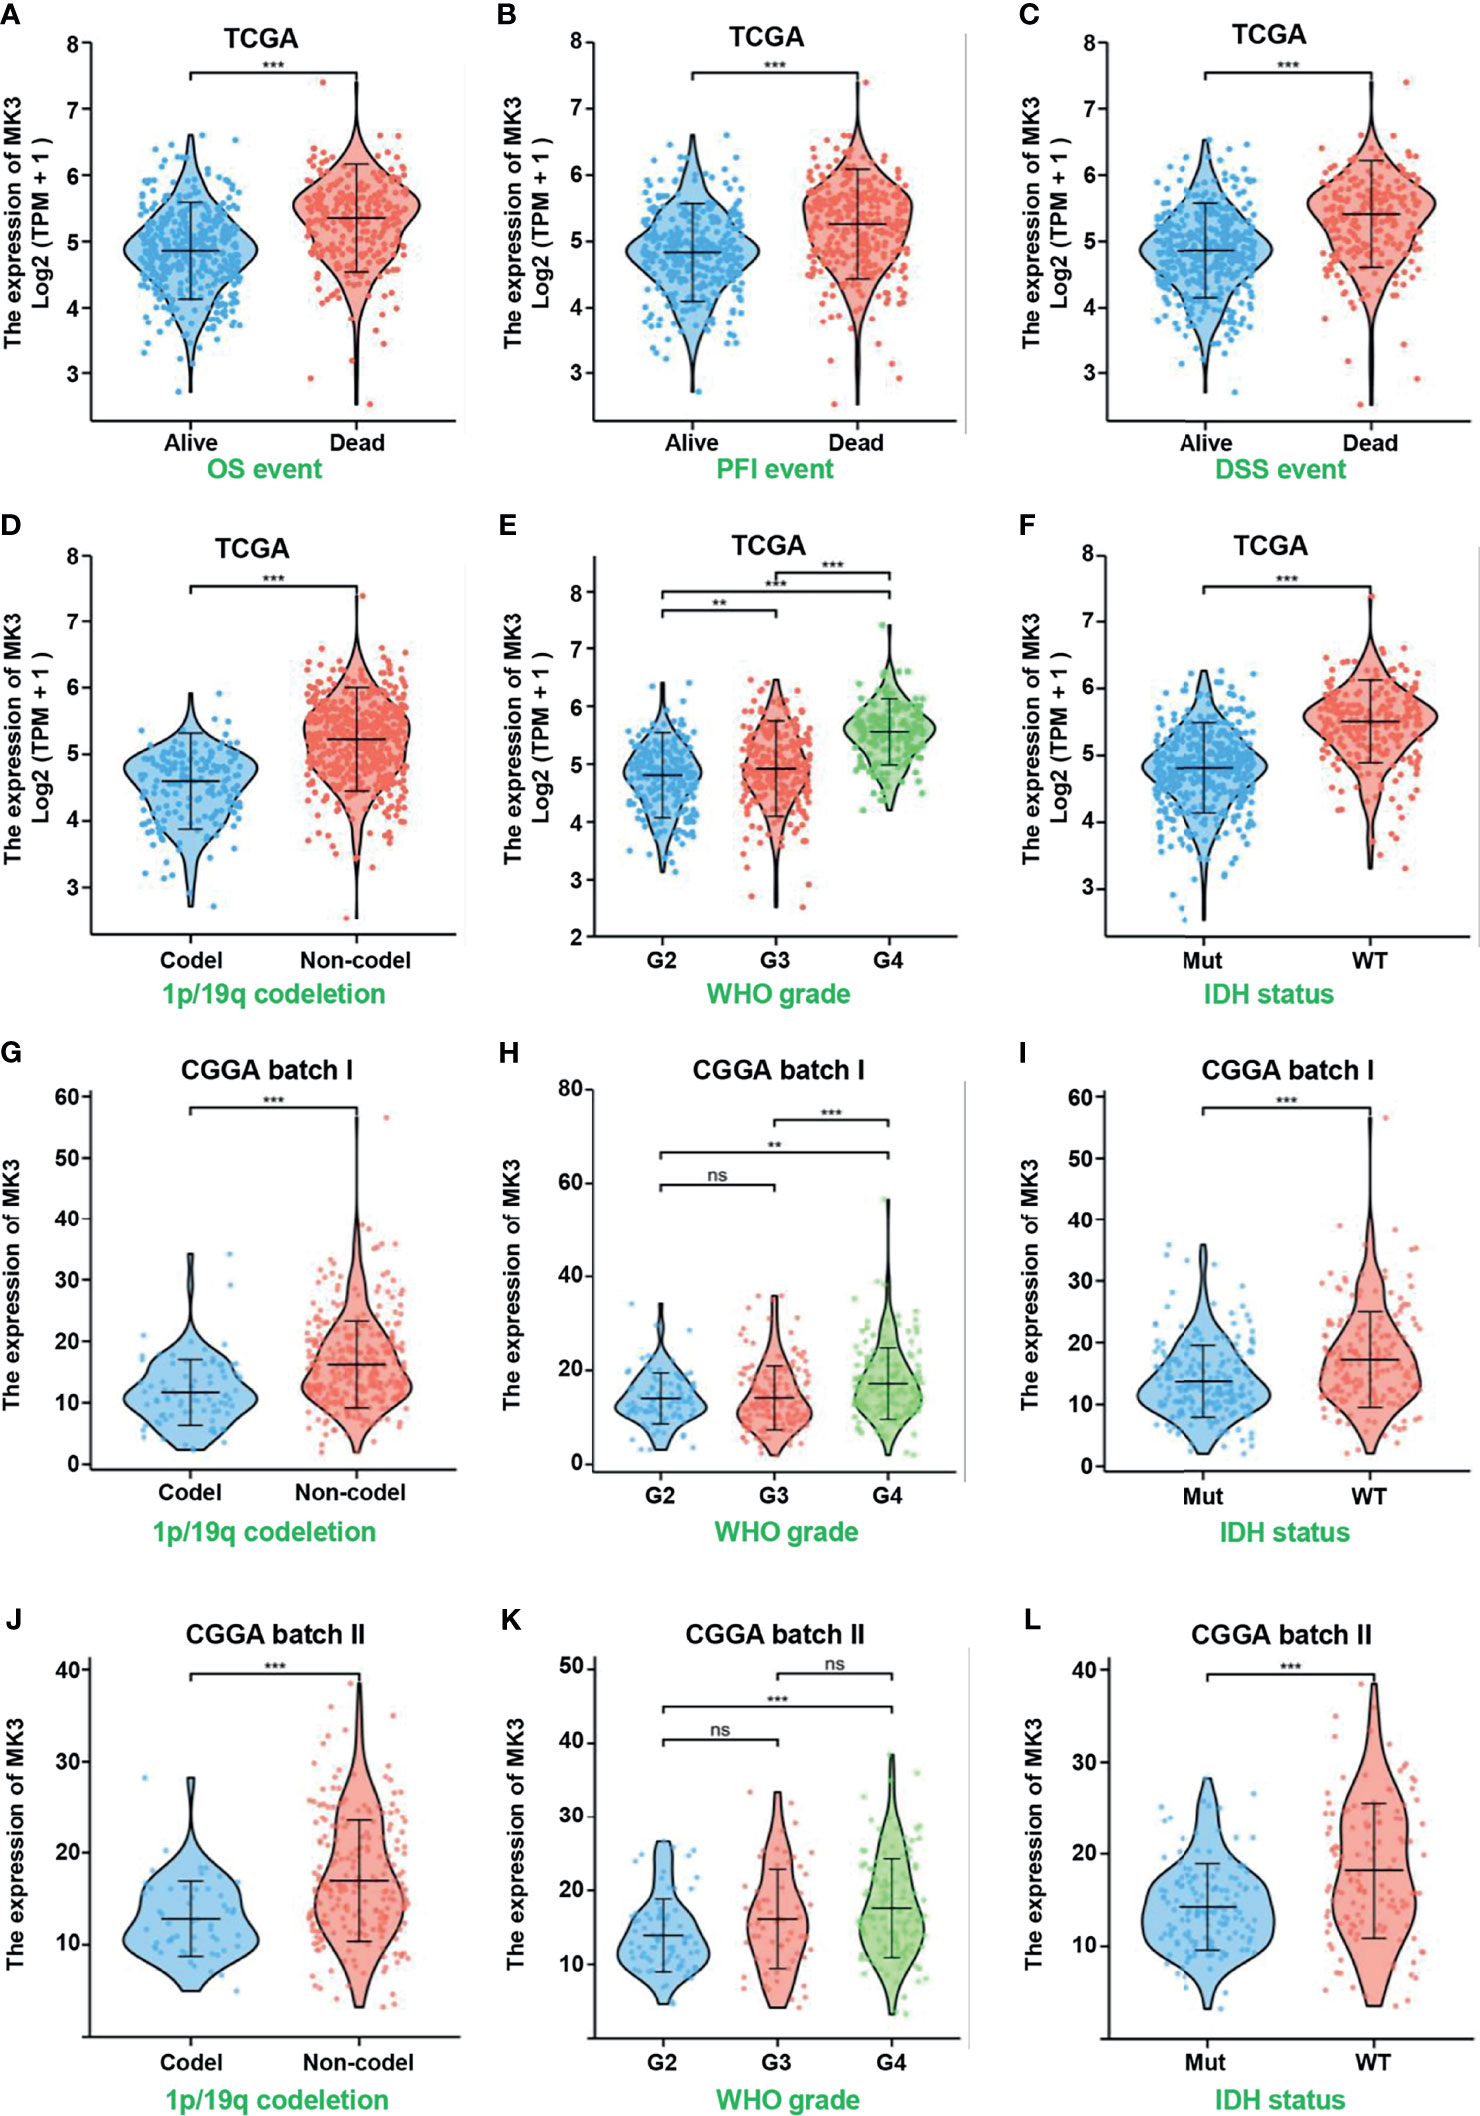
Figure 2 Overexpressed MK3 was associated with poor clinicopathologic features of glioma. (A–C) MK3 expression in OS (A), PFI (B), and DSS (C) events of human glioma samples in TCGA database. (D–F) Comparison of MK3 expression in different groups of 1p/19q codeletion (D), WHO grade (E), and IDH status (F) of human glioma samples in TCGA database. (G–L) Comparison of MK3 expression in different groups of 1p/19q codeletion (G, J), WHO grade (H, K), and IDH status (I, L) of human glioma samples in CGGA database. OS, overall survival; PFI, progression-free interval; DSS, disease-specific survival; TCGA, The Cancer Genome Atlas; CGGA, Chinese Glioma Genome Atlas. ns, no significance, **p < 0.01 and ***p < 0.001.
To investigate the relationship between the MK3 expression and the prognosis of glioma patients, we divided the cancer cases into high-risk and low-risk groups according to the cutoff value of the median risk score. The poorer prognosis and higher death rate were observed in the high-risk group (Figure 3A). Glioma patients were also separated into the MK3-high and MK3-low groups based on the expression levels with the median value to generate a KM survival curve. The KM survival curve demonstrated that the OS rate of glioma patients in the high-expression group was significantly poorer than that in the low-expression group in both the CGGA and TCGA datasets (Figures 3B–D). The PFI and DSS rate of glioma patients were also significantly and negatively correlated with MK3 expression in TCGA dataset (Figures 3E, F). In addition, we performed a subgroup survival analysis of OS with TCGA dataset, and we found that high expression of MK3 was associated with poor prognosis in WHO grade G3, non-codel 1p/19q codeletion, age less than or equal to 60 years, age greater than 60 years, and histological type astrocytoma subgroup of glioma (Figures 3G–O). We also conducted the ROC curve analysis to evaluate the diagnostic value of MK3, and the area under the curve (AUC) was 0.966, which indicated a high diagnostic value of MK3 in glioma (Figure 3R).
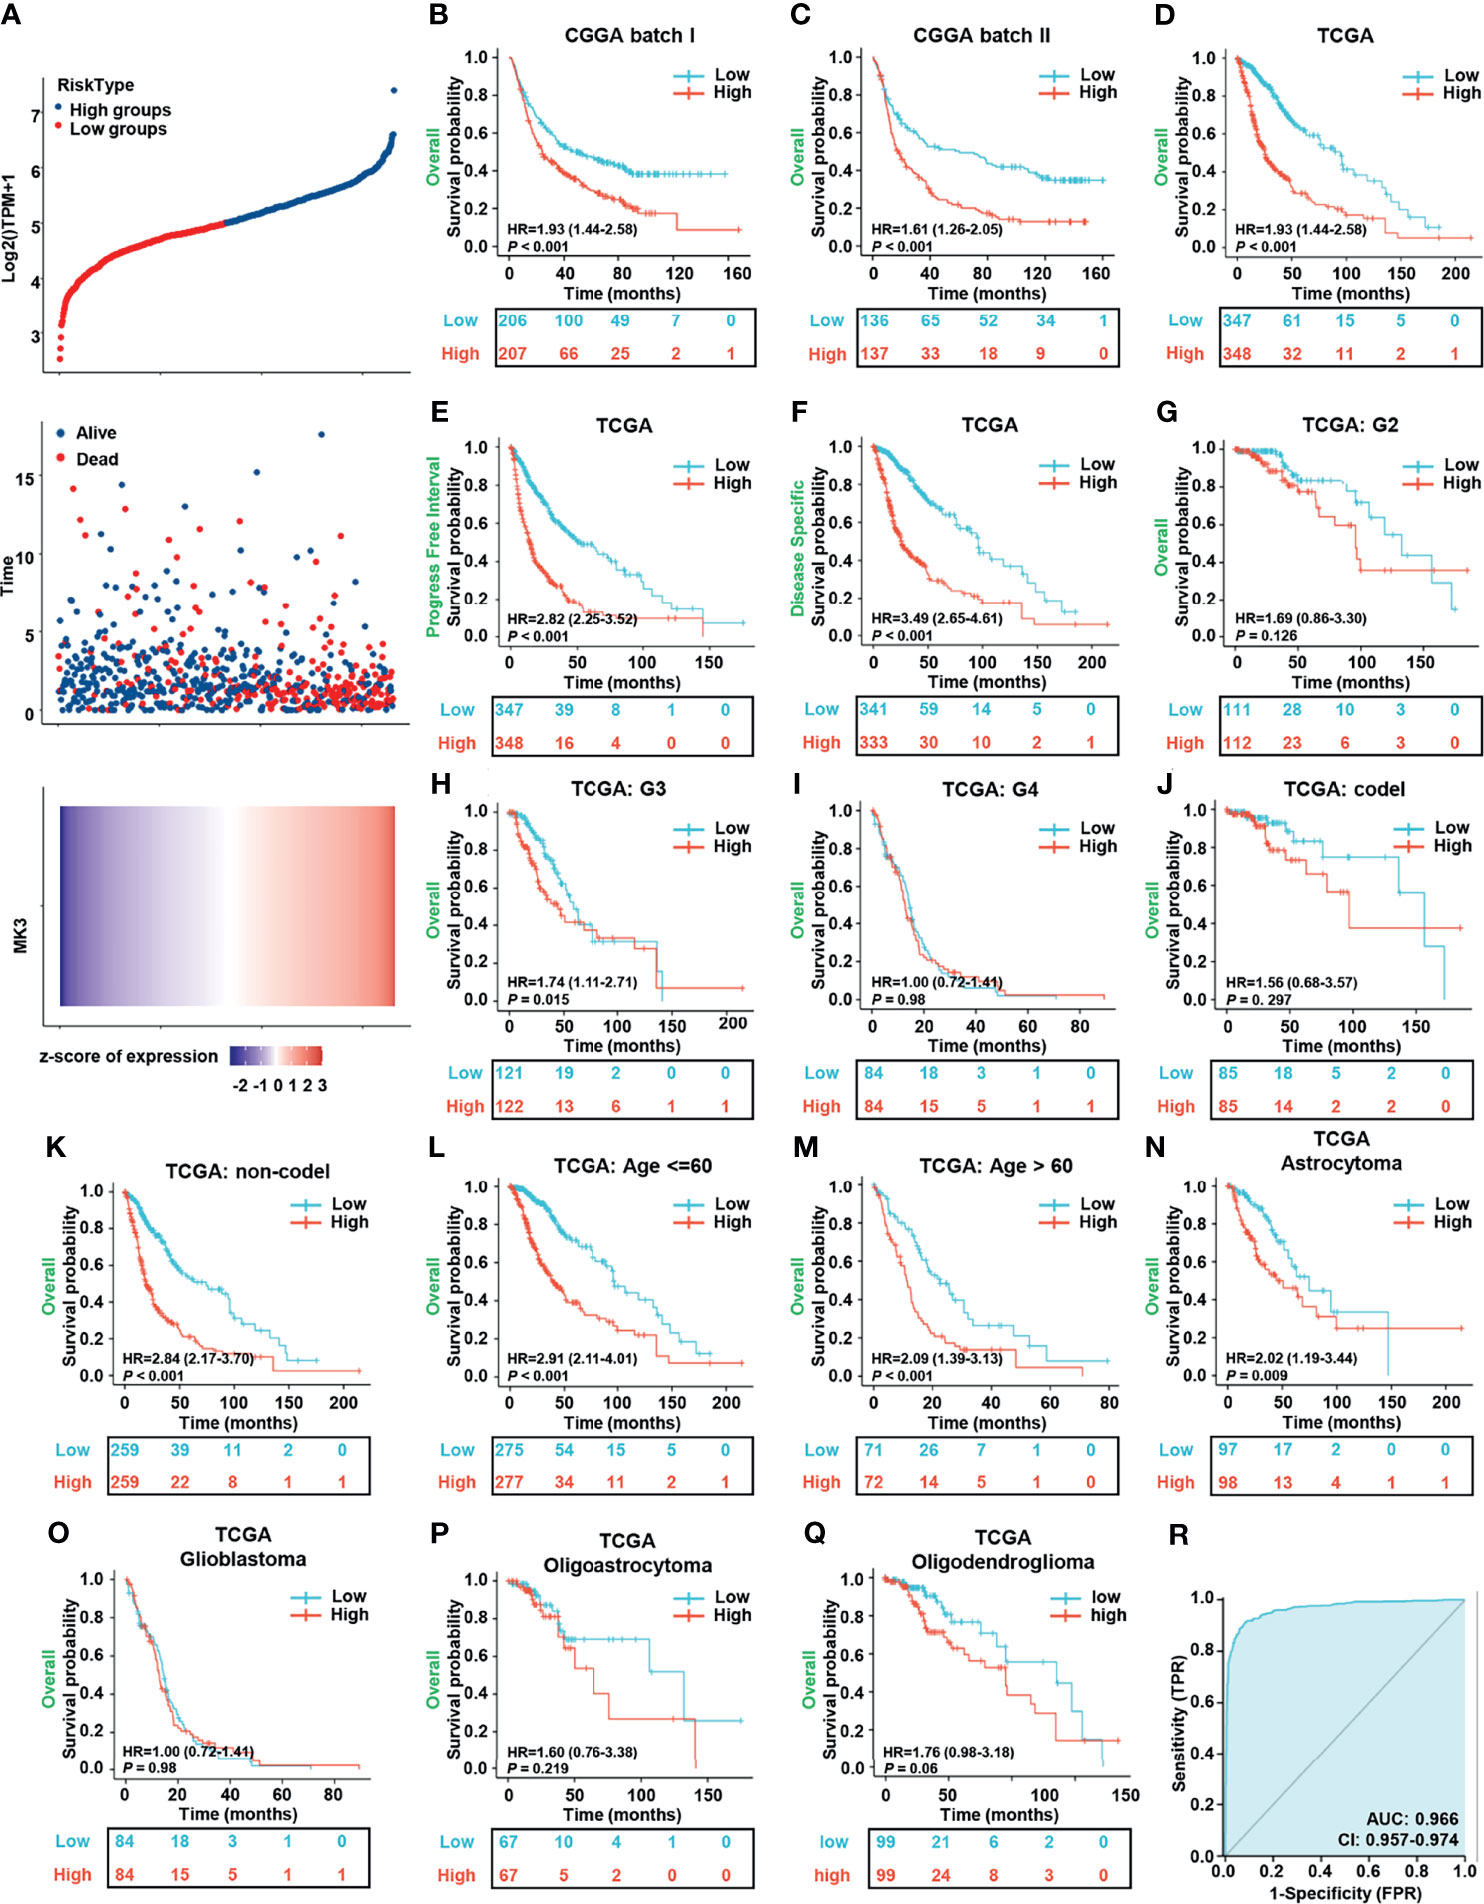
Figure 3 Overexpression of MK3 was closely related to the poor prognosis of glioma patients. (A) The relationship between survival time, survival status of glioma patients, and MK3 expression in TCGA dataset. Top: the curve of risk score. The dotted line represents the median risk score and divided the patients into low-risk and high-risk groups. Median: scatter plot distribution of survival time and survival status corresponding to the MK3 expression of different samples. Bottom: heatmap of MK3 expression. (B, C) The KM survival analysis for the correlation of MK3 with overall survival of glioma patients in CGGA batch I (B) and batch II (C) datasets. (D–F) The KM survival analysis for the correlation of MK3 expression with OS (D), PFI (E), and DSS (F) of glioma patients in TCGA dataset. (G–Q) Different subgroup analyses of KM for overall survival including WHO grade G2 (G), G3 (H), G4 (I), and 1p/19q codeletion status: codel (J), non-codel (K), age less than or equal to 60 years (L), age greater than 60 years (M), and histological type astrocytoma (N), glioblastoma (O), oligoastrocytoma (P), and oligodendroglioma (Q) of glioma patients in TCGA dataset. (R) ROC curve of GBM, LGG tissues (n = 1,157), and normal brain tissues (n = 689) from TCGA and GTEx databases for validating the diagnostic value of MK3 in glioma patients. TCGA, The Cancer Genome Atlas; KM, Kaplan–Meier; CGGA, Chinese Glioma Genome Atlas; OS, overall survival; PFI, progression-free interval; DSS, disease-specific survival; ROC, receiver operating characteristic; GBM, glioblastoma; LGG, low-grade glioma; GTEx, Genotype-Tissue Expression.
To further evaluate the prognostic value of MK3, we performed the univariate and multivariate Cox regression analyses, which are the widely used approaches for identifying predictive biomarkers. Univariate Cox analysis unearthed that MK3 was a high-risk factor (hazard ratio (95% CI) = 3.037 (2.349–3.297), p < 0.001). Moreover, WHO grade, IDH status, 1p/19q codeletion, primary therapy outcome, age, and MK3 expression were all significantly correlated with poor OS (Table 3), which indicated their association with the OS in glioma. On the other hand, the multivariate Cox analysis demonstrated that only WHO grade, IDH status, primary therapy outcome, gender, and age were independent prognostic factors for glioma (Table 3). In conclusion, these results demonstrate that MK3 might serve as a valuable prognostic biomarker for glioma patients.
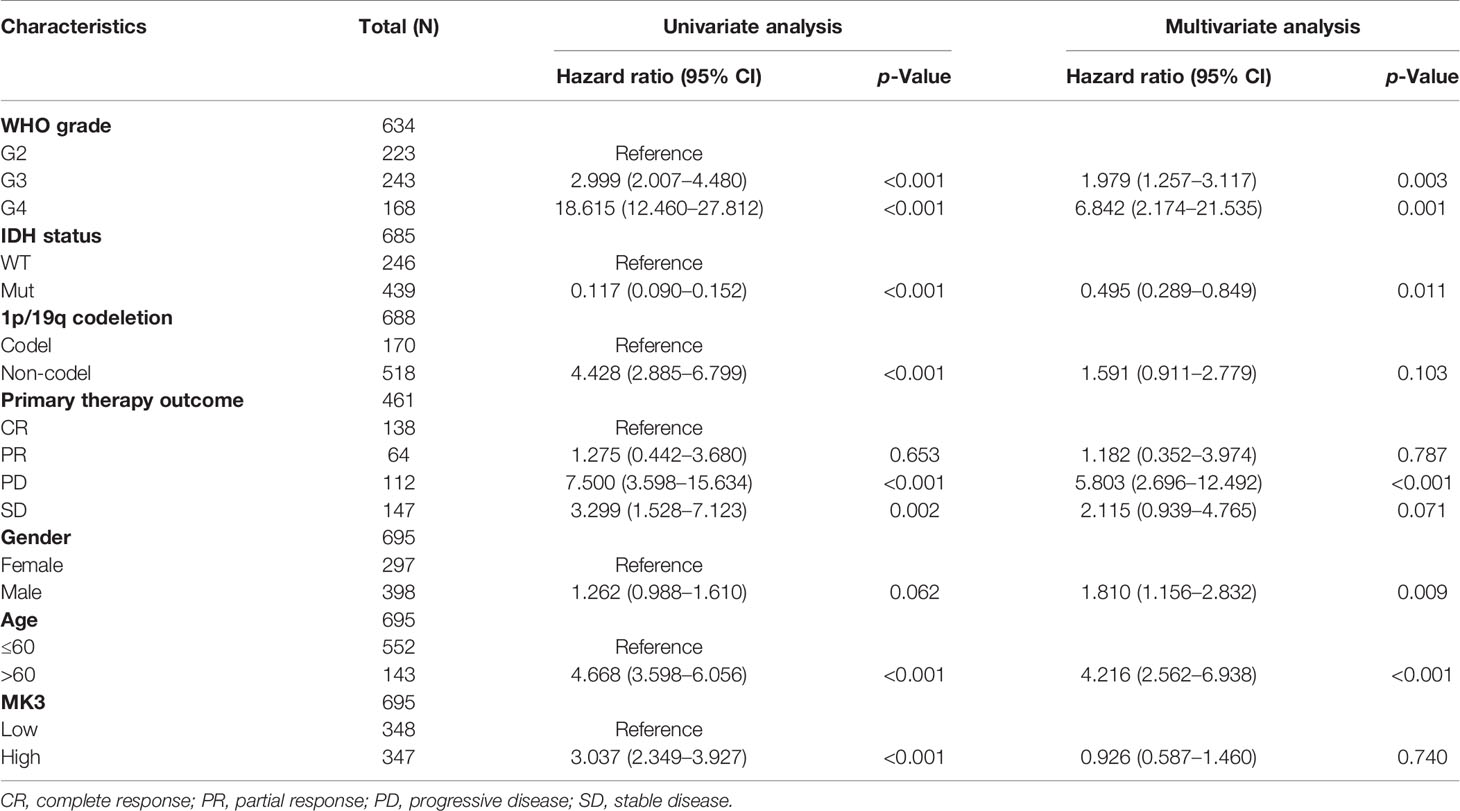
Table 3 Univariate and multivariate Cox proportional hazards analyses of MK3 expression and overall survival for glioma patients.
To identify the functional and physical interaction partners of MK3, we used STRING to analyze the protein–protein interactions. As shown in the interaction network (Figure 4A), a total of 38 MK3 interaction proteins were found by experimental evidence. Furthermore, we recovered 3,067 positively correlated genes (Pearson’s correlation coefficient r > 0.4) and 1,229 negatively correlated genes (Pearson’s correlation coefficient r < −0.4) of MK3 from TCGA transcriptome dataset. The top 15 positively correlated genes and negatively correlated genes of MK3 were plotted in the heatmap (Figure 4B). To further uncover the potential role of MK3 in glioma, we performed GO and KEGG analyses by TCGA dataset on MK3 correlated genes. Interestingly, the results of GO classification demonstrated that MK3 correlated genes were significantly enriched in immune-related functions among the top-ranked BPs, including the neutrophil activation, neutrophil-mediated immunity, neutrophil activation involved immune response, T-cell activation, regulation of innate immune response, leukocyte cell–cell adhesion, regulation of T-cell activation, leukocyte proliferation, antigen processing and presentation, response to interferon gamma, antigen processing and presentation of peptide antigen, cellular response to interferon gamma, T-cell proliferation, and interferon gamma-mediated signaling pathway (Figures 4C, D). KEGG pathway analysis showed that MK3 correlated genes were also closely associated with immune-related signaling pathways, including cytokine–cytokine receptor interaction, osteoclast differentiation, chemokine signaling pathway, proteoglycans in cancer, Th17 cell differentiation, natural killer cell-mediated cytotoxicity, TNF signaling pathway, Toll-like receptor signaling pathway, Th1 and Th2 cell differentiation, T-cell receptor signaling pathway, B-cell receptor signaling pathway, and NF-kappa B signaling pathway (Figures 4E, F).
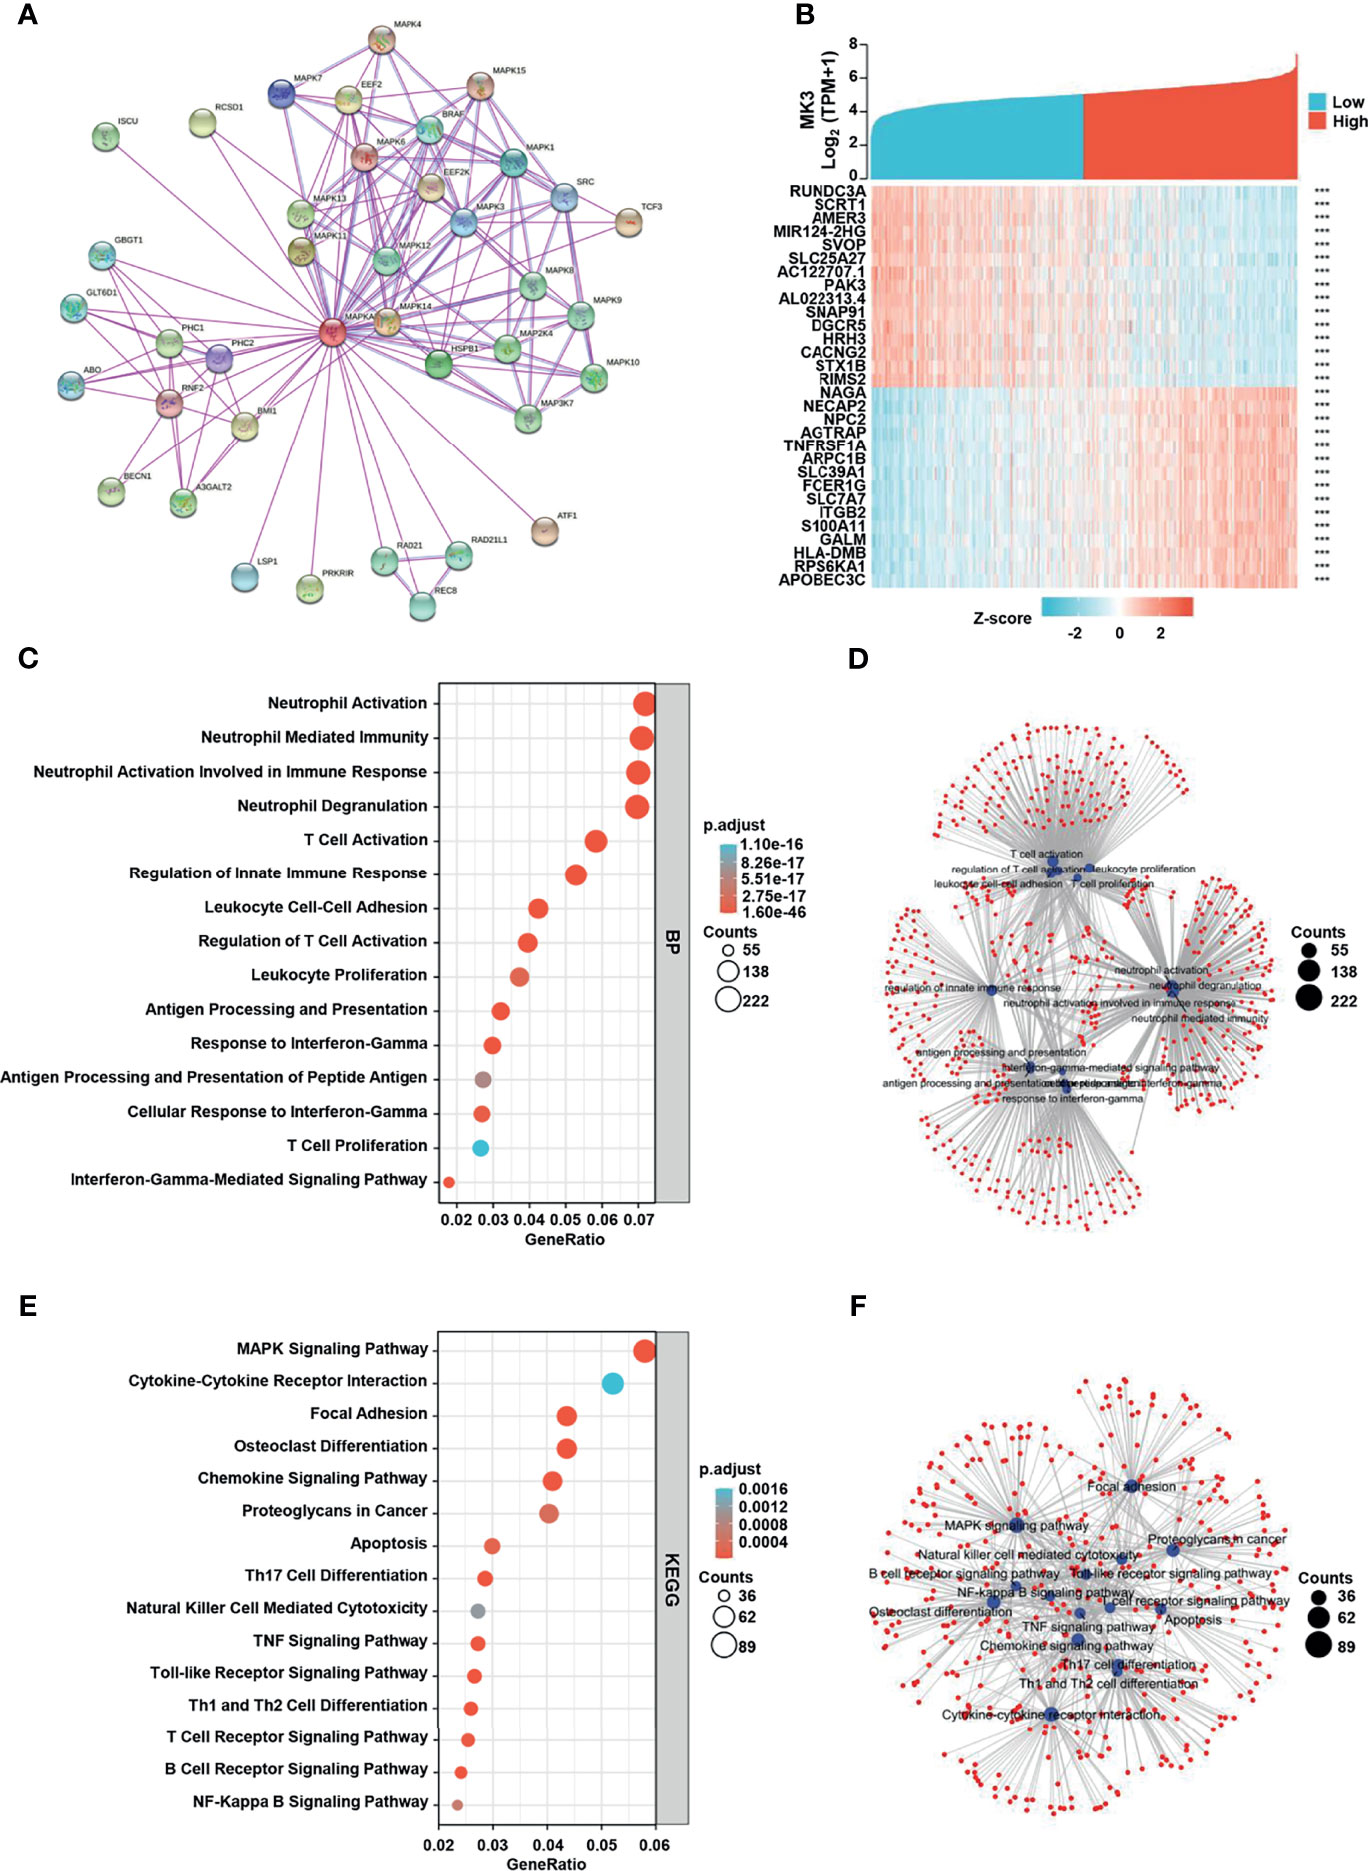
Figure 4 MK3 related gene enrichment analysis. (A) The protein–protein interaction network analysis of MK3 by using the STRING tool. (B) The top 15 genes with positive and negative correlations of MK3 expression. (C) Based on the MK3 related genes, GO analysis was performed. (D) The cnetplot of biological process in GO analysis. (E) KEGG pathway analysis of MK3 related genes. (F) The cnetplot of KEGG pathway analysis. Data used for GO and KEGG analyses were obtained from TCGA. GO, Gene Ontology; KEGG, Kyoto Encyclopedia of Genes and Genome; TCGA, The Cancer Genome Atlas.
We also performed GSEA by using the MK3-low and MK3-high datasets from TCGA transcriptome dataset to identify signaling pathways that are affected by MK3 overexpression in glioma. Gene sets related to chemokine signaling, Toll-like receptor signaling, cytokine–cytokine receptor interaction, natural killer cell-mediated cytotoxicity, interferon signaling, interferon gamma-signaling, cell surface interactions at the vascular wall, neutrophil degranulation, extracellular matrix organization, signaling by interleukins, signaling by the B-cell receptor, and Toll-like receptor cascades pathways were significantly enriched in the high MK3 expression group (Figures 5A–L). Together, our results suggest that MK3 might participate in the tumor immune microenvironment and immune regulation.
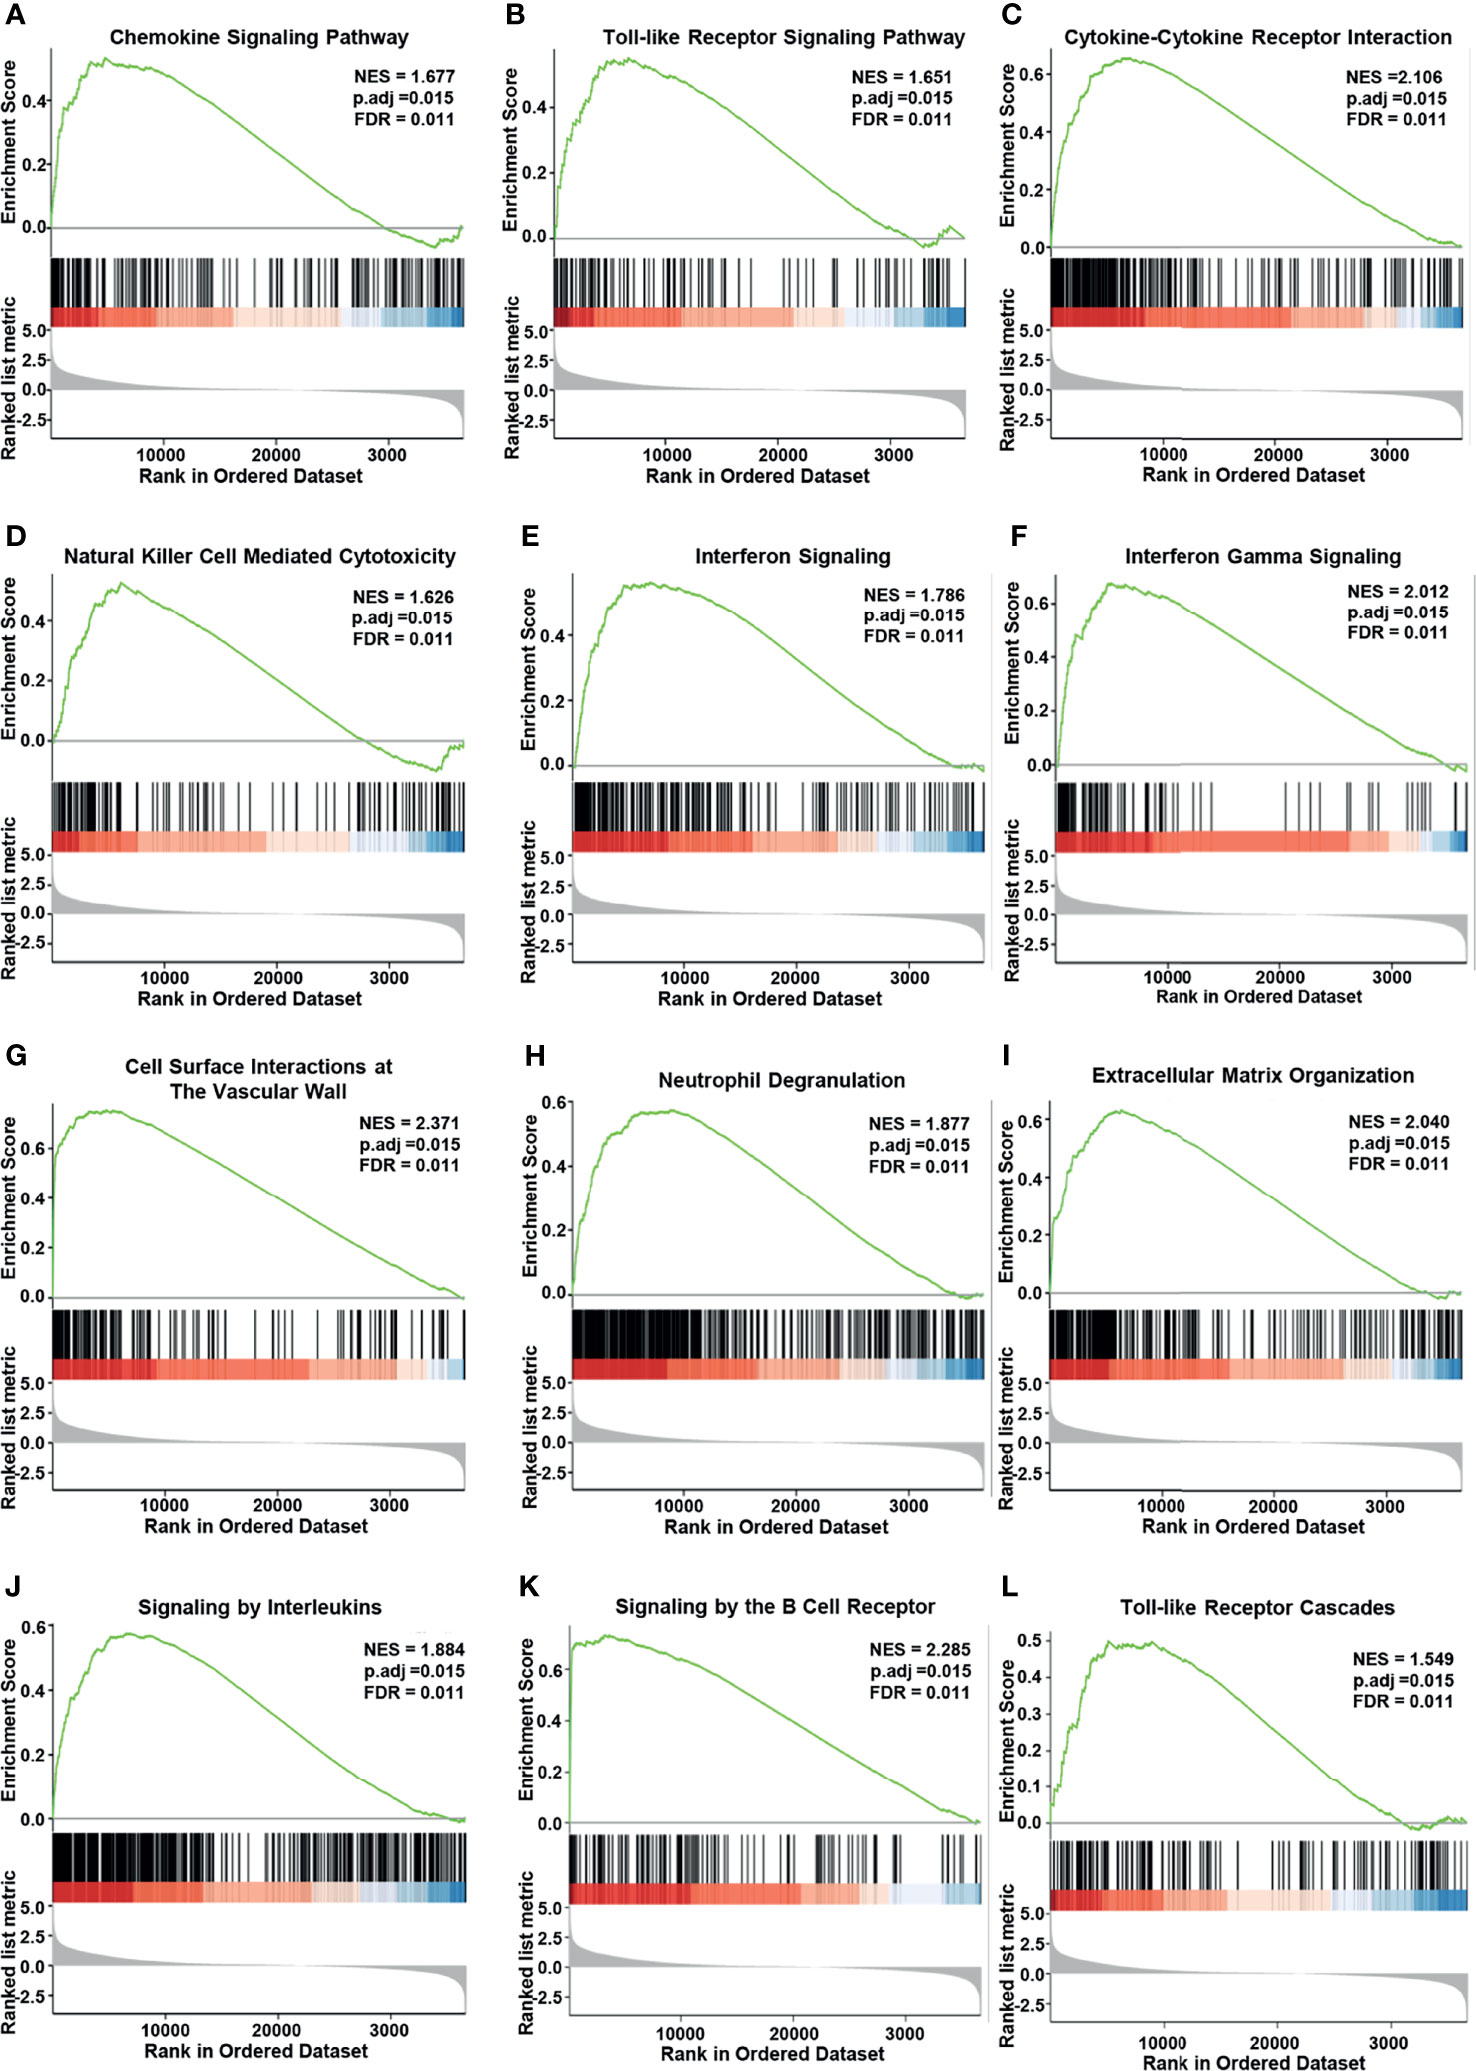
Figure 5 Enrichment plots from Gene Set Enrichment Analysis (GSEA). MK3 upregulation was significantly correlated with “chemokine signaling” (A), “Toll-like receptor signaling” (B), “cytokine–cytokine receptor interaction” (C), “natural killer cell-mediated cytotoxicity” (D), “interferon signaling” (E), “interferon-gamma signaling” (F), “cell surface interactions at the vascular wall” (G), “neutrophil degranulation” (H), “extracellular matrix organization” (I), “signaling by interleukins” (J), “signaling by the B-cell receptor” (K), and “Toll-like receptor cascades” pathways (L). Data used for GSEA was obtained from TCGA. GO, Gene Ontology; KEGG, Kyoto Encyclopedia of Genes and Genome; TCGA, The Cancer Genome Atlas; GSEA, Gene Set Enrichment Analysis.
Considering the tumor heterogeneity, we further analyzed the distribution of MK3 expression in glioma samples by assessing single-cell RNA-seq data. We observed that the extensive expression of MK3 was in immune cells (macrophage and T cell) (Figures 6A–C), which further support our IHC staining data in glioma tissues (Figure 1E). These results suggest the potential role of MK3 in regulating immune response. Therefore, we determined the correlation between MK3 expression and immune infiltration in glioma by ssGSEA with Spearman’s R. We found that MK3 expression was negatively correlated with infiltrating levels of T follicular helper (TFH), CD8 T cells, T gamma delta (Tgd), T central memory (Tcm), NK CD56bright cells, and plasmacytoid DC (pDC) cells and was positively correlated with infiltrating levels of macrophages, neutrophils, eosinophils, activated dendritic cells (aDC), immature DC (iDC), T, Th17, cytotoxic cells, NK CD56dim, Th2, NK, T helper, Th1, B cells, and DC (all p < 0.05, Figures 6D, E). These data indicate that MK3 might participate in immune infiltration in glioma.
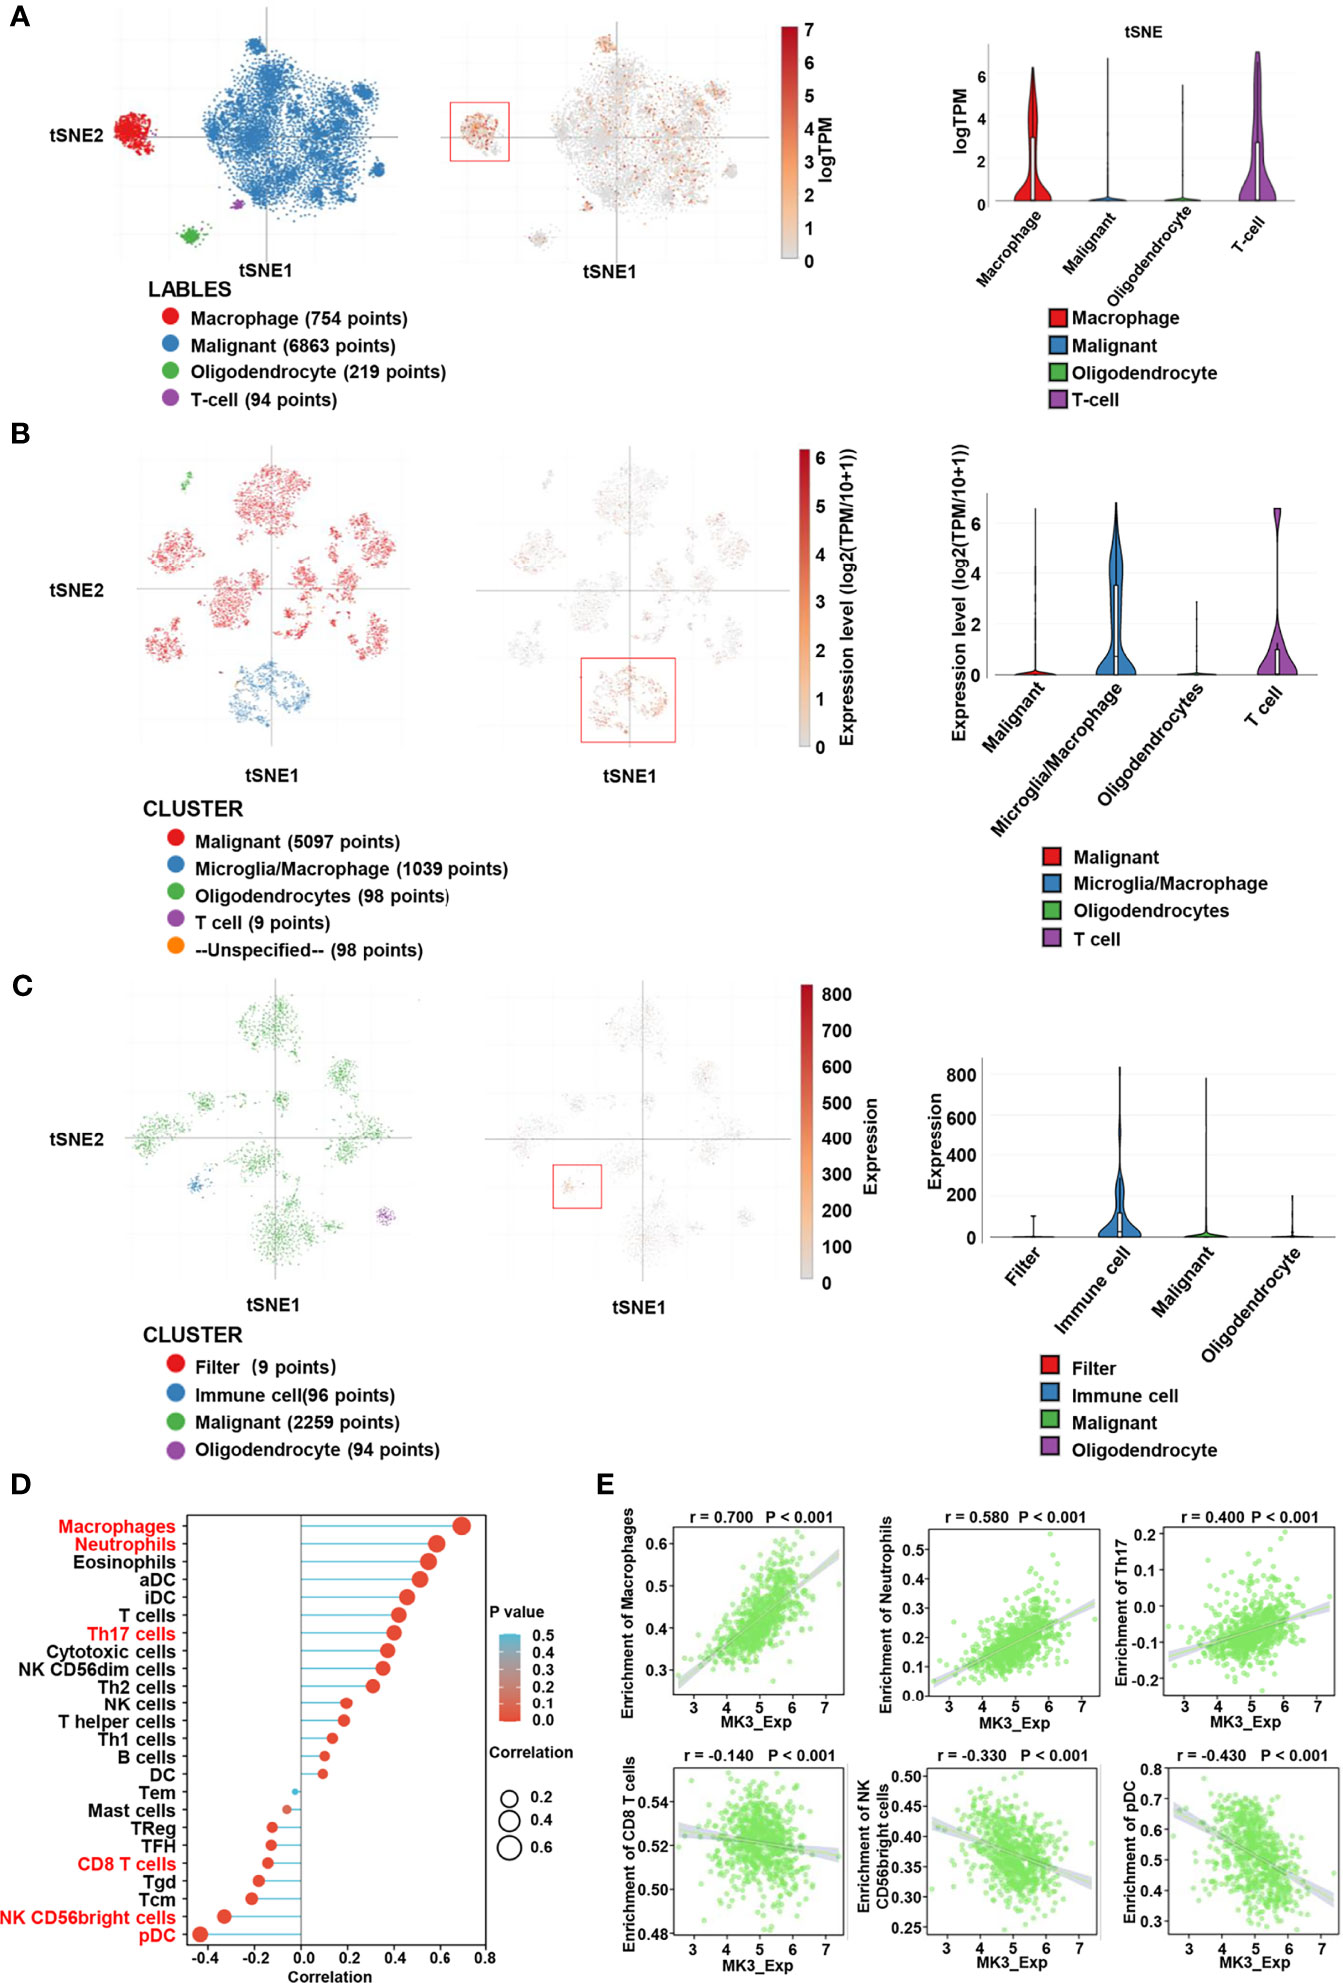
Figure 6 Correlation between MK3 and immune cell infiltration. (A) Classification of single cells and the distribution of MK3 in glioblastomas. Left: t-distribution stochastic neighbor embedding (tSNE) plot of all single cells. Cells are labeled based on the high expression of sets of marker genes for macrophage (red), malignant (blue), oligodendrocyte (green), and T cells (purple). Medium: tSNE plot of MK3 specific expression cells (red). Right: violin plot of the distribution of MK3. (B) Classification of single cells and the distribution of MK3 in tumor samples of IDH-mutant astrocytoma. Left: tSNE plot of all single cells. Cells are labeled based on the basis of high expression of sets of marker genes for malignant (red), microglia/macrophage (blue), oligodendrocyte (green), T cells (purple), and unspecified (yellow). Medium: tSNE plot of MK3 specific expression cells (red). Right: violin plot of the distribution of MK3. (C) Classification of single cells and the distribution of MK3 in gliomas with histone H3 lysine27-to-methionine mutations. Left: t-distribution stochastic neighbor embedding (tSNE) plot of all single cells. Cells are labeled based on the high expression of sets of marker genes for filter (red), immune cell (blue), malignant (green), and oligodendrocyte (purple). Medium: tSNE plot of MK3 specific expression cells (red). Right: violin plot of the distribution of MK3. (D) Lollipop plots showing the correlation between the MK3 expression level and the relative abundances of 24 immune cells in GBM and LGG samples from TCGA dataset. The size of dots shows the absolute value of Spearman’s R. (E) The correlation analysis between the expression of MK3 and enrichment of immune cells (macrophages, neutrophils, Th17 cells, CD8 T cells, NK CD56bright cells, and plasmacytoid DC) in GBM and LGG samples from TCGA dataset. GBM, glioblastoma; LGG, low-grade glioma; TCGA, The Cancer Genome Atlas; DC, dendritic cells.
Taking advantage of TISIDB website, we also explored the correlation between the expression of MK3 and immune-related genes in glioma. Our results suggest that the expression of MK3 was positively correlated to the majority of immunoinhibitors (Figures 7A, B), pro-tumor chemokines (Figures 7C, D), and chemokine receptors (Figures 7E, F) in both GBM and LGG patients.

Figure 7 Correlation between MK3 and immune regulated genes in glioma. (A) Correlation between the expression of MK3 and immunoinhibitors across human cancers. (B) The correlation analysis between the expression of MK3 and immunoinhibitor genes (colony-stimulating factor 1 receptor, CSF1R; hepatitis A virus cellular receptor 2, HAVCR2; galectin 9, LGALS9; programmed cell death 1 ligand 2, PDCD1LG2; transforming growth factor beta 1, TGFB1; and transforming growth factor beta receptor 1, TGFBR1) in GBM and LGG samples from TCGA dataset. (C) Correlation between the expression of MK3 and chemokines across human cancers. (D) The correlation analysis between the expression of MK3 and chemokine genes (C-C motif chemokine ligand 2, CCL2; C-C motif chemokine ligand 5, CCL5; C-C motif chemokine ligand 8, CCL8; C-C motif chemokine ligand 18, CCL18; C-C motif chemokine ligand 22, CCL22; and C-X-C motif chemokine ligand 12, CXCL12) in GBM and LGG samples from TCGA dataset. (E) Correlation between the expression of MK3 and chemokine receptors across human cancers. (F) The correlation analysis between the expression of MK3 and chemokine receptor genes (C-C motif chemokine receptor 1, CCR1; C-C motif chemokine receptor 2, CCR2; C-C motif chemokine receptor 5, CCR5; C-X-C motif chemokine receptor 2, CXCR2; C-X-C motif chemokine receptor 4, CXCR4; and C-X3-C motif chemokine receptor 1, CX3CR1) in GBM and LGG samples from TCGA dataset. GBM, glioblastoma; LGG, low-grade glioma; TCGA, The Cancer Genome Atlas.
Programmed cell death protein 1 (PD-1/PDCD1), programmed cell death 1 ligand 1 (PD-L1/CD274), and cytotoxic T lymphocyte antigen 4 (CTLA-4) are vital immune checkpoints that play important roles in tumor immune escape. And they also served as predictive markers for the therapeutic efficacy of immune checkpoint inhibitors (ICIs). Thus, we especially assessed the relationship of MK3 with PD-1, PD-L1, and CTLA-4 in glioma by using TIMER tool. The results from TIMER website illustrated that there was a significant positive correlation between MK3 expression and PD-1, PD-L1, and CTLA-4 in glioma, which was adjusted by tumor purity (Figures 8A–F). Similarly, we also found that the expression of MK3 was significantly positively correlated with PD-1 (r = 0.520, p < 0.001), PD-L1 (r = 0.570, p < 0.001), and CTLA-4 (r = 0.360, p < 0.001) in glioma (Figures 8G–I). Taken together, these results suggest that MK3 might participate in tumorigenesis and the development of glioma by regulating the tumor immune escape.
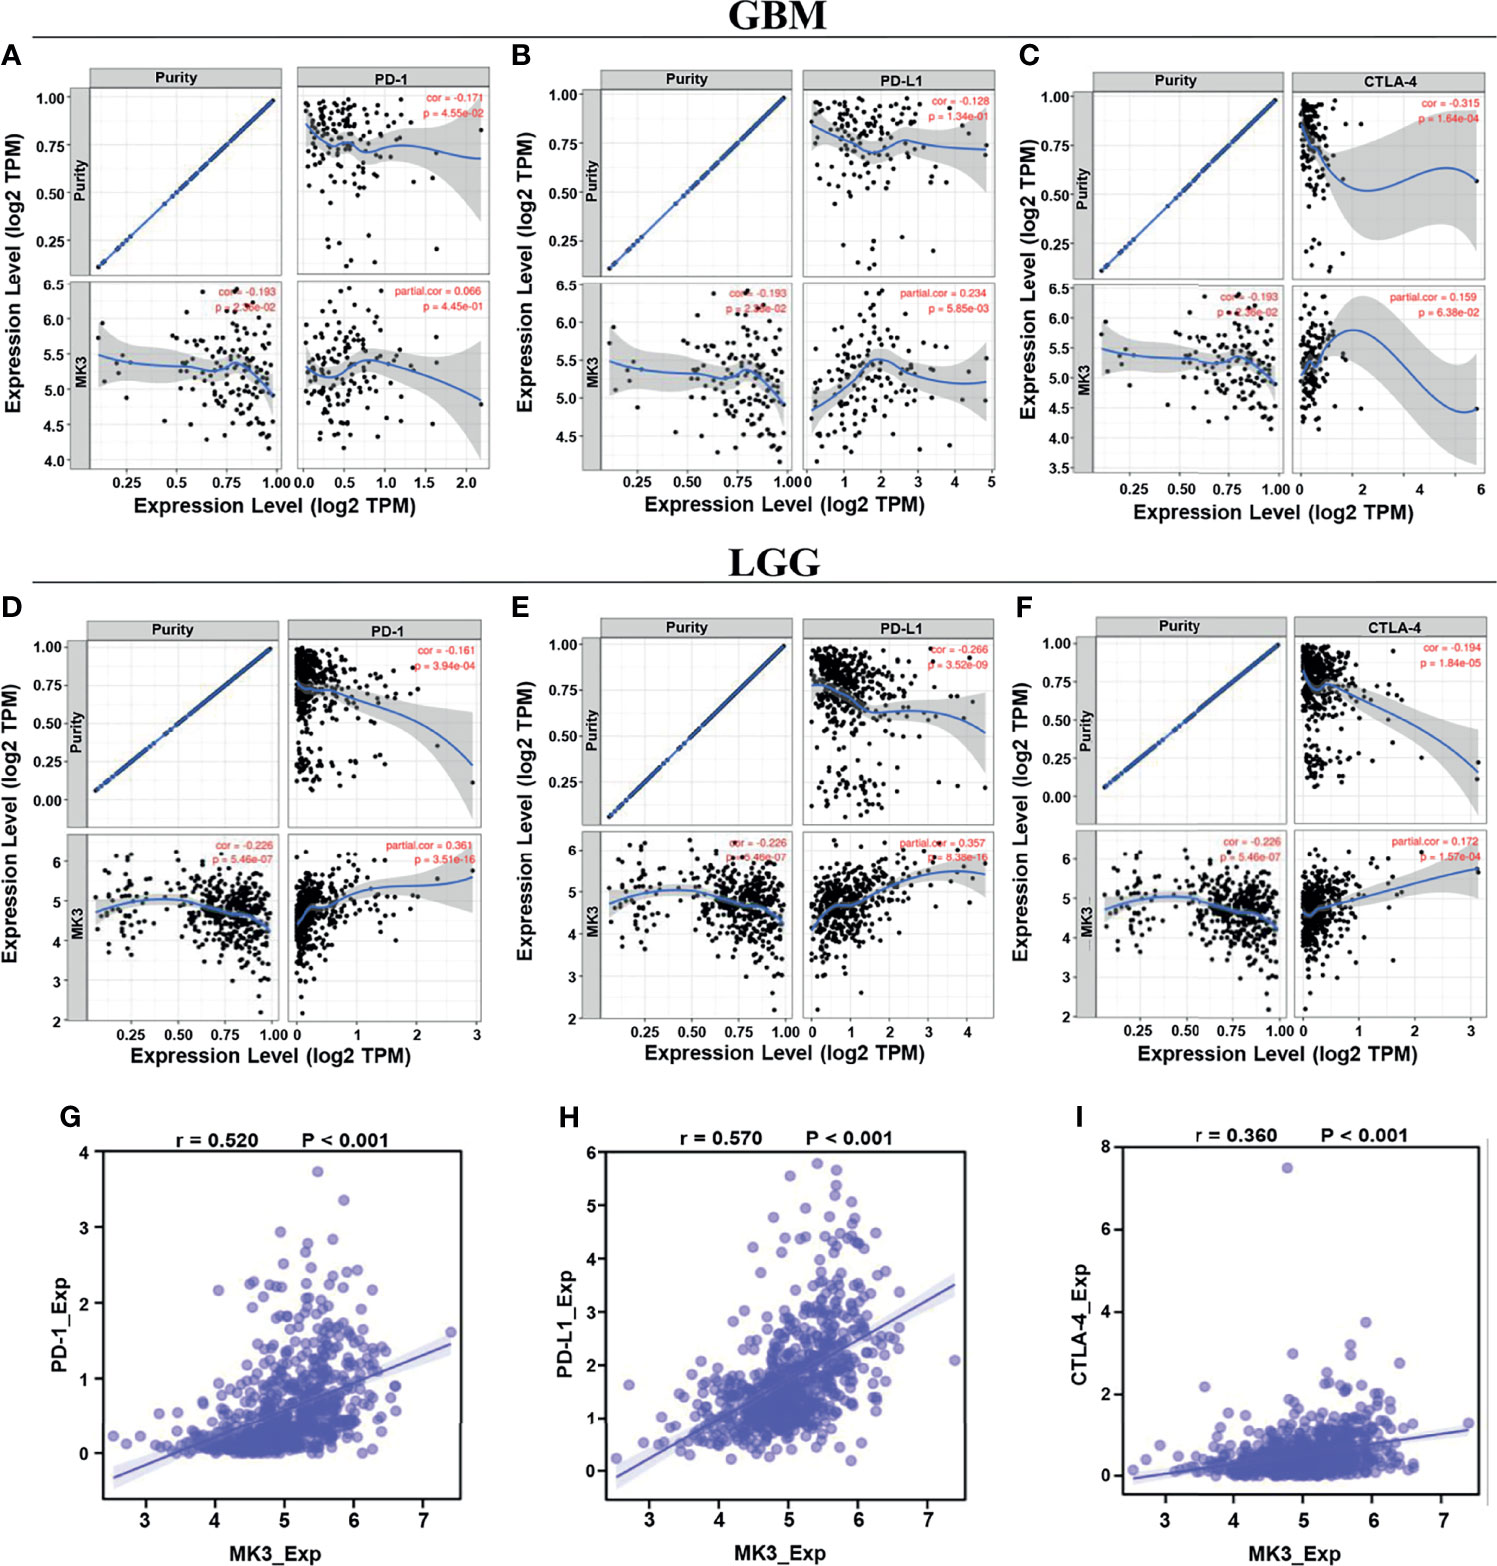
Figure 8 Correlation of MK3 expression with PD-1, PD-L1, and CTLA-4 in glioma. (A–C) Correlation of MK3 expression with PD-1 (A), PD-L1 (B), and CTLA-4 (C) in GBM adjusted by tumor purity using TIMER. (D–F) Correlation of MK3 expression with PD-1 (D), PD-L1 (E), and CTLA-4 (F) in LGG adjusted by tumor purity using TIMER. (G–I) The expression correlation of MK3 with PD-1 (G), PD-L1 (H), and CTLA-4 (I) in GBM and LGG samples from TCGA dataset. GBM, glioblastoma; TIMER, Tumor IMmune Estimation Resource; LGG, low-grade glioma; TCGA, The Cancer Genome Atlas.
MK2 and MK3 are MAPK-activated proteins that are often being classified as isoenzymes. They have a high degree of structural similarity, and they also share activators, substrates, and physiological functions (28). Both are ubiquitously expressed in various tissues of mammals. However, MK3 is mainly expressed in muscle, liver, heart, and T and NK cells (11). MK2 and MK3 usually cooperate to regulate a variety of cellular processes, such as cytokine production, endocytosis, cytoskeleton organization, cell migration, cell cycle control, chromatin remodeling, and gene expression (28), while the potential functions and effects of MK3 for tumorigenesis are poorly understood. One study suggested that MK3 could act as a reliable prognostic indicator in colorectal cancer patients (25), but the expression, clinical significance, and underlying molecular mechanisms of MK3 in glioma have yet not been reported.
In this study, we found that the MK3 was lower in the normal brain tissues and differentially expressed in many types of cancers. Importantly, MK3 expression was markedly elevated in GBM and LGG, which was further validated by using the GEO and CGGA database and the Western blotting approach in glioma cell lines. In addition, IHC staining results showed a similar result in glioma tissues (Figure 1). We also demonstrated that the overexpression of MK3 was closely associated with WHO grade, 1p/19q codeletion, IDH status, and age. We further validate that the higher MK3 expression correlated with the poor clinicopathologic features of glioma (Figure 2). Moreover, the KM survival curve analyses showed that a high level of MK3 was correlated with poor prognosis in glioma from both TCGA and CGGA datasets (Figure 3). Together, our findings reveal the novel roles of MK3 for glioma and define MK3 as a valuable biomarker.
The survival analyses found that high expression of MK3 was negatively correlated with the OS rate of glioma patients (Figures 3B–D), while survival analyses of histological type for glioma patients showed that MK3 did not affect survival in GBM (Figure 3O), which might be limited by the small number of patients enrolled due to the short survival time and low survival rate of GBM (29). More GBM cases were needed to further evaluate the prognostic value of MK3 in GBM in the future.
Multivariate Cox analysis demonstrated that gender was an independent prognostic factor for glioma (Table 3). Sex differences have been well identified in many brain tumors including glioma. The sex-specific effects for the incidence, phenotype, and outcome of glioma have been well described; however, few insights are available to distinguish male and female glioma patients at the molecular level or allow specific targeting of these biological differences (30, 31). More studies are needed to focus on sex differences in GBM in terms of pathophysiology, hormones, metabolism, tumor location, treatment response, recurrence, and outcome (31).
Our function and pathway enrichment analyses suggested that MK3 co-related genes enriched in interferon-gamma signaling pathway (Figures 4, 5), which is consistent with previous studies that MK3 regulated the transcription activity of type I interferon-dependent genes (20) and that MK3 could suppress interferon-gamma expression to control NK cell cytotoxicity and Th1 CD4 T-cell development (23). Interferon has been widely used in the clinic for cancer treatment, as the interferon signaling pathway regulates the immune checkpoint blockade and tumor microenvironment (32). This study also found that correlated genes of MK3 in glioma were mainly associated with tumor immune regulations. Moreover, single-cell RNA-seq data revealed that MK3 was expressed in immune cells (Figures 6A–C). All these results indicated the potential roles of MK3 in regulating tumor immunity in glioma.
Although MK3 has been reported to express in NK and T cells, as well as regulate the inflammatory response of macrophages (33) and neutrophil recruitment (13), the exact functions and possible mechanisms of MK3 for regulating tumor immunity are unclarified. We found that MK3 expression was significantly correlated with infiltration of various immune cells, such as macrophages, neutrophils, Th17, CD8 T cells, NK CD56bright cells, and pDC (Figures 6C, D). Immune infiltrations have been shown associated with the prognosis of a patient (34), which suggested that MK3 may regulate immune infiltration and, in turn, affects glioma prognosis. More work is still needed to explore the special role of MK3 in tumor immunity of glioma.
Immunoinhibitors, such as PD-1, PD-L1, and CTLA-4, have gained widespread attention, as they can serve as immune checkpoint targets in multiple cancers to block immunoinhibitory signals and enable to produce effective antitumor responses (35). Our study demonstrated that the expression of MK3 was positively correlated with PD-1, PD-L1, and CTLA-4 (Figure 8), suggesting a prominent role of MK3 in regulating the expression of immune checkpoints and immunotherapy. Future investigations of MK3 should advance the therapeutic efficiency for glioma.
Chemokines are the largest subfamily of cytokines that could recruit different immune cell subsets into the microenvironment via interactions with chemokine receptors, which regulate tumor progression and therapeutic outcomes (36). Here, we reported that MK3 expression was positively correlated with the majority of chemokines and chemokine receptors, such as CCL (2, 5, 8, 18, 22), CXCL12, CCR (1, 2, 5), CXCR2, CXCR4, and CX3CR1 (Figures 7C–E), which play pro-tumor roles. Thus, our findings highlight the essential roles of MK3 in immune infiltrations in glioma.
In summary, we found that MK3 was significantly aberrantly upregulated in glioma. Through a series of comprehensive approaches, we demonstrated that the increased MK3 expression is strongly associated with clinicopathologic features, poor prognosis, and immune cell infiltration in glioma. Altogether, our results suggest that MK3 might serve as a valuable prognostic factor and a promising novel immunotherapy target for glioma.
The original contributions presented in the study are included in the article/supplementary material. Further inquiries can be directed to the corresponding authors.
The studies involving human participants were reviewed and approved by the Affiliated Hospital of Xuzhou Medical University. The patients/participants provided their written informed consent to participate in this study.
HC and JR designed the study. JR, JS, ML, and ZZ performed the research. JR and HC analyzed the data. JR, DY, and HC wrote the paper.
We are grateful for the support from grants from the Research Foundation of Xuzhou Medical University (53681921), National Natural Science Foundation of China (82002516), the Natural Science Foundation of Jiangsu Province in China (Grant No. BK20190984), and the Natural Science Fund for Colleges and Universities in Jiangsu Province (19KJB310023).
The authors declare that the research was conducted in the absence of any commercial or financial relationships that could be construed as a potential conflict of interest.
All claims expressed in this article are solely those of the authors and do not necessarily represent those of their affiliated organizations, or those of the publisher, the editors and the reviewers. Any product that may be evaluated in this article, or claim that may be made by its manufacturer, is not guaranteed or endorsed by the publisher.
1. Chen R, Smith-Cohn M, Cohen AL, Colman H. Glioma Subclassifications and Their Clinical Significance. Neurotherapeutics (2017) 14(2):284–97. doi: 10.1007/s13311-017-0519-x
2. Ostrom QT, Gittleman H, Truitt G, Boscia A, Kruchko C, Barnholtz-Sloan JS. CBTRUS Statistical Report: Primary Brain and Other Central Nervous System Tumors Diagnosed in the United States in 2011-2015. Neuro Oncol (2018) 20(suppl_4):iv1–iv86. doi: 10.1093/neuonc/noy131
3. Reifenberger G, Wirsching HG, Knobbe-Thomsen CB, Weller M. Advances in the Molecular Genetics of Gliomas - Implications for Classification and Therapy. Nat Rev Clin Oncol (2017) 14(7):434–52. doi: 10.1038/nrclinonc.2016.204
4. Alexander BM, Cloughesy TF. Adult Glioblastoma. J Clin Oncol (2017) 35(21):2402–9. doi: 10.1200/JCO.2017.73.0119
5. Hervey-Jumper SL, Berger MS. Insular Glioma Surgery: An Evolution of Thought and Practice. J Neurosurg (2019) 130(1):9–16. doi: 10.3171/2018.10.JNS181519
6. Saito R. Chemotherapy for Glioma. No Shinkei Geka (2021) 49(3):588–96. doi: 10.11477/mf.1436204432
7. Brada M. Radiotherapy in Malignant Glioma. Ann Oncol (2006) 17 Suppl 10:x183–5. doi: 10.1093/annonc/mdl257
8. Xu S, Tang L, Li X, Fan F, Liu Z. Immunotherapy for Glioma: Current Management and Future Application. Cancer Lett (2020) 476:1–12. doi: 10.1016/j.canlet.2020.02.002
9. Gusyatiner O, Hegi ME. Glioma Epigenetics: From Subclassification to Novel Treatment Options. Semin Cancer Biol (2018) 51:50–8. doi: 10.1016/j.semcancer.2017.11.010
10. Ludwig S, Engel K, Hoffmeyer A, Sithanandam G, Neufeld B, Palm D, et al. 3pk, a Novel Mitogen-Activated Protein (MAP) Kinase-Activated Protein Kinase, Is Targeted by Three MAP Kinase Pathways. Mol Cell Biol (1996) 16(12):6687–97. doi: 10.1128/MCB.16.12.6687
11. Sithanandam G, Latif F, Duh FM, Bernal R, Smola U, Li H, et al. 3pk, a New Mitogen-Activated Protein Kinase-Activated Protein Kinase Located in the Small Cell Lung Cancer Tumor Suppressor Gene Region. Mol Cell Biol (1996) 16(3):868–76. doi: 10.1128/MCB.16.3.868
12. Platanias LC. The P38 Mitogen-Activated Protein Kinase Pathway and Its Role in Interferon Signaling. Pharmacol Ther (2003) 98(2):129–42. doi: 10.1016/s0163-7258(03)00016-0
13. McCarthy PC, Phair IR, Greger C, Pardali K, McGuire VA, Clark AR, et al. IL-33 Regulates Cytokine Production and Neutrophil Recruitment via the P38 MAPK-Activated Kinases MK2/3. Immunol Cell Biol (2019) 97(1):54–71. doi: 10.1111/imcb.12200
14. Eales KL, Palygin O, O’Loughlin T, Rasooli-Nejad S, Gaestel M, Muller J, et al. The MK2/3 Cascade Regulates AMPAR Trafficking and Cognitive Flexibility. Nat Commun (2014) 5:4701. doi: 10.1038/ncomms5701
15. Tsukada H, Ochi H, Maekawa T, Abe H, Fujimoto Y, Tsuge M, et al. A Polymorphism in MAPKAPK3 Affects Response to Interferon Therapy for Chronic Hepatitis C. Gastroenterology (2009) 136(5):1796–805.e6. doi: 10.1053/j.gastro.2009.01.061
16. Wei Y, An Z, Zou Z, Sumpter R, Su M, Zang X, et al. The Stress-Responsive Kinases MAPKAPK2/MAPKAPK3 Activate Starvation-Induced Autophagy Through Beclin 1 Phosphorylation. Elife (2015) 4. doi: 10.7554/eLife.05289
17. Moens U, Kostenko S, Sveinbjornsson B. The Role of Mitogen-Activated Protein Kinase-Activated Protein Kinases (MAPKAPKs) in Inflammation. Genes (Basel) (2013) 4(2):101–33. doi: 10.3390/genes4020101
18. Nakanishi K, Saito Y, Azuma N, Sasajima T. Cyclic Adenosine Monophosphate Response-Element Binding Protein Activation by Mitogen-Activated Protein Kinase-Activated Protein Kinase 3 and Four-and-a-Half LIM Domains 5 Plays a Key Role for Vein Graft Intimal Hyperplasia. J Vasc Surg (2013) 57(1):182–93. doi: 10.1016/j.jvs.2012.06.082
19. Voncken JW, Niessen H, Neufeld B, Rennefahrt U, Dahlmans V, Kubben N, et al. MAPKAP Kinase 3pk Phosphorylates and Regulates Chromatin Association of the Polycomb Group Protein Bmi1. J Biol Chem (2005) 280(7):5178–87. doi: 10.1074/jbc.M407155200
20. Li Y, Sassano A, Majchrzak B, Deb DK, Levy DE, Gaestel M, et al. Role of P38alpha Map Kinase in Type I Interferon Signaling. J Biol Chem (2004) 279(2):970–9. doi: 10.1074/jbc.M309927200
21. Guess AJ, Ayoob R, Chanley M, Manley J, Cajaiba MM, Agrawal S, et al. Crucial Roles of the Protein Kinases MK2 and MK3 in a Mouse Model of Glomerulonephritis. PloS One (2013) 8(1):e54239. doi: 10.1371/journal.pone.0054239
22. Drube S, Kraft F, Dudeck J, Muller AL, Weber F, Gopfert C, et al. MK2/3 Are Pivotal for IL-33-Induced and Mast Cell-Dependent Leukocyte Recruitment and the Resulting Skin Inflammation. J Immunol (2016) 197(9):3662–8. doi: 10.4049/jimmunol.1600658
23. Kother K, Nordhoff C, Masemann D, Varga G, Bream JH, Gaestel M, et al. MAPKAP Kinase 3 Suppresses Ifng Gene Expression and Attenuates NK Cell Cytotoxicity and Th1 CD4 T-Cell Development Upon Influenza A Virus Infection. FASEB J (2014) 28(10):4235–46. doi: 10.1096/fj.14-249599
24. Ozcan L, Xu X, Deng SX, Ghorpade DS, Thomas T, Cremers S, et al. Treatment of Obese Insulin-Resistant Mice With an Allosteric MAPKAPK2/3 Inhibitor Lowers Blood Glucose and Improves Insulin Sensitivity. Diabetes (2015) 64(10):3396–405. doi: 10.2337/db14-1945
25. Dai S, Xu S, Ye Y, Ding K. Identification of an Immune-Related Gene Signature to Improve Prognosis Prediction in Colorectal Cancer Patients. Front Genet (2020) 11:607009. doi: 10.3389/fgene.2020.607009
26. Filbin MG, Tirosh I, Hovestadt V, Shaw ML, Escalante LE, Mathewson ND, et al. Developmental and Oncogenic Programs in H3K27M Gliomas Dissected by Single-Cell RNA-Seq. Sci (New York NY) (2018) 360(6386):331–5. doi: 10.1126/science.aao4750
27. Bindea G, Mlecnik B, Tosolini M, Kirilovsky A, Waldner M, Obenauf AC, et al. Spatiotemporal Dynamics of Intratumoral Immune Cells Reveal the Immune Landscape in Human Cancer. Immunity (2013) 39(4):782–95. doi: 10.1016/j.immuni.2013.10.003
28. Ronkina N, Kotlyarov A, Gaestel M. MK2 and MK3–A Pair of Isoenzymes? Front Biosci (2008) 13:5511–21. doi: 10.2741/3095
29. Iser IC, Pereira MB, Lenz G, Wink MR. The Epithelial-To-Mesenchymal Transition-Like Process in Glioblastoma: An Updated Systematic Review and In Silico Investigation. Med Res Rev (2017) 37(2):271–313. doi: 10.1002/med.21408
30. Yang W, Warrington NM, Taylor SJ, Whitmire P, Carrasco E, Singleton KW, et al. Sex Differences in GBM Revealed by Analysis of Patient Imaging, Transcriptome, and Survival Data. Sci Transl Med (2019) 11(473). doi: 10.1126/scitranslmed.aao5253
31. Carrano A, Juarez JJ, Incontri D, Ibarra A, Guerrero Cazares H. Sex-Specific Differences in Glioblastoma. Cells (2021) 10(7). doi: 10.3390/cells10071783
32. Gocher AM, Workman CJ, Vignali DAA. Interferon-Gamma: Teammate or Opponent in the Tumour Microenvironment? Nat Rev Immunol (2021). doi: 10.1038/s41577-021-00566-3
33. Gaestel M. What Goes Up Must Come Down: Molecular Basis of MAPKAP Kinase 2/3-Dependent Regulation of the Inflammatory Response and Its Inhibition. Biol Chem (2013) 394(10):1301–15. doi: 10.1515/hsz-2013-0197
34. Bruni D, Angell HK, Galon J. The Immune Contexture and Immunoscore in Cancer Prognosis and Therapeutic Efficacy. Nat Rev Cancer (2020) 20(11):662–80. doi: 10.1038/s41568-020-0285-7
35. Mahoney KM, Rennert PD, Freeman GJ. Combination Cancer Immunotherapy and New Immunomodulatory Targets. Nat Rev Drug Discovery (2015) 14(8):561–84. doi: 10.1038/nrd4591
Keywords: MK3, prognosis, biomarker, immune infiltrate, glioma
Citation: Ren J, Sun J, Li M, Zhang Z, Yang D and Cao H (2021) MAPK Activated Protein Kinase 3 Is a Prognostic-Related Biomarker and Associated With Immune Infiltrates in Glioma. Front. Oncol. 11:793025. doi: 10.3389/fonc.2021.793025
Received: 11 October 2021; Accepted: 15 November 2021;
Published: 06 December 2021.
Edited by:
Frederique Vegran, INSERM U1231 Lipides, Nutrition, Cancer (LNC), FranceReviewed by:
Chunyan Hao, First Hospital of Shanxi Medical University, ChinaCopyright © 2021 Ren, Sun, Li, Zhang, Yang and Cao. This is an open-access article distributed under the terms of the Creative Commons Attribution License (CC BY). The use, distribution or reproduction in other forums is permitted, provided the original author(s) and the copyright owner(s) are credited and that the original publication in this journal is cited, in accordance with accepted academic practice. No use, distribution or reproduction is permitted which does not comply with these terms.
*Correspondence: Haowei Cao, aGFvd2VpLmNAeHpobXUuZWR1LmNu; Dejun Yang, ZGVqdW4ueWFuZ0B4emhtdS5lZHUuY24=
†These authors have contributed equally to this work and share first authorship
Disclaimer: All claims expressed in this article are solely those of the authors and do not necessarily represent those of their affiliated organizations, or those of the publisher, the editors and the reviewers. Any product that may be evaluated in this article or claim that may be made by its manufacturer is not guaranteed or endorsed by the publisher.
Research integrity at Frontiers
Learn more about the work of our research integrity team to safeguard the quality of each article we publish.