 Maria Rosaria Ruggiero1
 Simona Baroni1
 Valeria Bitonto1
 Roberto Ruiu1
 Smeralda Rapisarda1
 Silvio Aime2
 Simonetta Geninatti Crich1*
- 1Department of Molecular Biotechnology and Health Sciences, University of Turin, Turin, Italy
- 2IRCCS SDN, Naples, Italy
This study aims to explore whether the water exchange rate constants in tumor cells can act as a hallmark of pathology status and a reporter of therapeutic outcomes. It has been shown, using 4T1 cell cultures and murine allografts, that an early assessment of the therapeutic effect of doxorubicin can be detected through changes in the cellular water efflux rate constant kio. The latter has been estimated by analyzing the magnetization recovery curve in standard NMR T1 measurements when there is a marked difference in the proton relaxation rate constants (R1) between the intra- and the extra-cellular compartments. In cellular studies, T1 measurements were carried out on a relaxometer working at 0.5 T, and the required difference in R1 between the two compartments was achieved via the addition of a paramagnetic agent into the extracellular compartment. For in-vivo experiments, the large difference in the R1 values of the two-compartments was achieved when the T1 measurements were carried out at low magnetic field strengths. This task was accomplished using a Fast Field Cycling (FFC) relaxometer that was properly modified to host a mouse in its probe head. The decrease in kio upon the administration of doxorubicin is the result of the decreased activity of Na+/K+-ATPase, as shown in an independent test on the cellular uptake of Rb ions. The results reported herein suggest that kio can be considered a non-invasive, early and predictive biomarker for the identification of responsive patients immediately from the first doxorubicin treatment.
Introduction
Diagnostic imaging tools play a key role in the characterization of complex, heterogeneous and multifactorial diseases such as cancer. They are often crucial for the selection of the most suitable therapy and for the evaluation of its outcome, i.e. to increase the chance of success and reduce the side effects (1). The currently available pharmacological options in the field of breast cancer, which is the most common cancer in women, are under intense scrutiny to find means to obtain an early evaluation as to their efficacy. The World Health Organization (WHO) criteria and Response Evaluation Criteria in Solid Tumors (RECIST) are based on the assessment of tumor size in morphological images by Computer Tomography (CT) and Magnetic Resonance Imaging (MRI) (2, 3). However, volume changes are quite late events and their use in the evaluation of the undertaken therapy may be an issue when dealing with a disease for which time is a very important parameter. Therefore, there is a continuous search for methods that can report the early effects of therapy, in particular those that use biomarkers to report changes in tumor metabolic activity. Currently, metabolic assessments that are based on the use of positron emission tomography (PET) tracers are widely used as they reflect the viability of cancer cells and other functional changes in the response to anticancer treatments (4, 5). Moreover, the availability of advanced functional magnetic resonance imaging (fMRI) techniques has furnished new possibilities in the monitoring of therapeutic responses (6). There is a growing consensus that MRI protocols may provide powerful diagnostic tools in the field of oncology (7). Their diagnostic power arises primarily from disease-induced changes in the nuclear magnetic resonance (NMR) relaxation times of tissue, especially in the spin-lattice relaxation time T1 (8, 9). However, these changes cannot be fully exploited at the magnetic field strengths of currently available MRI scanners, as changes in tissue T1 do not appear to be sensitive enough at these field strengths to report on the response of the tumor cells to therapy. On the other hand, our group has recently demonstrated that measuring T1 at lower magnetic field strengths can be very informative and report on the tumor metabolic status (10, 11). This is possible because tissue T1 varies with applied magnetic field strength, with the differences between tissues being higher at lower magnetic field strengths (12–15). This behavior (often referred to as “T1-dispersion”, or simply relaxometry) is a marker of disease, but is invisible to conventional, fixed-field MRI scanners. Fast Field-Cycling (FFC)-NMR is the only practicable technique for measuring T1-dispersion. It involves switching the magnetic field between different field strengths (from 0.2 to 200 mT, typically) during the measurement procedure (16). The proton relaxation rate constants (R1 = 1/T1) of tissues are dependent on the extra/intracellular water ratio and the water exchange rate between the two compartments (10). Both terms are affected by tumor-cell metabolism. The relative amount of water in the two compartments and their exchange across cellular membranes are significantly different in healthy and tumor tissues. Recent studies have shown that the osmosis- and metabolism-driven movement of free water molecules across membranes, which affect cell volume and shape, may be an intrinsic and extremely sensitive reporter of pathology and its energetic deregulation (17–20).
In our previous work (10, 11), we demonstrated that observing R1 at low magnetic fields can clearly discriminate between healthy and tumor tissues as well as between different types of adenocarcinoma breast cancer. The differences in the observed relaxometric behavior can be accounted for in terms of the cellular water efflux rate constant, kio, that can be obtained from fitting the Magnetization decay acquired on the FFC-NMR relaxometer. This observation reports on the particular characteristics of the given tumor cell type. A smaller kio indicates a slower water exchange rate across the transcytolemmal membrane, and this has been shown to be related to the overexpression/upregulation of the GLUT1 and Na+/K+-ATPase transporters.
On this basis, FFC-NMR is expected to provide relevant information about the metabolic mechanisms involved in disease progression and response to treatment. We hypothesize that kio may be used as an early predictive biomarker of response to treatment. In this study, we have performed in-vitro and in-vivo experiments to evaluate how changes in kio are related to treatment with doxorubicin, an anthracyline drug, that is routinely used in the treatment of several cancers including breast, lung, gastric, ovarian, thyroid, non-Hodgkin’s and Hodgkin’s lymphoma, multiple myeloma, sarcoma and pediatric cancers (21).
Material and Methods
Cell Cultures
The 4T1 (ATCC® CRL-2539™) cell line, initially derived from spontaneous breast tumor growth in a BALB/c, was purchased from American Type Culture Collection (ATCC, USA). 4T1-R was derived from 4T1 (ATCC® CRL-2539™). They were grown in RPMI 1640 medium supplemented with 10% fetal bovine serum (FBS), 100 U/mL Penicillin with 100 μg/ml Streptomycin, and 4 mM glutamine. Cells were cultured in 5% CO2/95% air at 37°C in a humidified chamber and were split every 2 to 3 days. All cells tested negative for mycoplasma using the MycoAlert™ Mycoplasma Detection Kit. All materials were purchased from Lonza (Basel, Switzerland).
Drug-Resistant Cell Line (4T1-R)
4T1-R was derived from 4T1 (ATCC® CRL-2539™), which was treated for six months with an increased concentration of doxorubicin (Sigma Aldrich) (from 50 nM to 5 μM) (22–24). At the confluence of 80%, the cells were seeded for the next treatment cycle with a higher concentration of the drug. The acquisition of drug resistance was evaluated using an MTT assay, based on the reduction of tetrazolium salts to formazan by mitochondrial succinate dehydrogenase, and quantified spectrophotometrically. The cells were seeded in 96 multi-well plates at a density of 10000 cells/well. After 24 h, doxorubicin (Sigma Aldrich) (1 to 50 μM)) was added to the cell suspensions, which were then incubated for a further 24 h at 37°C and 5% CO2. The medium was then removed and 100 μl of Thiazolyl Blue Tetrazolium Bromide (Sigma Aldrich) was added at a concentration of 0.45 mg/ml into each well and the plate was incubated for 4 h at 37°C and 5% CO2. After the removal of the suspension medium, 150 μl of dimethyl sulfoxide (DMSO) was added to each well to solubilize the formazan salt crystals that were produced by the metabolism of the live cells. After 30 minutes, the absorbance was read at 570 nm using an iMark microplate reader (Biorad). Cell vitality was reported as the percentage of dead cells relative to the control. The experiment was performed in quadruplicate and the data were graphically presented as mean ± SD.
Western Blot
Frozen cells, that had not previously been treated with trypsin for detachment, were incubated in RIPA lysis buffer (150 mM NaCl; 50 mM Tris-HCl, pH 8.0; sodium dodecyl sulphate (SDS) 0,1%; sodium deoxycholate 0,5%; Nonidet P-40 1%) supplemented with 1 mM PMSF, 1 mM NaVO4, 1 mM NaF and protease-inhibitor cocktail (Sigma-Aldrich) for 40 min on ice. Cell lysates were centrifuged for 10 min at 14.000 g and the supernatant was harvested for quantification. The total protein concentration was quantified using the Pierce™ BCA Protein Assay Kit (Thermo-Fisher Scientific). After 30 min incubation at room temperature (when not otherwise specified) in β-mercaptoethanol-containing Laemmli Sample Buffer (Bio-Rad), equal amounts of protein lysates (ranging between 30 and 70 μg) were separated via electrophoresis in a 4-15% Mini-Protean TGX precast gel (Bio-Rad) and then transferred onto an Immobilion-P PVDF membrane (0.45 μm pore size, Merck Millipore). After blocking with either 5% non-fat dry milk (Santa Cruz Biotechnology) or 5% BSA (Sigma-Aldrich) in wash buffer (Tris Buffered Saline supplemented with 0.1% Tween-20 - T-TBS - from Sigma-Aldrich), the membranes were incubated overnight at 4°C with either rabbit anti-MDR1 (Cat#sc-9313, clone H-241 Santa Cruz Biotechnology, 1:250 in PBS, 1% BSA) or mouse anti-β-actin (Cat#sc-69879, Clone AC-15, Santa Cruz Biotechnology, 1:200 in T-TBS, 5% Milk) antibodies in blocking buffer. The membranes were then rinsed 3 times in T-TBS and incubated for 1 hour at room temperature with either HRP-conjugated anti-rabbit (Cat#A0545, Sigma-Aldrich, 1:2000 in T-TBS, 5% Milk) or anti-mouse (Cat#A4416, Sigma-Aldrich, 1:2000 in T-TBS, 5% Milk). β-actin was used as the loading control. The membranes were incubated with Pierce® ECL Western Blotting Substrate (Thermo-Fisher Scientific) and images were acquired using a ChemiDoc™ Touch Imaging System (Bio-Rad).
In-Vitro Determination of Cellular Membrane Water Exchange Rate Constants by a Relaxometric Procedure After Doxorubicin Treatment
The determination of cellular membrane water exchange rate constants was performed following the protocol described by Ruggiero et al. (10, 11). 4T1 and 4T1-R were seeded in a 175 cm2 flask at a density of 6 million cells/flask. After 24 h, cells were incubated with 0, 0.1, 0.5, 1, 5 µM of doxorubicin for a further 24 h (25, 26). The cells were detached using 0.05% trypsin and 0.02% EDTA, washed once with Phosphate Buffer Saline (PBS) and re-suspended in the presence of 10 mM Gd-HPDO3A (Prohance, kindly provided by Bracco S.p.A. (Milan, Italy)) in PBS. The relaxometric measurements were carried out within 15 min, during which cells were transferred to 5 mm NMR tubes and centrifuged for 5 minutes at 0.1 rcf (4°C). The water proton T1 values of the cellular pellets were measured at 0.5 T and 25°C on a Stelar SPINMASTER spectrometer (Stelar, Mede, Italy) using the inversion-recovery (IR) pulse sequence with 64 τ increments. The apparently biexponential recovery of the magnetization was observed. The water exchange rate constants (efflux, kio and influx, koi) across the cell membrane were determined by analyzing the IR data using the 2SX model (17, 18).
Determination of Rb Uptake
Seven thousand and fifty cells were plated in 10 cm Ø dishes. After 24 h, they are incubated with different concentrations of doxorubicin (from 0 to 5 µM) for a further 24 h. They were then incubated for 1 h with 0.12 mM RbCl in Earle’s Balanced Salt Solution (EBSS) at 37°C and 5% CO2. Following four washing steps with cold PBS to remove the extracellular RbCl, the cells were harvested. A Bradford assay was used to determine the protein concentration before acidic digestion. 200 μl of the cell suspension and 200 μl of HNO3 (70%) were subjected to acidic mineralization to oxidize the organic matter, solubilize all metals and simplify the matrix. The microwave (ETHOS UP Milestone, Bergamo, Italy) heating program consisted of a ramp to 150°C in 6 minutes, followed by 8 min to 150°C. After mineralization, sample volumes were brought to 3 ml with doubly deionized water. The quantification of Rb was performed via ICP-MS (Element-2; Thermo-Finnigan, Rodano (MI), Italy) analysis. The calibration curve was obtained using absorption standard solutions (Sigma-Aldrich) in the range 0.2–0.005 μg/mL.
Flow Cytometry
Having performed enzymatic detachment and several washings, the cells were resuspended in Annexin V binding buffer (Annexin V Apoptosis Detection Kit APC, eBioscience™) and incubated in flow cytometry tubes with the Annexin V-APC reagent, according to manufacturer’s instructions. After 15 min incubation at room temperature, the cells were rinsed in Annexin V binding buffer, the tubes were centrifuged and the supernatant was discarded. DAPI (1 µg/mL; Sigma Aldrich) was added to the tubes before acquisition with a flow cytometer. The fluorescence intensity and distribution of the cells were measured using a BD FACSVerse™ flow cytometer (BD - Becton, Dickinson, and Company) and the data were analyzed using FlowJo (LLC) software. Doxorubicin incorporation was estimated based on the mean fluorescence intensity (MFI) that resulted from doxorubicin intrinsic fluorescence (λEx 470 nm, λEm 585 nm), which can be excited with a blue laser (488 nm) and detected using a PE (586/42 nm) filter. Cells that displayed negative staining for both Annexin V-APC and DAPI were considered to be live cells, those that were staining positive for Annexin V-APC, but negative for DAPI were considered early apoptotic. Those that were staining double positive were considered late apoptotic, whereas those staining positive for DAPI only were considered dead, but not apoptotic. Appropriate negative and positive controls were used.
Animal Models
8-week-old female BALB/c mice were inoculated in their hind-limb muscle with 1 million 4T1 cells suspended in 100 μl of Phosphate Buffered Saline (PBS). BALB/c mice (Charles River Laboratories Italia S.r.l., Calco Italia) were maintained under specific pathogen-free conditions in the animal facility at the Molecular Biotechnology Center, University of Turin, and treated in accordance with EU (EU2010/63) and Italian (d.lgs 26/2014) regulations. Before undergoing imaging and nuclear magnetic resonance experiments, the mice were anesthetized with a mixture of tiletamine/zolazepam (Zoletil 100; Vibac, Milan, Italy) 20 mg/kg and xylazine (Rompun; Bayer, Milan, Italy) 5 mg/kg. The animal treatment protocol was approved by the Italian Ministry of Health (authorization number 807/2017-PR). When the tumor reached volumes of around 150-200 mm3, the animals were treated three times at 1-day intervals (days 0, 2 and 4) intravenously via the tail vein at a dose of 5 mg/kg of doxorubicin (26–28).
Magnetic Resonance Imaging
T2-weighted images were acquired at 1 T on an Aspect M2-High Performance MRI System (Aspect Magnet Technologies Ltd., Netanya, Israel) consisting of a NdFeB magnet, equipped with a 35 mm solenoid Tx/Tr coil with an inner diameter of 35 mm. This system is equipped with fast gradient coils (gradient strength, 450 mT m-1 at 60 A; ramp time, 250 μs at 160 V) with a field homogeneity of 0.2−0.5 G. MR images were acquired using a Fast Spin Echo sequence (FSE) (TR 3000 ms; TE 50 ms; number of slices 11; slice thickness 1 mm; FOV 50x50 mm; matrix 168 × 160, Flip angle 90°). Tumor volume was determined using ITK-SNAP software.
In-Vivo Nuclear Magnetic Resonance Dispersion Profiles (NMRD)
In-vivo NMRD profiles were acquired on the Stelar FFC-NMR relaxometer (Stelar S.n.c., Mede (PV), Italy), which is equipped with a 40 mm 0.5 T FC magnet and a dedicated 11 mm solenoid detection coil. The relaxometer operates under complete computer control with an absolute uncertainty in the 1/T1 value of ±2%. The typical field sequences used were the Non-Polarized sequence (NP/S), between 16 and 7 MHz, and the Pre-Polarized sequence (PP/S), between 7 and 0.01 MHz. The observation field was set at 14.5 MHz, while the polarization field was set at 13 MHz. Acquisition was performed using 32 τ over a long-time range (2.8-4 s) in order to sample both the rapidly and slowly relaxing magnetization components. These profiles were acquired at seven different relaxation field strengths (0.01, 0.02, 0.037, 0.07, 0.15, 0.39, 1 MHz in terms of proton Larmor frequency). During acquisition, murine temperature was maintained at 25°C using a gel pad. Data were simultaneously analyzed using Origin software (OriginPro 8.5.0 SR1, OriginLab, Northampton, MA, Levenberg-Marquardt algorithm, RRID : SCR_014212), in accordance with the 2SX model (10, 17, 18), sharing the extracellular volume fraction, Vex, and the extracellular water life time constant, τex, parameters and maintaining the extracellular relaxation rate constant, R1ex, fixed to the Matrigel values obtained in a separated experiment (10). The Vex value was allowed to vary within a reliable range as reported in the literature; 0.09-0.19 for healthy mouse hind limbs, and 0.15-0.5 for tumor mouse hind limbs (18–20, 29, 30).
Tunel Assay
Immediately after the NMRD profile was acquired (3 days after the first doxorubicin treatment), the mice were sacrificed and perfused, via the vascular system, with a 4% paraformaldehyde solution as a fixation procedure to obtain the best possible preservation of the tumor tissue for immunohistochemistry (31). PFA-fixed and paraffin-embedded Dewaxed 5 μm tumor sections were stained with the in-situ Apoptosis Detection Kit (Abcam), according to manufacturer’s protocol.
Results and Discussion
In-Vitro Experiments on Murine Adenocarcinoma Cells (4T1)
Murine adenocarcinoma 4T1 cells were treated with doxorubicin (0.1-5 µM) for 24 h. The quantitative determination of the cellular water efflux rate constant (kio) was carried out by following a well-established relaxometry-based method at 0.5 T in the presence of a 10 mM solution of the paramagnetic Gd-HPDO3A complex in the extracellular space of the cellular suspension (10, 32–34). The extracellular distribution of the paramagnetic agent allows a marked difference in proton relaxation rates to be achieved between the extra- and the intra-cellular compartments. It follows that the recovery of the magnetization curve after its selective inversion is characterized by an apparently bi-exponential behavior, whose fitting yields estimated values for kio.
In Figure 1A, the obtained kio values are plotted as a function of the doxorubicin concentrations. The observed variations were statistically significant at low doses of the drug (0.1 and 0.5 μM) with P-values of 0.0000499 and 0.000215, respectively. Moreover, at the same doxorubicin concentrations, the MTT test showed that the treated cells had high vitality, which is very similar to the results found in the control experiment (Figure 1B). This finding is taken as a good indicator to support the view that kio variations could be considered to be an early predictive biomarker of treatment response.
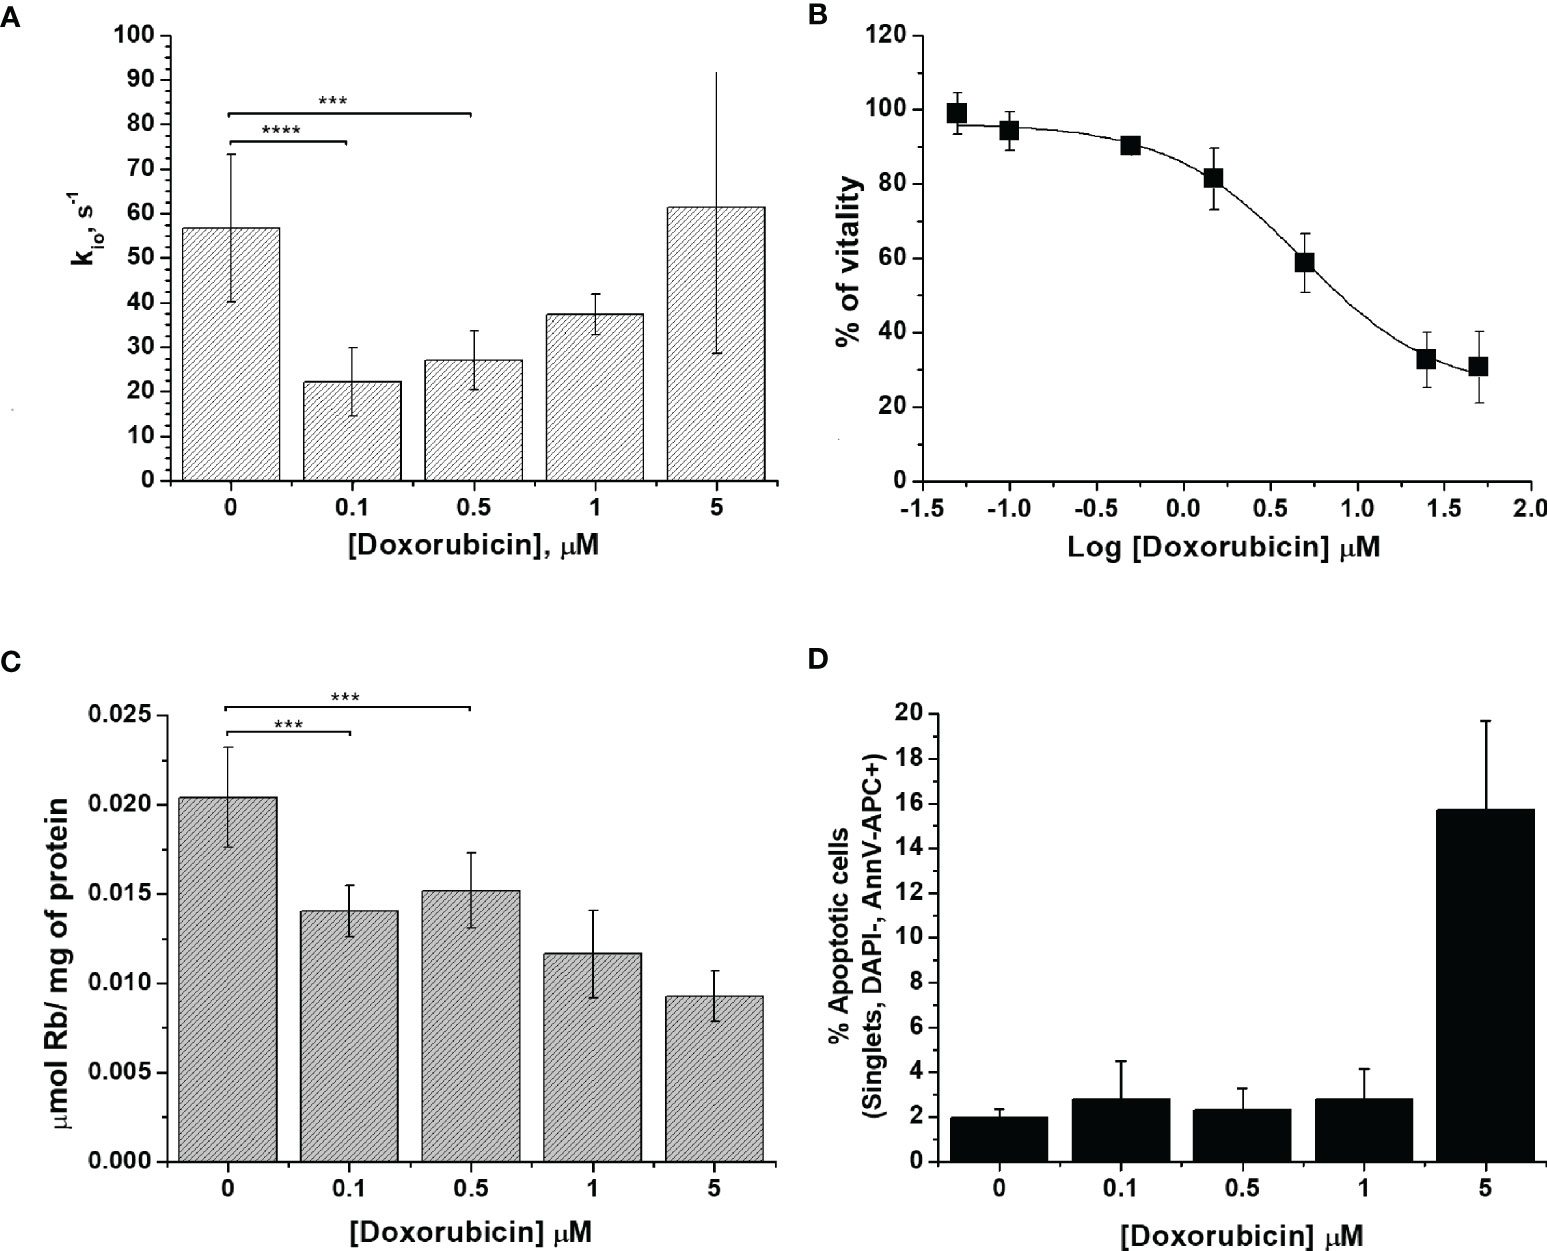
Figure 1 The characterization of 4T1 cells. (A) The cellular water efflux rate constant, kio (s-1), as determined 24 h after doxorubicin treatment at different drug concentrations (0.1-5 µM). kio was determined by measuring the water proton relaxation times of cell suspensions in the presence of 10 mM of Gd-HPDO3A at 25°C on a fixed frequency spectrometer operating at 0.5 T. Data are expressed as the mean ± SD with n ≥7. (B) Percentage of viable cells plotted vs. Log[Doxorubicin] after 24 h of treatment, obtained using the MTT test. Data are expressed as the mean ± SD of three independent experiments. (C) Cellular uptake of Rb (µmol of Rb/mg of protein) measured 24 h after doxorubicin treatment. The cells were suspended in a medium containing RbCl 0.12 mM for 1 h at 37°C and 5% of CO2. Data are expressed as the mean ± SD of three independent experiments. (D) Determination of the % of apoptotic cells after doxorubicin treatment at different concentrations. The percentage of apoptotic cells was assessed using DAPI-, AnnV-APC+ staining with FACS analysis. Data are expressed as the mean ± SD of three independent experiments. (***p ≤ 0.001, ****p ≤ 0.0001).
We surmise that the observed behavior, induced by the presence of increasing doses of the drug, can be accounted for in terms of the cellular system being subjected to a variety of different effects. In the experiments at low drug concentrations, the main biologically detectable phenomenon is a decrease in kio, which is, in principle, associated with an alteration of the membrane transport system, which is likely due to a decrease in Na+/K+-ATPase activity, as previously reported (10). In the case of the experiments at higher concentrations of the drug, one has to deal with extensive transformations that eventually lead to cell death. In cancer cells, doxorubicin acts via two principal mechanisms: i) intercalation into DNA and the disruption of topoisomerase-II-mediated DNA repair, with the consequent generation of free radicals, which damage lipids, DNA and proteins (21); and, ii) the inhibition of membrane-associated ion pumps, which is induced by the major metabolite of doxorubicin, doxorubicinol (21, 35–37). In principle, the two mechanisms can have opposite effects on kio. The transport activity of Na+/K+-ATPase was assessed to provide more insight into the doxorubicin response. The method (38), relies on the ICP-MS quantification of the cellular uptake of the rubidium ion, Rb+, which is an established congener for K+ transport by Na+/K+-ATPase (38, 39). It is well established that this ICP-MS method provides great accuracy in monitoring metal-ion transporters in a wide range of cell types and conditions (40). After doxorubicin treatment, adherent cells were incubated in the presence of RbCl 0.12 mM for 1 h at 37°C and 5% of CO2. The uptake of Rb, normalized to the amount of cell proteins, decreased significantly even in cells treated with the lowest doses of the drug (i.e. when the concentrations were 0.1 and 0.5 µM, respectively, with a P-value <0.01) (Figure 1C). The decrease in Rb uptake supports the view that the first effect induced in the treated cells is a reduced Na+/K+-ATPase efficiency, which, in turn, is responsible for the observed decrease in water exchange across the cellular membrane. For 4T1 cells, the amount of Rb per cell decreased by 30% and 54% upon changing from 0.1 to 5 µM doxorubicin treatment, respectively.
The response to doxorubicin in terms of cell deaths was assessed next. Figure 1D reports the percentages of apoptotic cells as a function of the applied doxorubicin concentrations. From these results, it is evident that apoptosis occurs only at higher drug concentrations, which corroborates our working hypothesis according to which kio variations report early changes in cellular activity following doxorubicin treatment.
In Vitro Experiments on Doxorubicin-Resistant 4T1 Cells (4T1-R)
One of the major drawbacks of chemotherapy is drug resistance. To mimic the acquisition of drug resistance (25), the murine mammary carcinoma 4T1 cells were treated with doxorubicin for several cycles with an increased concentration of doxorubicin (from 50 nM to 1 µM). After six months of treatment, the cells became resistant to doxorubicin as assessed by the results of the vitality test (i.e. MTT) (Figure 2B).
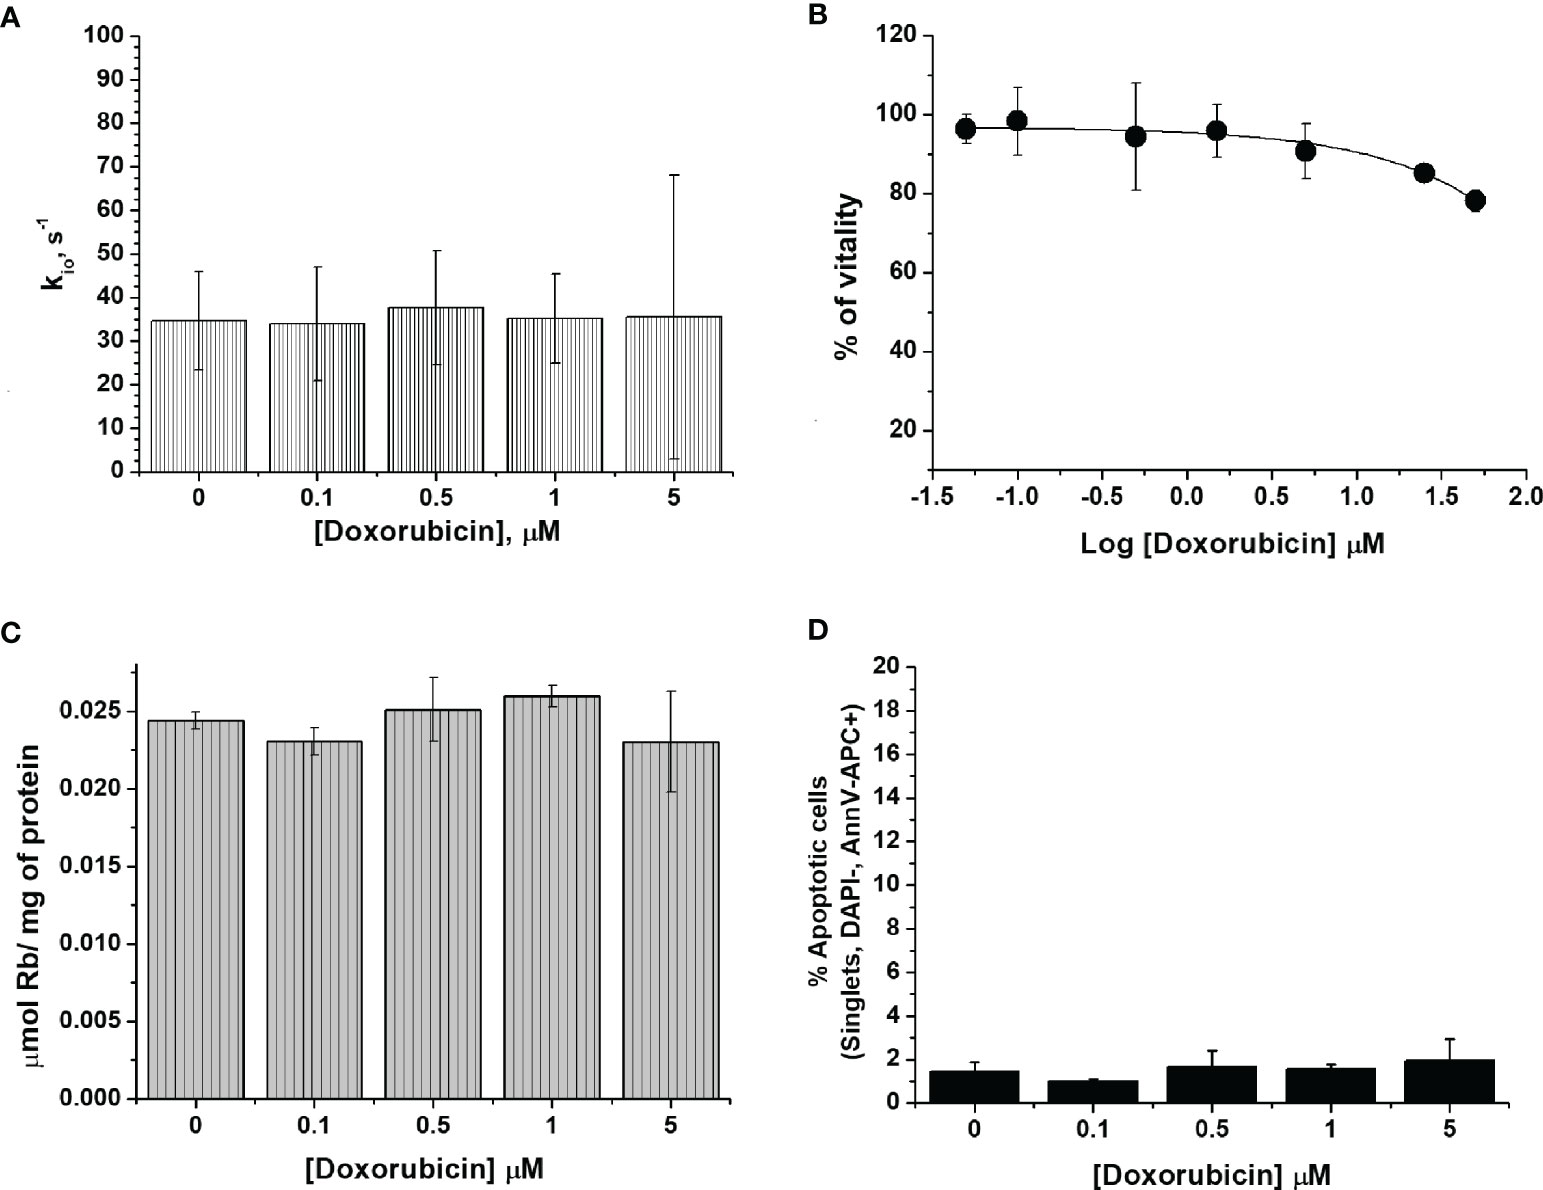
Figure 2 The characterization of 4T1-R cells. (A) The cellular water efflux rate constant, kio (s-1), determined 24 h after doxorubicin treatment at different drug concentrations (0.1-5 µM). kio values were determined by measuring the water proton relaxation times of cell suspensions in the presence of 10 mM of Gd-HPDO3A at 25°C on a fixed frequency spectrometer operating at 0.5 T. Data are expressed as the mean ± SD with n= 4. (B) Percentage of viable cells as determined using the MTT test and plotted vs Log[Doxorubicin] µM. Data are expressed as the mean ± SD of three independent experiments. (C) Cellular uptake of Rb (µmol of Rb/mg of protein) measured 24 h after doxorubicin treatment. The cells were suspended in a medium containing RbCl 0.12 mM for 1 h at 37°C and 5% of CO2. Data are expressed as the mean ± SD of three independent experiments. (D) Determination of the % of apoptotic cells after doxorubicin treatment at different concentrations. The percentage of apoptotic cells was assessed by DAPI-, AnnV-APC+ staining using FACS analysis. Data are expressed as the mean ± SD of three independent experiments.
In a previous work, the acquisition of drug resistance was ascribed to the overexpression of ATP binding transporters, such as the MDR1/P-glycoprotein (Pgp, encoded by the ABCB1 gene) (25, 41). We can confirm this notion as the western blot analysis of the MDR1/P-glycoprotein (Figure S1), using both cytoplasmic and nuclear extracts of 4T1 and 4T1-R cells, reported the overexpression of this glycoprotein in the resistant cell line.
The detection of doxorubicin fluorescence is a good reporter of the intracellular incorporation of the drug. Figure S2 shows that the fluorescent response was concentration-dependent and significantly higher in 4T1 than in 4T1-R cells. Further support was gained by plotting the mean fluorescence intensity (MFI) as a function of doxorubicin concentration in the incubation medium. The results confirmed the increased doxorubicin uptake in wild type 4T1 cells compared to the resistant clone (Figure S2).
Subsequently, we investigated whether the administration of doxorubicin has an effect on the transport of water molecules across the membrane of 4T1-R cells (Figure 2A). The obtained kio values showed a non-significant decrease and remained almost constant over the entire range of investigated doxorubicin concentrations. These results support the view that the kio decrease in 4T1 cells observed at the low drug concentrations is due to the specific cytotoxic effect that is induced by doxorubicin, and not to an aspecific interaction between doxorubicin and the cell membrane that may potentially cause a change in cell-membrane permeability, which, most likely, would also have been present in the 4T1-R cells. The ICP-MS quantification of Rb confirmed that the transport activity of Na+/K+-ATPase in 4T1-R was not affected by the administration of doxorubicin. The uptake of Rb ions, normalized to the amount of cell proteins, was not significantly different in the cells treated with different concentrations (0.1 and 5 µM) of the drug, compared to control cells (Figure 2C). The determination of the percentage of apoptotic cells by FACS analysis confirmed that the 4T1-R resistant cell line was not affected by the toxicity of the drug. (Figure 2D).
In-Vivo Experiments: Relaxometric Assessment of Doxorubicin Treatment in Balb/c Mice Bearing 4T1 Tumors
To verify the hypothesis that the assessment of kio may be used as an early predictive biomarker of treatment response in-vivo, an experimental setup was designed for mammary-tumor-bearing mice (Figure 3). The determination of kio, via the acquisition of the FFC-NMR profiles of the tumor region, was carried out before, during and after drug treatment.
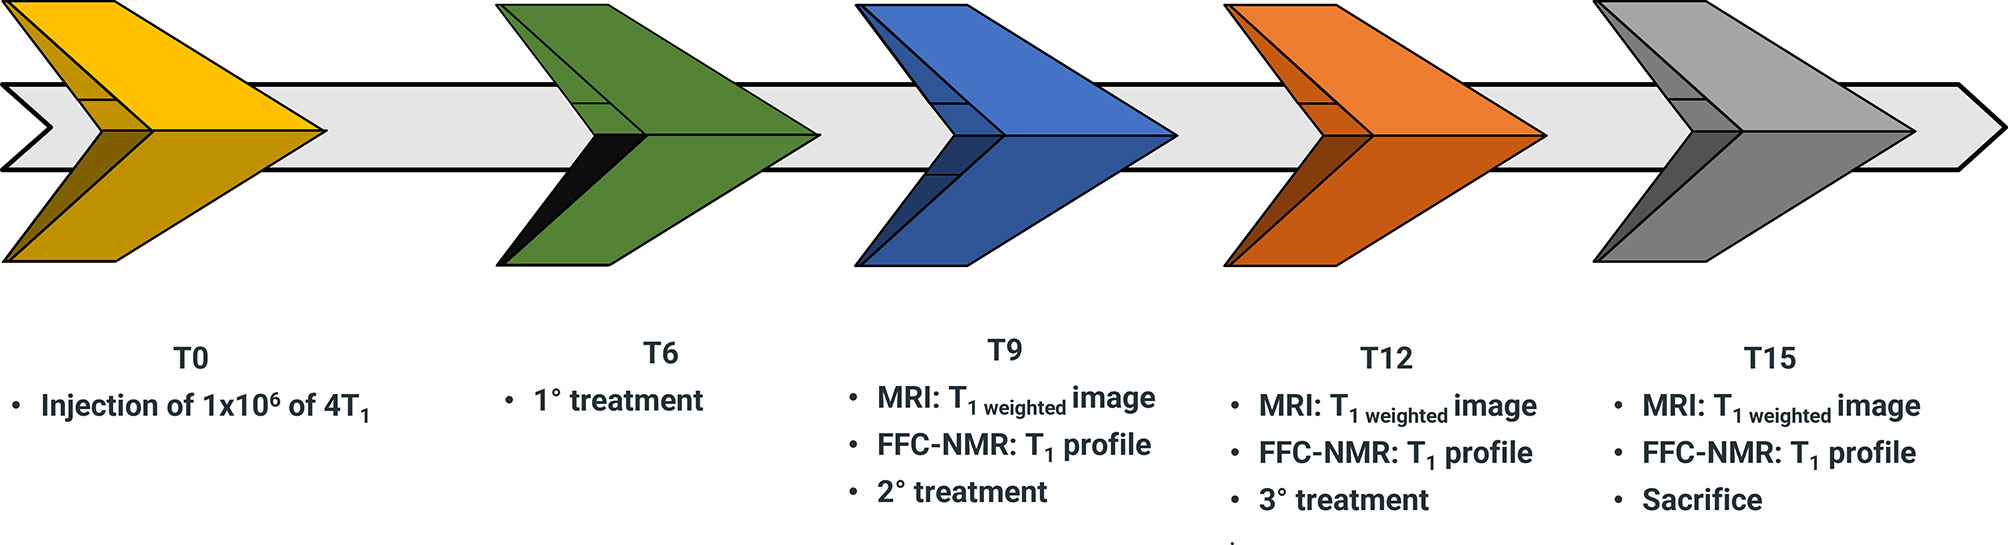
Figure 3 Schematic representation of the workflow for the assessment of doxorubicin treatment in 4T1 tumor animal models over a time course of 15 days (T0-T15).
4T1 cells (1x10⁶) were injected into the hind-limb muscle to obtain the corresponding tumor xenograft for the in-vivo acquisition of proton relaxation rates at low and variable magnetic fields. This was carried out using a FFC-relaxometer that was equipped with a wide bore magnet (40 mm diameter) that can host a small mouse. The position of the graft was dictated by the circular shape of the detection coil and its 11 mm diameter (10, 42). Due to the absence of spatial discrimination, the acquisitions were only carried out on mice bearing tumors with a volume > 60% of the total leg. Starting from the sixth day (T6 in the workflow sketch of Figure 3) from injection, mice (n= 7) were treated with 5 mg/kg of doxorubicin or with the vehicle (control mice n=7). The treatment was repeated twice more at three-day intervals. The relaxation profiles were acquired in the range 0.01-10 MHz three days after each treatment.
The acquisition of each 1/T1 1H-NMRD profile took about 20 minutes and the temperature of the mice was maintained using a gel pad heated at 37°C. Figure 4 shows a comparison of the relaxation profiles acquired in control (untreated tumor) and doxorubicin-treated mice. Even after the first treatment, a significant increase in the relaxation rate constants was observed for the treated mice (P-value at 0.01 MHz = 0.00779). The larger R1 values observed for the treated mice reflect the slower water exchange (corresponding to a smaller kio) between the intra- and extracellular compartments, as seen in the in-vitro experiments reported above. Here again, treatment with doxorubicin first resulted in a decrease of kio (due to damage induced in the transporting system) that, in turn, leads to an increase in the measured R1 values. The smaller R1 value of the largest intra-cellular compartment dominates the observed R1 in the presence of limited exchange between the two compartments. Interestingly, the effect of doxorubicin treatment was not detectable in T2-weighted MR images acquired at 1 T, as the tumor volume was not significantly different in the treated animals and controls (P > 0.05) (Figure 5A and Figure S3). This observation indicates that morphological changes need longer time to be detected thus hampering an early assessment of the therapeutic outcome.
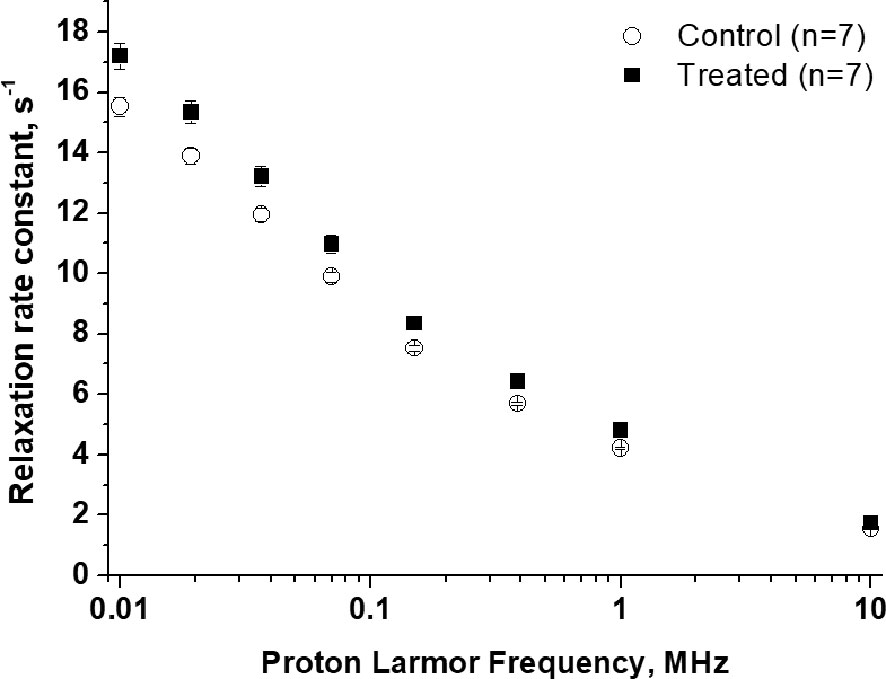
Figure 4 1/T1 1H-NMRD profiles of tumor-bearing mouse legs: treated animals (n=7), black square, compared to control animals (n=7), empty circle. Error bars represent the SE of the experimental data. (p value at 0.01 MHz = 0.0078).
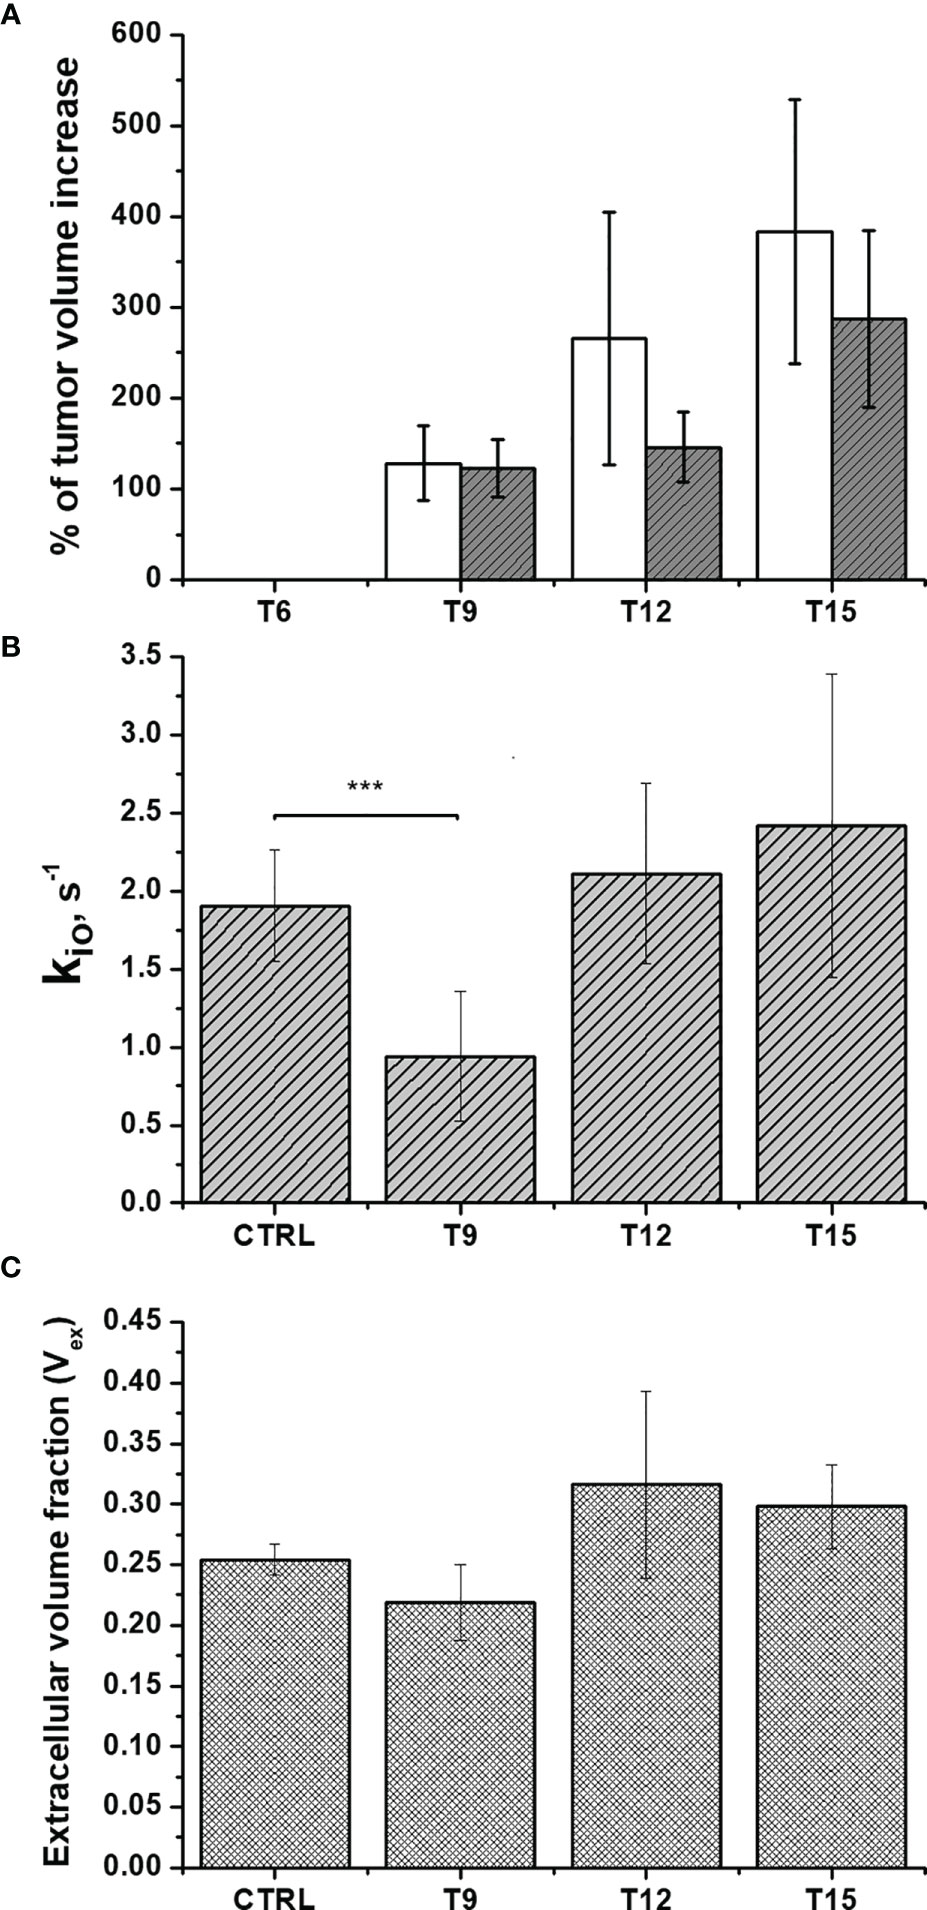
Figure 5 In-vivo assessment of doxorubicin treatment in Balb/c mice that bear 4T1 tumors: (A) The percentage of volume increase in the tumor region as determined by T2-weighted images acquired at 1 T using the ITK-SNAP software. Open and filled bars correspond to untreated and treated mice, respectively; (B) The cellular water efflux rate constant, kio (s-1) and (C) The extra-cellular volume fractions (Vex) were calculated via the analysis of the multi-relaxation rate measurements in the range 0.01-1MHz using the 2SX model for treated animals (n=8) compared to control animals (n=7). Error bars represent the SD of the experimental data. (***p ≤ 0.001).
It follows that, as reported previously (10, 11, 32), the differences in relaxation rate constants, observed at low magnetic fields, are related to the occurrence of different water exchange regimes between the intra and extra-cellular compartments in the tumor tissue. During the time of an NMR experiment (or in image acquisition), water molecules explore both compartments and the observed R1 results from a mixing of their relaxation rate constants (R1in and R1ex) weighted by their respective volume fractions (Vin and Vex). Unlike with high-field measurements, the in-vivo acquisition of a relaxation dispersion profile between 0.01-1 MHz allows us to work with differences in the intra- and extra-cellular relaxation rate constants (R1in and R1ex, respectively) that are large enough to make the magnetization decay directly dependent on kio (10, 32, 42). As demonstrated both in the cell suspensions and in-vivo experiments, kio appears to be a good biomarker of tumor-cell status that can be exploited to non-invasively monitor the early effects of doxorubicin treatment. Therefore, kio can be measured in vivo using multi-relaxation rate measurements in the range 0.01-1 MHz and the 2SX model [6,18], without the need to use paramagnetic contrast agents. Figure 5B shows that a significant decrease (P=0.000207) in kio was observed 3 days after the first treatment, providing an early indication of the effect of doxorubicin on cell metabolism and vitality.
As previously reported and herein confirmed in the Rb-uptake experiment, one of the important cytotoxic effects of this antitumor drug is its hampering of Na+/K+-ATPase activity. After the second and the third treatment, kio returns to the initial value. We think that this result reflects the massive death of tumor cells, which completely permeabilizes the cytosolic membrane to water. Accordingly, Figure 5C shows an initial decrease in Vex, as a consequence of the decreased kio, followed by an increase in Vex after the 2nd and 3rd treatments. The observed increase in Vex is, again, a direct consequence of the cell death caused by doxorubicin. Once the membrane of the dead cells becomes fully permeable to water, the corresponding volume occupied by these cells becomes part of the Vex compartment. These results are in good agreement with the histological apoptosis evaluation on the slices of tumors, that were recovered 3 days after the first treatment, using the TUNEL (terminal deoxynucleotidyl transferase-mediated deoxyuridine triphosphate nick‐end labeling) assay. Figure 6 shows that there are more apoptotic cells in the treated sample than in the control, suggesting that both kio and Vex may act as biomarkers for the toxic effect of doxorubicin, significantly earlier than the macroscopic observation associated to the morphological changes related to slower tumor growth. Finally, it is important to notice that in vivo kio magnitude is reduced by a factor of ~25, (Figure 5B) in respect to the in vitro values (Figures 1 and 2). There are many possible reasons to account for the observed behaviour. Cells within a tissue interact with neighbouring cells and with the extracellular matrix in a very different fashion in respect to what occurs in cellular pellets. This may result in significant modification of cell properties, size, morphology, elasticity, etc., i.e. properties that, in turn, may affect both passive and energetically driven components of water exchange across the cellular membrane. One may also expect that the high interstitial fluid pressure/flow and the low lymphatic drainage, in particular in the inner core of a solid tumor (43), may play a role in the translation from in vivo to in vitro studies. Likely the cells in culture take up more nutrients than in tissue and this would favour the view that the main determinant of the observed change relies on the increased metabolic activity of the tumour cells. Interestingly, upon comparing cell lines, characterized by different metabolic activities, it was found that the differences in kio observed in vivo in tumour tissues are maintained in vitro (10). Analogously, in this study, it was observed that the effect of doxorubicin treatment in vivo is maintained in the in vitro experiment
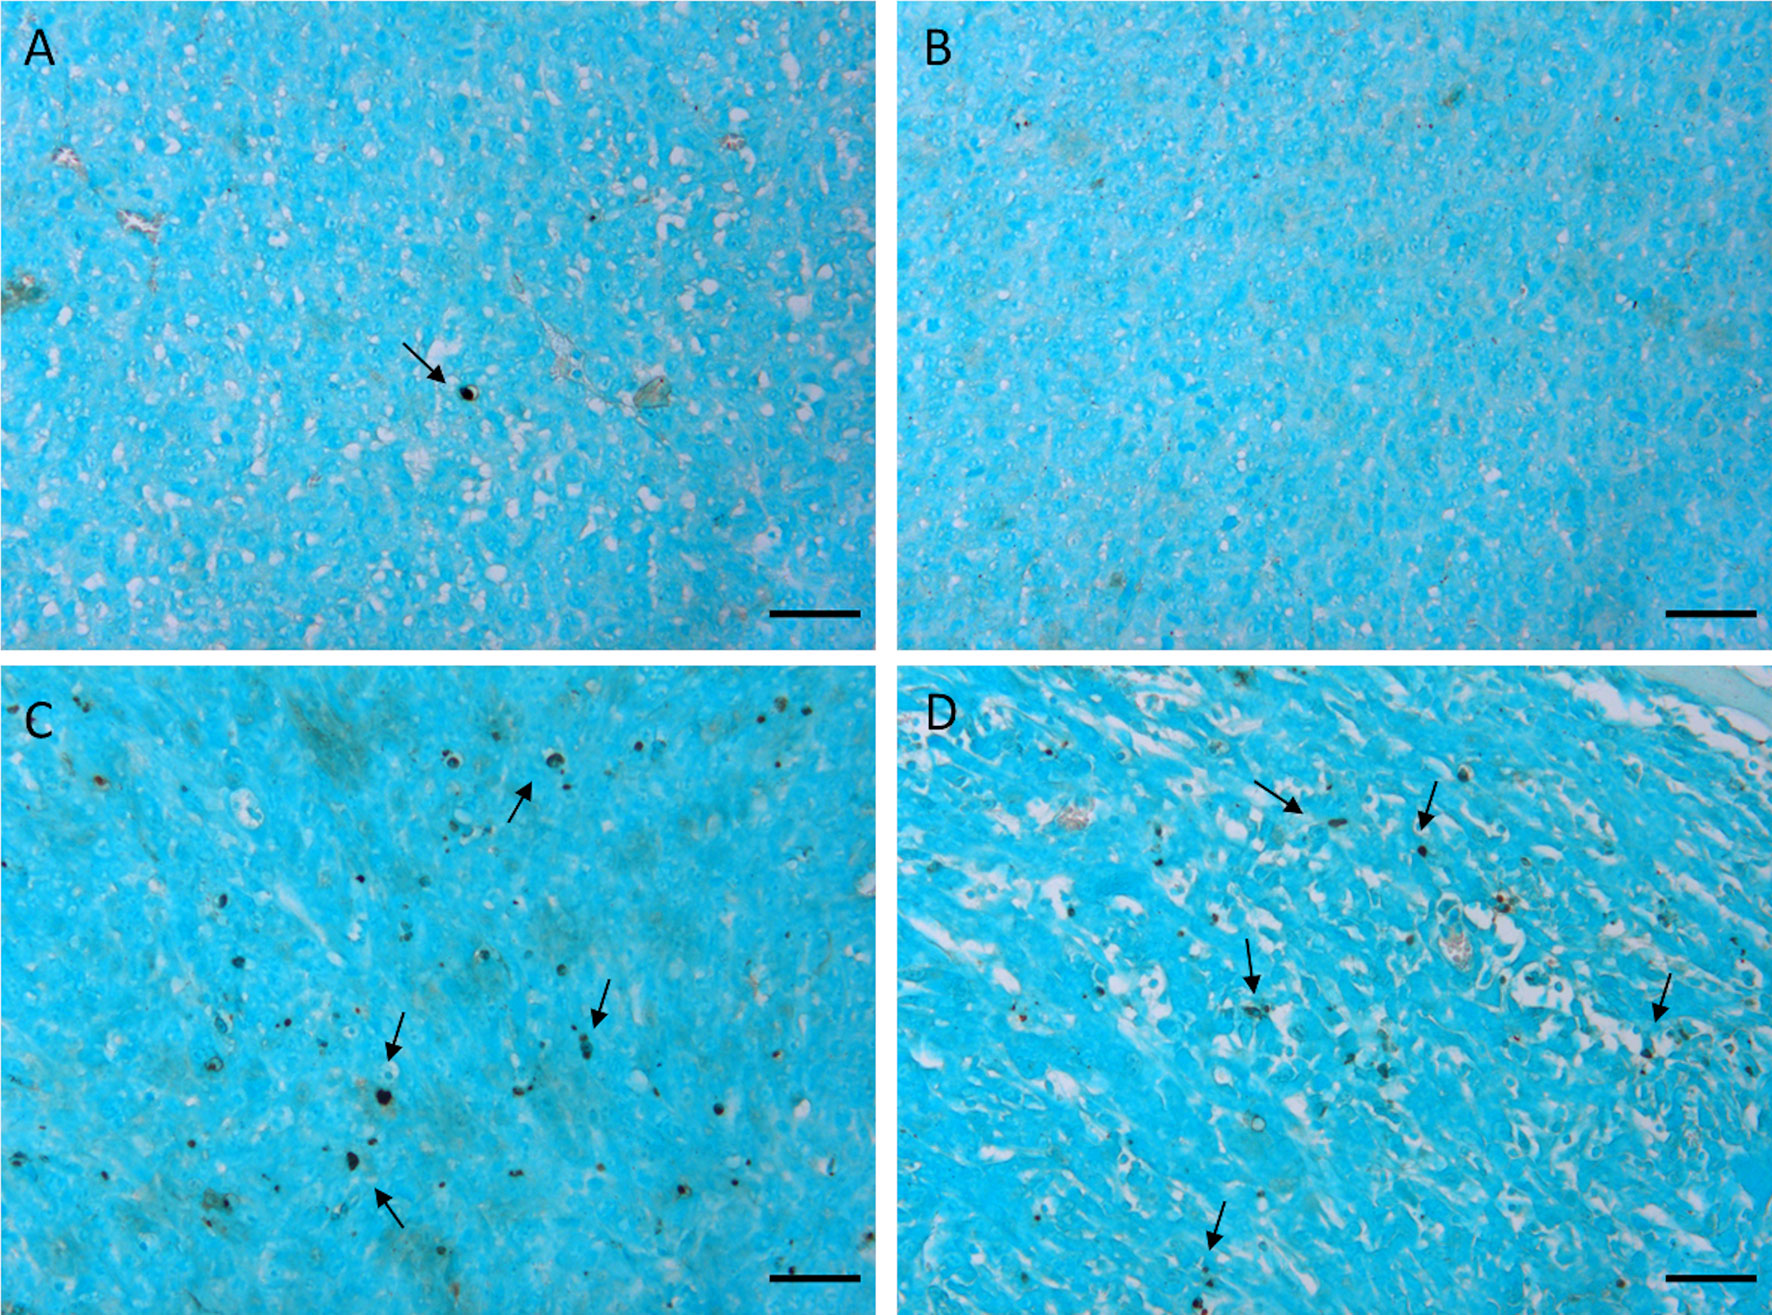
Figure 6 TUNEL staining of 4T1 tumors excised 3 days after the first treatment. Representative images of tumors treated with the vehicle (0.9% saline solution) (A, B) and with doxorubicin 5 mg/kg (C, D). Arrows indicate apoptotic nuclei. Cells were counterstained with methyl green. Scale bars= 50 µm”.
Conclusion
In summary, the results reported herein show that relaxometric measurements using FFC-NMR on tumor specimens can provide an important diagnostic contribution for the early assessment of the therapeutic effects associated with the application of doxorubicin. This method is based on the exploitation of the changes in the MR proton water signal that are induced by water exchange rate across the cellular membrane, causing a variation in Vex. It appears to act as a hallmark that can report on the status of the tumor and its response to treatment. The herein-reported results suggest that kio can be considered an early and predictive biomarker for the identification of responsive patients after the first treatment with doxorubicin. Even though FFC-NMR instrumentation is not endowed with spatial resolution, the knowledge obtained in this study can facilitate new diagnostic opportunities for the determination of therapeutic outcomes that would be possible with FFC MRI scanners. Two prototypes of human whole-body-sized FFC-MRI scanners have recently been built at Aberdeen University by Lurie and coworkers (44–46).
Data Availability Statement
The original contributions presented in the study are included in the article/Supplementary Material. Further inquiries can be directed to the corresponding author.
Ethics Statement
The animal treatment protocol was approved by the Italian Ministry of Health (authorization number 807/2017-PR).
Author Contributions
Conceptualization, MR, SB, VB, SA, and SGC. Methodology, MR and SGC. Validation, MR, SB, VB, and RR. Formal analysis, MR, SB, VB, and SGC. Investigation, MR, SB, VB, RR, and SR. Resources, SGC. Writing—original draft preparation, MR, SB, VB, SA, and SGC. Writing—review and editing, MR, SB, SA, and SGC. Visualization, MR, VB, and SB. Supervision, SGC. Project administration, SGC. Funding acquisition, SA and SGC. All authors have read and agreed to the published version of the manuscript.
Funding
This project has received funding from the European Union Horizon 2020 research and innovation program under grant agreement No 668119 (project IDentIFY). The Italian Ministry for Education and Research (MIUR) is gratefully acknowledged for yearly FOE funding to the EuroBioImaging Multi-Modal Molecular Imaging Italian Node (MMMI). Maria Rosaria Ruggiero was supported by a “FIRC-AIRC fellowship for Italy”.
Conflict of Interest
The authors declare that the research was conducted in the absence of any commercial or financial relationships that could be construed as a potential conflict of interest.
Publisher’s Note
All claims expressed in this article are solely those of the authors and do not necessarily represent those of their affiliated organizations, or those of the publisher, the editors and the reviewers. Any product that may be evaluated in this article, or claim that may be made by its manufacturer, is not guaranteed or endorsed by the publisher.
Acknowledgments
This work was performed in the frame of COST Action AC15209 (EURELAX). The authors thank Stefania Pezzana for the technical support in the development of the 4T1 resistant clone.
Supplementary Material
The Supplementary Material for this article can be found online at: https://www.frontiersin.org/articles/10.3389/fonc.2021.778823/full#supplementary-material
References
1. Massoud TF, Gambhir SS. Molecular Imaging in Living Subjects: Seeing Fundamental Biological Processes in a New Light. Genes Dev (2003) 17:545–80. doi: 10.1101/gad.1047403
2. Kim JH. Comparison of the EORTC Criteria and PERCIST in Solid Tumors: A Pooled Analysis and Review. Oncotarget (2016) 7:58105–10. doi: 10.18632/oncotarget.11171
3. Aykan NF, Özatlı T. Objective Response Rate Assessment in Oncology: Current Situation and Future Expectations. World J Clin Oncol (2020) 11:53–73. doi: 10.5306/wjco.v11.i2.53
4. Challapalli A, Aboagye EO. Positron Emission Tomography Imaging of Tumor Cell Metabolism and Application to Therapy Response Monitoring. Front Oncol (2016) 6:44–50. doi: 10.3389/fonc.2016.00044
5. Barca C, Wiesmann M, Calahorra J, Wachsmuth L, Döring C, Foray C, et al. Impact of Hydroxytyrosol on Stroke: Tracking Therapy Response on Neuroinflammation and Cerebrovascular Parameters Using PET-MR Imaging and on Functional Outcomes. Theranostics (2021) 11:4030–49. doi: 10.7150/thno.48110
6. Mervin LH, Mitricheva E, Logothetis NK, Bifone A, Bender A, Noori HR. Neurochemical Underpinning of Hemodynamic Response to Neuropsychiatric Drugs: A Meta- and Cluster Analysis of Preclinical Studies. J Cereb Blood Flow Metab (2021) 41:874–85. doi: 10.1177/0271678X20916003
7. Ntziachristos V, Pleitez MA, Aime S, Brindle KM. Emerging Technologies to Image Tissue Metabolism. Cell Metab (2019) 29:518–38. doi: 10.1016/j.cmet.2018.09.004
8. Terreno E, Dastru W, Delli Castelli D, Gianolio E, Geninatti Crich S, Longo D, et al. Advances in Metal-Based Probes for MR Molecular Imaging Applications. Curr Med Chem (2010) 17:3684–700. doi: 10.2174/092986710793213823
9. Leithner D, Wengert GJ, Helbich TH, Thakur S, Ochoa-Albiztegui RE, Morris EA, et al. Clinical Role of Breast MRI Now and Going Forward. Clin Radiol (2018) 73:700–14. doi: 10.1016/j.crad.2017.10.021
10. Ruggiero MR, Baroni S, Pezzana S, Ferrante G, Geninatti Crich S, Aime S. Evidence for the Role of Intracellular Water Lifetime as a Tumour Biomarker Obtained by In Vivo Field-Cycling Relaxometry. Angew Chemie - Int Ed (2018) 57:7468–72. doi: 10.1002/anie.201713318
11. Ruggiero MR, Baroni S, Aime S, Crich SG. Relaxometric Investigations Addressing the Determination of Intracellular Water Lifetime: A Novel Tumour Biomarker of General Applicability. Mol Phys (2019) 117:968–74. doi: 10.1080/00268976.2018.1527045
12. Koenig SH. Molecular Basis of Magnetic Relaxation of Water Protons of Tissue. Acad Radiol (1996) 3:597–606. doi: 10.1016/S1076-6332(96)80225-X
13. Masiewicz E, Ashcroft GP, Boddie D, Dundas SR, Kruk D, Broche LM. Towards Applying NMR Relaxometry as a Diagnostic Tool for Bone and Soft Tissue Sarcomas: A Pilot Study. Sci Rep (2020) 10:14207. doi: 10.1038/s41598-020-71067-x
14. Diakova G, Korb J-P, Bryant RG. The Magnetic Field Dependence of Water T 1 in Tissues. Magn Reson Med (2012) 68:272–7. doi: 10.1002/mrm.23229
15. Araya YT, Martínez-Santiesteban F, Handler WB, Harris CT, Chronik BA, Scholl TJ. Nuclear Magnetic Relaxation Dispersion of Murine Tissue for Development of T 1 ( R 1 ) Dispersion Contrast Imaging. NMR BioMed (2017) 30:e3789. doi: 10.1002/nbm.3789
16. Steele RM, Korb JP, Ferrante G, Bubici S. New Applications and Perspectives of Fast Field Cycling NMR Relaxometry. Magn Reson Chem (2016) 54:502–9. doi: 10.1002/mrc.4220
17. Springer CS, Li X, Tudorica LA, Oh KY, Roy N, Chui SY, et al. Intratumor Mapping of Intracellular Water Lifetime: Metabolic Images of Breast Cancer? NMR BioMed (2014) 27:760–73. doi: 10.1002/nbm.3111
18. Landis CS, Li X, Telang FW, Molina PE, Palyka I, Vetek G, et al. Equilibrium Transcytolemmal Water-Exchange Kinetics in Skeletal Muscle. vivo Magn Reson Med (1999) 42:467–78. doi: 10.1002/(SICI)1522-2594(199909)42:3<467::AID-MRM9>3.0.CO;2-0
19. Li X, Huang W, Morris EA, Tudorica LA, Seshan VE, Rooney WD, et al. Dynamic NMR Effects in Breast Cancer Dynamic-Contrast-Enhanced MRI. Proc Natl Acad Sci (2008) 105:17937–42. doi: 10.1073/pnas.0804224105
20. Li X, Mangia S, Lee J, Bai R, Springer CS. NMR Shutter-Speed Elucidates Apparent Population Inversion of 1 H 2 O Signals Due to Active Transmembrane Water Cycling. Magn Reson Med (2019) 82:411–24. doi: 10.1002/mrm.27725
21. Thorn CF, Oshiro C, Marsh S, Hernandez-Boussard T, McLeod H, Klein TE, et al. Doxorubicin Pathways. Pharmacogenet Genomics (2011) 21:440–6. doi: 10.1097/FPC.0b013e32833ffb56
22. Rong Y, Yuan CH, Qu Z, Zhou H, Guan Q, Yang N, et al. Doxorubicin Resistant Cancer Cells Activate Myeloid-Derived Suppressor Cells by Releasing PGE2. Sci Rep (2016) 6:1–11. doi: 10.1038/srep23824
23. Sloval ML, Dalton WS, Trent JM, Hoeltge GA. Pharmacological and Biological Evidence for Differing Mechanisms of Doxorubicin Resistance in Two Human Tumor Cell Lines. Cancer Res (1988) 48:2793–7.
24. Mechetner E, Kyshtoobayeva A, Zonis S, Kim H, Stroup R, Garcia R, et al. Levels of Multidrug Resistance (MDR1) P-Glycoprotein Expression by Human Breast Cancer Correlate With In Vitro Resistance to Taxol and Doxorubicin. Clin Cancer Res (1998) 4:389–98.
25. Bao L, Haque A, Jackson K, Hazari S, Moroz K, Jetly R, et al. Increased Expression of P-Glycoprotein Is Associated With Doxorubicin Chemoresistance in the Metastatic 4t1 Breast Cancer Model. Am J Pathol (2011) 178:838–52. doi: 10.1016/j.ajpath.2010.10.029
26. Di X, Gennings C, Bear HD, Graham LJ, Sheth CM, White KL, et al. Influence of the Phosphodiesterase-5 Inhibitor, Sildenafil, on Sensitivity to Chemotherapy in Breast Tumor Cells. Breast Cancer Res Treat (2010) 124:349–60. doi: 10.1007/s10549-010-0765-7
27. Akbaribazm M, Khazaei MR, Khazaei M. Trifolium Pratense L. (Red Clover) Extract and Doxorubicin Synergistically Inhibits Proliferation of 4T1 Breast Cancer in Tumor-Bearing BALB/c Mice Through Modulation of Apoptosis and Increase Antioxidant and Anti-Inflammatory Related Pathways. Food Sci Nutr (2020) 8:4276–90. doi: 10.1002/fsn3.1724
28. Hafizi M, Soleimani M, Noorian S, Kalanaky S, Fakharzadeh S, Saleh NT, et al. Effects of BCc1 Nanoparticle and its Mixture With Doxorubicin on Survival of Murine 4T1 Tumor Model. Onco Targets Ther (2019) 12:4691–701. doi: 10.2147/OTT.S200446
29. Barnes SL, Sorace AG, Loveless ME, Whisenant JG, Yankeelov TE. Correlation of Tumor Characteristics Derived From DCE-MRI and DW-MRI With Histology in Murine Models of Breast Cancer. NMR BioMed (2015) 28:1345–56. doi: 10.1002/nbm.3377
30. Panagiotaki E, Walker-Samuel S, Siow B, Johnson SP, Rajkumar V, Pedley RB, et al. Noninvasive Quantification of Solid Tumor Microstructure Using VERDICT MRI. Cancer Res (2014) 74:1902–12. doi: 10.1158/0008-5472.CAN-13-2511
31. Gage GJ, Kipke DR, Shain W. Whole Animal Perfusion Fixation for Rodents. J Vis Exp (2012) 65:3564. doi: 10.3791/3564
32. Baroni S, Ruggiero MR, Aime S, Geninatti Crich S. Exploring the Tumour Extracellular Matrix by In Vivo Fast Field Cycling Relaxometry After the Administration of a Gadolinium-Based MRI Contrast Agent. Magn Reson Chem (2019) 57:845–51. doi: 10.1002/mrc.4837
33. Springer CS. Using 1h2o MR to Measure and Map Sodium Pump Activity. vivo J Magn Reson (2018) 291:110–26. doi: 10.1016/j.jmr.2018.02.018
34. Bai R, Springer CS, Plenz D, Basser PJ. Fast, Na + /K + Pump Driven, Steady-State Transcytolemmal Water Exchange in Neuronal Tissue: A Study of Rat Brain Cortical Cultures. Magn Reson Med (2018) 79:3207–17. doi: 10.1002/mrm.26980
35. Pérez-Blanco JS, Santos-Buelga D, Fernández de Gatta M del M, Hernández-Rivas JM, Martín A, García MJ. Population Pharmacokinetics of Doxorubicin and Doxorubicinol in Patients Diagnosed With non-Hodgkin’s Lymphoma. Br J Clin Pharmacol (2016) 82:1517–27. doi: 10.1111/bcp.13070
36. Speth PAJ, van Hoesel QGCM, Haanen C. Clinical Pharmacokinetics of Doxorubicin. Clin Pharmacokinet (1988) 15:15–31. doi: 10.2165/00003088-198815010-00002
37. Boucek RJ, Olson RD, Brenner DE, Ogunbunmi EM, Inui M, Fleischer S. The Major Metabolite of Doxorubicin is a Potent Inhibitor of Membrane-Associated Ion Pumps. A Correlative Study of Cardiac Muscle With Isolated Membrane Fractions. J Biol Chem (1987) 262:15851–6. doi: 10.1016/S0021-9258(18)47666-1
38. Figueroa JAL, Stiner CA, Radzyukevich TL, Heiny JA. Metal Ion Transport Quantified by ICP-MS in Intact Cells. Sci Rep (2016) 6:20551. doi: 10.1038/srep20551
39. Hakimjavadi H, Stiner C, Radzyukevich T, Lingrel J, Norman N, Landero Figueroa J, et al. K+ and Rb+ Affinities of the Na,K-ATPase α1 and α2 Isozymes: An Application of ICP-MS for Quantification of Na+ Pump Kinetics in Myofibers. Int J Mol Sci (2018) 19:2725. doi: 10.3390/ijms19092725
40. Pröfrock D, Prange A. Inductively Coupled Plasma–Mass Spectrometry (ICP-MS) for Quantitative Analysis in Environmental and Life Sciences: A Review of Challenges, Solutions, and Trends. Appl Spectrosc (2012) 66:843–68. doi: 10.1366/12-06681
41. Abolhoda A, Wilson AE, Ross H, DP V, Burt M, Scotto KW. Rapid Activation of MDR1 Gene Expression in Human Metastatic Sarcoma After In Vivo Exposure to Doxorubicin. Clin Cancer Res an Off J Am Assoc Cancer Res (1999) 5:3352–6.
42. Baroni S, Ruggiero MR, Bitonto V, Broche LM, Lurie DJ, Aime S, et al. In Vivo Assessment of Tumour Associated Macrophages in Murine Melanoma Obtained by Low-Field Relaxometry in the Presence of Iron Oxide Particles. Biomaterials (2020) 236:119805. doi: 10.1016/j.biomaterials.2020.119805
43. Liu LJ, Brown SL, Ewing JR, Ala BD, Schneider KM, Schlesinger M. Estimation of Tumor Interstitial Fluid Pressure (TIFP) Noninvasively. PloS One (2016) 11:e0140892. doi: 10.1371/JOURNAL.PONE.0140892
44. Broche LM, Ross PJ, Davies GR, MacLeod MJ, Lurie DJ. A Whole-Body Fast Field-Cycling Scanner for Clinical Molecular Imaging Studies. Sci Rep (2019) 9:1–11. doi: 10.1038/s41598-019-46648-0
45. Ross PJ, Broche LM, Lurie DJ. Rapid Field-Cycling MRI Using Fast Spin-Echo. Magn Reson Med (2015) 73:1120–4. doi: 10.1002/mrm.25233
Keywords: NMR relaxometry, theranostics, doxorubicin, magnetic resonance imaging, cellular water efflux rate constant
Citation: Ruggiero MR, Baroni S, Bitonto V, Ruiu R, Rapisarda S, Aime S and Geninatti Crich S (2021) Intracellular Water Lifetime as a Tumor Biomarker to Monitor Doxorubicin Treatment via FFC-Relaxometry in a Breast Cancer Model. Front. Oncol. 11:778823. doi: 10.3389/fonc.2021.778823
Received: 20 September 2021; Accepted: 18 November 2021;
Published: 03 December 2021.
Edited by:
Chris Albanese, Georgetown University, United StatesReviewed by:
Charles Springer, Oregon Health and Science University, United StatesFang Wang, The First Affiliated Hospital of Nanchang University, China
Copyright © 2021 Ruggiero, Baroni, Bitonto, Ruiu, Rapisarda, Aime and Geninatti Crich. This is an open-access article distributed under the terms of the Creative Commons Attribution License (CC BY). The use, distribution or reproduction in other forums is permitted, provided the original author(s) and the copyright owner(s) are credited and that the original publication in this journal is cited, in accordance with accepted academic practice. No use, distribution or reproduction is permitted which does not comply with these terms.
*Correspondence: Simonetta Geninatti Crich, c2ltb25ldHRhLmdlbmluYXR0aUB1bml0by5pdA==