
94% of researchers rate our articles as excellent or good
Learn more about the work of our research integrity team to safeguard the quality of each article we publish.
Find out more
ORIGINAL RESEARCH article
Front. Oncol., 09 December 2021
Sec. Cancer Imaging and Image-directed Interventions
Volume 11 - 2021 | https://doi.org/10.3389/fonc.2021.774413
This article is part of the Research TopicAno-rectal and Gastro-esophageal Cancer: Diving into Diagnostic and Therapeutic Imaging Modalities for RadiotherapyView all 10 articles
 Carmela Di Dio1
 Giuditta Chiloiro2
 Davide Cusumano1,2*Francesco Catucci1
 Luca Boldrini2
 Angela Romano2Elisa Meldolesi2Fabio Marazzi2Barbara Corvari2Brunella Barbaro2Riccardo Manfredi2
 Vincenzo Valentini 2and
  Maria Antonietta Gambacorta2
Introduction: The aim of this study was to create a radiomic model able to calculate the probability of 5-year disease-free survival (5yDFS) when oxaliplatin (OXA) is or not administered in patients with locally advanced rectal cancer (LARC) and treated with neoadjuvant chemoradiotherapy (nCRT), allowing physicians to choose the best chemotherapy (CT) regimen.
Methods: LARC patients with cT3–4 cN0 or cT1–4 cN1–2 were treated according to an nCRT protocol that included concomitant CT schedules with or without OXA and radiotherapy dose of 55 Gy in 25 fractions. Radiomic analysis was performed on the T2-weighted (T2-w) MR images acquired during the initial tumor staging. Statistical analysis was performed separately for the cohort of patients treated with and without OXA. The ability of every single radiomic feature in predicting 5yDFS as a univariate analysis was assessed using the Wilcoxon–Mann–Whitney (WMW) test or t-test. Two logistic models (one for each cohort) were calculated, and their performance was assessed using the area under the receiver operating characteristic (ROC) curve (AUC).
Results: A total of 176 image features belonging to four families (morphological, statistical, textural, and fractal) were calculated for each patient. At the univariate analysis, the only feature showing significance in predicting 5yDFS was the maximum fractal dimension of the subpopulation identified considering 30% and 50% as threshold levels (maxFD30–50). Once the models were developed using this feature, an AUC of 0.67 (0.57–0.77) and 0.75 (0.56–0.95) was obtained for patients treated with and without OXA, respectively. A maxFD30–50 >1.6 was correlated to a higher 5yDFS probability in patients treated with OXA.
Conclusion: This study suggests that radiomic analysis of MR T2-w images can be used to define the optimal concomitant CT regimen for stage III LARC cancer patients. In particular, by providing an indication of the gross tumor volume (GTV) spatial heterogeneity at initial staging, maxFD30–50 seems to be able to predict the probability of 5yDFS. New studies including a larger cohort of patients and external validation sets are recommended to verify the results of this hypothesis-generating study.
Colorectal cancer is one of the most widespread cancer diseases in the world, causing the death of thousands of people each year, as recently estimated in the latest epidemiological studies (1, 2).
The standard treatment for locally advanced rectal cancer (LARC) consists of neoadjuvant chemoradiotherapy (nCRT) followed by surgery (1, 3).
Recent experiences demonstrated that local control (LC) can be improved by the combination of nCRT and surgery, but no significant benefit has been observed in terms of disease-free (DFS) and overall survival (OS) (4). Furthermore, it has been observed that the 25% of patients develop metastases within 5 years after the end of the surgery, mainly located in the liver (5).
In this context, the intensification of nCRT could be a valid strategy. In recent years, several studies have been conducted to evaluate the efficacy of adding oxaliplatin to nCRT; however, the benefit of oxaliplatin-based nCRT in stage II or III rectal cancer remains unclear. Several randomized trials investigated the effect of oxaliplatin-based nCRT: efficacy data are controversial, and the addition of oxaliplatin often resulted in increased acute toxicity (6–11). For this reason, the role of oxaliplatin is still a matter of debate, especially in patients with stage III rectal cancer.
Radiomics is playing a primary role in proposing new image-based markers that can predict surrogate endpoints of survival outcomes such as pathological complete response (pCR) or DFS in order to personalize neoadjuvant treatment (12–14). These predictors are generally based on MR image analysis, as it is the gold standard for diagnosis and staging of rectal cancer (12, 15, 16).
First experiences proposing radiomic models able to predict different outcomes, such as OS or metastasis-free survival, have recently been reported in the literature (17, 18).
Although the potential of radiomics in extracting prognostic factors from image analysis is now widely accepted by the scientific community, to the best of our knowledge, there are no predictive models in the literature that support the oncologist in deciding which drug to prescribe for neoadjuvant treatment.
In this experience, we want to explore the potential of radiomics in drug personalization, proposing an MRI-based indicator able to predict the DFS probability at 5 years after the end of treatment (5yDFS) with a high level of accuracy in two cohorts of patients (one in which oxaliplatin was administered and one in which it was not administered).
In particular, the final goal of this hypothesis-generating study is to obtain a model that can calculate the probability of 5yDFS for both oxaliplatin administration and non-administration, allowing clinicians to choose the best chemotherapy (CT) regimen based on the highest probability of 5yDFS.
Patients enrolled in this retrospective study were affected by locally advanced rectal adenocarcinoma, with cT3–4 cN0 or cT1–4 cN1–2 or with mesorectal fascia involvement (MRF+), according to the American Joint Committee on Cancer (AJCC) TNM (19).
Treatments were delivered from May 2008 to June 2015 at Fondazione Policlinico Universitario Agostino Gemelli IRCCS in Rome. Ethics committee approval was obtained for this study, and all patients gave signed informed consent to be enrolled. At the time of diagnosis, patients had to be older than 18 years with pathologically confirmed rectal adenocarcinoma; cases with mucinous variants were excluded from the study.
All selected LARC patients received nCRT followed by surgery. Patients with missing treatment information, with metastatic disease at diagnosis, and alive patients without evidence of local or distant recurrence with a follow-up time less than 5 years were excluded.
MRI safety screening forms were administered to all patients: those who showed clinical contraindications to MRI or denied specific consent were considered not eligible for the study. Clinical and radiological follow-up was performed for all the patients for a period of at least 5 years after surgery.
For tumor staging, MRI acquisition was performed using a 1.5-T scanner (Signa Excite, GE Medical Systems, Milwaukee, WI, USA) in the supine position. The MRI protocol consisted of four T2-weighted fast spin-echo (FSE) MR sequences (axial, coronal, sagittal, and volumetric) and one diffusion-weighted imaging (DWI) acquisition obtained using b values of 0 and 1,000 s/mm2. No intravenous contrast agents were administered.
Radiotherapy (RT) treatment was delivered in 25 fractions, following a simultaneous integrated boost (SIB) technique with 55 Gy in fractions of 2.2 Gy/die to gross tumor volume (GTV) and corresponding mesorectum and 45 Gy in fractions of 1.8 Gy/die to selected lymph nodes according to the clinical disease (20). Neoadjuvant CT was administered according to two regimens based on initial clinical stage and patient compliance:
i. OXA-based regimen: CapOx (60 mg/m2 of i.v. oxaliplatin at the first day plus 1,300 mg/die/mq of oral chronomodulated capecitabine 1,650 mg/mq/die, during RT q7) or Xelox (oxaliplatin 130 mg/mq q 1, 19, and 38 plus oral chronomodulated capecitabine 1,300 mg/mq/die during RT).
ii. No-OXA-based regimen: 5-fluorouracil in continuous infusion (225 mg/mq/die during RT) or oral chronomodulated capecitabine (1,650 mg/mq/die during RT).
At 6 to 10 weeks after the end of nCRT, patients underwent clinical restaging, consisting of a restaging MRI and digital rectal examination. Surgery was performed 8 to 12 weeks after the end of nCRT and consisted of abdominal-perineal resection, anterior resection, or transanal endoscopic microsurgery, depending on the residual disease and surgical evaluation.
The postoperative histopathological specimen was classified following the tumor regression grading (TRG) according to the Mandard classification (21).
Adjuvant CT was administered for selected patients in relation to clinical and pathological stages and high-risk factors such as tumor lymph vascular invasion and TRG4.
Radiomic analysis was performed on the T2-weighted FSE MR images acquired in a transverse plane orthogonal to the tumor longitudinal axis during initial disease staging (22). The MR images subject to radiomic analysis were those acquired during the initial tumor staging.
Such images had a spatial resolution of 0.8 × 0.8 mm2 and a slice thickness of 3 mm, with no intersection gap between the slices. Repetition time ranged from 2,500 to 5,000 ms, inversion time from 100 to 110 ms, and echo train length from 16 to 24.
The Dicom files containing the MR images were imported into an RT delineation console (Eclipse, Varian Medical System™, Palo Alto, CA, USA) where a radiologist in cooperation with a radiation oncologist experienced in rectal cancer diagnosis and treatment delineated the GTV, following the ICRU n.83 guidelines (23).
Delineations were blinded between the two experts, and a final consensus was discussed and obtained with a shared delineation in case of disagreement. Dicom files containing MR images and contours were exported and processed using Moddicom, an R package (R Core Team, Vienna, Austria) designed to perform radiomic analysis of biomedical images (24, 25).
Two image filters were applied to the original MR images before extracting radiomic features: the Laplacian of Gaussian (LoG) filter with a kernel size dimension of 0.4 mm and the intensity-based (IB) image filter, with a step of 20%: additional information about the use of these filters can be found in (26, 27).
Radiomic analysis led to the extraction of four feature families: morphological features were extracted from the raw images, statistical and textural features were extracted from the MR images preprocessed using the LOG filter, fractal features were extracted from the images processed with the IB filter (27, 28). A diagrammatic representation of the whole radiomic process is reported in Figure 1.
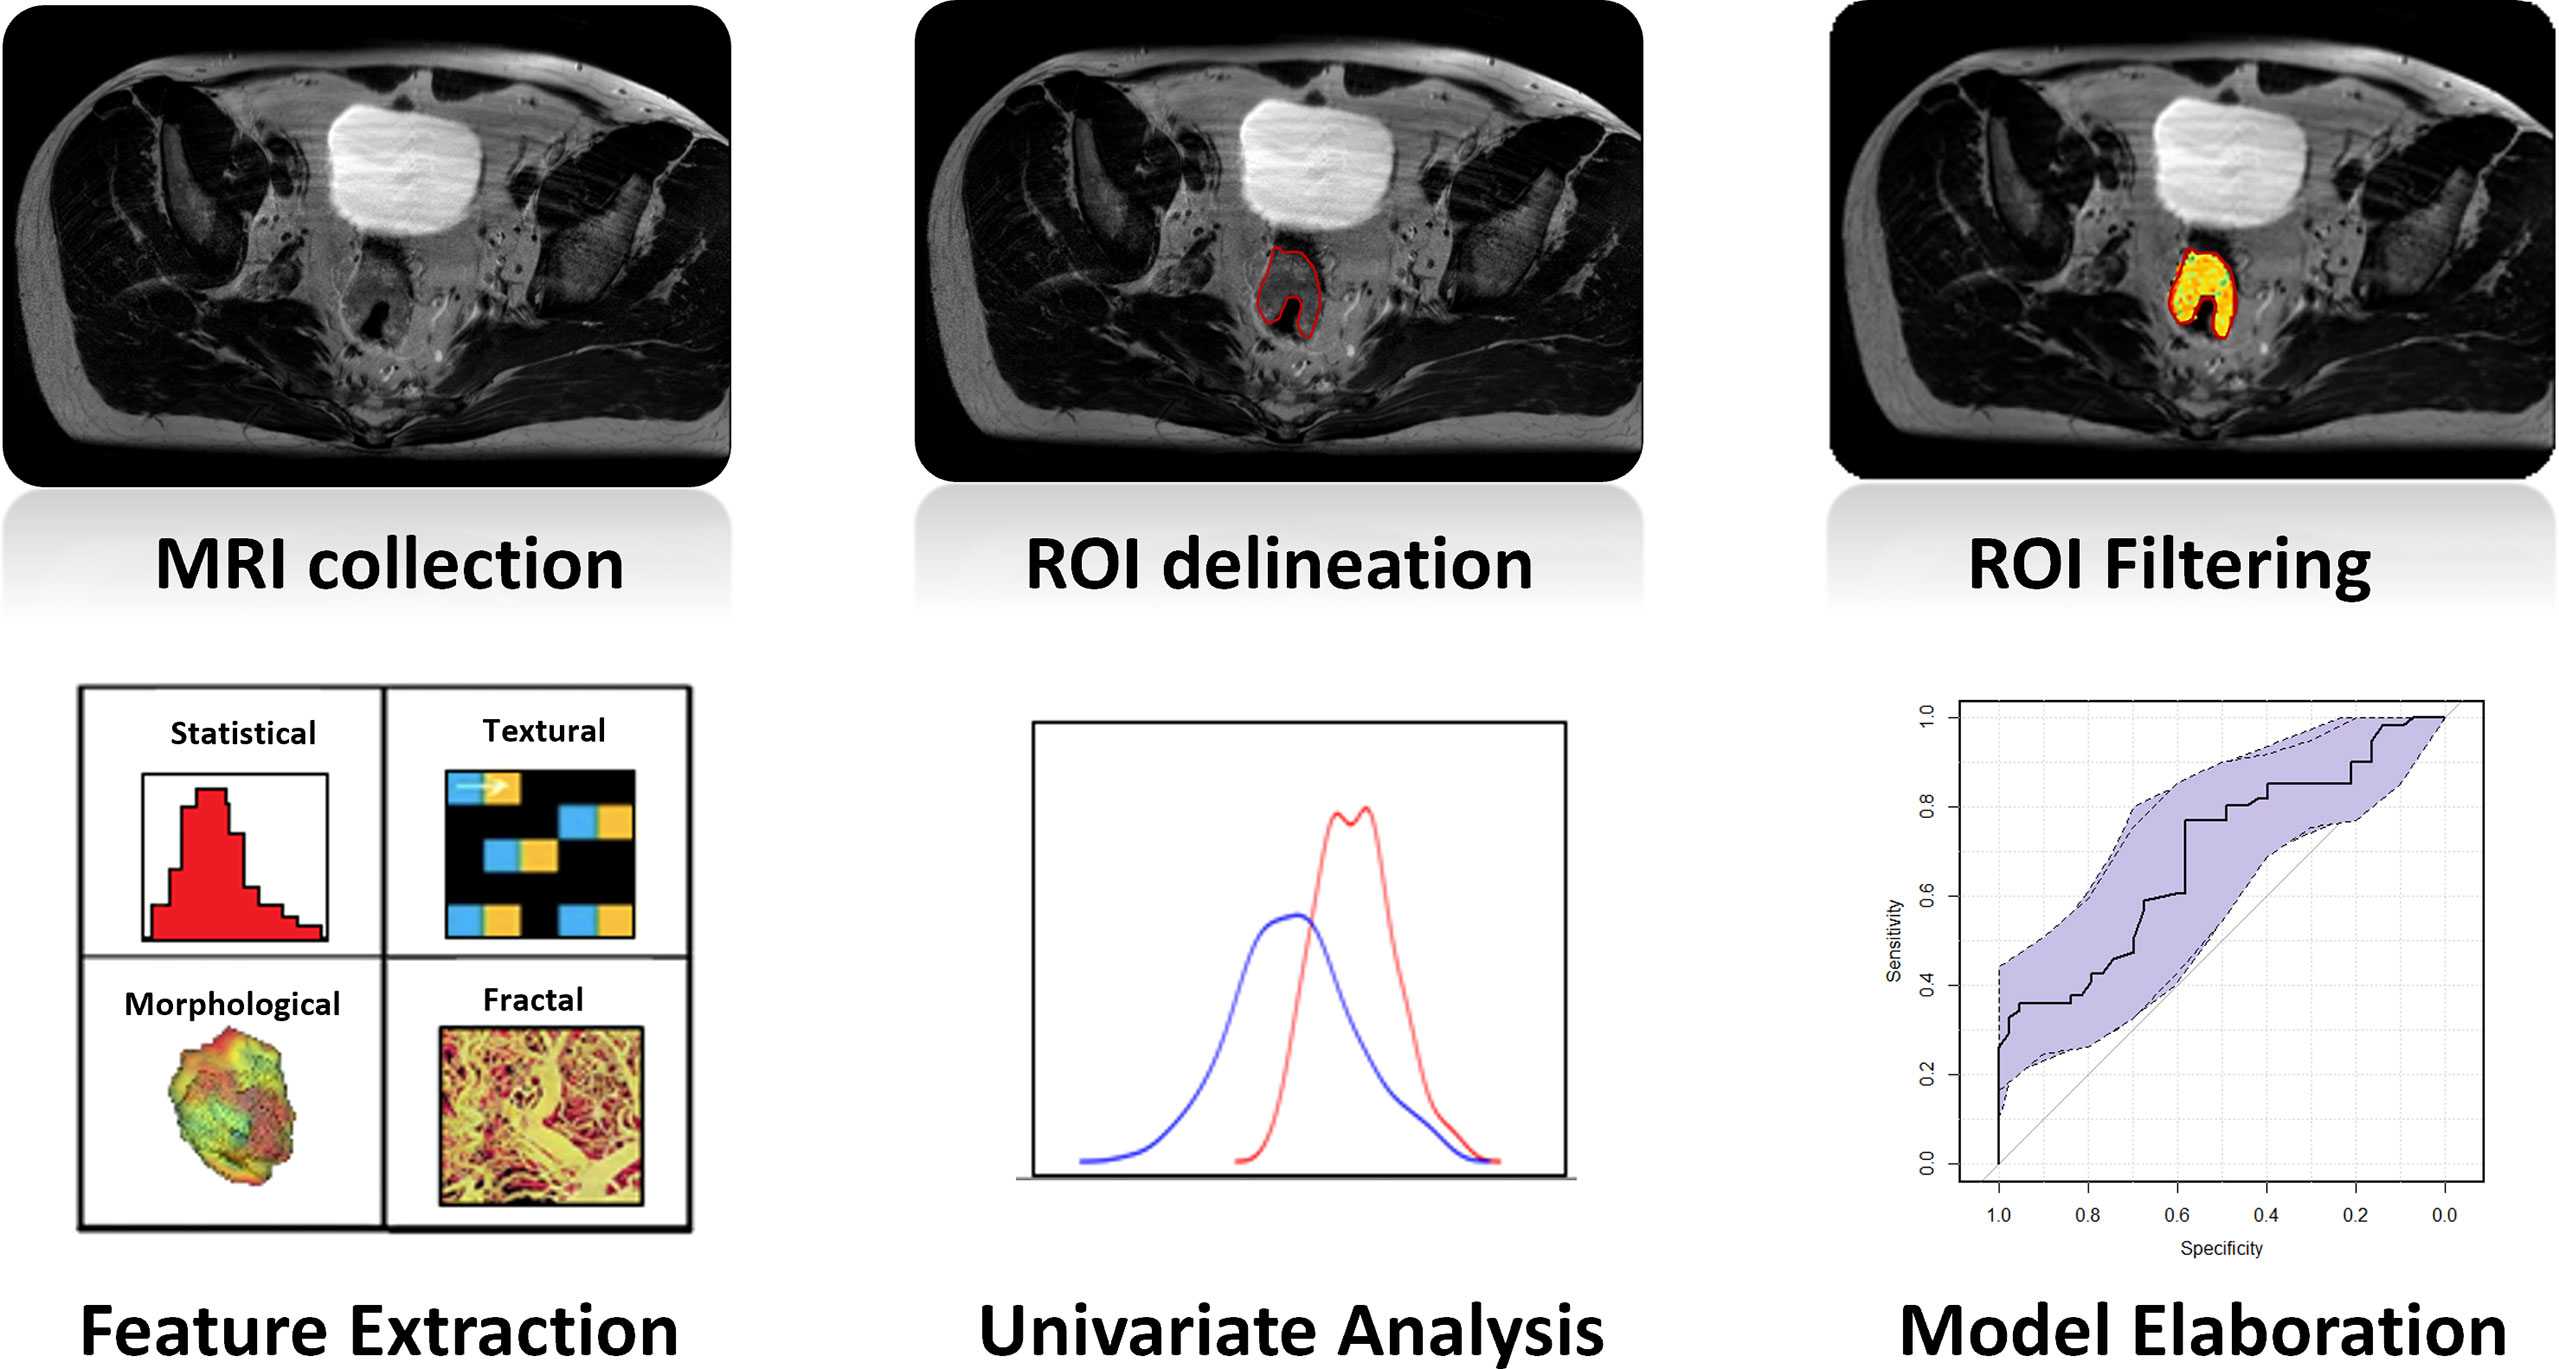
Figure 1 Diagrammatic representation of the whole radiomic process: once MR images were collected, GTV was delineated on each MRI. Images were filtered, and four types of radiomic features (statistical, textural, morphological, and fractal) were extracted. The ability of every single feature in predicting the outcome was evaluated in terms of the Wilcoxon–Mann–Whitney test, and a logistic regression was calculated considering the most significant feature. The last two steps were repeated separately for the two cohorts of patients of the study (OXA and no-OXA). GTV, gross tumor volume; OXA, oxaliplatin.
As regards the textural features, three gray-level matrices were considered: run length (rlm), co-occurrence (cm), and size zone (szm) matrices. The complete list of the radiomic features extracted is reported in the Supplementary Materials, with similar experiences dealing with this topic (15, 29).
Fractal features were instead calculated on the images preprocessed using the IB filter, which consists in normalizing the pixel values within GTV using the first and 99th percentiles of the gray-level GTV histogram as extremes and then identifying pixel clusters based on different threshold levels defined as the percentage of the maximum intensity (27, 30).
Once the images were processed, fractal dimension (FD) was calculated slice by slice using the Box counting algorithm, and minimum, maximum, median, and mean values were calculated and considered as fractal features (27).
Statistical analysis was performed separately for the cohort of patients treated with (OXA-based) and without oxaliplatin (no-OXA-based), considering that the DFS reached 5 years from the date of surgery (5yDFS) as a dichotomic outcome.
Figure 2 reports the number of patients showing metastases or tumor recurrence as a function of the years from the date of surgery: the time of 5 years was chosen as the optimal cutoff between the number of events that occurred and the number of patients with valid follow-up at that time.
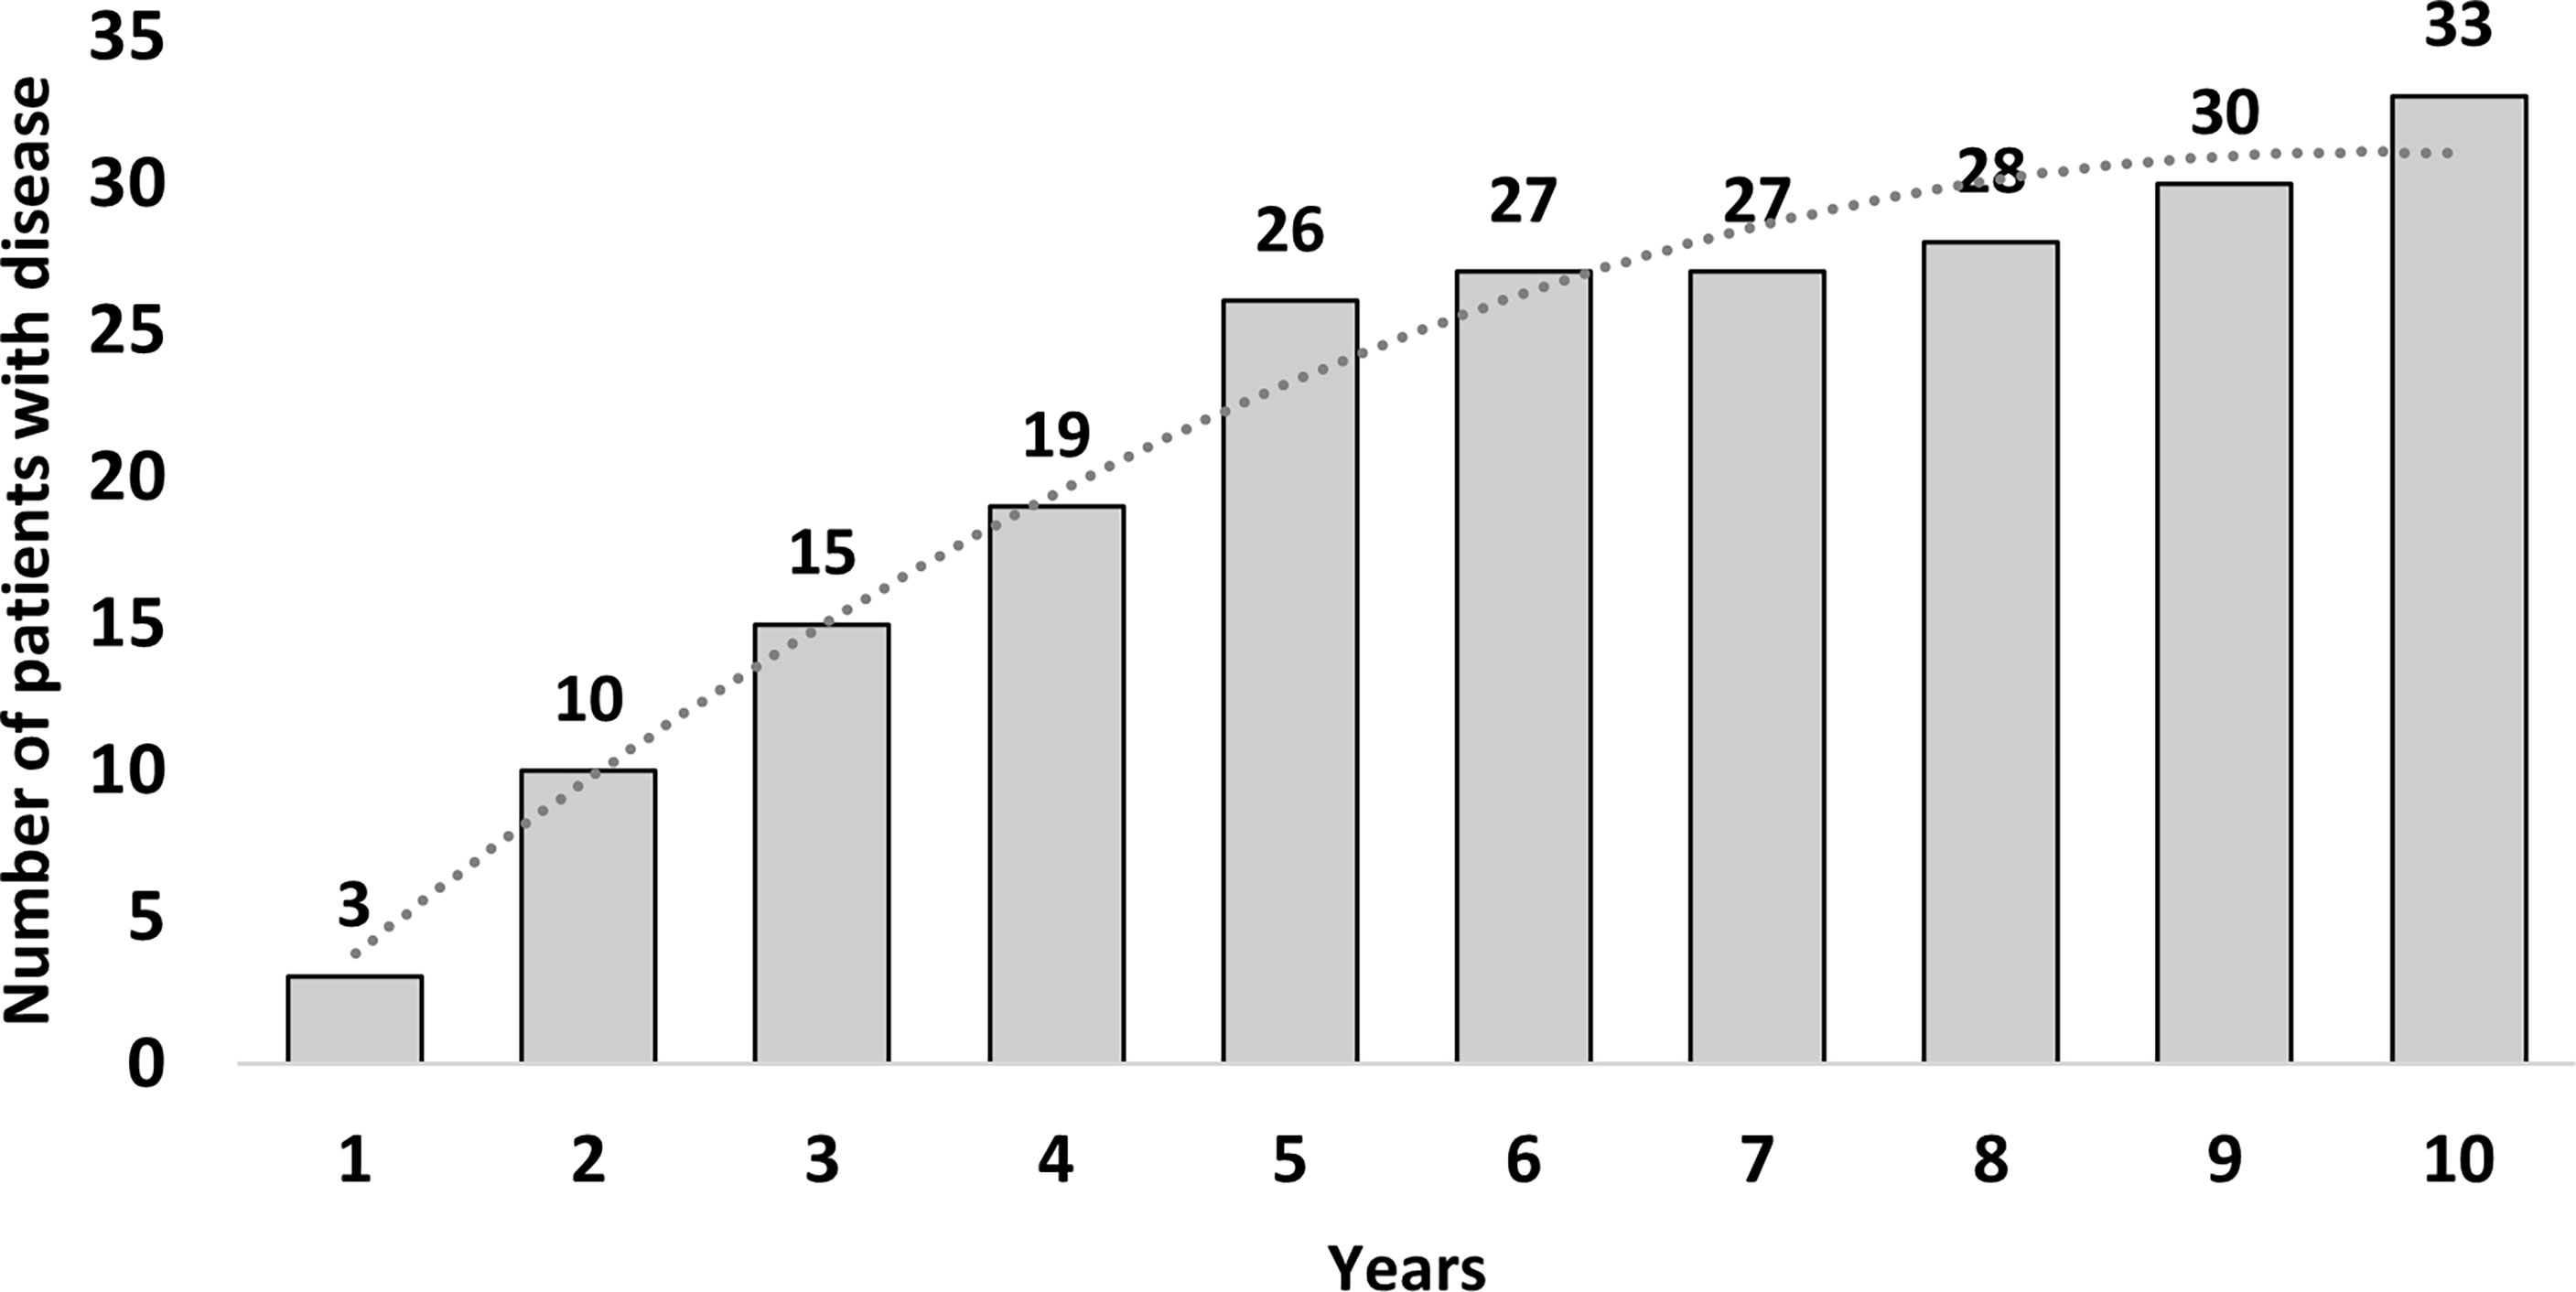
Figure 2 Number of patients showing metastases in relation to the years after the end of surgery.
The ability of every single radiomic feature in predicting 5yDFS at the univariate analysis was assessed by considering the Wilcoxon–Mann–Whitney (WMW) test or the t-test, depending on the normality of data distribution, which was previously evaluated using the Shapiro–Wilk test (31).
Clinical information such as initial tumor staging, GTV volume, sex, and age at diagnosis was considered as an additional variable. The radiomic feature showing the highest level of significance in both the patient cohorts was considered as the best predictor, and two logistic regression models were developed, one for each cohort.
The predictive performance of the two predictive models was evaluated using the area under the receiver operating characteristic (ROC) curve (AUC), with the 95% CIs calculated using the bootstrap method with 2,000 iterations (32).
The best cutoff threshold was identified maximizing Youden’s index (J), and the sensitivity and specificity values at the best threshold were calculated for each model (33).
With the use of the elaborated models, the probability of 5yDFS at different values of the radiomic parameter was calculated to identify different ranges in which a CT regimen can be considered of higher value, ensuring a higher probability of 5yDFS.
The robustness of the two developed models was evaluated by means of a threefold cross-validation analysis with five iterations, as an independent external validation dataset was not available (30).
The whole statistical analysis was performed using R software (version 3.6.1, Wien Austria) and dedicated packages (34).
A total of 240 patients were considered for this study, but only 188 cases met the inclusion criteria: 125 (66%) were treated with oxaliplatin CT and 63 (34%) without oxaliplatin CT. The clinical characteristics of the patients included in the study are summarized in Table 1.
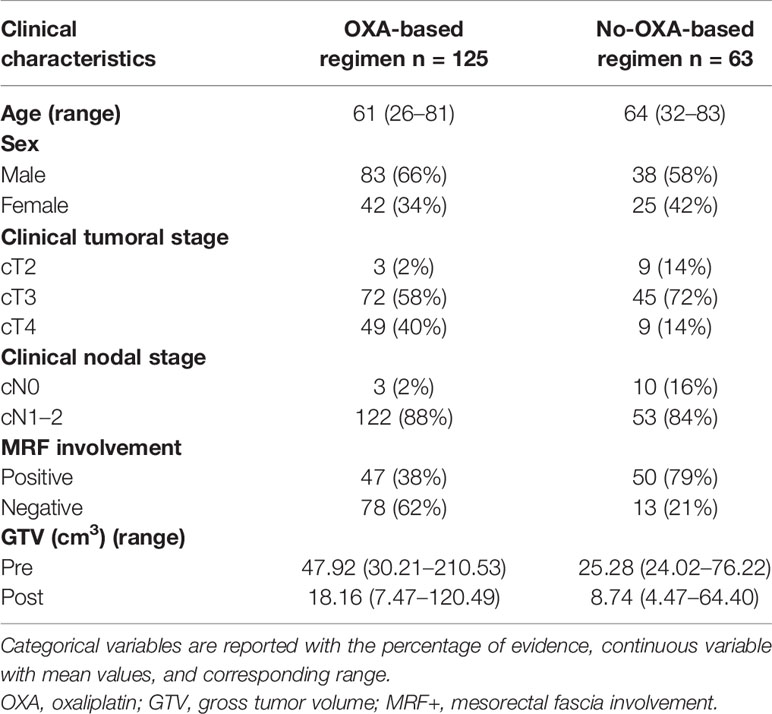
Table 1 Clinical characteristics of patients enrolled and treated with and without oxaliplatin.
The median follow-up time was 96 months, with a range of 9–156 months, and with a 5yDFS of 84.8% and 87.3% for OXA- and no-OXA-based CT, respectively.
A total of 176 image features (92 radiomic and 84 fractal features) were extracted for each patient: among the radiomic features, 14 were based on morphology, 22 on gray-level histogram analysis (1st-order features), and 46 on the textural analysis (16 szm, 18 rlm, and 22 cm).
At the univariate analysis, the only feature that showed statistically significant ability in predicting 5yDFS in both patient cohorts was the maximum FD of the subpopulation identified considering 30% and 50% as threshold levels (maxFD30–50), with a p-value of 0.018 in the cohort treated with oxaliplatin and 0.019 in the one treated without oxaliplatin. The values of the parameters and coefficients characterizing the two models developed are reported in Table 2.
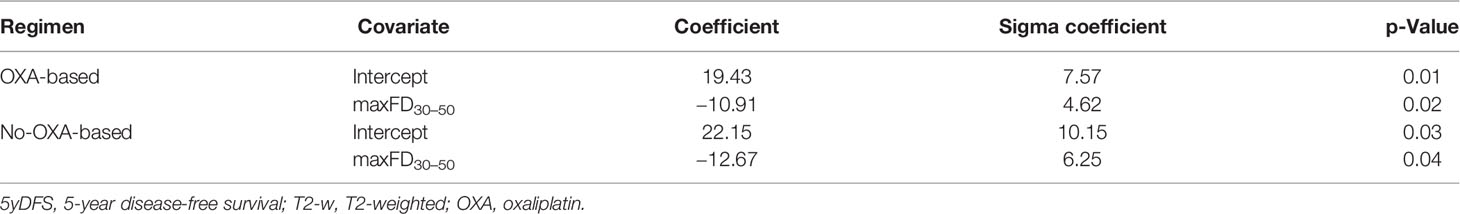
Table 2 Covariates and coefficients of the linear logistic regression models elaborated to predict 5yDFS from the analysis of T2-w MR staging images.
Figure 3 reports the ROC curves with the corresponding 95% CIs obtained for the two logistic regression models created using maxFD30–50 as variable and 5yDFS as the outcome.
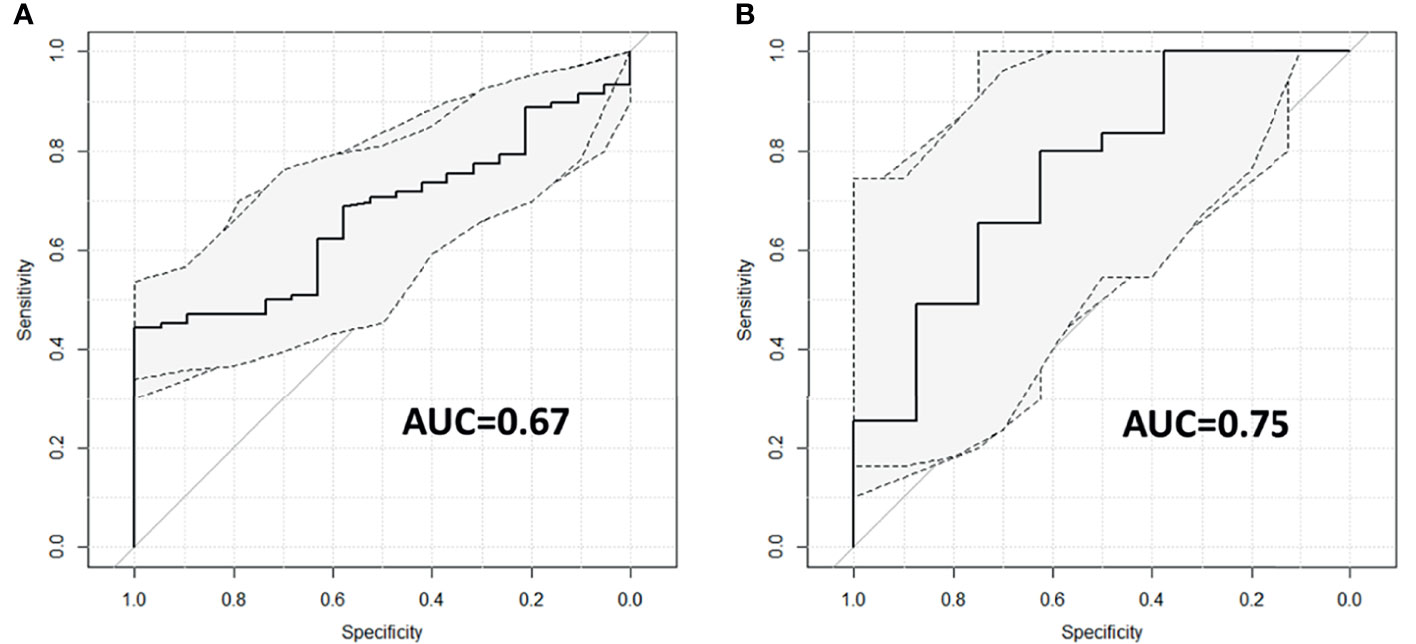
Figure 3 ROC curves with corresponding 95% CIs for patients treated with (A) and without (B) oxaliplatin. ROC, receiver operating characteristic.
For the OXA-based cohort, the predictive model reports an AUC of 0.67 (95% CI ranging from 0.57 to 0.77); for the no-OXA-based cohort, the model shows an AUC of 0.75 (95% CI ranging from 0.56 to 0.95). The best cutoff threshold was 0.88 (corresponding to a J index of 0.44) for patients on OXA-based regimen, 0.80 (J = 0.42) for patients in no-OXA-based regimen. At the best threshold value, the sensitivity was 44.3% for patients treated with an OXA-based regimen and 80% for patients treated with no-OXA regimen, while the specificity was 100% and 62.5%, respectively. The robustness analysis performed using the threefold cross-validation reported an AUC of 0.67 with an SD of 0.06 for the oxaliplatin cohort and an AUC of 0.75 with SD equal to 0.15 for the no-oxaliplatin cohort.
Applying the two models developed, the probability of achieving 5yDFS when oxaliplatin is or is not administered can be calculated. Figure 4 summarizes the values obtained in terms of 5yDFS probability to varying maxFD30–50 values.
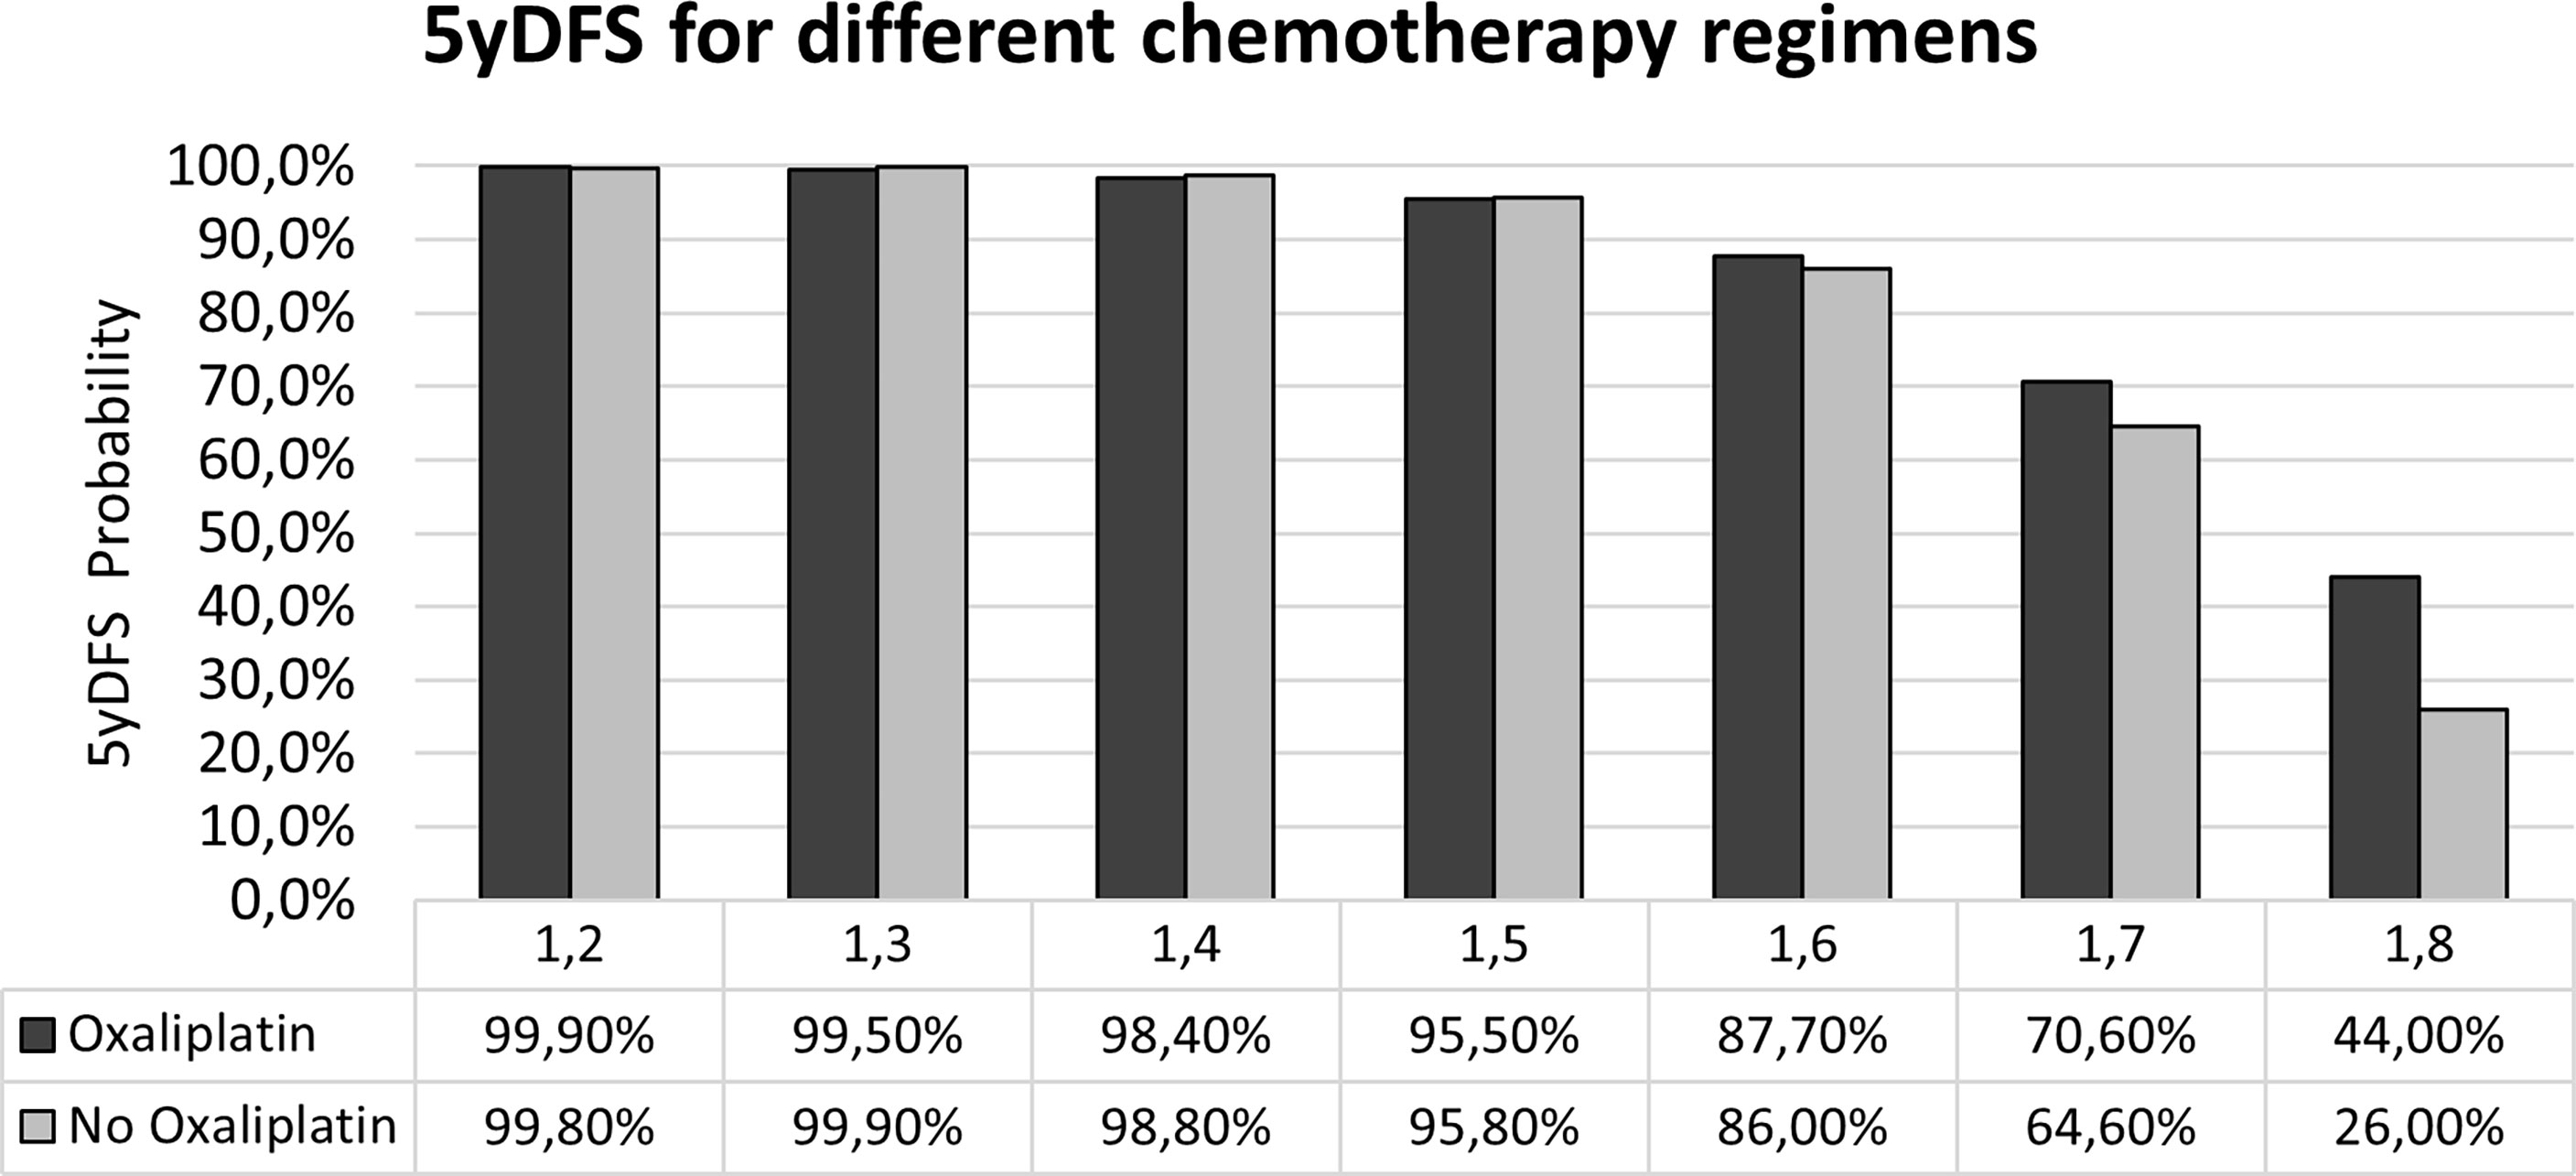
Figure 4 Probability of 5yDFS to varying of the maxFD30–50 extracted from the T2-w staging MR images in the case of the two treatment regimens. 5yDFS, 5-year disease-free survival; T2-w, T2-weighted.
Figure 5 reports a visual representation of the meaning of FD: such parameter can be considered as a metric indicator of the tumor aggressiveness, as higher FD values describe tumor structures characterized by a more complex spatial arrangement. In particular, the higher value of maxFD30–50 is correlated with a lower probability of 5yDFS.
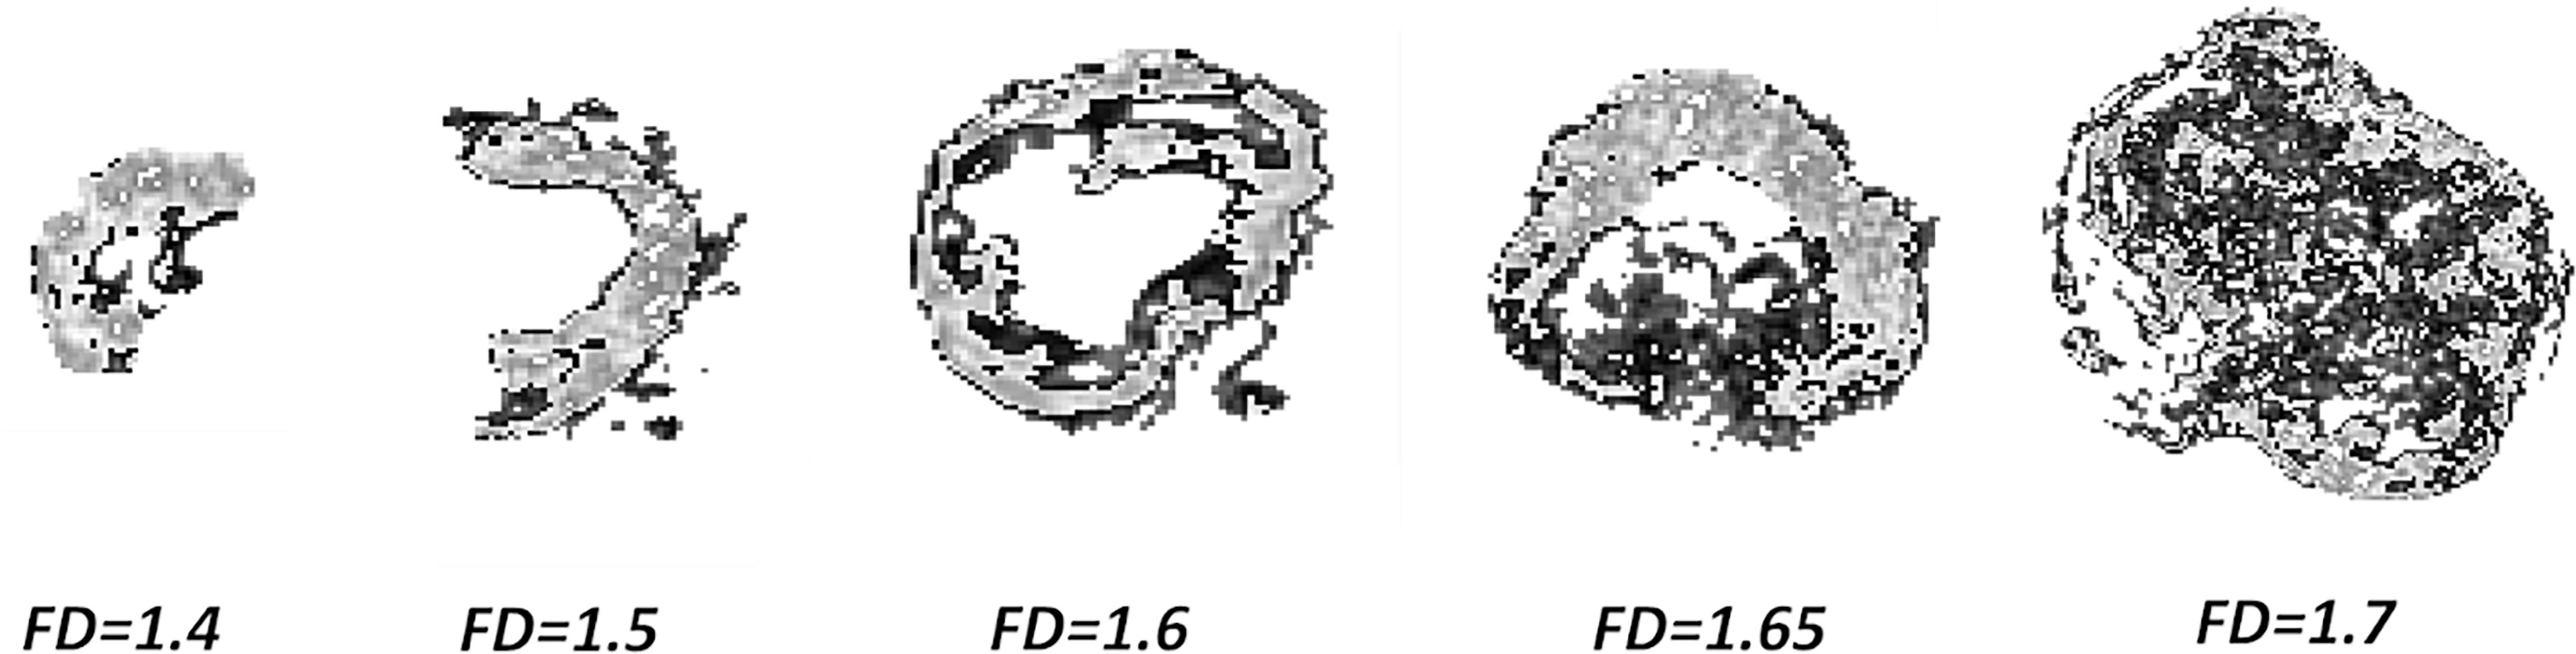
Figure 5 Complexity of GTV to increasing maxFD30–50 values: pixels in light gray indicating the subpopulation between 30% and 50% of the maximum intensity. GTV, gross tumor volume.
During recent years, the number of radiomic applications has exponentially grown, demonstrating that the image-based biomarkers can play a significant role in the context of the omics-based predictive models, at the same level as more advanced disciplines such as genomics, proteomics, and transcriptomics (35–37).
This work represents one of the first experiences that aim to identify the role of radiomics in the definition of a more intensive schedule of concomitant CT at the time of diagnosis, in order to reduce the rate of local and distant metastases at 5 years.
For rectal cancer, indeed, the majority of the experiences are focused on predicting early surrogate endpoints, such as the pCR, because these data are more quickly available in a clinical setting and allow a faster analysis of the radiomic potentialities (30, 38, 39).
Developing models that can predict long-term outcomes is much more challenging, as it requires a very precise and time-consuming follow-up analysis: one of the strengths of this experience is that it is based on the analysis of patients with a very long follow-up (median of 96 months).
Interestingly, an innovative methodology was proposed in this experience, with the aim of identifying the optimal CT regimen for every single patient, based on initial staging MRI analysis.
Patients were divided into two cohorts, and the features able to predict 5yDFS with statistical significance in both the cohorts were analyzed: the only one showing predictive ability in both the cohorts was the FD, which is an interesting point, as previous experiences in rectal cancer had demonstrated the fractal potentialities in predicting pCR from staging MRI analysis (27, 30).
In the idea of applying the proposed model in clinical reality, the therapeutic choice would be based on the maxFD30–50 value: an oxaliplatin-based regimen should be preferred in cases of maxFD30–50 >1.6, as it ensures a higher 5yDFS probability (70.6% vs. 64.6% in case of FD = 1.7; 44% vs. 26% in cases of FD = 1.8), while the two CT regimens can be considered equivalent in terms of 5yDFS for maxFD30–50 ≤1.6.
Obviously, the findings of this study are still not mature enough to be considered ready for clinical applications, as they are not supported by an external validation: to partially compensate for such absence, internal cross-validation was performed, which had confirmed the results observed in the training set.
Furthermore, the 95% CI values of the ROC curves elaborated are still quite large, mainly due to the small number of events analyzed: a more comprehensive study including larger patient cohorts is recommended to verify the potential of FD as an image-based biomarker in rectal cancer.
In conclusion, this study proved the feasibility of establishing the optimal regimen of CT combined with nCRT for stage III LARC cancer patients based on information extracted from the analysis of T2-w MR images. In particular, by providing an indication of the spatial heterogeneity of GTV at staging, maxFD30–50 is able to predict with statistical significance the probability of 5yDFS. New studies including a larger cohort of patients and external validation sets are recommended to verify the results of this hypothesis-generating study.
The raw data supporting the conclusions of this article will be made available by the authors, without undue reservation.
The studies involving human participants were reviewed and approved by Gemelli. The patients/participants provided their written informed consent to participate in this study. Written informed consent was obtained from the individual(s) for the publication of any potentially identifiable images or data included in this article.
All authors contributed to the article and approved the submitted version.
The authors declare that the research was conducted in the absence of any commercial or financial relationships that could be construed as a potential conflict of interest.
All claims expressed in this article are solely those of the authors and do not necessarily represent those of their affiliated organizations, or those of the publisher, the editors and the reviewers. Any product that may be evaluated in this article, or claim that may be made by its manufacturer, is not guaranteed or endorsed by the publisher.
1. Berardi R, Maccaroni E, Onofri A, Morgese F, Torniai M, Tiberi M, et al. Locally Advanced Rectal Cancer: The Importance of a Multidisciplinary Approach. World J Gastroenterol (2014) 20:17279–87. doi: 10.3748/wjg.v20.i46.17279
2. Feeney G, Sehgal R, Sheehan M, Hogan A, Regan M, Joyce M, et al. Neoadjuvant Radiotherapy for Rectal Cancer Management. World J Gastroenterol (2019) 25:4850–69. doi: 10.3748/wjg.v25.i33.4850
3. Habr-Gama A, Gama-Rodrigues J, São Julião GP, Proscurshim I, Sabbagh C, Lynn PB, et al. Local Recurrence After Complete Clinical Response and Watch and Wait in Rectal Cancer After Neoadjuvant Chemoradiation: Impact of Salvage Therapy on Local Disease Control. Int J Radiat Oncol Biol Phys (2014) 88:822–8. doi: 10.1016/j.ijrobp.2013.12.012
4. Valentini V, van Stiphout RGPM, Lammering G, Gambacorta MA, Barba MC, Bebenek M, et al. Selection of Appropriate End-Points (pCR vs 2ydfs) for Tailoring Treatments With Prediction Models in Locally Advanced Rectal Cancer. Radiother Oncol (2015) 114:302–9. doi: 10.1016/j.radonc.2015.02.001
5. van Gijn W, Marijnen CAM, Nagtegaal ID, Kranenbarg EM-K, Putter H, Wiggers T, et al. Preoperative Radiotherapy Combined With Total Mesorectal Excision for Resectable Rectal Cancer: 12-Year Follow-Up of the Multicentre, Randomised Controlled TME Trial. Lancet Oncol (2011) 12:575–82. doi: 10.1016/S1470-2045(11)70097-3
6. Gérard J-P, Azria D, Gourgou-Bourgade S, Martel-Laffay I, Hennequin C, Etienne P-L, et al. Comparison of Two Neoadjuvant Chemoradiotherapy Regimens for Locally Advanced Rectal Cancer: Results of the Phase III Trial ACCORD 12/0405-Prodige 2. J Clin Oncol (2010) 28:1638–44. doi: 10.1200/JCO.2009.25.8376
7. Allegra CJ, Yothers G, O’Connell MJ, Beart RW, Wozniak TF, Pitot HC, et al. Neoadjuvant 5-FU or Capecitabine Plus Radiation With or Without Oxaliplatin in Rectal Cancer Patients: A Phase III Randomized Clinical Trial. J Natl Cancer Inst (2015) 107:djv248. doi: 10.1093/jnci/djv248
8. Aschele C, Cionini L, Lonardi S, Pinto C, Cordio S, Rosati G, et al. Primary Tumor Response to Preoperative Chemoradiation With or Without Oxaliplatin in Locally Advanced Rectal Cancer: Pathologic Results of the STAR-01 Randomized Phase III Trial. J Clin Oncol (2011) 29:2773–80. doi: 10.1200/JCO.2010.34.4911
9. Schmoll H-J, Stein A, Van Cutsem E, Price T, Hofheinz RD, Nordlinger B, et al. Pre- and Postoperative Capecitabine Without or With Oxaliplatin in Locally Advanced Rectal Cancer: PETACC 6 Trial by EORTC GITCG and ROG, AIO, AGITG, BGDO, and FFCD. JCO (2021) 39:17–29. doi: 10.1200/JCO.20.01740
10. Deng Y, Chi P, Lan P, Wang L, Chen W, Cui L, et al. Modified FOLFOX6 With or Without Radiation Versus Fluorouracil and Leucovorin With Radiation in Neoadjuvant Treatment of Locally Advanced Rectal Cancer: Initial Results of the Chinese FOWARC Multicenter, Open-Label, Randomized Three-Arm Phase III Trial. J Clin Oncol (2016) 34:3300–7. doi: 10.1200/JCO.2016.66.6198
11. Jiao D, Zhang R, Gong Z, Liu F, Chen Y, Yu Q, et al. Fluorouracil-Based Preoperative Chemoradiotherapy With or Without Oxaliplatin for Stage II/III Rectal Cancer: A 3-Year Follow-Up Study. Chin J Cancer Res (2015) 27:588–96. doi: 10.3978/j.issn.1000-9604.2015.12.05
12. Liu Z, Zhang X-Y, Shi Y-J, Wang L, Zhu H-T, Tang Z, et al. Radiomics Analysis for Evaluation of Pathological Complete Response to Neoadjuvant Chemoradiotherapy in Locally Advanced Rectal Cancer. Clin Cancer Res (2017) 23:7253–62. doi: 10.1158/1078-0432.CCR-17-1038
13. Kumar V, Gu Y, Basu S, Berglund A, Eschrich SA, Schabath MB, et al. Radiomics: The Process and the Challenges. Magn Reson Imaging (2012) 30:1234–48. doi: 10.1016/j.mri.2012.06.010
14. Fokas E, Glynne-Jones R, Appelt A, Beets-Tan R, Beets G, Haustermans K, et al. Outcome Measures in Multimodal Rectal Cancer Trials. Lancet Oncol (2020) 21:e252–64. doi: 10.1016/S1470-2045(20)30024-3
15. Cusumano D, Boldrini L, Yadav P, Yu G, Musurunu B, Chiloiro G, et al. External Validation of Early Regression Index (ERITCP) as Predictor of Pathologic Complete Response in Rectal Cancer Using Magnetic Resonance-Guided Radiation Therapy. Int J Radiat Oncol Biol Phys (2020) 108:1347–56. doi: 10.1016/j.ijrobp.2020.07.2323
16. Fiorino C, Gumina C, Passoni P, Palmisano A, Broggi S, Cattaneo GM, et al. A TCP-Based Early Regression Index Predicts the Pathological Response in Neo-Adjuvant Radio-Chemotherapy of Rectal Cancer. Radiother Oncol (2018) 128:564–8. doi: 10.1016/j.radonc.2018.06.019
17. Chiloiro G, Rodriguez-Carnero P, Lenkowicz J, Casà C, Masciocchi C, Boldrini L, et al. Delta Radiomics Can Predict Distant Metastasis in Locally Advanced Rectal Cancer: The Challenge to Personalize the Cure. Front Oncol (2020) 10:595012. doi: 10.3389/fonc.2020.595012
18. Liu Z, Meng X, Zhang H, Li Z, Liu J, Sun K, et al. Predicting Distant Metastasis and Chemotherapy Benefit in Locally Advanced Rectal Cancer. Nat Commun (2020) 11:4308. doi: 10.1038/s41467-020-18162-9
19. Brierley JD, Gospodarowicz MK, Wittekind C. TNM Classification of Malignant Tumours. Bridgewater, NJ 08807: John Wiley & Sons (2017).
20. Valentini V, Gambacorta MA, Barbaro B, Chiloiro G, Coco C, Das P, et al. International Consensus Guidelines on Clinical Target Volume Delineation in Rectal Cancer. Radiother Oncol (2016) 120:195–201. doi: 10.1016/j.radonc.2016.07.017
21. Suárez J, Vera R, Balén E, Gómez M, Arias F, Lera JM, et al. Pathologic Response Assessed by Mandard Grade Is a Better Prognostic Factor Than Down Staging for Disease-Free Survival After Preoperative Radiochemotherapy for Advanced Rectal Cancer. Colorectal Dis (2008) 10:563–8. doi: 10.1111/j.1463-1318.2007.01424.x
22. Barbaro B, Fiorucci C, Tebala C, Valentini V, Gambacorta MA, Vecchio FM, et al. Locally Advanced Rectal Cancer: MR Imaging in Prediction of Response After Preoperative Chemotherapy and Radiation Therapy. Radiology (2009) 250:730–9. doi: 10.1148/radiol.2503080310
23. Hodapp N. [The ICRU Report 83: Prescribing, Recording and Reporting Photon-Beam Intensity-Modulated Radiation Therapy (IMRT)]. Strahlenther Onkol (2012) 188:97–9. doi: 10.1007/s00066-011-0015-x
24. Gatta R, Vallati M, Dinapoli N, Masciocchi C, Lenkowicz J, Cusumano D, et al. Towards a Modular Decision Support System for Radiomics: A Case Study on Rectal Cancer. Artif Intell Med (2018) 96:145–53. doi: 10.1016/j.artmed.2018.09.003
25. Dinapoli N, Alitto AR, Vallati M, Gatta R, Autorino R, Boldrini L, et al. Moddicom: A Complete and Easily Accessible Library for Prognostic Evaluations Relying on Image Features. Conf Proc IEEE Eng Med Biol Soc (2015) 2015:771–4. doi: 10.1109/EMBC.2015.7318476
26. Dinapoli N, Barbaro B, Gatta R, Chiloiro G, Casà C, Masciocchi C, et al. Magnetic Resonance, Vendor-Independent, Intensity Histogram Analysis Predicting Pathologic Complete Response After Radiochemotherapy of Rectal Cancer. Int J Radiat Oncol Biol Phys (2018) 102(4):765–74. doi: 10.1016/j.ijrobp.2018.04.065
27. Cusumano D, Dinapoli N, Boldrini L, Chiloiro G, Gatta R, Masciocchi C, et al. Fractal-Based Radiomic Approach to Predict Complete Pathological Response After Chemo-Radiotherapy in Rectal Cancer. Radiol Med (2018) 123:286–95. doi: 10.1007/s11547-017-0838-3
28. Zwanenburg A, Vallières M, Abdalah MA, Aerts HJWL, Andrearczyk V, Apte A, et al. The Image Biomarker Standardization Initiative: Standardized Quantitative Radiomics for High-Throughput Image-Based Phenotyping. Radiology (2020) 295:328–38. doi: 10.1148/radiol.2020191145
29. Cusumano D, Boldrini L, Yadav P, Gao Y, Chiloiro G, Musurunu B, et al. Delta Radiomics for Rectal Cancer Response Prediction Using Low Field Magnetic Resonance Guided Radiotherapy: An External Validation. Phys Med (2021) 84:186-191. doi: 10.1016/j.ejmp.2021.03.038
30. Cusumano D, Meijer G, Lenkowicz J, Chiloiro G, Boldrini L, Masciocchi C, et al. A Field Strength Independent MR Radiomics Model to Predict Pathological Complete Response in Locally Advanced Rectal Cancer. Radiol Med (2020) 126(3):421–9. doi: 10.1007/s11547-020-01266-z
31. Taylor J. Introduction to Error Analysis, the Study of Uncertainties in Physical Measurements (1997). 648 Broadway, Suite 902, New York, NY 10012, 1997: Published by University Science Books. Available at: http://adsabs.harvard.edu/abs/1997ieas.book (Accessed June 4, 2020).
32. International Commissioning on Radiation Units and Measurements. Receiver Operating Characteristic (ROC) Analysis in Medical Imaging. ICRU Rep 79 (2008) 8:1-62. doi: 10.1093/jicru/ndn018
33. Ruopp MD, Perkins NJ, Whitcomb BW, Schisterman EF. Youden Index and Optimal Cut-Point Estimated From Observations Affected by a Lower Limit of Detection. Biometrical J Biometrische Z (2008) 50:419. doi: 10.1002/bimj.200710415
34. Robin X, Turck N, Hainard A, Tiberti N, Lisacek F, Sanchez J-C, et al. pROC: An Open-Source Package for R and S+ to Analyze and Compare ROC Curves. BMC Bioinf (2011) 12:77. doi: 10.1186/1471-2105-12-77
35. Scott JG, Berglund A, Schell MJ, Mihaylov I, Fulp WJ, Yue B, et al. A Genome-Based Model for Adjusting Radiotherapy Dose (GARD): A Retrospective, Cohort-Based Study. Lancet Oncol (2017) 18:202–11. doi: 10.1016/S1470-2045(16)30648-9
36. Gillies RJ, Kinahan PE, Hricak H. Radiomics: Images Are More Than Pictures, They Are Data. Radiology (2016) 278:563–77. doi: 10.1148/radiol.2015151169
37. Lambin P, Leijenaar RTH, Deist TM, Peerlings J, de Jong EEC, van Timmeren J, et al. Radiomics: The Bridge Between Medical Imaging and Personalized Medicine. Nat Rev Clin Oncol (2017) 14:749–62. doi: 10.1038/nrclinonc.2017.141
38. Horvat N, Veeraraghavan H, Khan M, Blazic I, Zheng J, Capanu M, et al. MR Imaging of Rectal Cancer: Radiomics Analysis to Assess Treatment Response After Neoadjuvant Therapy. Radiology (2018) 287:833–43. doi: 10.1148/radiol.2018172300
39. Boldrini L, Cusumano D, Chiloiro G, Casà C, Masciocchi C, Dinapoli N, et al. Delta Radiomics for Rectal Cancer Response Prediction With Hybrid 0.35 T Magnetic Resonance Guided Radiotherapy (MRgRT) : A Hypothesis Generating Study for an Innovative Personalized Medicine Approach. La Radiol Med (2018) 124:145–53. doi: 10.1007/s11547-018-0951-y
Keywords: radiomics, MRI, oxaliplatin, rectal cancer, predictive modeling
Citation: Di Dio C, Chiloiro G, Cusumano D, Catucci F, Boldrini L, Romano A, Meldolesi E, Marazzi F, Corvari B, Barbaro B, Manfredi R, Valentini V and Gambacorta MA (2021) Fractal-Based Radiomic Approach to Tailor the Chemotherapy Treatment in Rectal Cancer: A Generating Hypothesis Study. Front. Oncol. 11:774413. doi: 10.3389/fonc.2021.774413
Received: 11 September 2021; Accepted: 18 November 2021;
Published: 09 December 2021.
Edited by:
Berardino De Bari, Hospital Neuchâtelois, SwitzerlandReviewed by:
Katsuya Yamada, Hirosaki University, JapanCopyright © 2021 Di Dio, Chiloiro, Cusumano, Catucci, Boldrini, Romano, Meldolesi, Marazzi, Corvari, Barbaro, Manfredi, Valentini and Gambacorta. This is an open-access article distributed under the terms of the Creative Commons Attribution License (CC BY). The use, distribution or reproduction in other forums is permitted, provided the original author(s) and the copyright owner(s) are credited and that the original publication in this journal is cited, in accordance with accepted academic practice. No use, distribution or reproduction is permitted which does not comply with these terms.
*Correspondence: Davide Cusumano, ZGF2aWRlLmN1c3VtYW5vQHBvbGljbGluaWNvZ2VtZWxsaS5pdA==
Disclaimer: All claims expressed in this article are solely those of the authors and do not necessarily represent those of their affiliated organizations, or those of the publisher, the editors and the reviewers. Any product that may be evaluated in this article or claim that may be made by its manufacturer is not guaranteed or endorsed by the publisher.
Research integrity at Frontiers
Learn more about the work of our research integrity team to safeguard the quality of each article we publish.