 Zhiqiang Yang
 Xiaoping Ming2†
 Minlan Yang
 Jiayu Fang
94% of researchers rate our articles as excellent or good
Learn more about the work of our research integrity team to safeguard the quality of each article we publish.
Find out more
ORIGINAL RESEARCH article
Front. Oncol. , 29 November 2021
Sec. Head and Neck Cancer
Volume 11 - 2021 | https://doi.org/10.3389/fonc.2021.764798
This article is part of the Research Topic Prognosis Prediction and Risk Stratification in Head and Neck Cancer View all 59 articles
Background: N6-Methyladenosine (m6A), which is a prevalent regulator of mRNA expression, has gathered increasing study interests. Though the role of m6A as being important in many biological processes (such as growth and proliferation of cancers) has been well documented, its potential role in tumor immune microenvironment (TIME) has rarely been analyzed.
Methods: We downloaded RNA expression, single nucleotide polymorphism (SNP), and copy number variation (CNV) data from The Cancer Genome Atlas (TCGA). We then curated 21 m6A regulators and clustered patients into three m6A subtypes and m6A-related gene subtypes and compared them based on overall survival (OS). The combination of CIBERSORT as well as ssGSEA quantified the infiltration levels of immune cells and immune-related functions. The m6A scores were determined by using principal component analysis (PCA) algorithm. Furthermore, we evaluate the correlation of m6A regulators with immune and response to therapy.
Results: Three m6A clusters were identified based on the TCGA-HNSCC cohort, and there were significant associations among them in overall outcomes and caner-related pathways. We found that three m6A clusters were consistent with three phenotypes: immune-inflamed, immune-dessert, and immune-excluded. HNSCC patients were divided into high– and low–m6A score groups based on the cutoff of m6A score. Patients with lower m6A score had better overall survival outcome. Further analysis indicated that patients with higher m6A score presented higher tumor mutation burden (TMB). In addition, patients in low–m6A score subgroup had high chemotherapeutics sensitivity. GEO cohort confirmed patients with low m6A score demonstrated significant overall survival advantages and clinical benefits. Low m6A score carry an increased neoantigen load, eliciting a response to immunotherapy, and its value in predicting survival outcomes of immunotherapy was also confirmed in three anti-PD-1 cohorts.
Conclusions: Our study demonstrated that m6A regulators are closely related to TIME and the m6A score was an effective prognostic biomarker and predictive indicator for immunotherapy and chemotherapeutics. Comprehensive evaluation of m6A regulators in tumors will extend our understanding of TIME and effectively guide increasing study investigations on immunotherapy and chemotherapy strategies for HNSCC.
Head and neck squamous cell carcinoma (HNSCC) remains the primary cause of cancer death worldwide, with approximately 890,000 newly diagnosed cases per year (1). More than 50% of patients will present with local recurrence or node metastasis within 5 years caused by resistance to conventional treatment (2). Conventional treatments include surgery, radiotherapy, and chemotherapy based on the stage of patients, but most HNSCC exhibit weak prognosis because of the complex mechanisms whereby the RNA modifications were associated with different immune cell infiltrations.
Immunotherapy may provide significant therapeutic effects in identifying and eliminating tumor cells by activating patients’ immune defense system (3). This treatment yields new insights with unparalleled and synergistic survival benefits into multiple clinical management (4, 5). For example, inhibitors of CTLA-4 as well as anti-PD-1/L1 antibodies, which are representative immune checkpoint inhibitors, have achieved a marked clinical response in patient’s treatment (6–8). Nevertheless, a major limitation of this treatment (the imbalance of the immune system) is that a minority of patients could benefit from immunotherapy. In addition, numerous cytokines (such as IL-10 and IL-17) and immunosuppressive cells (derived from marrow) are components of the tumor immune microenvironment (TIME) promoting immune escape (9). Thus, the regulatory mechanism and the novel markers of HNSCC should be urgently investigated by comprehensively parsing the components of TIME so that the ideal HNSCC subgroups for guiding and predicting therapeutic responsiveness could be identified.
The methylation modification of the N6 adenosine (m6A), which is the most common type of posttranscriptional modification on RNA and mediate above 60% of RNA methylation, plays crucial roles in a series of cancer processes and progression and immunomodulatory abnormalities (10). To be specific, the aberrant methylation of m6A is close to cancer stem cell differentiation, cancer immune response, and microRNA (miRNA) editing; they also play an essential role in the progression of various cancers (11–13). The m6A methylation levels in tumors mainly depend on the expression of m6A regulatory proteins, which is controlled by the expression of “writers”—methyltransferases, the “erasers”—demethylases, and “readers”—binding proteins in cell (14, 15). The writers, which include methyltransferase like (METTL)14, METTL3, WT1-associated protein (WTAP), Casitas B-lineage proto-oncogene like 1 (CBLL1), KIAA1429, ZC3H13, and RNA-binding motif protein 15 (RBM15), RBM15B, promote m6A RNA methylation (16–18). The erasers, which include fat mass- and obesity-associated protein (FTO) and α-ketoglutarate-dependent dioxygenase alkB homolog 5 (ALKBH5), remove m6A methylation (19). The readers, which include YTH domain-containing 1 (YTHDC1), YTHDC2, YTH N6-methyl-adenosine RNA-binding protein 1 (YTHDF1), YTHDF2, YTHDF3, and heterogeneous nuclear ribonucleoprotein C (HNRNPC), insulin-like growth factor 2 mRNA-binding protein 2 (IGF2BP2), IGF2BP3, ELAV-like RNA-binding protein 1 (ELAVL1), heterogeneous nuclear ribonucleoprotein A2B1 (HNRNPA2B1), and LRPPRC, can bind proteins to the m6A methylation site (20).
Increasing evidence has demonstrated that the dysregulated expression of m6A regulators plays a vital regulatory role in tumor progression and patient prognosis (21, 22).
Lan et al. showed that m6A-modified GATA3 pre-mRNA was mediated by KIAA1429, stimulating the RNA-binding protein to undergo separation and promoting GATA3 pre-mRNA degradation (23). Among patients with hepatocellular carcinoma, overexpression of KIAA1429 was significantly associated with poor clinical prognosis. Also, shRNA silencing of KIAA1429 suppressed hepatocellular carcinoma cell proliferation and tumorigenesis both in vitro and in vivo.
In the study of Chen et al., WTAP was found to be highly expressed in osteosarcoma cancer (24), and Cox analysis showed that it was an independent prognostic factor for overall survival. Mechanistically, WTAP, as an oncogene, regulated osteosarcoma proliferation and metastasis via PI3K/AKT pathway in vitro and in vivo. The study of Yi et al. divided patients into two subtypes determined via the consensus clustering for 15 m6A methylation regulators, which could stratify the prognosis of patients (25). They also established the risk score based on six m6A regulators, which was an independent prognostic indicator of patients.
However, the role of risk score in immunotherapy and chemotherapy was not analyzed. In addition, whether m6A methylation regulators have the interface of copy number variations (CNVs) or the correlation of tumor mutation burden (TMB) has yet to be fully explored.
Using public databases, Li et al. showed that higher expression of METTL3 was associated with poorer survival prognosis in colorectal carcinoma (CRC) metastatic tissues (26). In vivo, they found that METTL3 is linked to CRC development through maintaining SOX2 expression.
Recently, most studies have revealed the correlation between immune cell infiltration and m6A modification, but the carcinogenic pathways of m6A methylation in TIME remains unclear. Han et al. reported that lysosomal protease, marked and recognized by YTHDF1, induced the degradation of tumor neoantigens (27). Compared with WT mice, they observed higher levels of CD8+ cytotoxic T cells and NK cells in tumors from YTHDF1 knockout mice, which suggest that an enhanced antitumor response occurs in the absence of YTHDF1. In melanoma cells, Chong et al. demonstrated that interferon-gamma (IFN-γ)-induced cytotoxicity could be decreased by FTO in vitro by suppressing the expression of cell-intrinsic genes PD-1, CXCR4, and SOX10, at least partially through YTHDF2-mediated decay process (28). Moreover, they found that knockdown of FTO enabled an antimelanoma response via upregulating the expression level of IFN-γ in mice. Another study demonstrated that METTL3-mediated m6A of CD40 and CD80 promoted DC activation and maturation, which contributed to increased antigen presentation and T-cell stimulation in vivo and in vitro (29). Also, the METTL3-mediated mRNA modification is essential in cancer progression. Consequently, these results indicated that m6A are vital mediators of TME, emphasizing potential promising targets in enhancing therapeutic response to clinical immunotherapy. However, almost all studies focused on one or two m6A regulators owing to existing technical limitations. Thus, the combined analysis of multiple m6A regulators in HNSCC, including the interactions between the m6A regulators and CNVs and TMB, will enhance our understanding of TIME (30).
In our study, we systematically assessed the relationship between m6A methylation and prognosis, CNVs, TMB, and TIME based on the next-generation sequencing data of HNSCC samples. Three clustering subtypes were identified via “ConsensusClusterPlus” method, and these three subtypes were closely linked to three phenotypes: immune-inflamed, immune-excluded, and immune-desert (7). Moreover, we constructed a scoring model, m6A score, to quantify HNSCC of individual cases. Also, the relationships between scoring model, ICI treatment, TIME, and cancer-related pathways were thoroughly analyzed to further explore the effect of m6A regulators in HNSCC. The whole study suggested that m6A regulators play an indispensable role in TIME and in assisting to make therapeutic strategies on HNSCC.
The genomics data and clinical information of 528 HNSCC samples and 43 adjacent normal tissues were procured from the public TCGA (https://cancergenome.nih.gov/). The selection criteria were used as follows: (1) histologically confirmed HNSCC and (2) complete clinical and OS data. Lastly, 479 patients with the corresponding clinical information, including age, gender, stage, HPV subtype, and radiation therapy were collected for further analysis. The mutation data (e.g., somatic mutation and copy number variation data) was downloaded from the UCSC Xena (https://gdc.xenahubs.net/). Twenty-one m6A regulators were collected based on published literature. Next, the differential expression of the 21 m6A regulators was presented in a heatmap. Nonsynonymous mutation and synonymous mutation counts were defined as tumor mutation burden. The GSE65858 (N = 267) from GEO was used as the validation cohort. The detailed information of clinical data and 21 m6A regulators are shown in Supplementary Tables S1–S3.
To elucidate the biological function of the m6A regulators in HNSCC, ConsensusClusterPlus package based on Euclidean distance and Wards linkage was employed to classify the patients into different distinct m6A subtypes (31). The “PCA” package was used to investigate gene-expression arrays among distinct m6A subgroups.
We utilized the gene set variation analysis (“GSVA”) package to investigate the biological processes among different m6A subgroups (32). The well-defined biological pathways and functions were derived from the Hallmarker gene set “c2.cp.kegg.v7.4.symbols.gmt” and “c5.go.v7.4.symbols.gmt” (download from MSigDB database v7.4) and IMvigor210CoreBiologies package (33, 34). The “ClusterProfiler” package was used to determine the Gene Ontology (GO) annotation of m6A-related genes (the cutoff value were q-value <0.05 and p-value <0.05) (35).
The relative abundance and activity levels of 23 immune cell types, obtained from published signature gene lists, were quantified using the single sample gene set enrichment analysis (ssGSEA) in R package GSVA (36, 37). In this study, the innate immune cells (including natural killer (NK) cells, CD56dim NK cells, CD56bright NK cells, dendritic cells (DCs), plasmacytoid dendritic cells (pDC), immature DCs (iDC), neutrophils, mast cells, and macrophages) and the adaptive immune cells (including B cells, T cells, CD8 T cells, T follicular helper (TFH), Th1, Th2, Th17, and Treg cells) comprised these signatures. In addition, we also used ssGSEA to explore the relationship between different m6A subtypes and immune-related pathways (such as cytolytic activity, T-cell co-stimulation, inflammation promoting, and parainflammation) in HNSCC expression profile of TCGA. The biosimilarity of the infiltrating immune cells and immune-related functions were estimated by the Gaussian fitting model.
Immunophenoscore (IPS) is an effective predictor of response to immune therapy via characterizing the determinant factors of cancer immunogenicity and antigenomes (37). The major histocompatibility complex (MHC)-related molecules, checkpoints or immunomodulators (CP), effector cells (EC), and suppressor cells (SC) developed the IPS scoring scheme. The sum of the four classes, calculated by averaging the Z-scores, was defined as the IPS. To predict immune checkpoint blockade response (ICB), we utilized the tumor immune dysfunction and exclusion (TIDE) method to model tumor immune evasion mechanisms, including the dysfunction of T-cell dysfunction in tumors with high infiltration of cytotoxic T lymphocytes (CTLs) and the prevention of T cell in tumors with exclusion of CTLs (38). For patients with higher TIDE score, cancers more likely to occur immune escape in these patients' body, thus ICB treatment might bring these patients less and short-lasting clinical benefits. The ESTIMATE algorithm was used to evaluate the tumor cellularity and tumor purity, which were composed of the TIME, based on expression matrixes. The analysis method is integrated in the “ESTIMATE “ package (39). We extracted these gene expression data from RNASeqV2 data to predict different infiltration levels of immune cells and the proportion of stromal cells. Tumor purity is the summation of stromal score and immune score from individual cases. The tumor sample with higher immune scores and lower tumor purity indicated that it had an abundance of immune cell infiltration.
The mutation annotation format (maf) file was analyzed using MutSigCV algorithm to identify significant SMGs based on the significance threshold, and the maf data were processed using the “maftools” package (40). MutSigCV measures the significance of nonsilent somatic mutations in a gene based on the background mutation rates by silent mutations (41). The false discovery rates (q-values) were then calculated, and genes with statistical significance (q-values ≤0.1) were set as SMGs (Supplementary Table S4). We then utilized the waterfall plot to visualize the mutation information of these significant SMGs in the TCGA cohort. Furthermore, we applied Fisher’s test to detect mutually exclusive or co-occurring ratio of m6A regulators. Mutational signatures were determined using the genomic data by adopting ExtractSignatures function that applies the Bayesian nonnegative matrix factorization-based framework (42). The optimal number of mutational signatures for the TCGA cohort could be detected by the SignatureEnrichment function and then it automatically assigned a given signature to each sample.
Patients were grouped into the three m6A clusters based on consensus clustering algorithm to identify differentially expressed genes (DEGs) associated with the m6A modification. The “limma” package was implemented to determine DEGs between three m6A clusters (43). The significance filtering cutoff of DEGs were set as the significance-adjusted p-value <0.001.
The overlapped DEGs identified from DEGs were used to perform the univariate Cox regression. The consensus clustering algorithm was utilized to define the number of gene clusters. The prognosis-related genes were extracted for further analysis. We then curated the final genes determined to conduct principal component analysis (PCA), and principal component 1 and 2 were extracted to construct the m6A score (44, 45). This method has an advantage of mainly focusing on positively correlated (or negatively correlated) genes. We then define the m6A score of each patient by adopting a similar formula based on the previous studies:
To determine the TMB of each patient, we also counted the nonsynonymous and synonymous mutation counts in the TCGA cohort (46). The association with TMB and m6A score was evaluated by Spearman’s method based on survival curve.
Mariathasan et al. constructed a panel of signatures that stored genes associated with various biological pathways, including (1) immune-checkpoint; (2) CD8 T-effector signature; (3) epithelial-mesenchymal transition (EMT), including EMT1, EMT2, and EMT3; (4) pan-fibroblast TGFb response signature (Pan-F-TBRS); (5) Fanconi anemia pathway; (6) homologous recombination; (7) base excision repair; (8) WNT target; (9) DNA damage repair; (10) mismatch repair; (11) nucleotide excision repair; (12) DNA replication; (13) antigen processing; (14) cell cycle regulation; (15) FGFR3-related genes; and (16) cell cycle (34, 47). We performed the Spearman’s method to explore the correlation between m6A score and these biological pathways.
We systematically performed a search for the ICB cohorts in the public databases, which could be available for detailed genomic and clinical information. Three independent anti-PD-L1 cohorts, IMvigor210 cohort (patients with metastatic urothelial cancer treated with atezolizumab) (34), Riaz et al. cohort (patients with metastatic melanoma treated with nivolumab) (48), and GSE78220 cohort (patients with metastatic melanoma treated with pembrolizumab) (49), were finally downloaded to analyze the predictive value of the m6A score for immunotherapy. The raw gene expression data of all cohorts were normalized.
We used the largest public pharmacogenomics database, Genomics of Drug Sensitivity in Cancer (GDSC), to predict the sensitivity of different drugs between high– and low–m6A score subgroups (50). The prediction process used was the “pRRophetic” package where the half-maximal inhibitory concentration (IC50) was estimated by ridge regression model based on gene expression profiles (51).
The statistical analyses were generated by using R version 4.1.0. To compare more than two groups, statistical significance was estimated by the Kruskal-Wallis test. Student’s t-test was used to compare the difference between two subgroups (52). Kaplan-Meier analysis generated the differences between m6A subgroups and prognosis via the “survminer” package. To determine the optimal cutoff values of each cohort, we used the “surv-cutpoint” function from the “survival” package. We adopted Cox regression to calculate the hazard ratios (HR) of m6A regulators and m6A-related genes. The multivariate Cox regression was used to evaluate the independent prognostic factors. The “forestplot” package was employed to show the results of Cox regression analysis for m6A score in the GEO cohort and TCGA cohort. We assessed the specificity and sensitivity of m6A score through drawing receiver operating characteristic (ROC) curve by using “pROC” and “‘timeROC” package. Also, the Spearman’s method was used to compute the correlation coefficient. All comparisons were presented by the p-values (two-tailed), whereby <0.05 indicated statistical significance.
We firstly identified 21 m6A regulators (including eight “writers,” 11 “readers,” and two “erasers”) in the TCGA cohort. Figure 1A and Supplementary Figure S1A summarize the significant biological processes and functions of 21 m6A regulators conducted by Metascape database. Then, the waterfall plot presented the incidence of copy number variations and the ratio of somatic mutations of 21 m6A regulators. A total of 72 of the 479 (15.03%) patients experienced mutations, mainly including missense mutation, splice site, and nonsense mutation. In Figure 1B, we found that KIAA1429 exhibited the highest mutation frequency, followed by LRPPRC and YTHDC2, while YTHDC1, YTHDF2, IGF2BP2, HNRNPC, METTL14, and RBM15B did not show any mutations. The results of mutation co-occurrence examined the significant relationship between IGF2BP3 and FTO, RBM15 and YTHDF1, LRPPRC and YTHDF2 (Supplementary Figure S1B). Further investigation revealed the CNV frequency of 21 m6A regulators. Most m6A regulators showed the prevalent deletions in copy number, while IGF2BP2, YTHDC1, and CBLL1 had a widespread frequency of CNV amplification (Figure 1C). Figure 1D shows the location of CNV of all m6A regulators on chromosomes. We further demonstrated that the expressions of ALKBH5, METTL3, YTHDF2, and YTHDC2 were significantly downregulated in tumor samples, and in contrast the expression of CBLL1, METTL14, IGF2BP2, IGF2BP3, KIAA1429, YTHDF1, and YTHDC1 were significantly upregulated in tumor samples (Figure 1E). Compared with normal tissues, m6A regulators (such as CBLL1 and YTHDF1) with amplificated CNV demonstrated markedly higher expression, and YTHDF2 and YTHDC2 with prevalent CNV deletions were markedly decreased in the tumor (Figures 1C, E). Spearman’s method presented the correlation among these m6A regulators (Supplementary Figure S1C). We found that IGF2BP2 showed no significant correlation with some m6A regulators (RBM15B, YTHDC2, RBM15, YTHDF2, and METTL14). We then ascertain the prognostic value of 21 m6A regulators using the Cox regression. The Cox regression revealed that YTHDC2 was a protective factor, significantly associated with prolonged overall survival rate, while HNRNPA2B1 was a risk factor (Supplementary Figures S1D, E). Based on these results, we demonstrated that m6A regulators had significant heterogeneity of genomic and transcriptomic alteration landscape between normal and HNSCC samples.
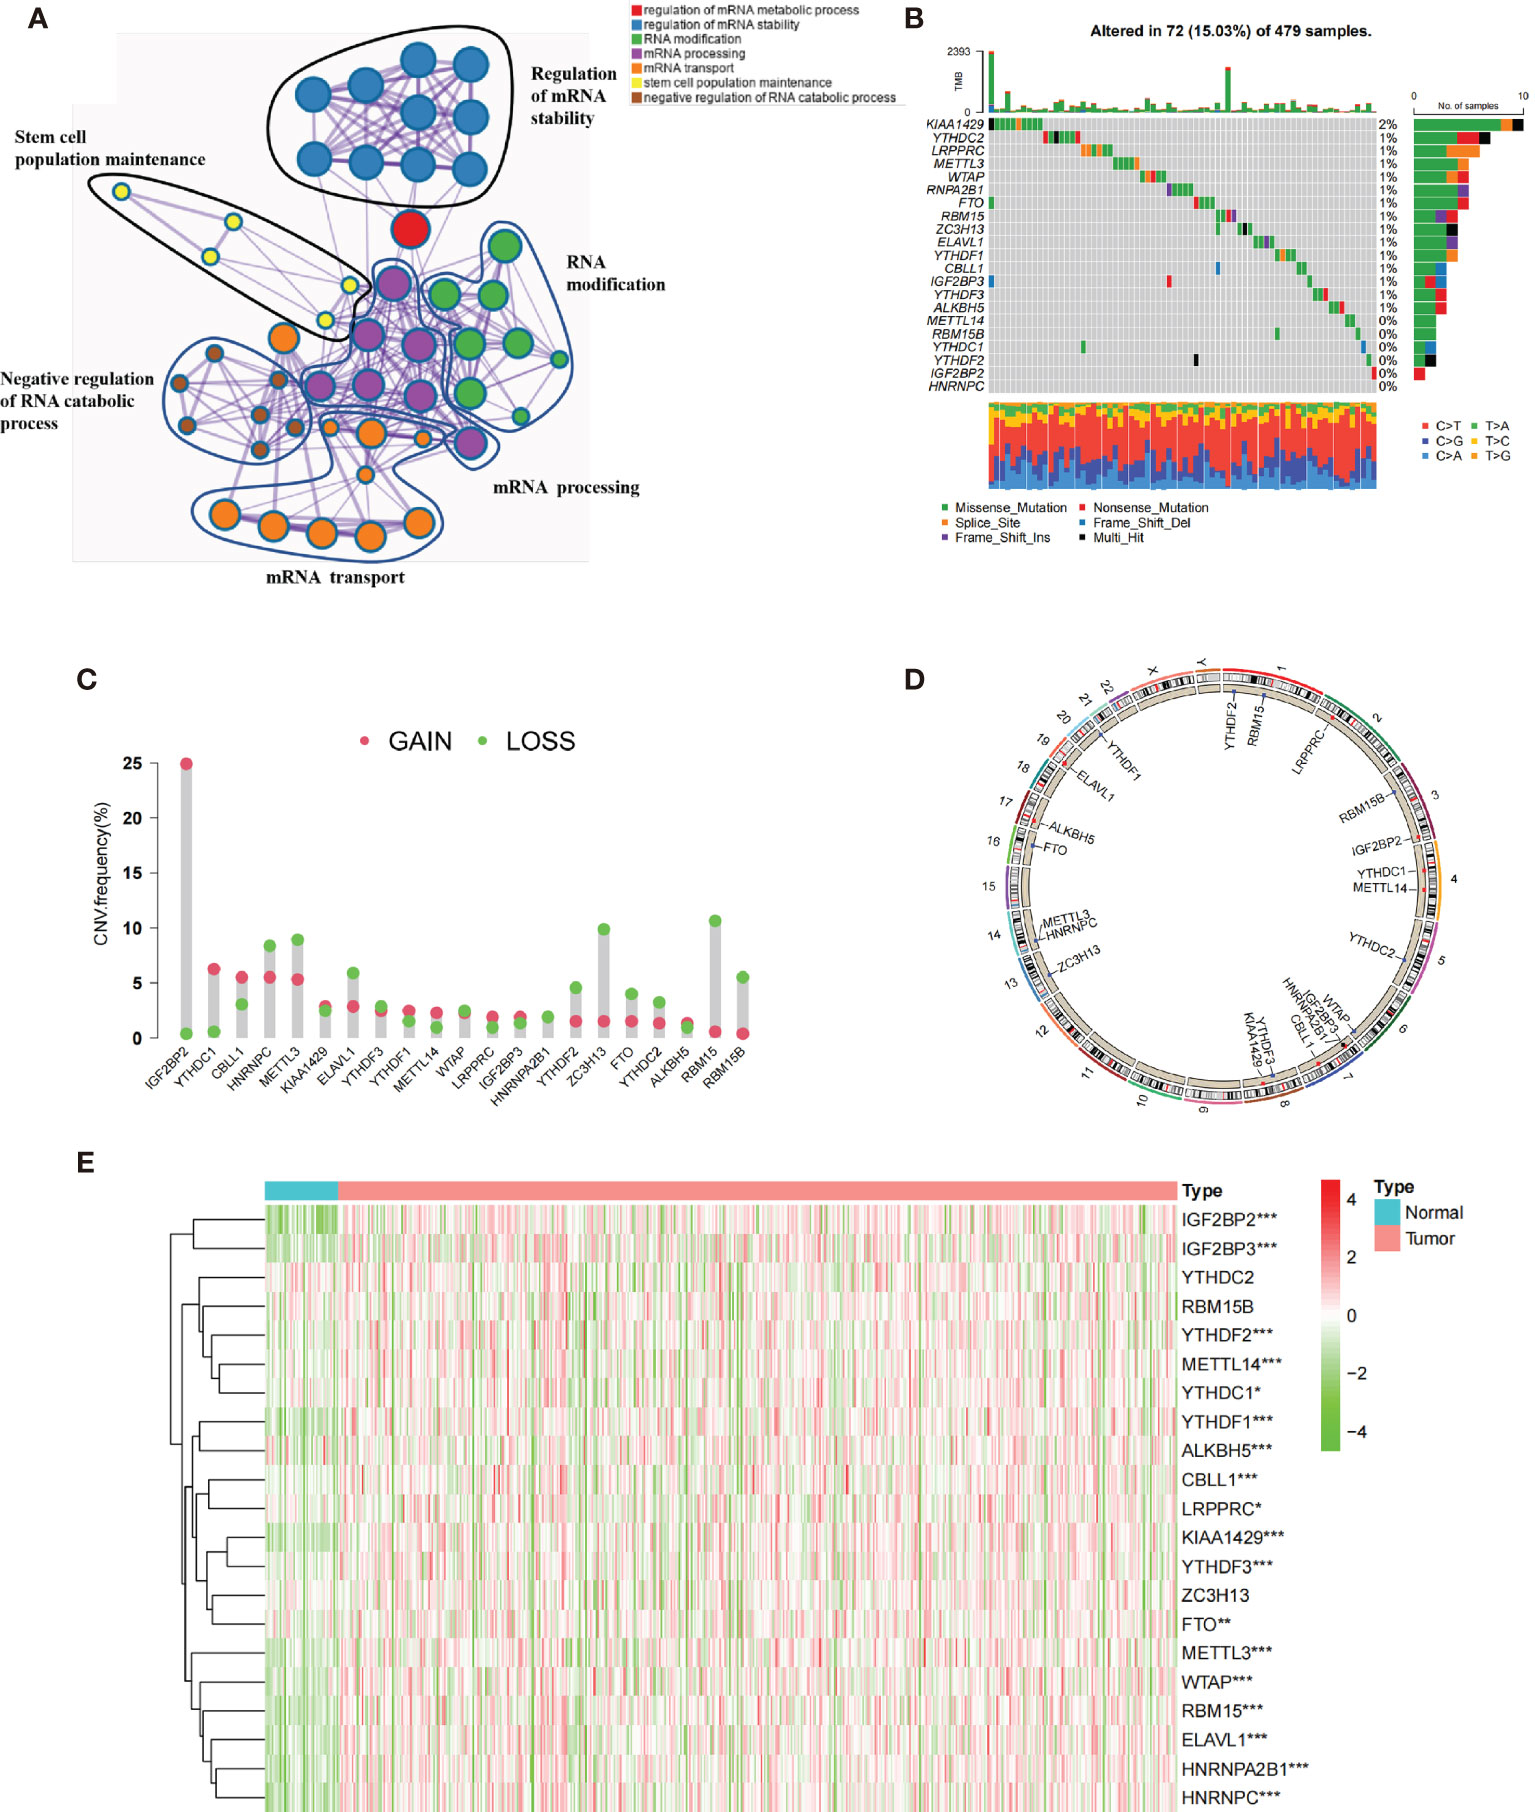
Figure 1 The genetic landscape of 21 m6A regulators in HNSCC. (A) The functional enrichment network of 21 m6A regulators visualized by Metascape. Different circles represented different annotations. (B) Seventy-two of the 479 patients showed different genetic alterations, including missense mutation, splice site, and nonsense mutation. (C) The CNV of 21 m6A regulators. The column represented the alteration frequency. The green dots represented deletion of CNV. The pink dots represented amplification of CNV. (D) The location of CNV alteration of m6A regulators in cell. (E) The different expression level of 21 m6A regulators between normal and HNSCC (*p < 0.05; **p < 0.01; ***p < 0.001).
The TCGA dataset with available survival and clinical information were enrolled into the training cohort. The regulator network comprehensively depicted the whole interactions of 21 m6A regulators and their prognostic significance (Figure 2A). We found that not only eraser genes were all risk factors, while some of the writer and reader genes were favorable factors. Moreover, we demonstrated that the connection among 21 m6A regulators were positively correlated. These results indicated that cross-talk among the 21 regulators probably play critical roles in the formation of different m6A modifications and pathogenesis and progression in individual tumors. Based on the hypotheses, we utilized unsupervised clustering to classify samples into different m6A clusters. Moreover, we could completely distinguish one m6A cluster from other clusters based on PCA (Figure 2B). Accordingly, three distinct m6A clusters were eventually identified, including 128 cases in m6A cluster A, 247 cases in m6A cluster B, and 121 cases in m6A cluster C (Figure 2C; Supplementary Figures S2A, B).
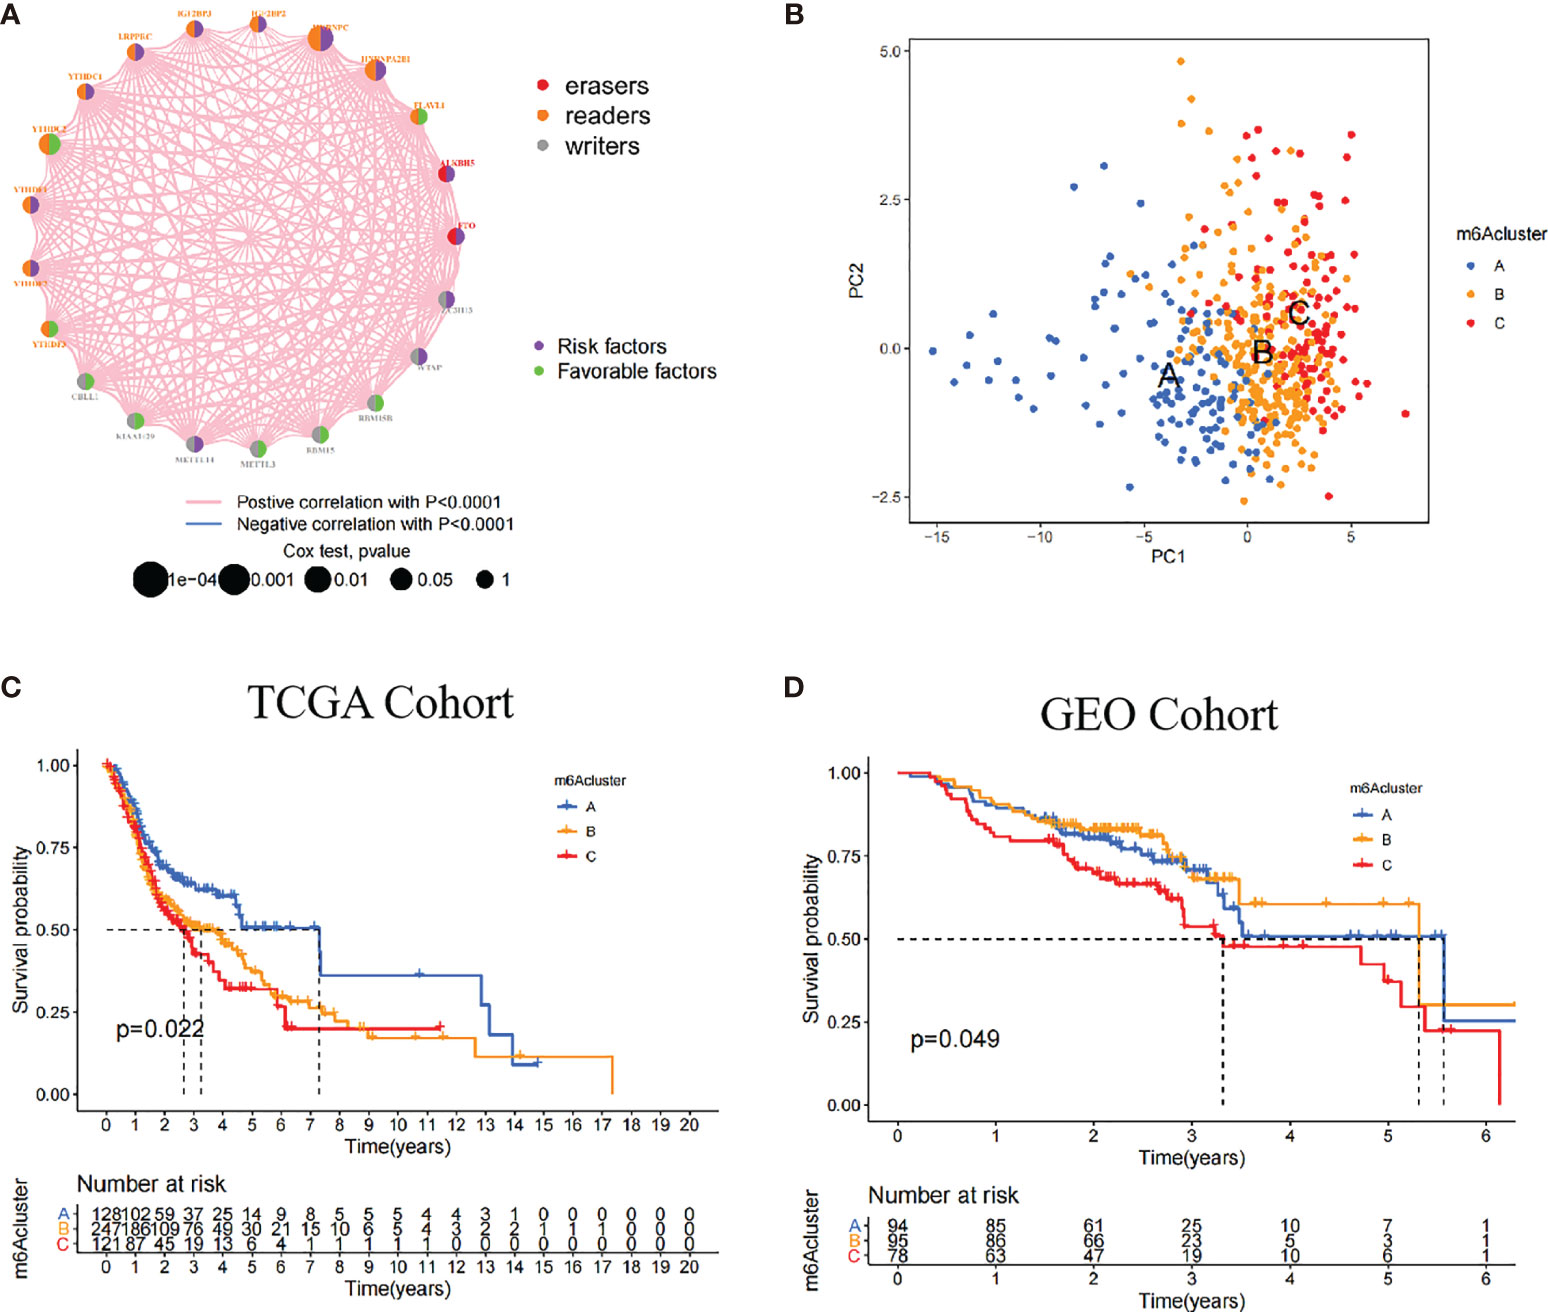
Figure 2 Patterns of m6A methylation modification. (A) The interaction of 21 m6A regulators in HNSCC. The different RNA modifications were depicted by different colored circles. Readers, orange; writers, gray; erasers, red. Favorable factors were indicated by the green circle, and risk factors were indicated by the purple circle. (B) The remarkable difference between different three m6A clusters was plotted via principal component analysis. (C) Kaplan-Meier curves of overall survival (OS) in TCGA cohort with three m6A clusters (p = 0.022). (D) Kaplan-Meier curves of overall survival (OS) in GEO cohort with three m6A clusters (p = 0.049). The patients in m6A cluster C showed worse OS than in other clusters.
Among these clusters, m6A cluster A, m6A cluster B, and m6A cluster C, patients in m6A cluster A had an advantage in overall survival rate, whereas m6A cluster C revealed the poorer prognosis in the TCGA cohort (p = 0.022). In the validation cohort (GEO cohort), the identical analyses obtained similar results (p = 0.049, Figure 2D; Supplementary Figure S2C).
In the TCGA cohort, multivariate Cox regression further demonstrated that patients in m6A cluster C had worst overall survival rate after adjusting clinical parameters [m6A cluster C vs. m6A cluster A, HR, 1.68 (95% CI, 1 to 2.8), p = 0.049, Supplementary Figure S4A]. However, there was no statistical significance between m6A cluster C and prognostic outcome in the GEO cohort [m6A cluster C vs. m6A cluster A, HR, 1.47 (95% CI, 0.88 to 2.47), p = 0.143, Supplementary Figure S4B]. We also noticed that the 21 m6A regulators showed different significances between the three m6A clusters. In detail, KIAA1429 and FTO were significantly elevated in m6A cluster A; CBLL1, IGF2BP2, and IGF2BP3 were significantly elevated in m6A cluster B; and WTAP, ALKBH5, and RBM15 were significantly elevated in m6A cluster C (Supplementary Figures S2B, C).
To explore the biological functions and pathways underlying these m6A clusters, we performed GSVA enrichment analysis against the GO and KEGG gene sets (Supplementary Figures S3A, B). As shown in the GSVA analysis, m6A cluster A was markedly enriched in immune activation-related pathways. Intriguingly, m6A cluster C was markedly associated with carcinogenic pathways, such as DNA replication, nucleotide excision repair, and mismatch repair pathways. Whereas, m6A cluster B was highly enriched in both carcinogenic and stromal-related signaling pathways.
The heatmap visualized the infiltration levels of 23 immune cells among three m6A clusters (Figure 3A). Antitumor lymphocyte cells, such as activated CD8+ T cells, and NK cells, were mainly enriched in the m6A cluster A. However, regulatory T cells and type 1/2/17 T helper cells were mainly enriched in the m6A cluster B. To our surprise, innate immune cells including natural killer cell, macrophage, eosinophil, mast cell, and MDSC were increased in the m6A cluster C. To explore the subsets of immune cell in TIME, CIBERSORT package was further used to characterize the immune cell infiltration based on the expression file. We observed the consistent result in the Figure 3B. Previous studies revealed a novel immune phenotype, immune-excluded phenotype, with an abundance of immune cells, retained in the tumor stroma rather than in the parenchyma. Therefore, we speculated that the m6A cluster B with higher stromal score exhibited an ineffective antitumor immune response (Figure 3E). Cancer-related pathway analyses demonstrated that the m6A cluster B was related to TGF-β and WNT-target pathways, which further corroborated with our hypothesis (Supplementary Figures S4C, D). In Figure 3C, we found that m6A cluster A exhibited the highest immune scores, followed by m6A cluster B and m6A cluster C. Conversely, m6A cluster C had a higher tumor purity than m6A cluster B and m6A cluster A, suggesting that tumors in m6A cluster B and m6A cluster A are surrounded by more immune cells and stromal cells (Figure 3D).
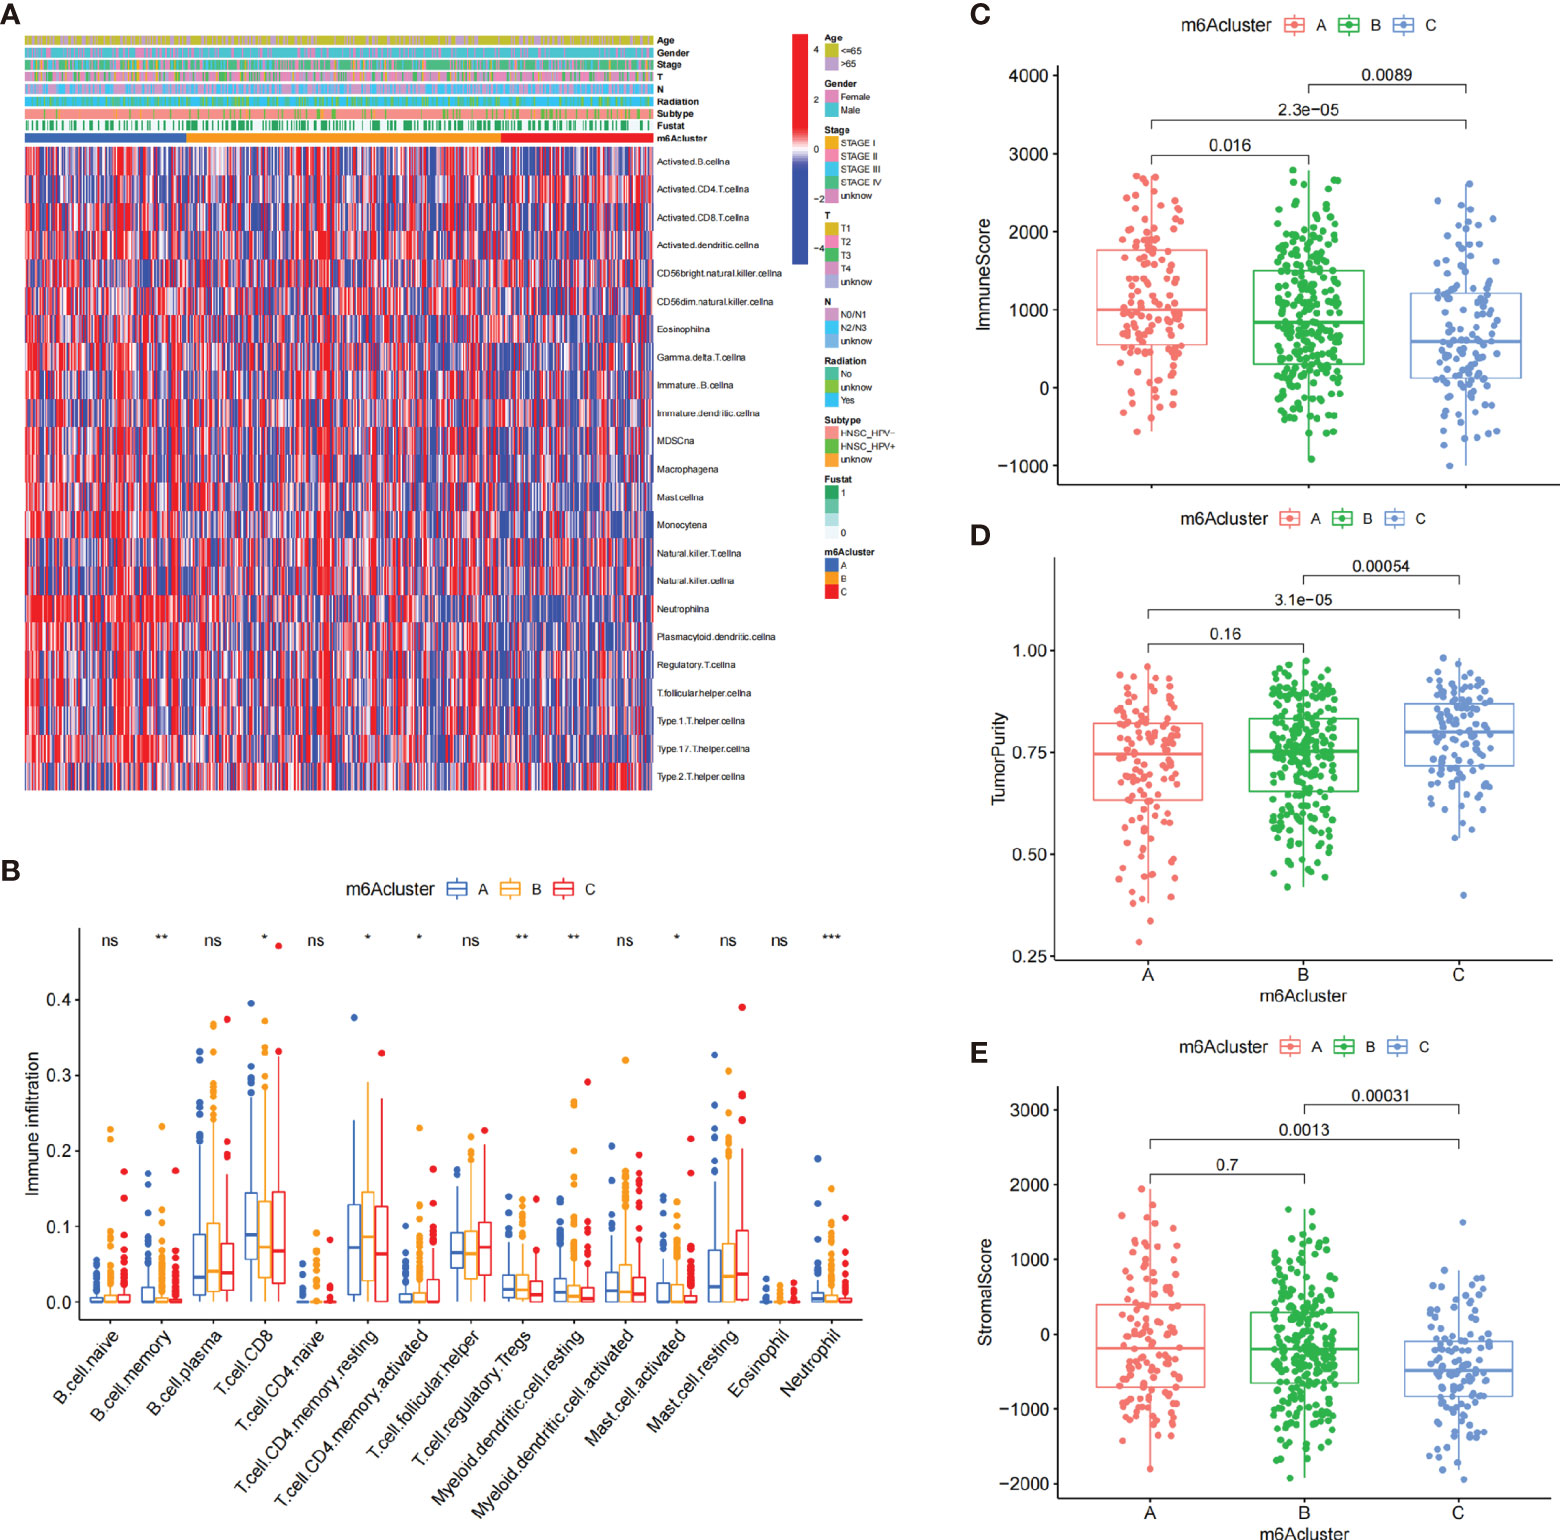
Figure 3 The characteristics of TIME in three m6A clusters. (A) The heatmap showed the result of the consensus clustering in the TCGA cohort. Clinical information included age, gender, survival status, HPV subtypes, radiation, and stage. (B) The infiltration of immune cells in the three m6A clusters using the CIBERSORT. *p < 0.05; **p < 0.01; ***p < 0.001. (C–E) The analysis of the immune score (C), tumor purity (D), and stromal score (E) among three m6A clusters. ns, no significance.
Then, we examined the association between 21 m6A regulators and immune cells via Spearman’s method. We focused on the regulator HNRNPA2B1, an independent prognostic risk factor based on the above results (Supplementary Figures S1D, E), which was negatively correlated with numerous immune cells (Supplementary Figure S5A). The ESTIMATE showed that low-expression subgroup of HNRNPA2B1 exhibited higher immune score, which confirmed the above findings (Supplementary Figure S5B).
We also found that low-expression subgroup of HNRNPA2B1 exhibited a significant increased among 23 immune cells (Supplementary Figure S5C). The low-expression subgroup of HNRNPA2B1 also exhibited elevated expression of HLA molecules (Supplementary Figure S5D). Subsequent function enrichment analyses found that low-expression subgroup of HNRNPA2B1 exhibited an obvious enhancement in immune activation including T-cell costimulation and type I/II IFN responses, which hinted that the expression of HNRNPA2B1 might affect the efficacy of immunotherapy (Supplementary Figure S5D). Thus, we investigated two anti-PD-L1 immunotherapy cohorts (IMvigor210 cohort and GSE78220 cohort). In the IMvigor210 cohort, patients with low expression of HNRNPA2B1 had prolonged overall survival rate (Supplementary Figure S5E). In the GSE78220 cohort, there was no significant survival trend (Supplementary Figure S5F). Therefore, we speculated that HNRNPA2B1-mediated m6A methylation modification may enhance the antitumor response via promoting the activation of immune cells.
To identify the biological behaviors (e.g., genetic alterations and expression perturbations) of these m6A clusters, we fixed attention on the m6A-related transcriptional expression alterations across three m6A clusters in HNSCC. The Venn diagram determined 4,269 overlapping differentially expressed genes (DEGs) (Figure 4A). A total of 311 DEGs related to prognosis were considered the representative m6A-related genes (Supplementary Table S5). GO enrichment analysis revealed that the biological processes related to RNA transcription and modification were significant functions (Figure 4B). Similar to the above analysis, unsupervised clustering method based on the expression of these 311 DEGs separated patients into three stable gene clusters (gene clusters A–C) in the TCGA cohort (Supplementary Figure S6A). Figure 4C demonstrates that three m6A gene cluster had different clinicopathological features. We found that patients in m6A gene cluster C exhibited advanced clinical stage. In addition, patients receiving radiotherapy were mainly concentrated in the m6A gene cluster A, while patients with negative HPV subtype were represented by the m6A gene clusters B and C.
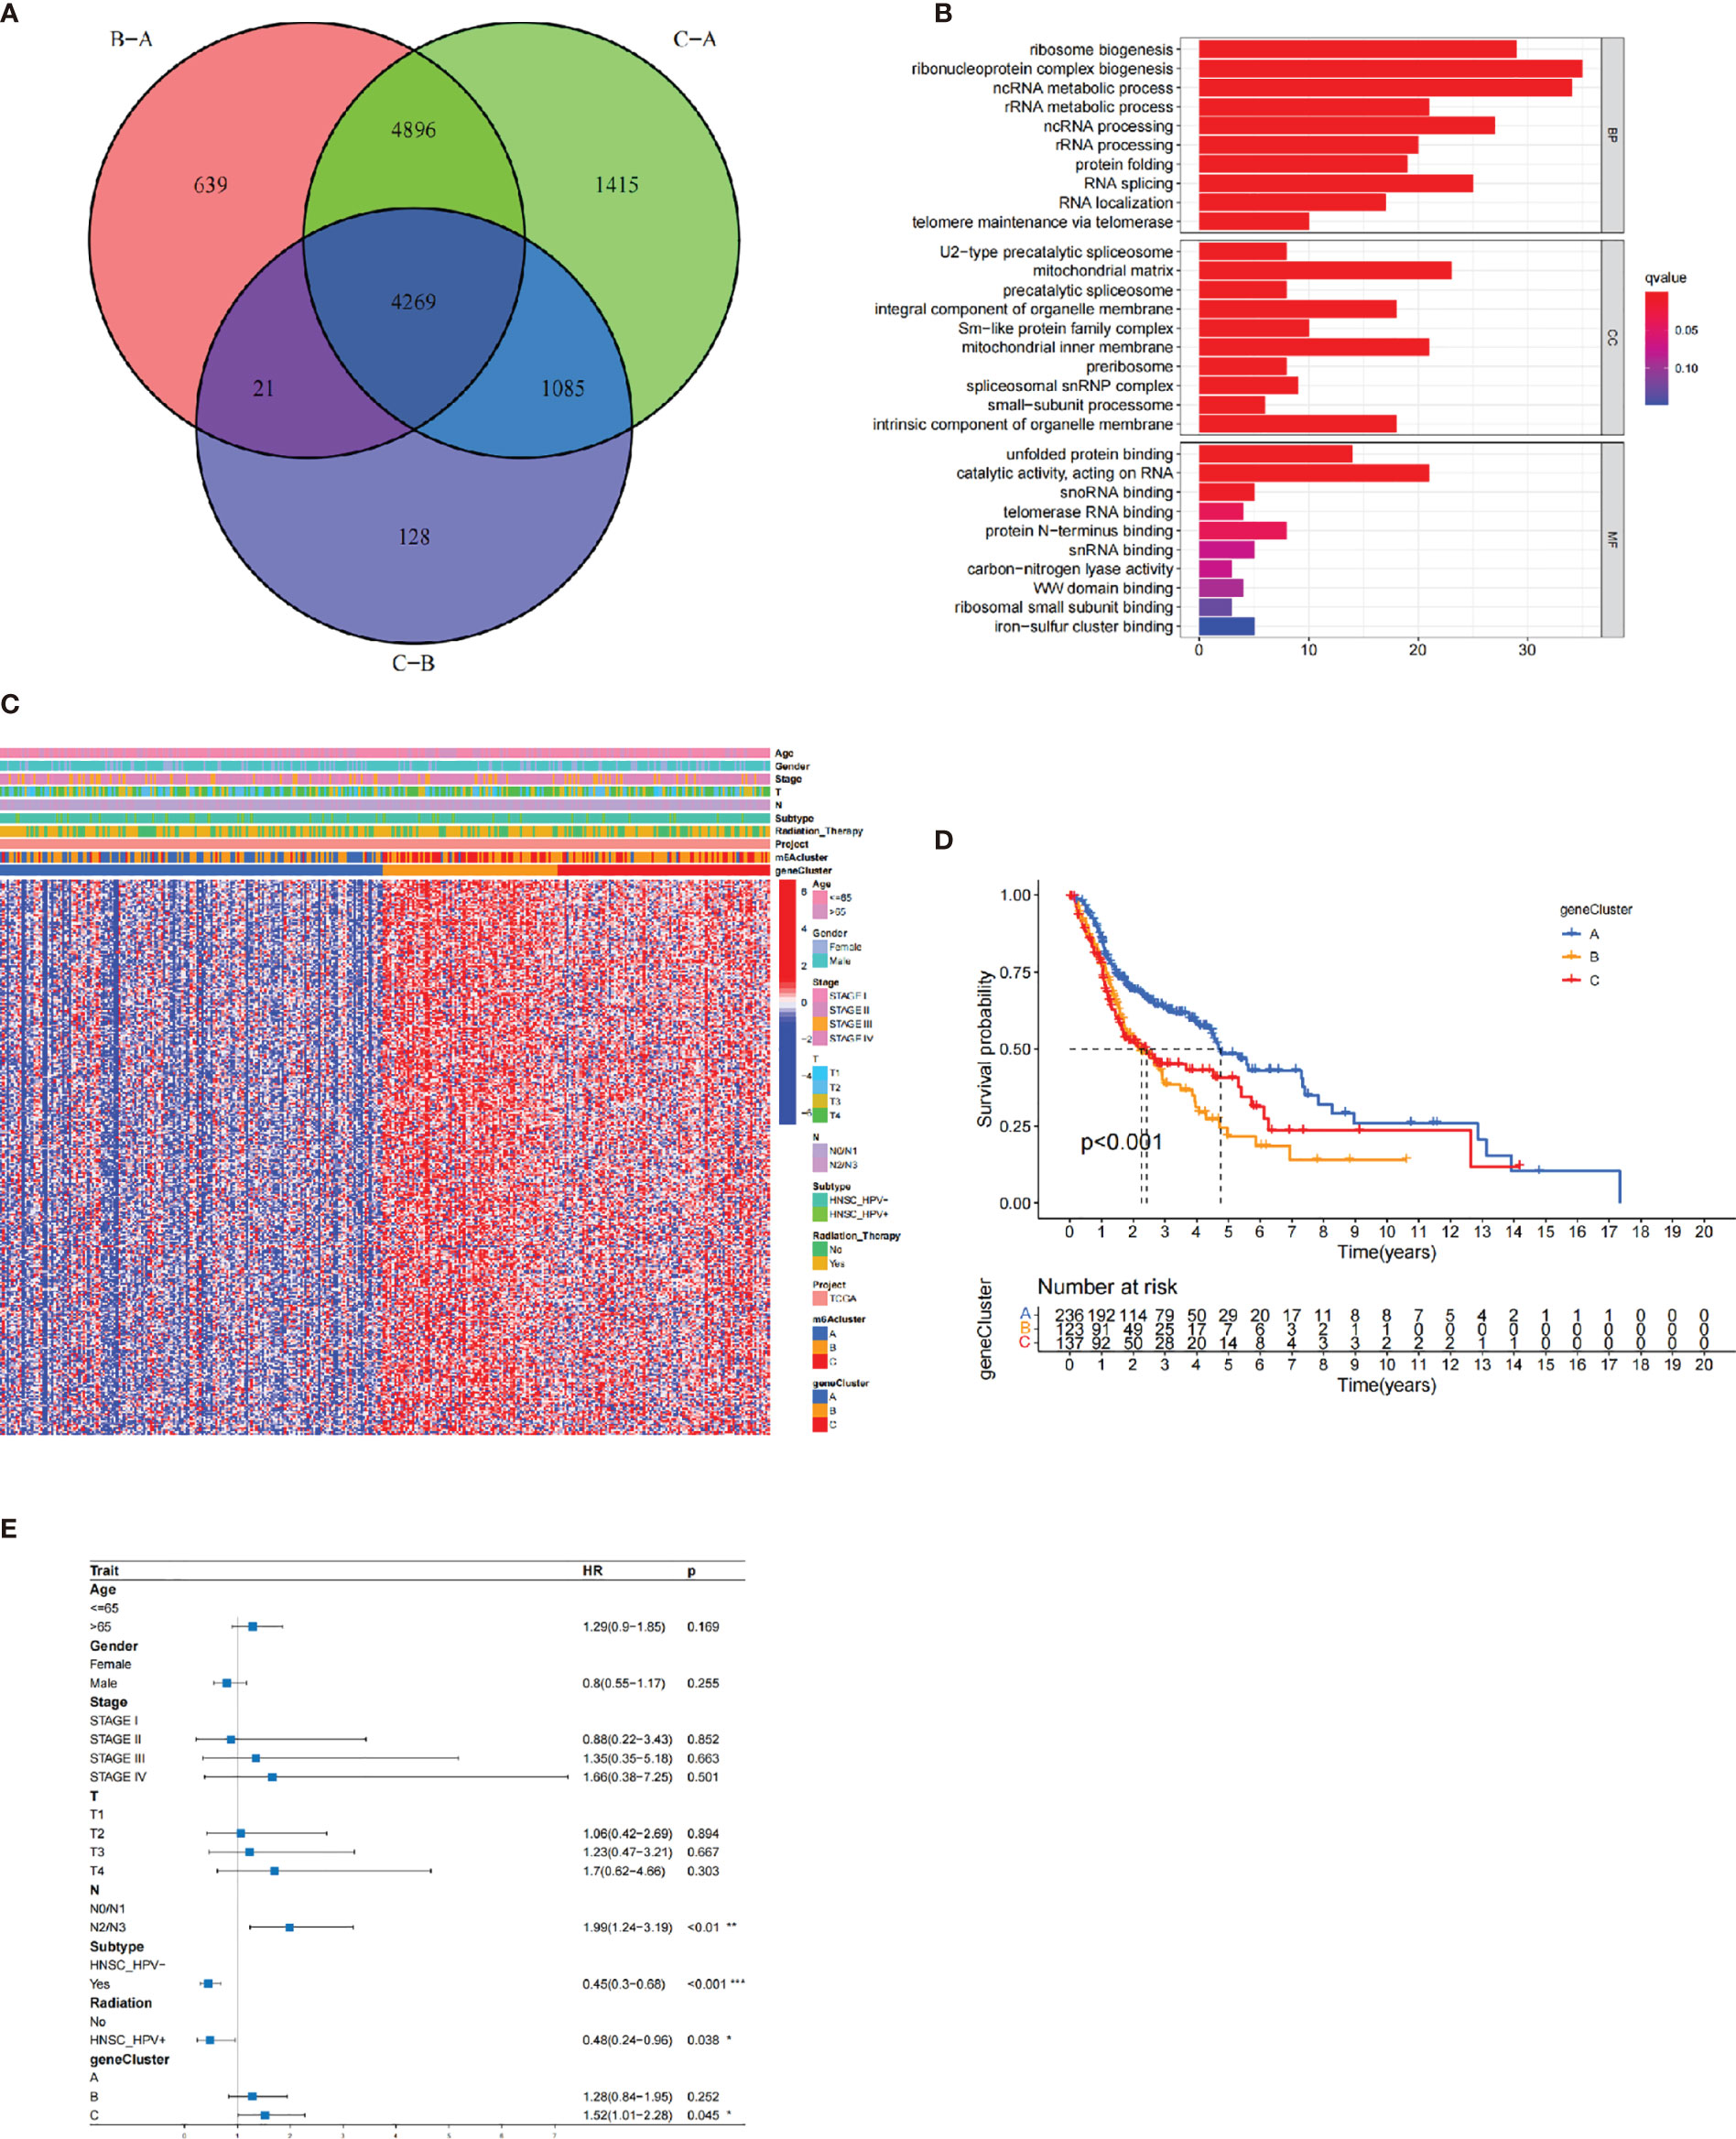
Figure 4 The construction of m6A gene clusters and functional annotation. The 4,269 differentially expressed genes (DEGs) among three m6A clusters were shown in the Venn plot. (B) GO enrichment analysis of 311 prognosis-related DEGs. (C) The consensus clustering based on prognosis-related DEGs classified patients into three gene clusters, respectively. (D) The Kaplan-Meier curves of the three m6A gene clusters (p < 0.001). (E) The multivariate Cox regression-estimated prognostic value of m6A gene clusters in TCGA cohort.
The survival analysis further indicated that the three m6A gene clusters had significant prognostic differences in HNSCC samples. m6A gene cluster A was proven to be related to better prognostic outcome, while patients in m6A gene cluster C was associated with poorer outcome (Figure 4D). The Cox regression determined m6A gene cluster C (vs. m6A gene cluster A) as an independent risk factor after considering age, gender, stage, HPV subtype, and radiotherapy [HR, 1.52 (95% CI, 1.01 to 2.28), p = 0.045; Figure 4E]. Supplementary Figure S6B observes the different expression levels of the 21 m6A regulators, which were consistent with our expected results.
Accordingly, the above results showed that the m6A regulators played a nonnegligible role in regulating prognosis and TIME. However, these analyses were only based on the overall population and could not interpret the heterogeneity and complexity of m6A regulators individually. Based on these identified m6A-related genes, we developed a scoring scheme, considered m6Ascore, to quantify individual patients.
The alluvial diagram visualized the quantification changes of patients (Figure 5A). These results illustrated that m6A gene clusters B and C were linked to higher m6A score, whereas m6A gene cluster A exhibited lower m6A score. Notably, m6A cluster C showed the highest m6A score, followed by m6A cluster B, while m6A cluster A revealed the lowest m6A score (Supplementary Figure S7A). Furthermore, we conducted the analysis of Spearman’s correlation to illustrate the patterns of m6A regulators. The heatmap indicated that m6A score was positively correlated with WNT target signatures, cell cycle signatures, and EMT pathways (Figure 5B).
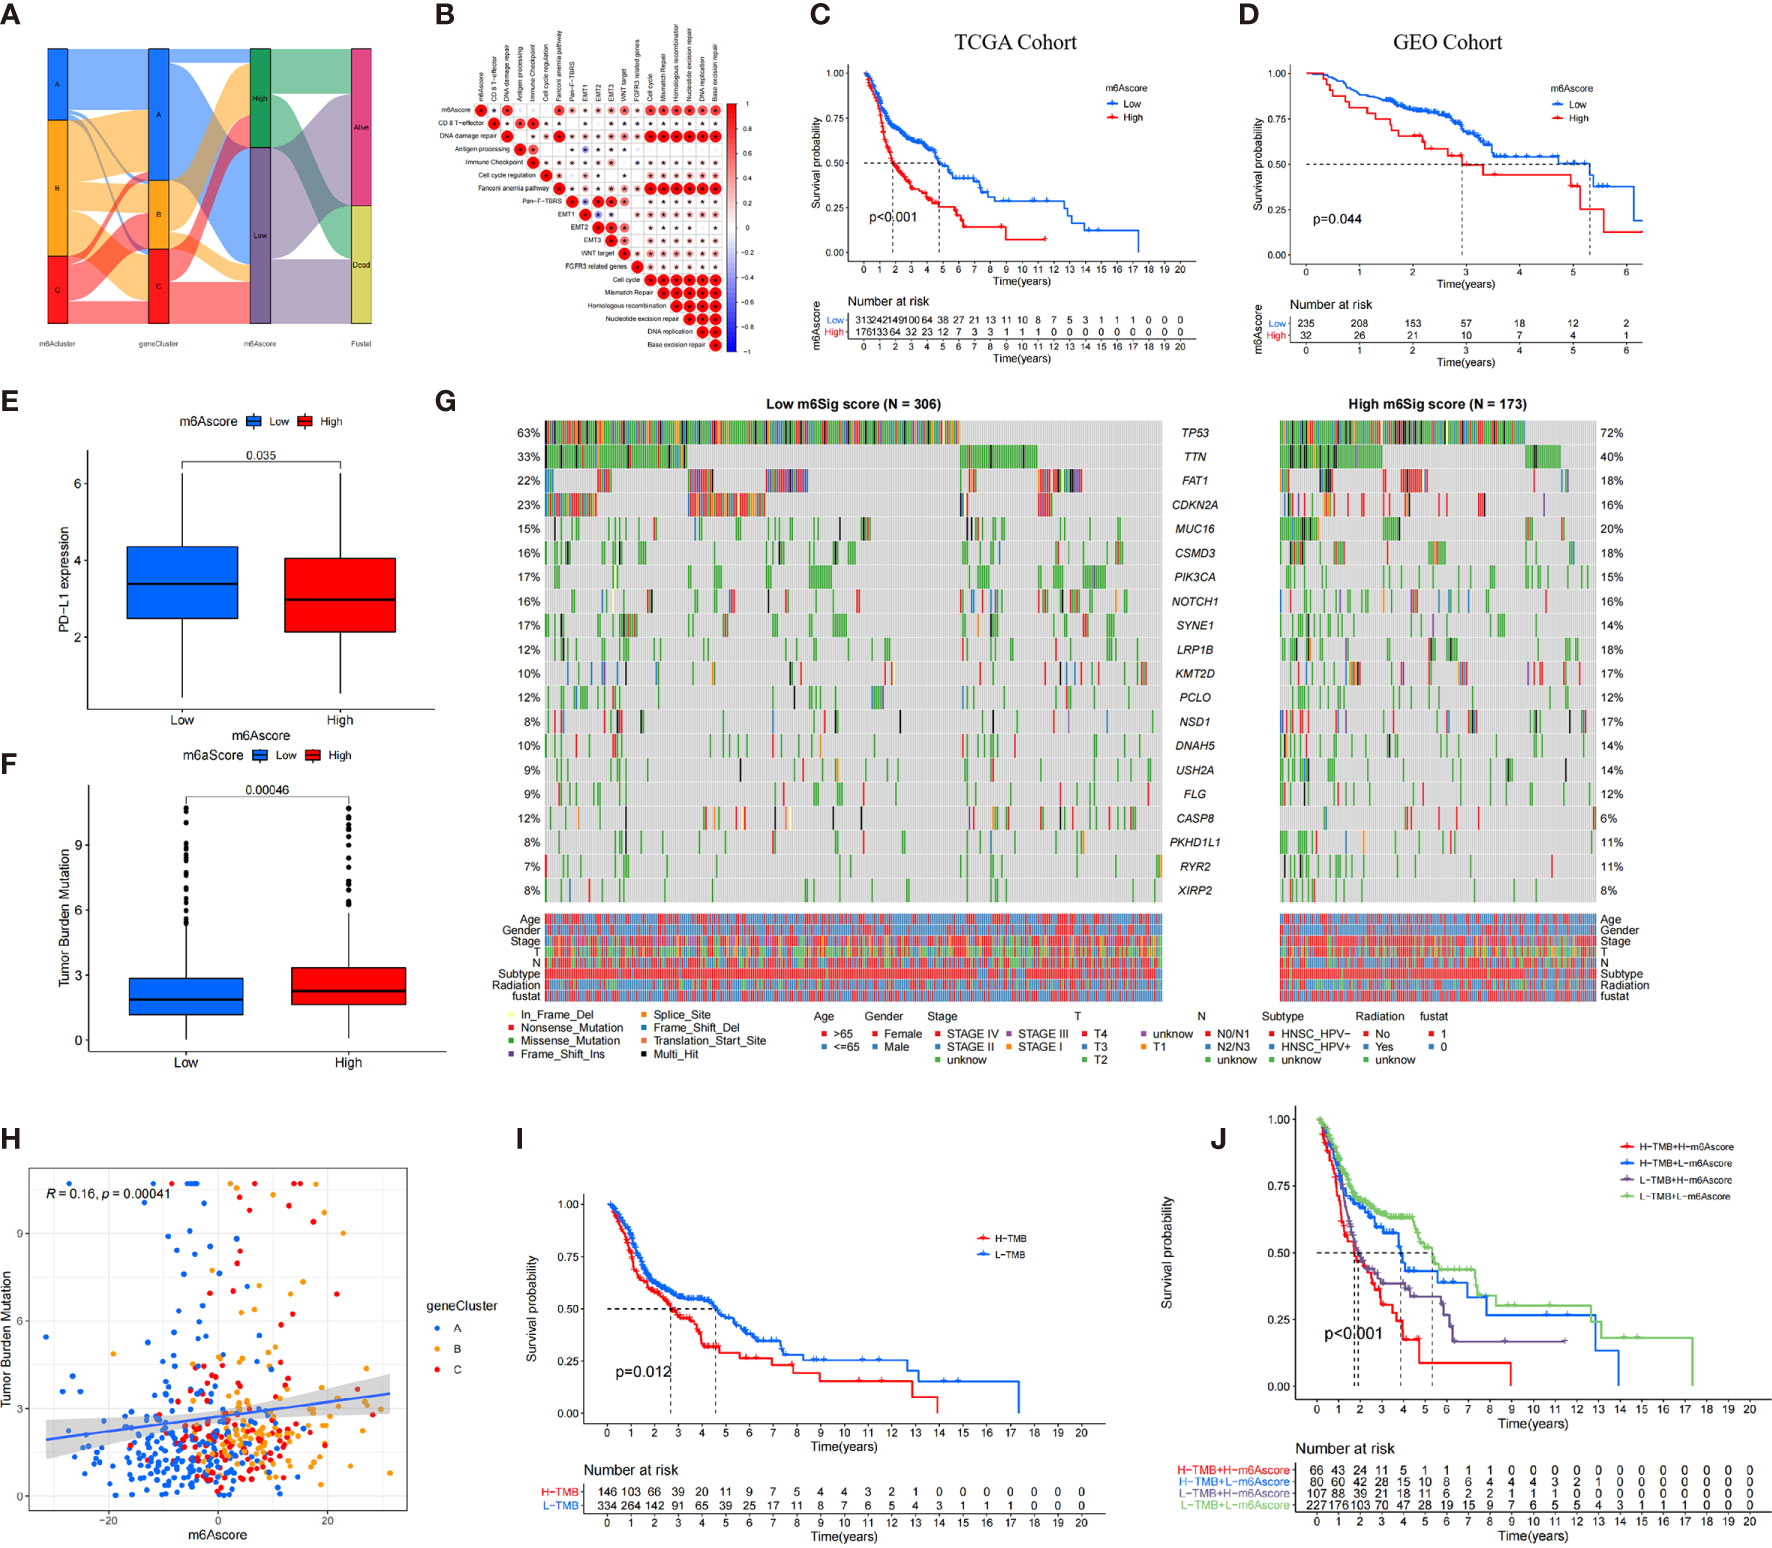
Figure 5 The construction of m6A score and explore its relevant genetic features. (A) Alluvial diagram of m6A clusters in groups with m6A geneCluster, m6A score, and survival status. (B) Correlations between m6A score and the known biological gene signatures using Spearman analysis. (C, D) The survival analysis of patients in high and low m6A score subgroups in the TCGA cohort (C) and GEO cohort (D). (E) Comparison of PD-L1 expression level in high versus low m6A score subgroups. (F) The distribution of tumor mutation load (TMB) in high versus low m6A score subgroups. (G) The waterfall of mutational landscape in TCGA stratified by low (left panel) and high m6Sig score (right panel) subgroups. Each column represented one patient. Age, Gender, Survival status, HPV subtypes, Radiation, Stage were shown as patient annotations. (H) There was a significant positive correlation between the m6A score and TMB (R = 0.16, p < 0.001). (I) Kaplan-Meier curves for patients in high and low TMB subgroups. H, high; L, Low (P=0.012). (J) Kaplan-Meier curves for patient in the TCGA cohort stratified by both m6A score and TMB. H, high; L, Low; TMB, tumor mutation load (P < 0.001).
There was an inverse trend between the m6A score and the immune score (R = −0.35, p = 2.3e−16) and stromal score (R = −0.08, p = 0.076), which demonstrated the crosstalk between m6A score and TIME (Supplementary Figure S7B, C). Compared with the high m6A score, patients in low–m6A score subgroup had higher relative level of immune checkpoint molecules and CD8 effector cells. However, high m6A scores were significantly associated with stromal pathways (Supplementary Figure S7D).
Furthermore, we determined the prognostic value of m6A score in predicting patients’ survival outcome. Based on the cutoff value of 3.3615, we divided patients into low– or high–m6A score subgroups. As expected, patients with low–m6A score were associated with a prominent prognosis (p < 0.001, Figure 5C), and the ROC validated the predictive accuracy of the m6A score (AUC = 0.634, Supplementary Figure S7E). Integrating the clinical information (e.g., age, gender, stage, HPV subtype, and radiotherapy), multivariate Cox regression confirmed that the high m6A score was an independent prognostic factor for evaluating survival outcome (high m6A score vs. low m6A score; HR, 0.61 [95% CI, 0.44 to 0.86], p < 0.01, Supplementary Figure S7G).
We also investigated the relationship between the m6A score and level and found that the expression level of PD-L1 was elevated in the low–m6A score subgroup than in the high m6A score subgroup (Figure 5E). The constructed m6A score was validated in the GEO cohort by integrating clinical genomic information. The m6A score displayed the potential predictive value in GEO cohort (AUC = 0.672, Supplementary Figure S7F), and patients in low–m6A score subgroup had a better survival outcome (p = 0.044; Figure 5D). Multivariate Cox regression also confirmed that the m6A score was an independent prognostic biomarker in GEO cohort [HR, 0.52 (95% CI, 0.3 to 0.92), p = 0.024; Supplementary Figure S7H]. We then further analyzed the distribution of somatic mutated gene between low– and high–m6A score subgroups. As shown in Figure 5G, high m6A score subgroup presented more tumor somatic mutations than the low–m6A score group. Increasing studies have demonstrated and there was a link between the TMB and immunotherapy responses. Consequently, we further explored the distribution of TMB in low– and high–m6A score subgroups. We confirmed that the low–m6A score group had lower TMB frequencies (Figure 5F). The m6A score was markedly positively correlated with TMB (R = 0.16, p = 0.00041; Figure 5H). In addition, we found that patients with low TMB frequencies demonstrated a survival benefit (p = 0.012; Figure 5I), while patients with low m6A score showed significant survival advantages among patients with low TMB frequencies (Figure 5J).
The prognostic value of m6A score subjected to various clinical parameters was also estimated. We found that patients in low m6A score had a better survival outcome than those in m6A score among different subgroups (Supplementary Figure S8). Furthermore, the OS of patients with radiotherapy in the high– and low–m6A score groups was superior, but patients with low m6A score benefited significantly more than those with high m6A score from radiotherapy. Accordingly, patients with low m6A score were more likely to benefit for survival from radiotherapy than those with high m6A score.
TIDE and IPS served as novel imunotherapeutic predictors and are strongly suggested to evaluate the response of immunotherapy to patients. We revealed that TIDE was significantly decreased in the low–m6A score subgroup, and IPS was significantly elevated in the low–m6A score subgroup (IPS: p = 0.0014, Supplementary Figure S9A; TIDE: p = 0.0035, Supplementary Figure S9B). In detail, the levels of the four groups were significantly increased in the low m6A score group (Supplementary Figures S9C–F).
We investigated whether the m6A score could predict immunotherapy response to ICB treatment based on three cohorts. Among IMvigor210 cohort and Riaz et al. cohort, patients with low m6A score exhibited clinical benefits markedly (IMvigor210 cohort, p < 0.001, Figure 6A; Riaz et al. cohort, p = 0.048, Figure 6J). In GSE78220 cohort, the survival curve presented an opposite result due to the small number of samples (Figure 6H). The immunotherapeutic advantages and anti-PD-1/L1 response to patients were confirmed in the low– and high–m6A score subgroups (Figures 6B, C, I, K).
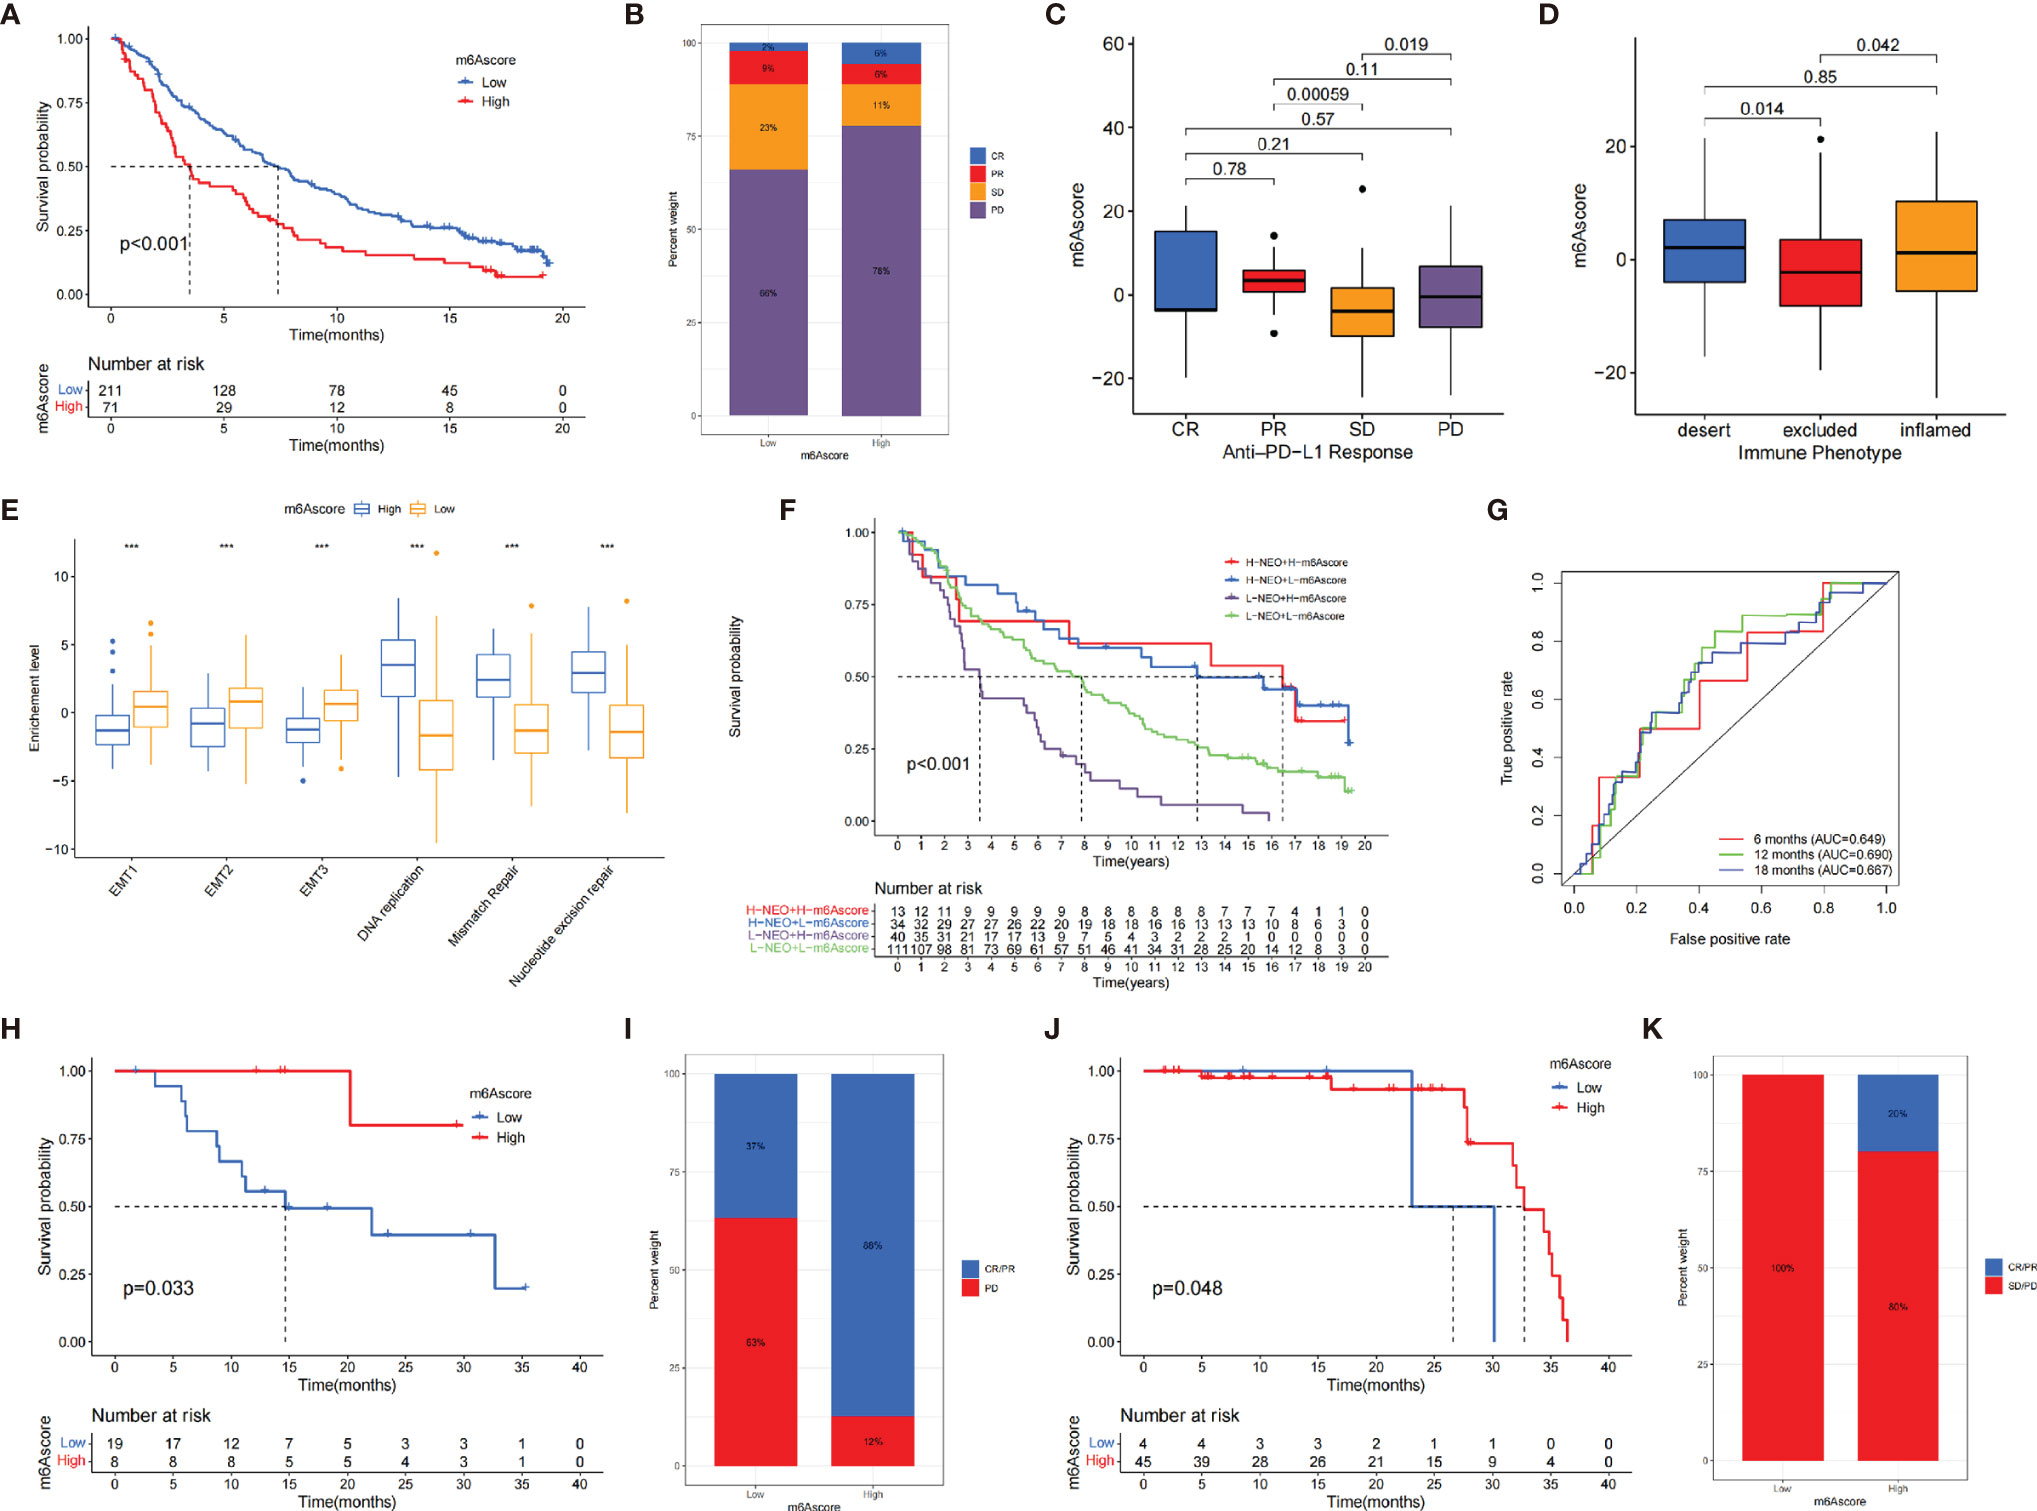
Figure 6 The role of m6A score in anti-PD-1/L1 cohorts. (A) The survival analysis of patients in low and high m6A score subgroups in the IMvigor210 cohort (p < 0.001). (B) The proportion of patients with different response to immunotherapy in IMvigor210 cohort. SD, stable disease; PD, progressive disease; CR, complete response; PR, partial response. (C) Distribution of m6A score in different response groups. (D) The tumor immune phenotypes were validated in IMvigor210 cohort. (E) Differences in EMT pathways and DNA repair-related pathways between low and high m6A score groups (*p < 0.05; **p < 0.01; ***p < 0.001). (F) The survival analysis of patients who received immunotherapy stratified by both m6A score and neoantigen burden. H, high; L, low; NEO, neoantigen burden (p < 0.001). (G) The AUC of the quantification of m6A score in patients treated with immunotherapy (6 months, AUC = 0.649; 12 months, AUC = 0.690; 18 months, AUC = 0.667). (H) The survival analysis of patients in low– and high–m6A score subgroups in the GSE78220 cohort (p = 0.033). (I) The proportion of patients with different responses to immunotherapy in GSE78220 cohort. (J) The survival analysis of patients in low– and high–m6A score subgroups in the Riaz et al. cohort (p = 0.048). (K) The proportion of patients with different immunotherapy response in Riaz et al. cohort.
We investigated the difference between m6A score and three immune phenotypes in the IMvigor210 cohort and found that lower m6A score was remarkably associated with excluded immune phenotype, indicating that immune checkpoint inhibitors are less effective for these patients (Figure 6D). Furthermore, we revealed that EMT were significantly activated in tumors with low m6A score (Figure 6E). Figure 6F indicates that individuals with a combination of high m6A score and low neoantigen burden showed a poorer prognosis. The ROC curves implied that m6A score was a robust biomarker to assess clinical prognosis of patients under immunotherapy (Figure 6G). In summary, our work strongly demonstrated that m6A regulators was significantly correlated with TIME and mediated prognostic response to immunotherapy.
Considering the frequent use of chemotherapy in the treatment of HNSCC, we further explored the response of patients with 138 different types of drugs. In detail, the GDSC dataset was used to predict the IC50 of the selected drugs based on the “pRRophetic” package. A total of 54 drugs demonstrated obviously lower IC50 in the low–m6A score group (Supplementary Figure S10). Based on the guidelines of the National Comprehensive Cancer Network (53) and Chinese Society of Clinical Oncology (54), we summarized all the drugs used for the treatment of head and neck tumor (including cisplatin, methotrexate, cetuximab, afatinib, capecitabine, oxaliplatin, carboplatin, docetaxel, nivolumab, camrelizumab, gemcitabine, nimotuzumab, 5-FU, paclitaxel, pembrolizumab, toripalimab, and nedaplatin). However, only paclitaxel presented obvious lower IC50 in the low–m6A score group. The finding suggested that patients with low m6A score were more sensitive to the treatment of paclitaxel than those with high m6A score in HNSCC.
Increasing evidence shows that m6A methylation, the most common posttranscriptional modification, exerts a crucial regulation on immunity, inflammation, as well as antitumor effects involving in interaction with various m6A regulators. Furthermore, since most studies just revealed the modulation of one or two regulators in the contexture of TIME, the comprehensive characteristics of immune cell mediated by integrated various m6A regulators is essential to elucidate the potential mechanism of m6A methylation in TIME. So far, the effects of m6A regulators on the TIME of HNSCC have not been explained comprehensively. Identifying the contribution of m6A regulators in TIME will enhance our understanding of antitumor response mediated by m6A methylation and facilitating more effective strategies on immunotherapy and chemotherapy.
In our study, we established three immune phenotypes based on 21 m6A regulators, which were correlated with survival outcomes and diverse TIME characterization in HNSCC. The m6A cluster A had high infiltration level of adaptive immune cells, corresponding to the immune-inflamed phenotype. The m6A cluster B had high infiltration level of innate immune cells and stroma cells, corresponding to the immune-excluded phenotype. The m6A cluster C was characterized by the inhibition of TIME, corresponding to the immune-desert phenotype. The immune-inflamed phenotype showed a large infiltration proportion of immune cell TIME (7). The immune excluded, known as nonhot tumors, means that immune cells were penetrated in the stroma rather than parenchyma. In our study, we found that the immune-desert phenotypes lacked activated and priming T cell, which were correlated with the immune escape demonstrated by previous studies (34, 55, 56). We also revealed that the m6A cluster A was significantly associated with elevated infiltration of lymphocyte, supporting its predictive value on immunotherapy. Based on the above results, we found m6A cluster B exhibited a significantly high level of stroma activation, including Wnt signaling pathway and TGF-β pathway, which impeded the activation of T-lymphocyte cells (57). Therefore, we presumed that patients in m6A cluster B may benefit from ICB treatment as well as TGF-β blockade treatment.
The overlapped DEGs identified from three m6A phenotype were significantly associated with RNA modification and immune-related pathways, suggesting that these DEGs were “true” m6A-related genes. We then further identified three transcriptomic subtypes based on m6A-related genes. This result demonstrated that all m6A regulators played a key role in shaping TIME. After, we established a scoring system, named m6A score, to distinguish heterogeneity of each patient derived from m6A modification, thus precisely guiding therapeutic strategies for HNSCC. As observed, the m6A modification pattern characterized by the immune-desert phenotype exhibited a higher m6A score, while the pattern characterized by the immune-inflamed phenotype showed a lower m6A score.
Further analyses showed that the m6A score could serve as a prognostic biomarker, which was also associated with mutation-related signatures and TMB. These results suggested that the m6A score could be a preferable marker in predicting genomic aberrations.
We verified that the m6A score was strongly associated with the predictors of ICB treatment, implying that the m6A methylation could affect the response of immunotherapy to patients. In the IMvigor210 cohort, we validated the accuracy of the determined immune phenotype (34) and found that the m6A score integrated with various biomarkers (e.g., neoantigen load, TMB, the components of TIME) could more effectively predict prognosis of patients receiving immunotherapy. Actually, we also confirmed the prediction ability of the m6A score in the anti-PD-1/L1 immune response via two independent immunotherapy cohorts, which showed significant difference between nonresponders partial responders, and completed responders. We further found that patients with low m6A score might be more sensitive to anticancer drugs than high m6A score based on the GDSC. These above findings suggested that m6A score was a reliable tool, which could be used to comprehensively determine the immune-related phenotypes and guide clinical treatment decision to immunotherapy and anticancer drugs.
Furthermore, we also elucidated the specific m6A regulators in the regulation of TIME. Recent studies have confirmed that m6A could enhance the stability of mRNA and transport the specific mRNAs to the cytoplasm mainly through the binding proteins of HNRNPA2B1 in cell (58). Also, HNRNPA2B1 was recognized as an oncogene as it promotes tumor growth and migration in various cancers (59–61). Our analyses revealed that the expression of HNRNPA2B1 was upregulated in tumor and associated with decreased survival rate. Furthermore, higher expression of HNRNPA2B1 exhibited a lower infiltration trend of various types of DC, indicating that HNRNPA2B1 may be involved in the activation of DC. We also evaluated the mutated driver genes, the critical foundation of tumor diagnosis, therapeutic selections, via analyzing the TCGA cohort.
Although 21 m6A regulators are added into the mode, novel-identified regulators need to be curated to optimize the accuracy of the m6A score. Since there is a lack of appropriate immunotherapy cohorts based on HNSCC, we hope that different regimens (e.g., anti-PD-1/L1 or anti-CTLA-4) across HNSCC cohorts will verify our conclusion. Furthermore, only retrospective datasets were used to identify the m6A regulators and m6A score; thus, a series of prospective cohorts receiving immunotherapy were needed. Moreover, as not all cohorts exhibited that patients in low–m6A score subgroup benefits from ICB treatment, we needed a large and multicenter clinical population sample combined with more clinical features to confirm and improve the accuracy of the model.
In conclusion, our work comprehensively evaluated the TIME characteristics of m6A regulators based on different cohorts. This integrated analysis indicated m6A modification could not be ignored as its vital role in regulating tumor immunity. Comprehensive evaluation of m6A modification in TIME will guide more effective and important immunotherapeutic strategies.
Publicly available datasets were analyzed in this study. The datasets generated during the current studyare available in the Cancer Genome Atlas (TCGA) public dataset (https://portal.gdc.cancer.gov/) and the Gene-Expression Omnibus (GEO) public dataset (https://www.ncbi.nlm.nih.gov/geo/).
JF and ZY performed all analysis as well as wrote the manuscript. XM and MY participated in data analysis. All authors participated in reviewing the manuscript and approved the final version.
The authors declare that the research was conducted in the absence of any commercial or financial relationships that could be construed as a potential conflict of interest.
All claims expressed in this article are solely those of the authors and do not necessarily represent those of their affiliated organizations, or those of the publisher, the editors and the reviewers. Any product that may be evaluated in this article, or claim that may be made by its manufacturer, is not guaranteed or endorsed by the publisher.
The Supplementary Material for this article can be found online at: https://www.frontiersin.org/articles/10.3389/fonc.2021.764798/full#supplementary-material
CNV, copy number variation; DC, dendritic cell; DEGs, differentially expressed genes; EMT, epithelial-mesenchymal transition; GEO, Gene-Expression Omnibus; GSVA, Gene set variation analysis; HR, hazard ratios; ICB, immunological checkpoint blockade; m6A, N6-methyladenosine; Pan-F-TBRS, Pan-fibroblast TGFb response signature; PCA, principal component analysis; ssGSEA, single-sample gene-set enrichment analysis; TCGA, The Cancer Genome Atlas; IPS, immunophenoscore; TIDE, tumor immune dysfunction and exclusion; TIME, tumor immune microenvironment.
1. Bray F, Ferlay J, Soerjomataram I, Siegel RL, Torre LA, Jemal A. Global Cancer Statistics 2018: GLOBOCAN Estimates of Incidence and Mortality Worldwide for 36 Cancers in 185 Countries. CA: Cancer J Clin (2018) 68(6):394–424. doi: 10.3322/caac.21492
2. Shield KD, Ferlay J, Jemal A, Sankaranarayanan R, Chaturvedi AK, Bray F, et al. The Global Incidence of Lip, Oral Cavity, and Pharyngeal Cancers by Subsite in 2012. CA: Cancer J Clin (2017) 67(1):51–64. doi: 10.3322/caac.21384
3. Zhang X-M, Song L-J, Shen J, Yue H, Han Y-Q, Yang C-L, et al. Prognostic and Predictive Values of Immune Infiltrate in Patients With Head and Neck Squamous Cell Carcinoma. Hum Pathol (2018) 82:104–12. doi: 10.1016/j.humpath.2018.07.012
4. Seiwert TY, Burtness B, Mehra R, Weiss J, Berger R, Eder JP, et al. Safety and Clinical Activity of Pembrolizumab for Treatment of Recurrent or Metastatic Squamous Cell Carcinoma of the Head and Neck (KEYNOTE-012): An Open-Label, Multicentre, Phase 1b Trial. Lancet Oncol (2016) 17(7):956–65. doi: 10.1016/S1470-2045(16)30066-3
5. Garassino MC, Gadgeel S, Esteban E, Felip E, Speranza G, Domine M, et al. Patient-Reported Outcomes Following Pembrolizumab or Placebo Plus Pemetrexed and Platinum in Patients With Previously Untreated, Metastatic, non-Squamous non-Small-Cell Lung Cancer (KEYNOTE-189): A Multicentre, Double-Blind, Randomised, Placebo-Controlled, Phase 3 Trial. Lancet Oncol (2020) 21(3):387–97. doi: 10.1016/S1470-2045(19)30801-0
6. Rosenberg JE, Hoffman-Censits J, Powles T, van der Heijden MS, Balar AV, Necchi A, et al. Atezolizumab in Patients With Locally Advanced and Metastatic Urothelial Carcinoma Who Have Progressed Following Treatment With Platinum-Based Chemotherapy: A Single-Arm, Multicentre, Phase 2 Trial. Lancet (2016) 387(10031):1909–20. doi: 10.1016/S0140-6736(16)00561-4
7. Chen DS, Mellman I. Elements of Cancer Immunity and the Cancer-Immune Set Point. Nature (2017) 541(7637):321–30. doi: 10.1038/nature21349
8. Le DT, Durham JN, Smith KN, Wang H, Bartlett BR, Aulakh LK, et al. Mismatch Repair Deficiency Predicts Response of Solid Tumors to PD-1 Blockade. Sci (New York NY) (2017) 357(6349):409–13. doi: 10.1126/science.aan6733
9. Ferris RL, Whiteside TL, Ferrone S. Immune Escape Associated With Functional Defects in Antigen-Processing Machinery in Head and Neck Cancer. Clin Cancer Res (2006) 12(13):3890–5. doi: 10.1158/1078-0432.CCR-05-2750
10. Wang T, Kong S, Tao M, Ju S. The Potential Role of RNA N6-Methyladenosine in Cancer Progression. Mol Cancer (2020) 19(1):88. doi: 10.1186/s12943-020-01204-7
11. Zhao BS, Roundtree IA, He C. Post-Transcriptional Gene Regulation by mRNA Modifications. Nat Rev Mol Cell Biol (2017) 18(1):31–42. doi: 10.1038/nrm.2016.132
12. Chen M, Wei L, Law C-T, Tsang FH-C, Shen J, Cheng CL-H, et al. RNA N6-Methyladenosine Methyltransferase-Like 3 Promotes Liver Cancer Progression Through YTHDF2-Dependent Posttranscriptional Silencing of SOCS2. Hepatology (2018) 67(6):2254–70. doi: 10.1002/hep.29683
13. Li H-B, Tong J, Zhu S, Batista PJ, Duffy EE, Zhao J, et al. mA mRNA Methylation Controls T Cell Homeostasis by Targeting the IL-7/STAT5/SOCS Pathways. Nature (2017) 548(7667):338–42. doi: 10.1038/nature23450
14. Zaccara S, Ries RJ, Jaffrey SR. Reading, Writing and Erasing mRNA Methylation. Nat Rev Mol Cell Biol (2019) 20(10):608–24. doi: 10.1038/s41580-019-0168-5
15. Yang Y, Hsu PJ, Chen Y-S, Yang Y-G. Dynamic Transcriptomic mA Decoration: Writers, Erasers, Readers and Functions in RNA Metabolism. Cell Res (2018) 28(6):616–24. doi: 10.1038/s41422-018-0040-8
16. Wang Y, Li Y, Toth JI, Petroski MD, Zhang Z, Zhao JC. N6-Methyladenosine Modification Destabilizes Developmental Regulators in Embryonic Stem Cells. Nat Cell Biol (2014) 16(2):191–8. doi: 10.1038/ncb2902
17. Ping X-L, Sun B-F, Wang L, Xiao W, Yang X, Wang W-J, et al. Mammalian WTAP Is a Regulatory Subunit of the RNA N6-Methyladenosine Methyltransferase. Cell Res (2014) 24(2):177–89. doi: 10.1038/cr.2014.3
18. Pendleton KE, Chen B, Liu K, Hunter OV, Xie Y, Tu BP, et al. The U6 snRNA mA Methyltransferase METTL16 Regulates SAM Synthetase Intron Retention. Cell (2017) 169(5):824–35.e14. doi: 10.1016/j.cell.2017.05.003
19. Huang Y, Yan J, Li Q, Li J, Gong S, Zhou H, et al. Meclofenamic Acid Selectively Inhibits FTO Demethylation of M6a Over ALKBH5. Nucleic Acids Res (2015) 43(1):373–84. doi: 10.1093/nar/gku1276
20. Meyer KD, Jaffrey SR. Rethinking mA Readers, Writers, and Erasers. Annu Rev Cell Dev Biol (2017) 33:319–42. doi: 10.1146/annurev-cellbio-100616-060758
21. Chen X-Y, Zhang J, Zhu J-S. The Role of mA RNA Methylation in Human Cancer. Mol Cancer (2019) 18(1):103. doi: 10.1186/s12943-019-1033-z
22. Shulman Z, Stern-Ginossar N. The RNA Modification N-Methyladenosine as a Novel Regulator of the Immune System. Nat Immunol (2020) 21(5):501–12. doi: 10.1038/s41590-020-0650-4
23. Lan T, Li H, Zhang D, Xu L, Liu H, Hao X, et al. KIAA1429 Contributes to Liver Cancer Progression Through N6-Methyladenosine-Dependent Post-Transcriptional Modification of GATA3. Mol Cancer (2019) 18(1):186. doi: 10.1186/s12943-019-1106-z
24. Chen S, Li Y, Zhi S, Ding Z, Wang W, Peng Y, et al. WTAP Promotes Osteosarcoma Tumorigenesis by Repressing HMBOX1 Expression in an mA-Dependent Manner. Cell Death Dis (2020) 11(8):659. doi: 10.1038/s41419-020-02847-6
25. Yi L, Wu G, Guo L, Zou X, Huang P. Comprehensive Analysis of the PD-L1 and Immune Infiltrates of mA RNA Methylation Regulators in Head and Neck Squamous Cell Carcinoma. Mol Ther Nucleic Acids (2020) 21:299–314. doi: 10.1016/j.omtn.2020.06.001
26. Li T, Hu P-S, Zuo Z, Lin J-F, Li X, Wu Q-N, et al. METTL3 Facilitates Tumor Progression via an mA-IGF2BP2-Dependent Mechanism in Colorectal Carcinoma. Mol Cancer (2019) 18(1):112. doi: 10.1186/s12943-019-1038-7
27. Han D, Liu J, Chen C, Dong L, Liu Y, Chang R, et al. Anti-Tumour Immunity Controlled Through mRNA mA Methylation and YTHDF1 in Dendritic Cells. Nature (2019) 566(7743):270–4. doi: 10.1038/s41586-019-0916-x
28. Yang S, Wei J, Cui Y-H, Park G, Shah P, Deng Y, et al. mA mRNA Demethylase FTO Regulates Melanoma Tumorigenicity and Response to Anti-PD-1 Blockade. Nat Commun (2019) 10(1):2782. doi: 10.1038/s41467-019-10669-0
29. Wang H, Hu X, Huang M, Liu J, Gu Y, Ma L, et al. Mettl3-Mediated mRNA mA Methylation Promotes Dendritic Cell Activation. Nat Commun (2019) 10(1):1898. doi: 10.1038/s41467-019-09903-6
30. Chen Y-T, Shen J-Y, Chen D-P, Wu C-F, Guo R, Zhang P-P, et al. Identification of Cross-Talk Between mA and 5mc Regulators Associated With Onco-Immunogenic Features and Prognosis Across 33 Cancer Types. J Hematol Oncol (2020) 13(1):22. doi: 10.1186/s13045-020-00854-w
31. Wilkerson MD, Hayes DN. ConsensusClusterPlus: A Class Discovery Tool With Confidence Assessments and Item Tracking. Bioinf (Oxford England) (2010) 26(12):1572–3. doi: 10.1093/bioinformatics/btq170
32. Hänzelmann S, Castelo R, Guinney J. GSVA: Gene Set Variation Analysis for Microarray and RNA-Seq Data. BMC Bioinf (2013) 14:7. doi: 10.1186/1471-2105-14-7
33. Subramanian A, Tamayo P, Mootha VK, Mukherjee S, Ebert BL, Gillette MA, et al. Gene Set Enrichment Analysis: A Knowledge-Based Approach for Interpreting Genome-Wide Expression Profiles. In: Proceedings of the National Academy of Sciences of the United States of America, vol. 102. PNAS, USA (2005). p. 15545–50.
34. Mariathasan S, Turley SJ, Nickles D, Castiglioni A, Yuen K, Wang Y, et al. Tgfβ Attenuates Tumour Response to PD-L1 Blockade by Contributing to Exclusion of T Cells. Nature (2018) 554(7693):544–8. doi: 10.1038/nature25501
35. Yu G, Wang L-G, Han Y, He Q-Y. Clusterprofiler: An R Package for Comparing Biological Themes Among Gene Clusters. OMICS (2012) 16(5):284–7. doi: 10.1089/omi.2011.0118
36. Jia Q, Wu W, Wang Y, Alexander PB, Sun C, Gong Z, et al. Local Mutational Diversity Drives Intratumoral Immune Heterogeneity in Non-Small Cell Lung Cancer. Nat Commun (2018) 9(1):5361. doi: 10.1038/s41467-018-07767-w
37. Charoentong P, Finotello F, Angelova M, Mayer C, Efremova M, Rieder D, et al. Pan-Cancer Immunogenomic Analyses Reveal Genotype-Immunophenotype Relationships and Predictors of Response to Checkpoint Blockade. Cell Rep (2017) 18(1):248–62. doi: 10.1016/j.celrep.2016.12.019
38. Jiang P, Gu S, Pan D, Fu J, Sahu A, Hu X, et al. Signatures of T Cell Dysfunction and Exclusion Predict Cancer Immunotherapy Response. Nat Med (2018) 24(10):1550–8. doi: 10.1038/s41591-018-0136-1
39. Yoshihara K, Shahmoradgoli M, Martínez E, Vegesna R, Kim H, Torres-Garcia W, et al. Inferring Tumour Purity and Stromal and Immune Cell Admixture From Expression Data. Nat Commun (2013) 4:2612. doi: 10.1038/ncomms3612
40. Mayakonda A, Lin D-C, Assenov Y, Plass C, Koeffler HP. Maftools: Efficient and Comprehensive Analysis of Somatic Variants in Cancer. Genome Res (2018) 28(11):1747–56. doi: 10.1101/gr.239244.118
41. Chen H, Chong W, Yang X, Zhang Y, Sang S, Li X, et al. Age-Related Mutational Signature Negatively Associated With Immune Activity and Survival Outcome in Triple-Negative Breast Cancer. Oncoimmunology (2020) 9(1):1788252. doi: 10.1080/2162402X.2020.1788252
42. Chen H, Chong W, Teng C, Yao Y, Wang X, Li X. The Immune Response-Related Mutational Signatures and Driver Genes in Non-Small-Cell Lung Cancer. Cancer Sci (2019) 110(8):2348–56. doi: 10.1111/cas.14113
43. Ritchie ME, Phipson B, Wu D, Hu Y, Law CW, Shi W, et al. Limma Powers Differential Expression Analyses for RNA-Sequencing and Microarray Studies. Nucleic Acids Res (2015) 43(7):e47. doi: 10.1093/nar/gkv007
44. Zeng D, Li M, Zhou R, Zhang J, Sun H, Shi M, et al. Tumor Microenvironment Characterization in Gastric Cancer Identifies Prognostic and Immunotherapeutically Relevant Gene Signatures. Cancer Immunol Res (2019) 7(5):737–50. doi: 10.1158/2326-6066.CIR-18-0436
45. Zhang B, Wu Q, Li B, Wang D, Wang L, Zhou YL. mA Regulator-Mediated Methylation Modification Patterns and Tumor Microenvironment Infiltration Characterization in Gastric Cancer. Mol Cancer (2020) 19(1):53. doi: 10.1186/s12943-020-01170-0
46. Turajlic S, Litchfield K, Xu H, Rosenthal R, McGranahan N, Reading JL, et al. Insertion-And-Deletion-Derived Tumour-Specific Neoantigens and the Immunogenic Phenotype: A Pan-Cancer Analysis. Lancet Oncol (2017) 18(8):1009–21. doi: 10.1016/S1470-2045(17)30516-8
47. Şenbabaoğlu Y, Gejman RS, Winer AG, Liu M, Van Allen EM, de Velasco G, et al. Tumor Immune Microenvironment Characterization in Clear Cell Renal Cell Carcinoma Identifies Prognostic and Immunotherapeutically Relevant Messenger RNA Signatures. Genome Biol (2016) 17(1):231. doi: 10.1186/s13059-016-1092-z
48. Riaz N, Havel JJ, Makarov V, Desrichard A, Urba WJ, Sims JS, et al. Tumor and Microenvironment Evolution During Immunotherapy With Nivolumab. Cell (2017) 171(4):934–49.e16. doi: 10.1016/j.cell.2017.09.028
49. Hugo W, Zaretsky JM, Sun L, Song C, Moreno BH, Hu-Lieskovan S, et al. Genomic and Transcriptomic Features of Response to Anti-PD-1 Therapy in Metastatic Melanoma. Cell (2016) 165(1):35–44. doi: 10.1016/j.cell.2016.02.065
50. Yang W, Soares J, Greninger P, Edelman EJ, Lightfoot H, Forbes S, et al. Genomics of Drug Sensitivity in Cancer (GDSC): A Resource for Therapeutic Biomarker Discovery in Cancer Cells. Nucleic Acids Res (2013) 41(Database issue):D955–61. doi: 10.1093/nar/gks1111
51. Geeleher P, Cox NJ, Huang RS. Clinical Drug Response can be Predicted Using Baseline Gene Expression Levels and In Vitro Drug Sensitivity in Cell Lines. Genome Biol (2014) 15(3):R47. doi: 10.1186/gb-2014-15-3-r47
52. Hazra A, Gogtay N. Biostatistics Series Module 3: Comparing Groups: Numerical Variables. Indian J Dermatol (2016) 61(3):251–60. doi: 10.4103/0019-5154.182416
53. Pfister DG, Spencer S, Adelstein D, Adkins D, Anzai Y, Brizel DM, et al. Head and Neck Cancers, Version 2.2020, NCCN Clinical Practice Guidelines in Oncology. J Natl Compr Canc Netw (2020) 18(7):873–98. doi: 10.6004/jnccn.2020.0031
54. Chinese Society of Clinical Oncology (CSCO) Diagnosis and Treatment Guidelines for Head and Neck Cancer 2018 (English Version). Chin J Cancer Res (2019) 31(1):84–98. doi: 10.21147/j.issn.1000-9604.2019.01.05
55. Kim JM, Chen DS. Immune Escape to PD-L1/PD-1 Blockade: Seven Steps to Success (or Failure). Ann Oncol (2016) 27(8):1492–504. doi: 10.1093/annonc/mdw217
56. Panagi M, Voutouri C, Mpekris F, Papageorgis P, Martin MR, Martin JD, et al. TGF-β Inhibition Combined With Cytotoxic Nanomedicine Normalizes Triple Negative Breast Cancer Microenvironment Towards Anti-Tumor Immunity. Theranostics (2020) 10(4):1910–22. doi: 10.7150/thno.36936
57. Tauriello DVF, Palomo-Ponce S, Stork D, Berenguer-Llergo A, Badia-Ramentol J, Iglesias M, et al. Tgfβ Drives Immune Evasion in Genetically Reconstituted Colon Cancer Metastasis. Nature (2018) 554(7693):538–43. doi: 10.1038/nature25492
58. Liu Y, Shi S-L. The Roles of hnRNP A2/B1 in RNA Biology and Disease. Wiley Interdiscip Rev RNA (2021) 12(2):e1612. doi: 10.1002/wrna.1612
59. Wang H, Liang L, Dong Q, Huan L, He J, Li B, et al. Long Noncoding RNA MiR503hg, a Prognostic Indicator, Inhibits Tumor Metastasis by Regulating the HNRNPA2B1/NF-κb Pathway in Hepatocellular Carcinoma. Theranostics (2018) 8(10):2814–29. doi: 10.7150/thno.23012
60. Zhang Y, Huang W, Yuan Y, Li J, Wu J, Yu J, et al. Long Non-Coding RNA H19 Promotes Colorectal Cancer Metastasis via Binding to Hnrnpa2b1. J Exp Clin Cancer Res (2020) 39(1):141. doi: 10.1186/s13046-020-01619-6
61. Meng L-D, Shi G-D, Ge W-L, Huang X-M, Chen Q, Yuan H, et al. Linc01232 Promotes the Metastasis of Pancreatic Cancer by Suppressing the Ubiquitin-Mediated Degradation of HNRNPA2B1 and Activating the A-Raf-Induced MAPK/ERK Signaling Pathway. Cancer Lett (2020) 494:107–20. doi: 10.1016/j.canlet.2020.08.001
Keywords: HNSCC, m6A regulator, TIME, m6A score, therapy
Citation: Yang Z, Ming X, Huang S, Yang M, Zhou X and Fang J (2021) Comprehensive Analysis of m6A Regulators Characterized by the Immune Cell Infiltration in Head and Neck Squamous Cell Carcinoma to Aid Immunotherapy and Chemotherapy. Front. Oncol. 11:764798. doi: 10.3389/fonc.2021.764798
Received: 26 August 2021; Accepted: 01 November 2021;
Published: 29 November 2021.
Edited by:
Heming Lu, People’s Hospital of Guangxi Zhuang Autonomous Region, ChinaReviewed by:
Gaurisankar Sa, Bose Institute, IndiaCopyright © 2021 Yang, Ming, Huang, Yang, Zhou and Fang. This is an open-access article distributed under the terms of the Creative Commons Attribution License (CC BY). The use, distribution or reproduction in other forums is permitted, provided the original author(s) and the copyright owner(s) are credited and that the original publication in this journal is cited, in accordance with accepted academic practice. No use, distribution or reproduction is permitted which does not comply with these terms.
*Correspondence: Jiayu Fang, MzY2NjE5NjAxQHFxLmNvbQ==; Minlan Yang, eWFuZ21sQHdodS5lZHUuY24=; Xuhong Zhou, emhvdXh1aG9uZzY2QDEyNi5jb20=
†These authors have contributed equally to this work
Disclaimer: All claims expressed in this article are solely those of the authors and do not necessarily represent those of their affiliated organizations, or those of the publisher, the editors and the reviewers. Any product that may be evaluated in this article or claim that may be made by its manufacturer is not guaranteed or endorsed by the publisher.
Research integrity at Frontiers
Learn more about the work of our research integrity team to safeguard the quality of each article we publish.