 Ling Chen
 Kanfeng Liu2†
95% of researchers rate our articles as excellent or good
Learn more about the work of our research integrity team to safeguard the quality of each article we publish.
Find out more
ORIGINAL RESEARCH article
Front. Oncol. , 06 October 2021
Sec. Cancer Imaging and Image-directed Interventions
Volume 11 - 2021 | https://doi.org/10.3389/fonc.2021.759897
This article is part of the Research Topic Optical Molecular Imaging in Cancer Research View all 17 articles
Purpose: To propose and evaluate habitat imaging-based 18F-fluorodeoxyglucose (18F-FDG) positron emission tomography/computed tomography (PET/CT) radiomics for preoperatively discriminating non-small cell lung cancer (NSCLC) and benign inflammatory diseases (BIDs).
Methods: Three hundred seventeen 18F-FDG PET/CT scans were acquired from patients who underwent aspiration biopsy or surgical resection. All volumes of interest (VOIs) were semiautomatically segmented. Each VOI was separated into variant subregions, namely, habitat imaging, based on our adapted clustering-based habitat generation method. Radiomics features were extracted from these subregions. Three feature selection methods and six classifiers were applied to construct the habitat imaging-based radiomics models for fivefold cross-validation. The radiomics models whose features extracted by conventional habitat-based methods and nonhabitat method were also constructed. For comparison, the performances were evaluated in the validation set in terms of the area under the receiver operating characteristic curve (AUC). Pairwise t-test was applied to test the significant improvement between the adapted habitat-based method and the conventional methods.
Results: A total of 1,858 radiomics features were extracted. After feature selection, habitat imaging-based 18F-FDG PET/CT radiomics models were constructed. The AUC of the adapted clustering-based habitat radiomics was 0.7270 ± 0.0147, which showed significantly improved discrimination performance compared to the conventional methods (p <.001). Furthermore, the combination of features extracted by our adaptive habitat imaging-based method and non-habitat method showed the best performance than the other combinations.
Conclusion: Habitat imaging-based 18F-FDG PET/CT radiomics shows potential as a biomarker for discriminating NSCLC and BIDs, which indicates that the microenvironmental variations in NSCLC and BID can be captured by PET/CT.
Lung cancer is one of the most fatal and widespread diseases, with a poor 5-year survival rate (1). Non-small cell lung cancer (NSCLC) accounts for 80–85% of lung cancers (2). The histopathological subtypes of NSCLC include large cell carcinoma, adenocarcinoma (ADC), squamous cell carcinoma (SCC), and adenosquamous carcinoma (ASC). Among these subtypes, ASC is a relatively rare NSCLC histopathological subtype whose malignancy contains components of ADC and SCC. The treatment of early-stage NSCLC is normally surgical resection. However, since aspiration biopsy cannot provide 100% sensitivity, several studies have reported that the resection of benign tissue is prevalent because of the aggressive diagnosis and treatment of NSCLC (3–5). On the other hand, aspiration biopsy causes a certain of trauma to patient.
Since malignant tumors mostly present higher glucose metabolism than normal tissue, which is a known hallmark of cancer, they can be detected using 18F-fluorodeoxyglucose (18F-FDG) positron emission tomography/computed tomography (PET/CT), a metabolic and anatomic imaging system (6, 7). Regarding CT, a tissue can be anatomically analyzed in terms of size, textural heterogeneity, and contour irregulation in CT images (8). From a metabolic perspective, 18F-FDG PET can present high FDG metabolism in the region that could be a malignant tumor. Thus, the PET/CT system cannot only provide high sensitivity of radionuclide uptake but also provide precise anatomical information (9). Shim et al. evaluated the preoperative staging accuracy and specificity of 18F-FDG PET/CT and found that the performance was significantly better than that of CT alone (10). NSCLC, which presents ground-glass opacity (GGO) in CT, is accompanied by low FDG uptake in PET, thus leading to a false-negative result (11). On the other hand, benign inflammation (e.g., pneumonia, pyogenic abscesses, aspergillosis, and granulomatous diseases), which is also related to increased glucose metabolism, could be a potential false-positive detection in 18F-FDG PET (12). False-positive findings are mainly represented by BIDs with high FDG uptake in PET (13, 14). Therefore, a discrimination method is desired for assisting medical physicists and radiologists in identifying whether the high SUV uptake lesion is NSCLC or BID.
Radiomics, which translates medical images into high-throughput quantitative features for analysis, has been applied in a number of clinical studies (15–17). Tumors reveal genomic and phenotypic heterogeneity, which can be reflected in medical images, thus leading to the quantification of the textural and metabolic variations in tumors through PET and CT. Furthermore, PET/CT radiomics, which mines not only textural features but also metabolic features from PET/CT images, has been applied to various potential clinical applications. Lovinfosse et al. studied the prognostic value of baseline 18F-FDG PET/CT radiomics, and their results showed a strong predictive ability for survival in patients with locally advanced rectal cancer (18). Antunovic et al. developed and evaluated a PET/CT radiomics model for predicting pathological complete response to neoadjuvant chemotherapy in patients who had locally advanced breast cancer (19). Mu et al. built a PET/CT radiomics signature to predict the outcomes of NSCLC patients treated with checkpoint blockade immunotherapy (20). The above studies employed a conventional radiomics feature extraction method, i.e., radiomics features are extracted based on the whole tumor, which implicitly assumes that the whole tumor shows a consistent heterogeneous pattern. However, intratumoral heterogeneity exists and can be further revealed in medical images (21–23). For example, a whole tumor mass can be divided into well-, moderately, and poorly differentiated volumes, wherein poorly differentiated volumes show significant biological aggressiveness, which makes them different from other well-differentiated tumor volumes, and displays different kinds of heterogeneous pattern. Habitat is a term used to describe these regionally and heterogeneously distinct volumes, while habitat imaging refers to obtaining these volumes (23). Recently, some researchers have started to apply habitat imaging to PET/CT radiomics and have shown competitive performance in their tasks. Wu et al. proposed a robust habitat generation method by clustering and validated it in PET/CT habitat radiomics (24). According to this habitat generation method, Xu et al. built a habitat-based PET/CT radiomics method for predicting progression-free survival in patients with nasopharyngeal carcinoma (25). Wu et al. developed prognostic models by PET/CT habitat radiomics to identify whether more aggressive treatment is needed for patients with locally advanced cervical cancer treated with chemoradiotherapy (26). Different from the abovementioned clustering-based habitat generation method, they used Otsu thresholding (27) to obtain habitats. The thresholding-based habitat generation method fixes the number of habitats for each tumor. However, this thresholding-based method is not suitable, since assuming that the habitat number of NSCLC and BID are totally the same is unreasonable. In addition, the conventional clustering-based habitat generation method fixes the number of supervoxels to be clustered. The supervoxels of a small tumor are aggregated by fewer voxels than those of a large tumor, which suffers from the limited resolution of the image. To improve the issues mentioned above, we refine the clustering-based habitat generation method by adaptively setting the number of supervoxels for each tumor. Furthermore, we use the global signal values instead of the local signal values for normalization. To our knowledge, this is the first study to compare clustering- and thresholding-based habitat generation methods.
Therefore, in this study, we aim to develop and evaluate habitat imaging-based 18F-FDG PET/CT radiomics models for discriminating NSCLC and BID, which helps medical physicists and radiologists better diagnose NSCLC by PET/CT images.
This study was approved by the institutional review board, and the requirement for informed consent was waived since the data were analyzed retrospectively and anonymously. The whole workflow of our study is depicted in Figure 1.
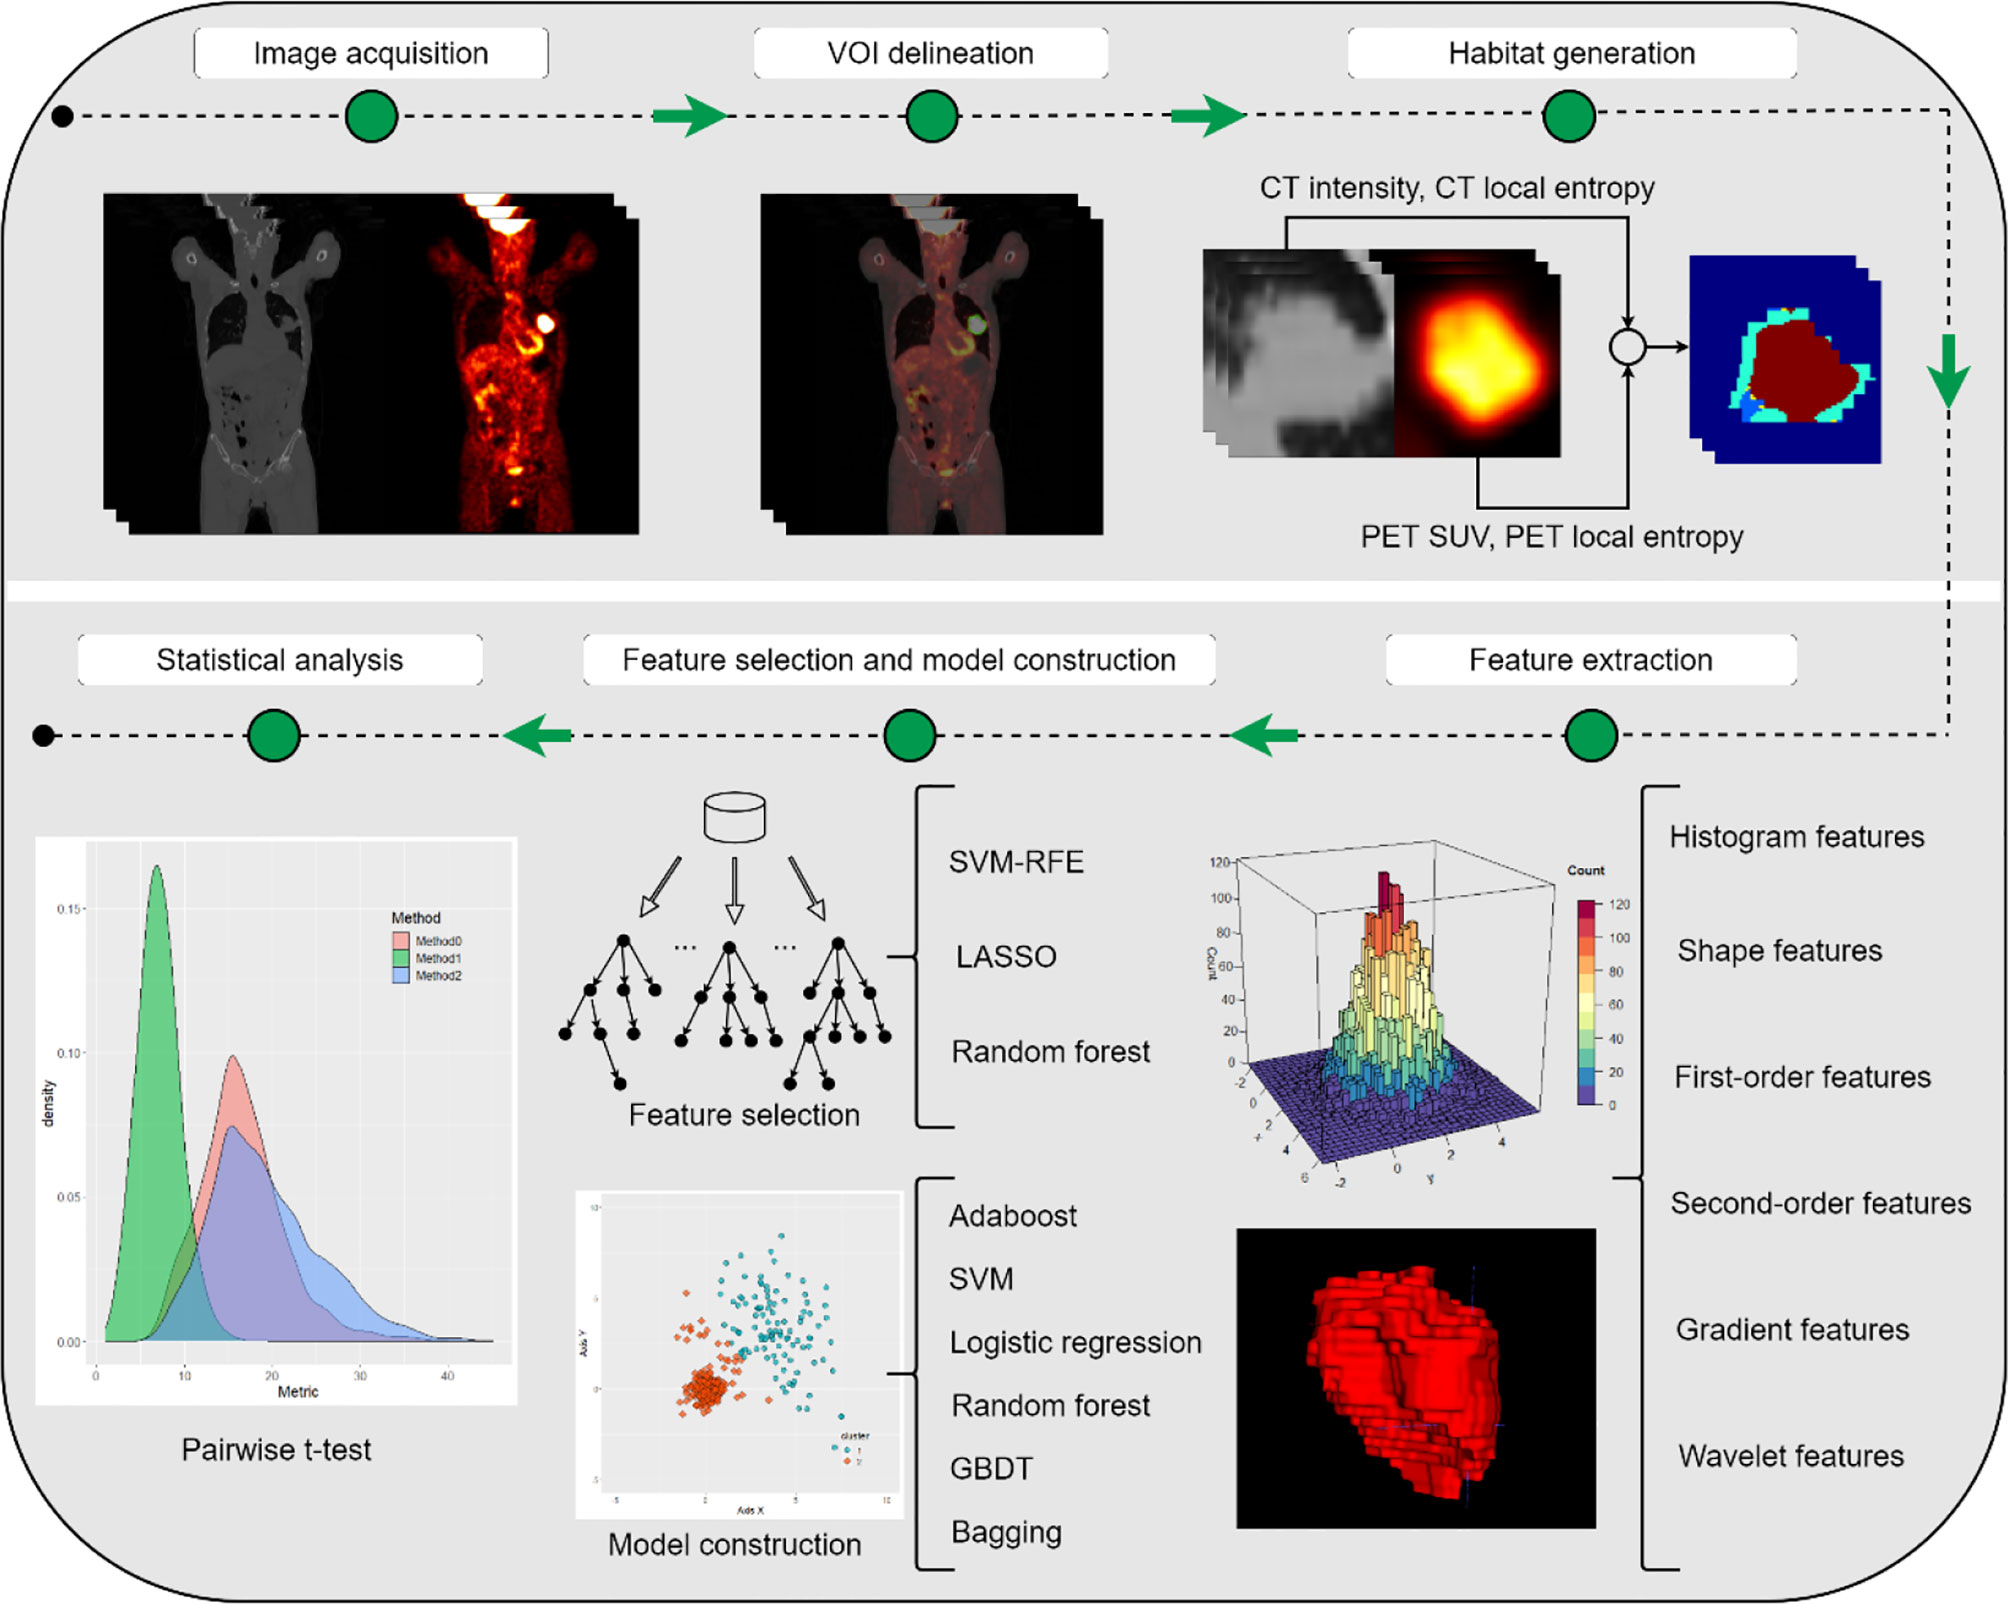
Figure 1 The whole workflow of our study.
Between January 1, 2015 and February 28, 2021, patients who had scanned PET/CT at the PET Center, the First Affiliated Hospital, School of Medicine, Zhejiang University, underwent aspiration biopsy or surgical resection to obtain histopathological results. The patients were enrolled based on the following inclusion criteria: (i) histopathological results of the lesion were available; (ii) NSCLC was primary and nonmetastatic; and (iii) NSCLC staging was between I and III. A total of 317 lesions were included in our study: 12 had ASC, 126 had ADC, 87 had SCC, and 92 had BID. The demographic information of the enrolled patients is summarized in Table 1. All image data were acquired on a Biograph 16 PET/CT system (Siemens Healthineers, Hoffman Estates, IL, USA). The PET images were reconstructed using the iterative algorithm with four iterations and eight subsets. A Gaussian filter with FWHM of 6.0 mm was applied to postprocessing. The convolutional kernel for CT reconstruction was B31f. The CT tube voltage was 120 kV, and the CT tube current was 207.5 ± 57.6 mA. The CT exposure was 105.1 ± 29.2 mAs. All lesions were semiautomatically segmented by two experienced radiologists under mutual consensus using ITK-SNAP 3.6.0 (28). The pixel spacing and slice thickness of each CT image were 1.00 ± 0.08 and 4.93 ± 0.44 mm/voxel, respectively. The pixel spacing and slice thickness of each PET image were 4.06 ± 0.00 and 4.93 ± 0.44 mm/voxel, respectively. Bilinear interpolation was applied to PET and CT images to ensure that they had the same voxel spacing of 1 × 1 × 1 mm3.
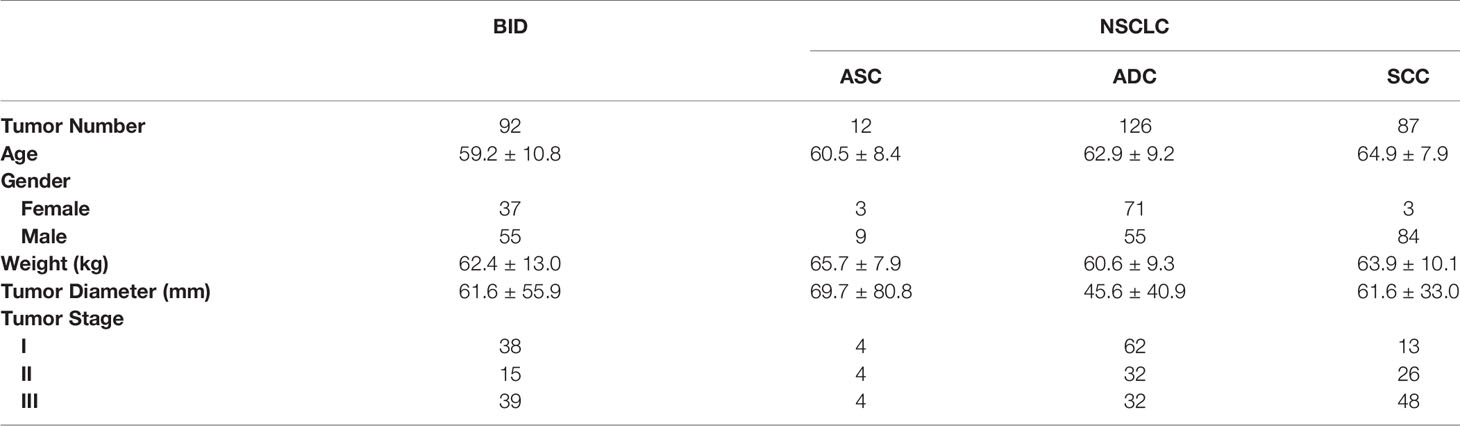
Table 1 Demographic information of the enrolled patients.
All enrolled PET/CT data were preprocessed before training and testing. Regarding CT, the windowing method was applied to images with customized upper and lower gray level boundaries so that the specific structure could be emphasized. By altering the window width and window level, the contrast and brightness of the image were changed accordingly. Referring to lung cancer diagnosis by CT, radiologists usually use the lung window (window width, 700 HU; window level, −600 HU) to accentuate the lung parenchyma for assessment, including areas of pulmonary vascular structure and consolidation. Furthermore, radiologists normally employ the mediastinal window (window width, 300 HU; window level, 40 HU) to evaluate the mediastinal structures and chest wall, thus leading to the recognition of structures of the mediastinum from enlarged lymph nodes or other masses. Therefore, a customized window (window width, 1,140 HU; window level, −380 HU), which merges the mediastinal window and lung window, was used for preprocessing so that the redundant information could be eliminated and the target region could be enhanced. Regarding PET, all PET images were converted from activity to standardized uptake value (SUV) for the purpose of quantification.
Our clustering-based habitat generation method was adapted from the multiparametric intratumor partitioning method proposed by Wu et al. (24). The main difference between the conventional and adapted method is the hypervolume generation. The conventional method fixed the number of hypervolume for each tumor, while the adapted method fixed the size of hypervolume so each tumors can have adaptive numbers of hypervolume.
The first step is to generate a hypervolume whose dimensionality is feature × depth × height × width. Along the feature axis, we need to determine the size of the feature vector. In our case, we followed the four-dimensional (4D) feature vector, which is comprised of PET SUV, CT intensity, PET local entropy, and CT local entropy (24, 25). In detail, the local entropy for PET and CT was computed within a small 9 × 9 × 9 neighborhood. For example, if the size of the input volume of interest (VOI) is 64 × 64 × 64 for both PET and CT, the size of the resulting hypervolume of the feature should be 4 × 64 × 64 × 64; thus, the first dimension of this hypervolume is a feature vector, which consists of PET SUV, CT intensity, PET local entropy, and CT local entropy. The next step is to individually cluster the voxel for each VOI, and thus, supervoxels (i.e., internal clusters for each VOI) can be obtained. The k-means clustering algorithm was applied to voxel values (PET SUV, CT intensity, PET local entropy, and CT local entropy) under the Euclidean distance measurement. The intensity of the supervoxel is characterized by averaging feature vectors. With respect to the conventional clustering-based method, the cluster numbers of each VOI are set to the same number. The normalization of the 4D feature vector is performed using the maximum and minimum values among the 9 × 9 × 9 neighborhoods. Regarding our adapted clustering-based method, we fix the volume of supervoxels to be 729 mm3 and then calculated how many supervoxels need to be clustered. In addition, global minimum and maximum values were used for normalization of the feature vector, which helps measure the distance better. The last step is to cluster supervoxels from all VOIs to form multiple habitats. The k-means clustering algorithm was applied to aggregate all supervoxels to form habitats. The number of habitats was tested from 2 to 10 to determine the optimized number of habitats with the highest evaluation metric, the Calinski–Harabasz index (29).
The Otsu algorithm was used for thresholding-based habitat generation. This algorithm determines the threshold by maximizing interclass variance, or equivalently, by minimizing intraclass variance. Otsu thresholding was applied to PET and CT images, and thus, two thresholds of PET and CT were obtained for separating habitats, i.e., PEThigh, PETlow, CThigh, and CTlow. Therefore, a total of four habitats were generated for each tumor: PEThigh ∩ CThigh, PEThigh ∩ CTlow, PETlow ∩ CThigh, and PETlow ∩ CTlow.
Feature extraction was performed on each habitat for each modality. The PyRadiomics Python package version 3.0.1 (30), which is based on the Image Biomarker Standardization Initiative (31, 32), was used to extract 107 basic radiomics features, including first-order, shape, gray level co-occurrence matrix (GLCM), gray level size zone matrix, gray level run length matrix (GLRLM), neighboring gray tone difference matrix (NGTDM), and gray level dependence matrix (GLDM) features (30). Note that the bin widths of CT and PET were set to 25 and 0.25, respectively. Furthermore, co-occurrence of local anisotropic gradient orientations (CoLIAGe) was employed to extract 390 features from a gradient perspective (33). A total of 432 wavelet-local binary pattern (LBP) features, which show competitive performance in capturing cancerous heterogeneity, were the first-order features extracted from images that were orderly processed by discrete wavelet transformation and LBP (34). The details of radiomics features can be found in the Supplementary Information.
For feature selection, Spearman’s rank correlation coefficient was calculated to eliminate redundant features whose coefficients were >0.99, and then, a hypothesis test was employed to select the features that were significantly associated (p <.05) with the predictive label, i.e., NSCLC and BID. In detail, the Shapiro–Wilk test and Levene’s test were used to test whether the features satisfied a normal distribution and whether the variances in features were homogeneous. If both of these tests satisfied p <.05, a t-test was applied to select the significantly associated features; otherwise, the Mann–Whitney U-test was performed. Afterwards, three different model-based feature selection methods were applied to further select the significant features. Support vector machine recursive feature elimination (SVM-RFE), random forest, and least absolute shrinkage and selection operator (LASSO) regression were used as the model-based feature selection methods. The selected features were used to develop radiomics models, and the classifiers we used included SVM, random forest, gradient boosting decision tree (GBDT), logistic regression, AdaBoost, and bagging. Hence, the resulting number of combinations for constructing radiomics models was 18.
Fivefold cross-validation was performed in model construction, and the evaluation metrics, which included the area under the receiver operating characteristic (ROC) curve (AUC), accuracy, sensitivity, and specificity, were obtained by averaging the values among five folds. Note that the optimized threshold was determined by the highest F1 score in the training set. The following kinds of radiomics models were compared: (i) conventional nonhabitat radiomics; (ii) conventional thresholding-based habitat radiomics; (iii) conventional clustering-based habitat radiomics; (iv) adapted clustering-based habitat radiomics; (v) adapted clustering-based habitat combined with conventional nonhabitat radiomics; (vi) conventional thresholding-based habitat combined with conventional nonhabitat radiomics; and (vii) combination of adapted clustering-based habitat, conventional thresholding-based habitat, and conventional nonhabitat radiomics. In our study, we averaged the predictive value of all habitats in a tumor to obtain the comprehensive predictive value.
There were three feature selection methods and six classifiers and thus leading to 18 radiomics models, which can be constructed for each kind of habitat generation method. In addition, all evaluation metrics were averaged in terms of five folds. To evaluate the performance for different habitat-based radiomics, a pairwise t-test was performed to evaluate whether there was significant improvement between these methods.
According to Calinski–Harabasz index, the optimized numbers of habitats were 5 and 2 for adapted and conventional clustering-based habitat generations in our study, respectively. Regarding our adapted clustering-based method, we adaptively set the number of habitats for each tumor. The distribution of habitat number for each type of lesion is summarized in Figure 2. From Figure 2A, we can see that the habitat number proportions of habitats 1–3 between NSCLC and BID are similar, while habitats 4 and 5 show differences between NSCLC and BID. Furthermore, NSCLC was split into histopathological subtypes, including ADC, ASC, and SCC, as shown in Figure 2B. Specifically, Figure 2B shows that the habitat number distribution of BID is very close to that of ADC. Figure 3 shows the stacked histograms of habitat size for each NSCLC histopathological subtype and BID. The vertical and horizontal axes represent the occurrence of a specific habitat and the proportion of the habitat size and the whole tumor size, respectively. The size proportion represents the ratio of the size of habitat to the size of whole VOI. From Figure 3, we can see that (a) ADC could appear as a single habitat as habitats 1–3, while the occurrence of habitat 5, which merely appears as a small region, is very low; (b) ASC mainly appears as habitats 2 and 3 in terms of the size proportion and unlikely appears as habitat 4; (c) SCC tends to appear as multiple habitats, with the highest frequency of habitat 5 compared to the others; and (d) the distribution of BID is very similar to that of ADC, which shows a similar phenomenon as that in Figure 3B.
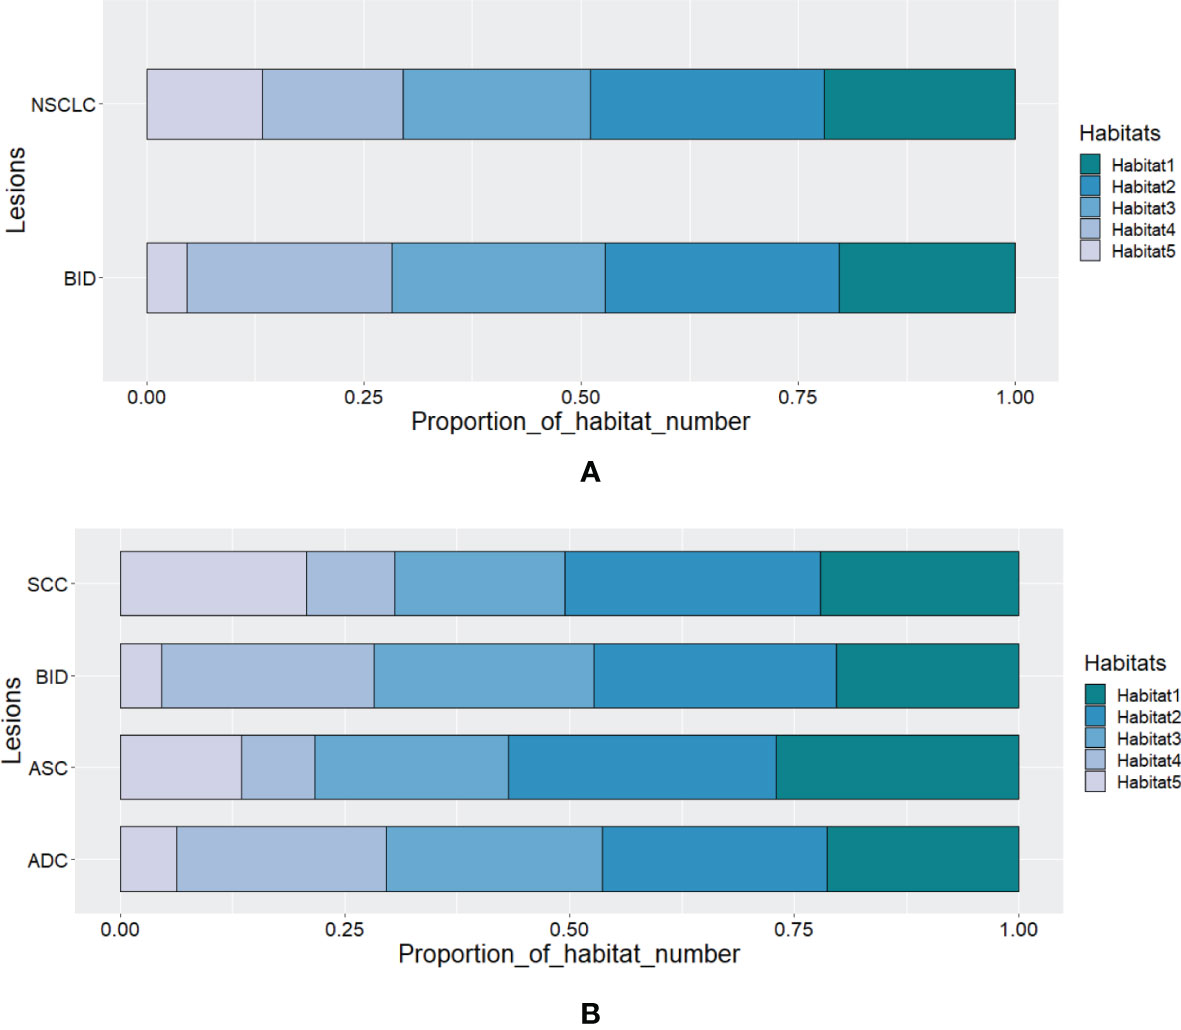
Figure 2 The distribution of habitat number for (A) BID and NSCLC and for (B) SCC, BID, ASC, and ADC.
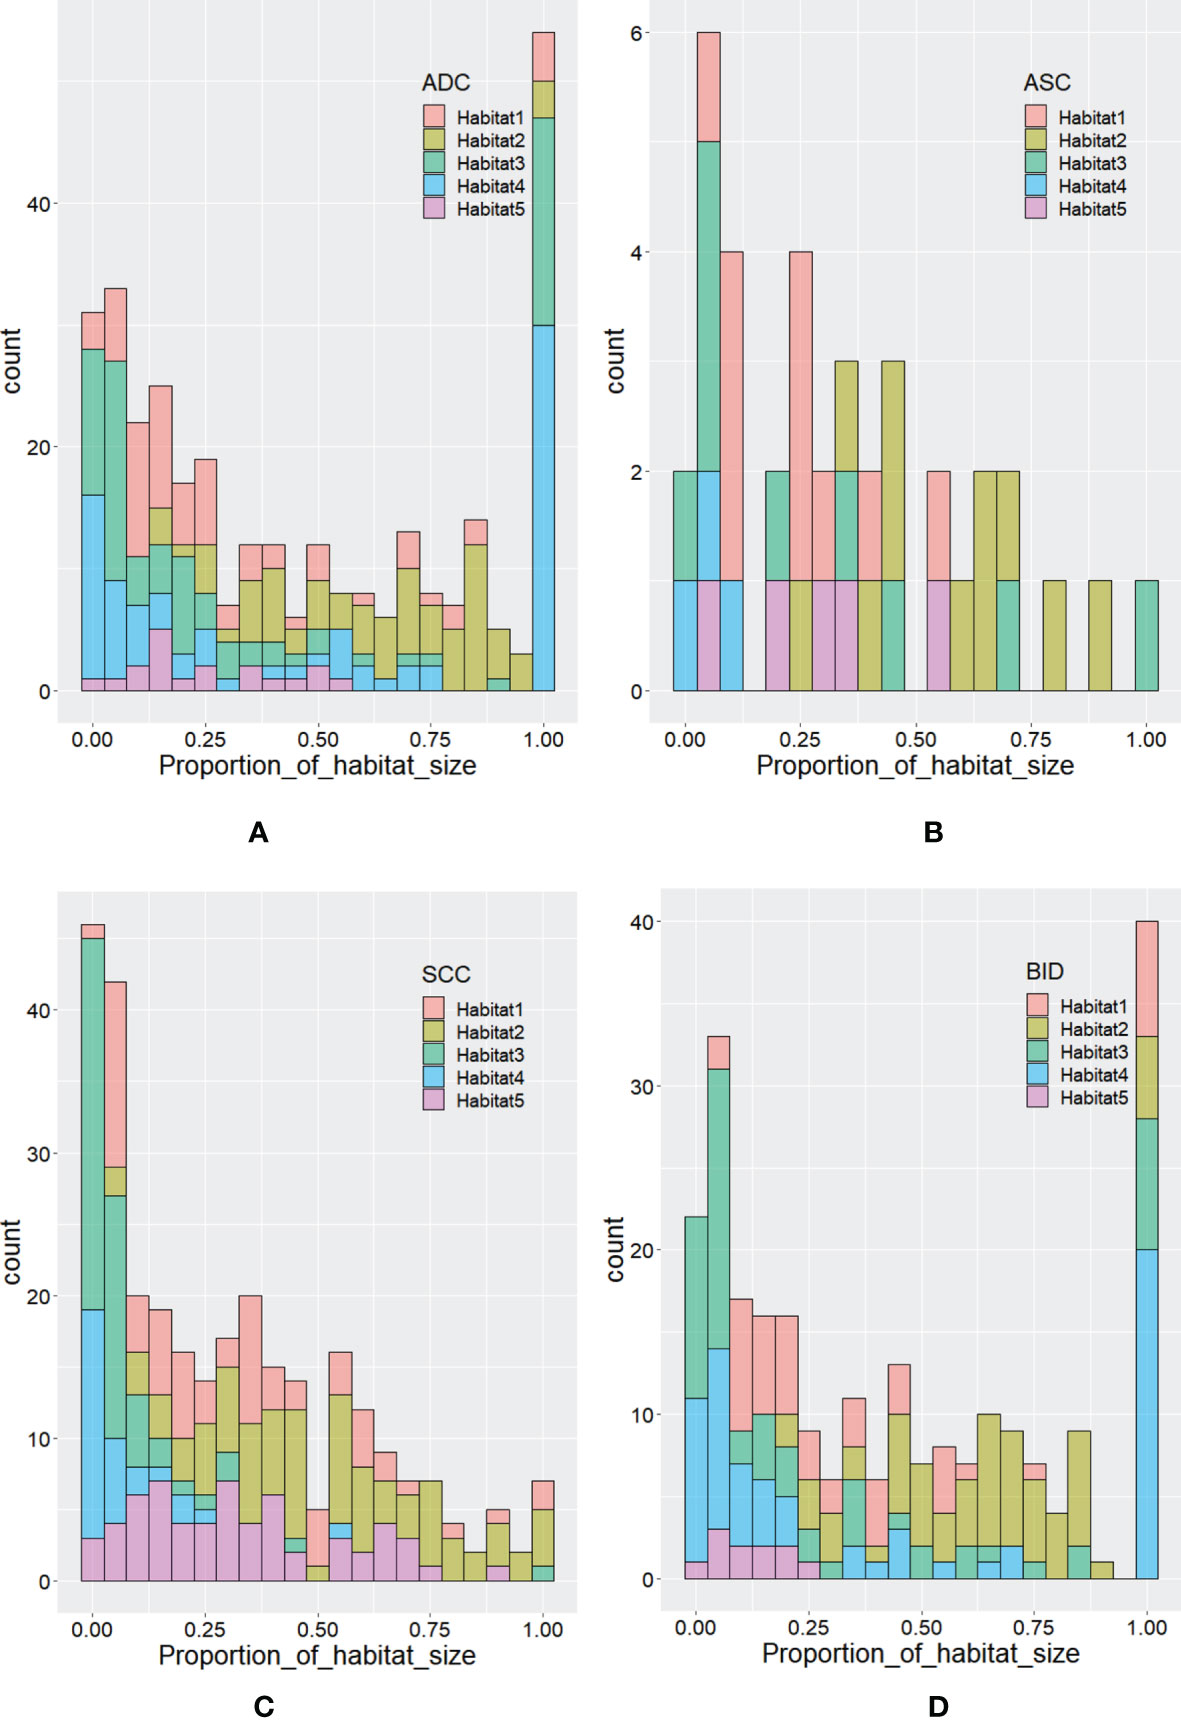
Figure 3 The distribution of habitat size proportion for (A) ADC, (B) ASC, (C) SCC, and (D) BID.
Radiomics features were extracted from these five habitats. Since stratified sampling was applied to fivefold cross-validation, the training, validation, and testing sets had the same proportions of ADCs, ASCs, SCCs, and BIDs, which suggests that these subsets of data have similar lesion distributions. Since we used three feature selection methods for fivefold cross-validation, feature selection was applied 15 times to develop habitat radiomics. Thus, the maximum number of selected times for a feature is 15. We summarized the top 10 selected features for each habitat radiomics. The selected features of conventional nonhabitat radiomics, adapted clustering-based habitat radiomics, and their combination are shown in Figure 4. The top 10 selected features for the other habitat methods are summarized in Supplementary Figure 1 of the Supplementary Information. Regarding conventional nonhabitat radiomics, the top 10 selected features included 4 features from CT and 5 features from PET. There were three histogram features, one shape feature, and six second-order features. Regarding adapted clustering-based habitat radiomics, three and six features were based on CT and PET, respectively. There was one shape feature, one first-order feature, and eight second-order features. Regarding adapted clustering-based habitat radiomics combined with conventional nonhabitat radiomics, only two features were from CT and seven features were from PET. There was one histogram feature, one shape feature, and eight second-order features. Comparing the features extracted from conventional nonhabitat radiomics with those extracted from adapted clustering-based habitat radiomics, we can see that more PET features were extracted, and the top 2 features were changed from CT to PET, which implicitly reveals that the adapted clustering-based habitat can discover more diagnostic potential in PET with the help of CT.
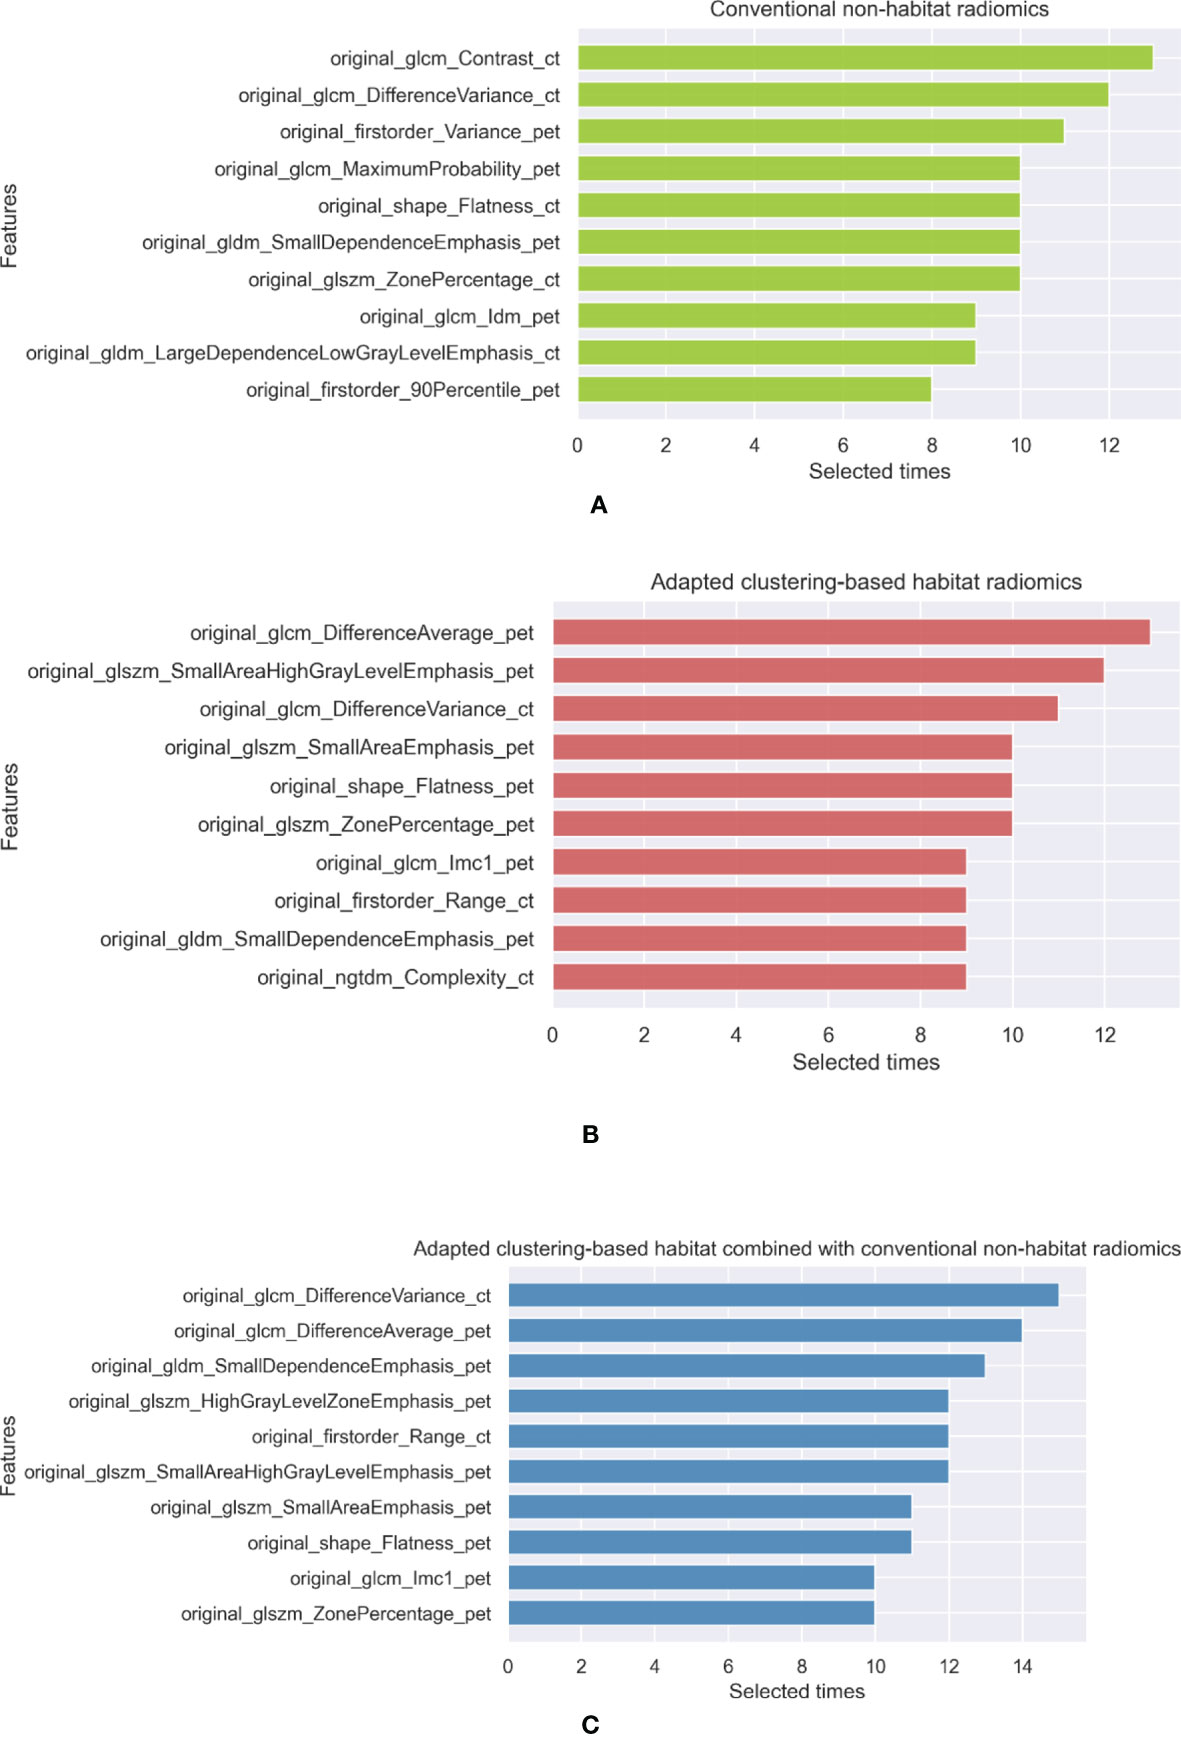
Figure 4 The top 10 selected features of (A) conventional nonhabitat radiomics, (B) adapted clustering-based habitat radiomics, and (C) their combination.
A total of 6 classifiers and 3 feature selection methods, which form 18 different radiomics pipelines, were used to develop radiomics models. The radiomics features extracted from different habitat generation methods were fed into these pipelines, and then the mean and standard deviation of the evaluation metrics were calculated to evaluate the overall predictive performance. A total of seven habitat imaging-based radiomics methods were compared, as mentioned in Section 2.4. Their diagnostic performance metrics are summarized in Table 2. In this table, T1 depicts the pairwise t-test between the adapted clustering-based combined with nonhabitat method and the rest of methods, and T2 illustrates the pairwise t-test between the adapted clustering-based method and the other habitat generation methods. The performance details for the specific classifiers are summarized in Supplementary Table 1 of the Supplementary Information. The metrics of accuracy, sensitivity, and specificity are based on the optimized threshold obtained from the F1 score. Since we had a highly imbalanced dataset and the three metrics are easily affected by the threshold, the AUC metric, which can comprehensively reflect the performance of binary classification models, was used for the performance comparisons (35). According to Table 2, we can see that the features extracted from the adapted clustering-based method combined with the non-habitat method can be used to develop radiomics models that outperform the others, except for the adapted clustering-based radiomics method, in terms of the AUC (p <.05), with a mean AUC of 0.7329. For further analyze the habitat characteristics; four samples were selected in Figure 5, and their corresponding habitats with predicted probability are plotted in Figure 6.
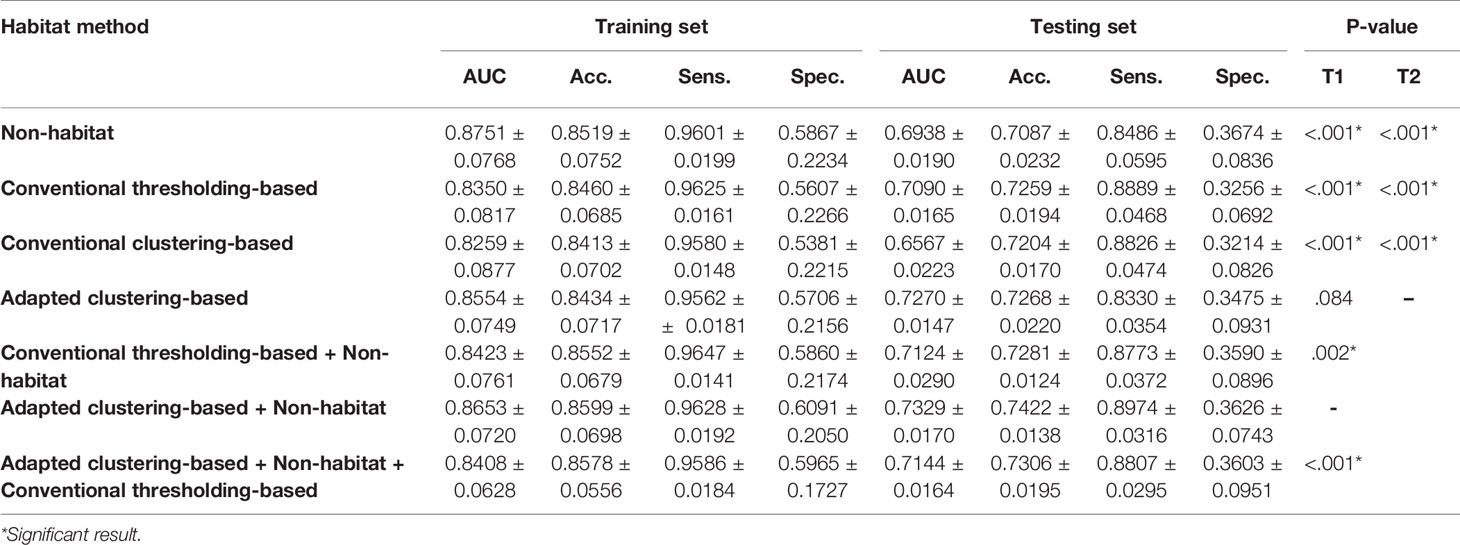
Table 2 Summary of the diagnostic performances for each method.
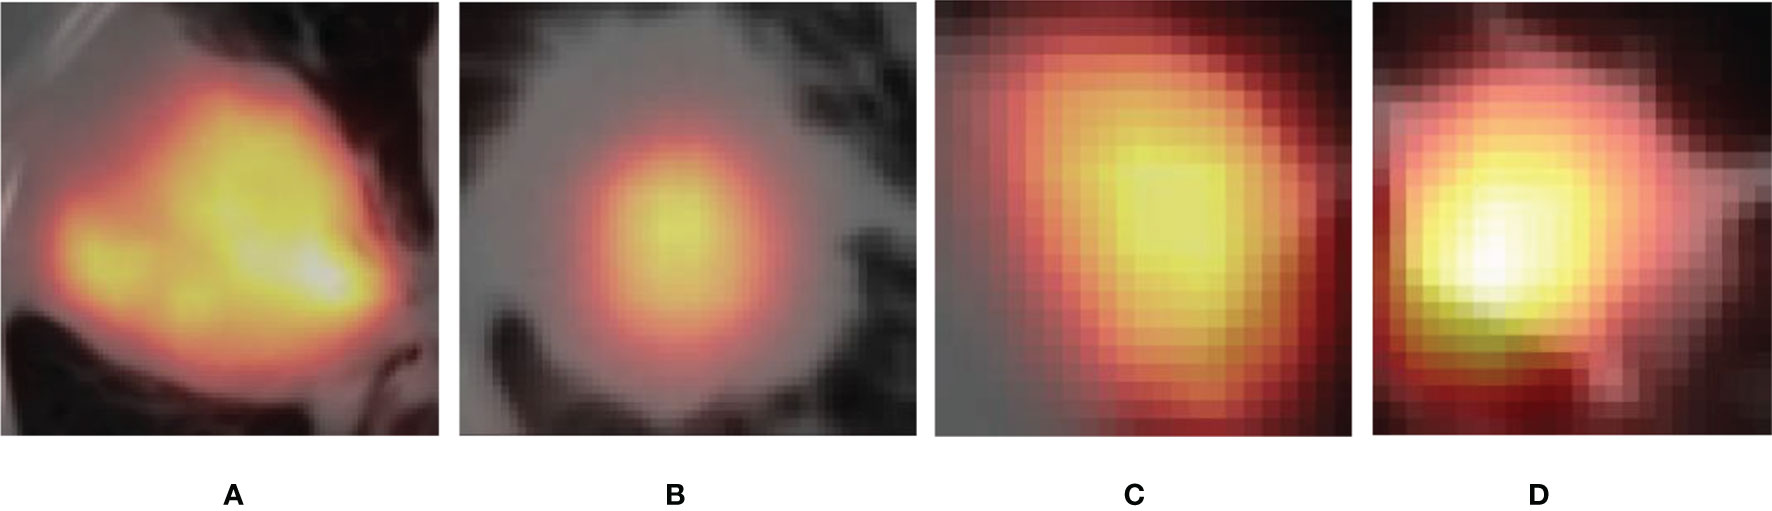
Figure 5 The selected four samples of (A) ADC, (B) SCC, (C) ASC, and (D) BID in PET/CT images.
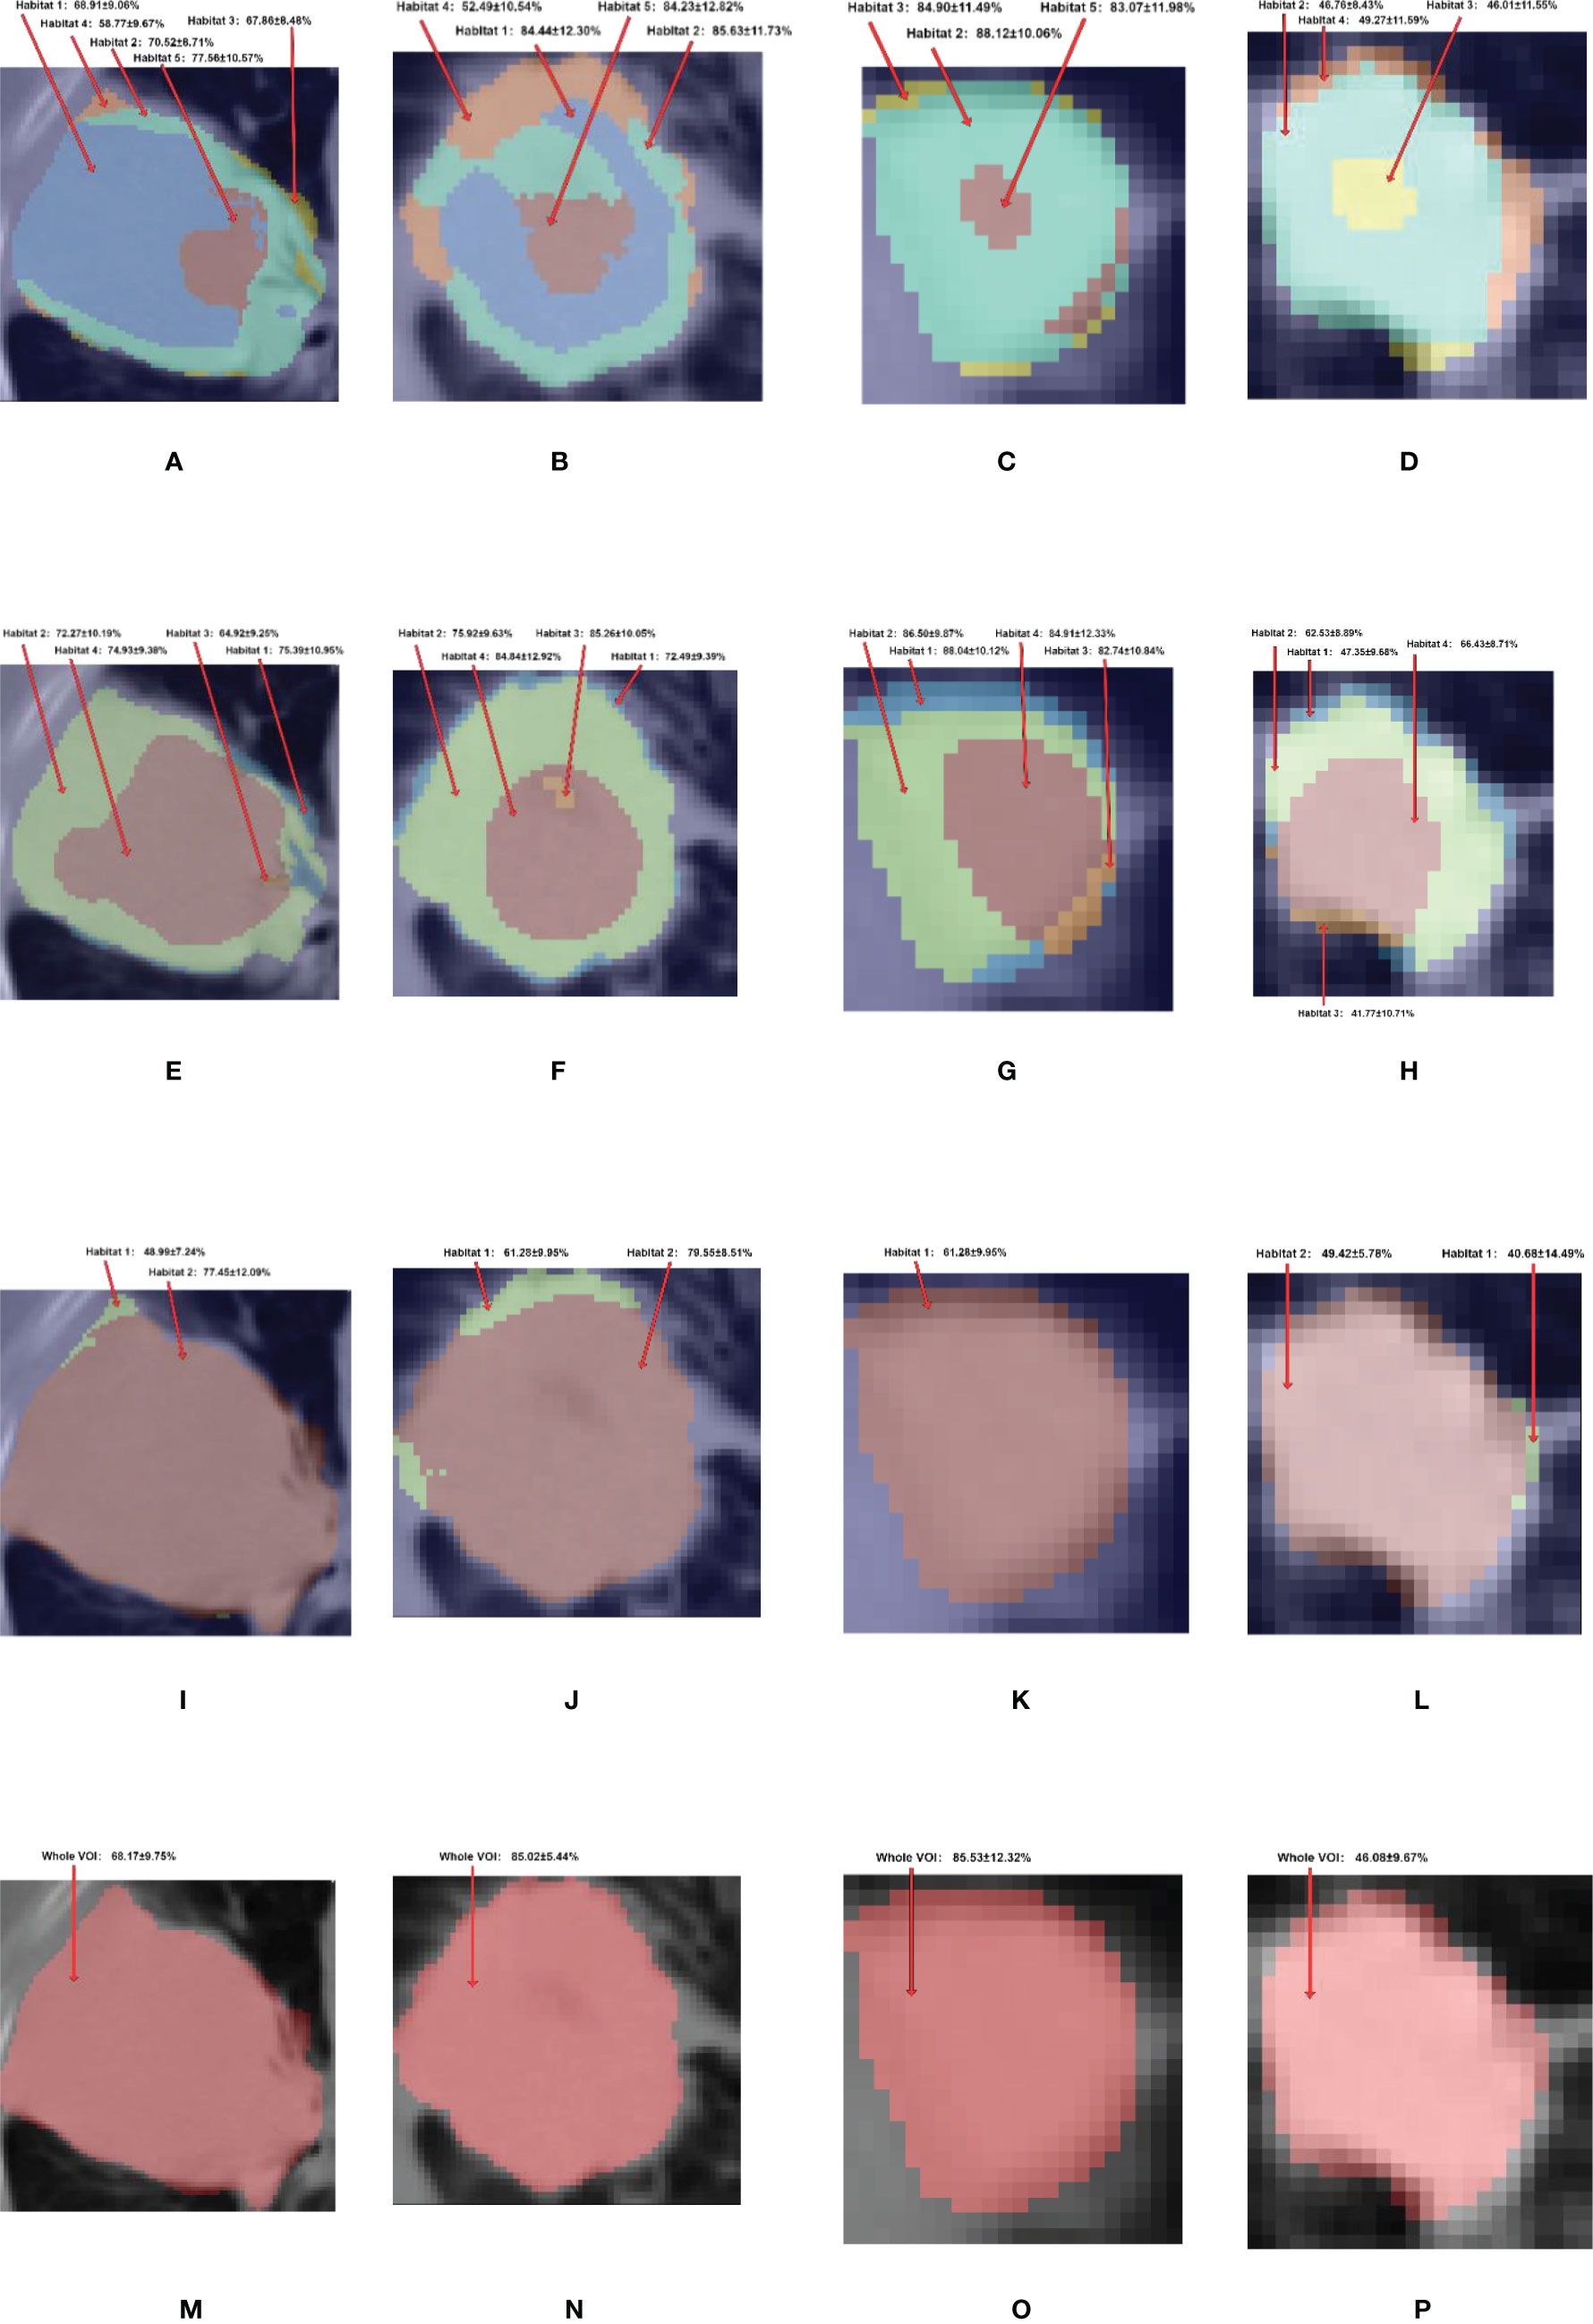
Figure 6 The habitat generated by (A–D) adapted clustering-based, (E–H) conventional thresholding-based, (I–L) conventional clustering-based, and (M–P) nonhabitat methods and their corresponding predicted probability. The first, second, third and fourth columns represent ADC, SCC, ASC and BID, respectively. For the adapted clustering-based method, the habitat 1 to 5 are showed in the colors of blue, aquamarine, yellow, orange and red respectively. For the conventional thresholding-based method, habitats 1–4 are showed in colors of blue, green, orange and red, respectively. For the conventional clustering-based method, the habitats 1 and 2 are showed in colors of green and red, respectively.
In this study, three kinds of habitat generation methods were compared. PET and CT radiomics features were extracted from these habitats. Radiomics models were then developed to compare the predictive performance metrics of these habitat generation methods. Since we had a highly unbalanced dataset, with 225 NSCLC cases and 92 BID cases, the evaluation metrics of accuracy, sensitivity, and specificity were highly affected by the discrimination threshold. Thus, we only compared the AUC to evaluate the difference in performance. The adapted clustering-based habitat radiomics model showed a significantly better AUC of 0.7329 ± 0.0170 in the fivefold testing sets than the non-habitat radiomics (p <.001), conventional thresholding-based radiomics (p <.001), and conventional clustering-based radiomics (p <.001) models. This finding implies that adapted clustering-based habitat radiomics has the potential to provide significant values to medical physicists and radiologists and help customize the therapeutic strategy for patients (36), e.g., with the help of habitats, medical physicists and radiologists can focus on the most malignant region for radiotherapy. Furthermore, we can see that habitat radiomics developed by combining adapted clustering-based features with conventional nonhabitat features shows the best predictive performance in terms of evaluation metrics compared with the other combinations.
To further analyze habitat radiomics, we selected four samples of ADC, SCC, ASC, and BID, and their corresponding PET/CT fusion images are shown in Figure 5. For these four samples, we plotted the habitats for each of the habitat generation methods, as shown in Figure 6. Moreover, the specific predictive values of the models, which were developed by the adapted clustering-based habitat, conventional thresholding-based habitat, and conventional nonhabitat radiomics, are marked accordingly in Figure 6. By looking at the habitats of the four samples generated by the adapted clustering-based method (the first row of Figure 6), we can see that habitat 2 tends to appear as a shell shape, habitat 4 tends to appear in relatively benign tissue, and habitat 5 tends to appear at the center of the lesion. Habitat 5 only appeared in these three NSCLC samples, while it did not appear in the BID sample. This finding was also supported by Figure 2D, which demonstrates that BID had almost no habitat 5, and if there was any sign of habitat 5, the volume was very small. Habitat 1 only appeared in ADC and SCC among the four samples. The four samples in the second row of Figure 6 were generated based on conventional thresholding-based method. Note that PETlow ∩ CTlow, PETlow ∩ CThigh, PEThigh ∩ CTlow, and PEThigh ∩ CThigh represent habitats 1–4, respectively. For these four cases, habitat 4 tends to appear in the tumor core region, while habitats 1 and 2 appeared as outer and inner shell shapes, respectively. Habitat 3 was shown in the tumor core as a small volume. However, all four samples showed a similar habitat pattern because of the characteristics of thresholding-based method. By looking at the third row of Figure 6, habitats generated by the conventional clustering-based method only obtained two kinds of habitats. Habitat 1 is very small and only focus on the rim of tumor, while habitat 2 almost occupies the whole volume. Note that we provided an overall predictive value by averaging the predictive values of all habitats for a lesion. Since the adapted clustering-based method is significantly better than the other habitat generation methods, it implicitly shows that the proposed habitat generation method can significantly improve the performance of the radiomics model.
The employment of habitat imaging is due to the subregional heterogeneity and complexity of the tumor microenvironment because there are complex metabolic contacts that appear in cancerous tissues. Given the domain knowledge, cancer cells often have increased glucose metabolism (37). To achieve this, glucose transporters are overexpressed in cancer cells to ensure glucose transportation for oncogenic transformation and progression. Regarding SCC, the histopathological subtype can be indicated by high expression of glucose transporter 1 (GLUT1) (38, 39), e.g., premalignant lesions of bronchial epithelium (40), which can be reflected by a high SUV in PET images. For ADC, the mass can consist of different levels of cell differentiation to demonstrate heterogeneity. Moreover, the expression of glucose transporters in ADC is also heterogeneous, e.g., the poorly differentiated and well-differentiated regions express GLUT1 and sodium-glucose cotransporter-2, respectively (41). On the other hand, inflammation is mainly caused by cells from innate immune system, while cancer cells have a mechanism of cancer immune escape (42). This mechanism allows cancer cells to competitively deprive glucose, an important nutrient, from immune cells (43). Thus, mining the microenvironmental heterogeneity captured by PET/CT can help medical physicists and radiologists better discriminate NSCLCs, and our result demonstrates that habitat imaging is a potential method for mining the heterogeneity of tumors and precise resection. Supplementary Figure 2 shows the density of habitat size proportion for each kind of lesion, and the differences between the distributions of four kinds of lesions are obvious by visual assessment.
Nevertheless, due to the limitation of sample size and imbalanced class, we used a different method to develop radiomics models. Although different kinds of habitats may have some kinds of difference, we still used habitat as a sample unit to develop models. Nevertheless, the optimal way is to develop tailored radiomics models for each habitat, which means that we should have had five different radiomics models for predicting corresponding habitats. Moreover, to further exploit the potential of habitat imaging, a prospective study should be conducted by jointly utilizing the medical images and the corresponding aligned whole-mount histology images (44). With the help of pathologists, the regions of interest for each NSCLC histopathological subtype can be delineated on histology images. In this case, the habitat generation method is no longer based on the predetermined handcrafted feature vector but is based on the experience of the pathologist. In addition, a thoughtful well-designed model development method can be used to jointly utilize the information from both histology images and PET/CT images and then to cluster the habitats of PET/CT images. Thus, a histopathological subtype can be determined by investigating whether a specific kind of habitat appeared on PET/CT images.
Habitat imaging is meaningful for dividing a lesion into multiple habitats based on metabolic and anatomic information and further analysis of the lesion. Habitat imaging-based 18F-FDG PET/CT radiomics shows potential as a biomarker for discriminating NSCLC and BIDs, which indicates that the microenvironment variations in NSCLC and BIDs can be captured by PET/CT.
The original contributions presented in the study are included in the article/Supplementary Material. Further inquiries can be directed to the corresponding authors.
This study was approved by the institutional review board of Zhejiang University, and the requirement for informed consent was waived since the data were analyzed retrospectively and anonymously.
Conceptualization, methodology and investigation: LC, KF, and HS. Writing, review, and editing, LC, KF, XZ, KZ, and WZ. All authors contributed to the article and approved the submitted version.
This work was supported by the Department of Education of Zhejiang Province (Y202043388) and the Key Research and Development Program of Zhejiang Province (2021C03029).
LC, HS, and WZ are employed by Zhejiang Lab.
The remaining authors declare that the research was conducted in the absence of any commercial or financial relationships that could be construed as a potential conflict of interest.
All claims expressed in this article are solely those of the authors and do not necessarily represent those of their affiliated organizations, or those of the publisher, the editors and the reviewers. Any product that may be evaluated in this article, or claim that may be made by its manufacturer, is not guaranteed or endorsed by the publisher.
The Supplementary Material for this article can be found online at: https://www.frontiersin.org/articles/10.3389/fonc.2021.759897/full#supplementary-material
1. Jemal A, Siegel R, Ward E, Hao Y, Xu J, Thun M. Cancer Statistics, 2009. CA: A Cancer J Clin (2009) 59(4):225. doi: 10.3322/caac.20006
2. Osmani L, Askin F, Gabrielson E, Li QK. Current WHO Guidelines and the Critical Role of Immunohistochemical Markers in the Subclassification of Non-Small Cell Lung Carcinoma (NSCLC): Moving From Targeted Therapy to Immunotherapy. Semin Cancer Biol (2018) 52(Pt 1):1037–109. doi: 10.1016/j.semcancer.2017.11.019
3. Gould MK, Fletcher J, Iannettoni MD, Lynch WR, Midthun DE, Naidich DP, et al. Evaluation of Patients With Pulmonary Nodules: When Is it Lung Cancer?: ACCP Evidence-Based Clinical Practice Guidelines. Chest (2007) 132(3):108S–30S. doi: 10.1378/chest.07-1353
4. Smith MA, Battafarano RJ, Meyers BF, Zoole JB, Cooper JD, Patterson GA. Prevalence of Benign Disease in Patients Undergoing Resection for Suspected Lung Cancer. Ann Thorac Surg (2006) 81(5):1824–9. doi: 10.1016/j.athoracsur.2005.11.010
5. Gould MK, Donington J, Lynch WR, Mazzone PJ, Midthun DE, Naidich DP, et al. Evaluation of Individuals With Pulmonary Nodules: When Is it Lung Cancer?: Diagnosis and Management of Lung Cancer: American College of Chest Physicians Evidence-Based Clinical Practice Guidelines. Chest (2013) 143(5):e93S–120S. doi: 10.1378/chest.12-2351
6. Schöder H, Erdi YE, Larson SM, Yeung HW. PET/CT: A New Imaging Technology in Nuclear Medicine. Eur J Nucl Med Mol Imaging (2003) 30(10):1419–37. doi: 10.1007/s00259-003-1299-6
7. Gambhir SS. Molecular Imaging of Cancer With Positron Emission Tomography. Nat Rev Cancer (2002) 2(9):683–93. doi: 10.1038/nrc882
8. Hinohara K, Polyak K. Intratumoral Heterogeneity: More Than Just Mutations. Trends Cell Biol (2019) 29(7):569–79. doi: 10.1016/j.tcb.2019.03.003
9. Greenspan BS. Role of PET/CT for Precision Medicine in Lung Cancer: Perspective of the Society of Nuclear Medicine and Molecular Imaging. Trans Lung Cancer Res (2017) 6(6):617. doi: 10.21037/tlcr.2017.09.01
10. Shim SS, Lee KS, Kim B-T, Chung MJ, Lee EJ, Han J, et al. Non–small Cell Lung Cancer: Prospective Comparison of Integrated FDG PET/CT and CT Alone for Preoperative Staging. Radiology (2005) 236(3):1011–9. doi: 10.1148/radiol.2363041310
11. Chun EJ, Lee HJ, Kang WJ, Kim KG, Goo JM, Park CM, et al. Differentiation Between Malignancy and Inflammation in Pulmonary Ground-Glass Nodules: The Feasibility of Integrated 18F-FDG PET/Ct. Lung Cancer (2009) 65(2):180–6. doi: 10.1016/j.lungcan.2008.11.015
12. Feng M, Yang X, Ma Q, He Y. Retrospective Analysis for the False Positive Diagnosis of PET-CT Scan in Lung Cancer Patients. Medicine (2017) 96(42):42. doi: 10.1097/MD.0000000000007415
13. Basu S, Saboury B, Werner T, Alavi A. Clinical Utility of FDG–PET and PET/CT in Non-Malignant Thoracic Disorders. Mol Imaging Biol (2011) 13(6):1051–60. doi: 10.1007/s11307-010-0459-x
14. Marwah N, Bhutani N, Dahiya S, Sen R. Inflammatory Pseudotumour: A Rare Tumor of Lung. Ann Med Surg (2018) 36:106–9. doi: 10.1016/j.amsu.2018.10.033
15. Aerts HJ, Velazquez ER, Leijenaar RT, Parmar C, Grossmann P, Carvalho S, et al. Decoding Tumour Phenotype by Noninvasive Imaging Using a Quantitative Radiomics Approach. Nat Commun (2014) 5(1):1–9. doi: 10.1038/ncomms5006
16. Lambin P, Leijenaar RT, Deist TM, Peerlings J, De Jong EE, Van Timmeren J, et al. Radiomics: The Bridge Between Medical Imaging and Personalized Medicine. Nat Rev Clin Oncol (2017) 14(12):749–62. doi: 10.1038/nrclinonc.2017.141
17. Sollini M, Antunovic L, Chiti A, Kirienko M. Towards Clinical Application of Image Mining: A Systematic Review on Artificial Intelligence and Radiomics. Eur J Nucl Med Mol Imaging (2019) 46(13):2656–72. doi: 10.1007/s00259-019-04372-x
18. Lovinfosse P, Polus M, Van Daele D, Martinive P, Daenen F, Hatt M, et al. FDG PET/CT Radiomics for Predicting the Outcome of Locally Advanced Rectal Cancer. Eur J Nucl Med Mol Imaging (2018) 45(3):365–75. doi: 10.1007/s00259-017-3855-5
19. Antunovic L, De Sanctis R, Cozzi L, Kirienko M, Sagona A, Torrisi R, et al. PET/CT Radiomics in Breast Cancer: Promising Tool for Prediction of Pathological Response to Neoadjuvant Chemotherapy. Eur J Nucl Med Mol Imaging (2019) 46(7):1468–77. doi: 10.1007/s00259-019-04313-8
20. Mu W, Tunali I, Gray JE, Qi J, Schabath MB, Gillies RJ. Radiomics of 18 F-FDG PET/CT Images Predicts Clinical Benefit of Advanced NSCLC Patients to Checkpoint Blockade Immunotherapy. Eur J Nucl Med Mol Imaging (2019) 47:1–15. doi: 10.1007/s00259-019-04625-9
21. O’Connor JP, Rose CJ, Waterton JC, Carano RA, Parker GJ, Jackson A. Imaging Intratumor Heterogeneity: Role in Therapy Response, Resistance, and Clinical Outcome. Clin Cancer Res (2015) 21(2):249–57. doi: 10.1158/1078-0432.CCR-14-0990
22. Farjam R, Tsien CI, Feng FY, Gomez-Hassan D, Hayman JA, Lawrence TS, et al. Physiological Imaging-Defined, Response-Driven Subvolumes of a Tumor. Int J Radiat Oncol Biol Phys (2013) 85(5):1383–90. doi: 10.1016/j.ijrobp.2012.10.036
23. Gatenby RA, Grove O, Gillies RJ. Quantitative Imaging in Cancer Evolution and Ecology. Radiology (2013) 269(1):8–14. doi: 10.1148/radiol.13122697
24. Wu J, Gensheimer MF, Dong X, Rubin DL, Napel S, Diehn M, et al. Robust Intratumor Partitioning to Identify High-Risk Subregions in Lung Cancer: A Pilot Study. Int J Radiat Oncol Biol Phys (2016) 95(5):1504–12. doi: 10.1016/j.ijrobp.2016.03.018
25. Xu H, Lv W, Feng H, Du D, Yuan Q, Wang Q, et al. Subregional Radiomics Analysis of PET/CT Imaging With Intratumor Partitioning: Application to Prognosis for Nasopharyngeal Carcinoma. Mol Imaging Biol (2020) 22(5):1414–26. doi: 10.1007/s11307-019-01439-x
26. Mu W, Liang Y, Hall LO, Tan Y, Balagurunathan Y, Wenham R, et al. 18f-FDG PET/CT Habitat Radiomics Predicts Outcome of Patients With Cervical Cancer Treated With Chemoradiotherapy. Radiol: Artif Intell (2020) 2(6):e190218. doi: 10.1148/ryai.2020190218
27. Otsu N. A Threshold Selection Method From Gray-Level Histograms. IEEE Trans Syst Man Cybernet (1979) 9(1):62–6. doi: 10.1109/TSMC.1979.4310076
28. Yushkevich PA, Piven J, Hazlett HC, Smith RG, Ho S, Gee JC, et al. User-Guided 3D Active Contour Segmentation of Anatomical Structures: Significantly Improved Efficiency and Reliability. Neuroimage (2006) 31(3):1116–28. doi: 10.1016/j.neuroimage.2006.01.015
29. Caliński T, Harabasz J. A Dendrite Method for Cluster Analysis. Commun Stat-Theory Methods (1974) 3(1):1–27. doi: 10.1080/03610927408827101
30. Van Griethuysen JJ, Fedorov A, Parmar C, Hosny A, Aucoin N, Narayan V, et al. Computational Radiomics System to Decode the Radiographic Phenotype. Cancer Res (2017) 77(21):e104–7. doi: 10.1158/0008-5472.CAN-17-0339
31. Zwanenburg A, Leger S, Vallières M, Löck S. Image Biomarker Standardisation Initiative-Feature Definitions. arXiv (2016). preprint arXiv:161207003. doi: 10.1148/radiol.2020191145
32. Zwanenburg A, Vallières M, Abdalah MA, Aerts HJ, Andrearczyk V, Apte A, et al. The Image Biomarker Standardization Initiative: Standardized Quantitative Radiomics for High-Throughput Image-Based Phenotyping. Radiology (2020) 295(2):328–38. doi: 10.1148/radiol.2020191145
33. Prasanna P, Tiwari P, Madabhushi A. Co-Occurrence of Local Anisotropic Gradient Orientations (CoLlAGe): A New Radiomics Descriptor. Sci Rep (2016) 6(1):1–14. doi: 10.1038/srep37241
34. Rincón JS, Castro-Ospina AE, Narváez FR, Díaz GM eds. Machine Learning Methods for Classifying Mammographic Regions Using the Wavelet Transform and Radiomic Texture Features. International Conference on Technology Trends. Babahoyo, Ecuador: Springer (2018).
35. Hanley JA, McNeil BJ. The Meaning and Use of the Area Under a Receiver Operating Characteristic (ROC) Curve. Radiology (1982) 143(1):29–36. doi: 10.1148/radiology.143.1.7063747
36. Herbst RS, Morgensztern D, Boshoff C. The Biology and Management of Non-Small Cell Lung Cancer. Nature (2018) 553(7689):446–54. doi: 10.1038/nature25183
37. Birsoy K, Possemato R, Lorbeer FK, Bayraktar EC, Thiru P, Yucel B, et al. Metabolic Determinants of Cancer Cell Sensitivity to Glucose Limitation and Biguanides. Nature (2014) 508(7494):108–12. doi: 10.1038/nature13110
38. Meijer TW, Looijen-Salamon MG, Lok J, van den Heuvel M, Tops B, Kaanders JH, et al. Glucose and Glutamine Metabolism in Relation to Mutational Status in NSCLC Histological Subtypes. Thorac Cancer (2019) 10(12):2289–99. doi: 10.1111/1759-7714.13226
39. Tan Z, Yang C, Zhang X, Zheng P, Shen W. Expression of Glucose Transporter 1 and Prognosis in Non-Small Cell Lung Cancer: A Pooled Analysis of 1665 Patients. Oncotarget (2017) 8(37):60954. doi: 10.18632/oncotarget.17604
40. Ooi AT, Gower AC, Zhang KX, Vick JL, Hong L, Nagao B, et al. Molecular Profiling of Premalignant Lesions in Lung Squamous Cell Carcinomas Identifies Mechanisms Involved in Stepwise Carcinogenesis. Cancer Prev Res (2014) 7(5):487–95. doi: 10.1158/1940-6207.CAPR-13-0372
41. Scafoglio CR, Villegas B, Abdelhady G, Bailey ST, Liu J, Shirali AS, et al. Sodium-Glucose Transporter 2 Is a Diagnostic and Therapeutic Target for Early-Stage Lung Adenocarcinoma. Sci Trans Med (2018) 10(467). doi: 10.1126/scitranslmed.aat5933
42. Chang C-H, Qiu J, O’Sullivan D, Buck MD, Noguchi T, Curtis JD, et al. Metabolic Competition in the Tumor Microenvironment Is a Driver of Cancer Progression. Cell (2015) 162(6):1229–41. doi: 10.1016/j.cell.2015.08.016
43. Na KJ, Choi H, Oh HR, Kim YH, Lee SB, Jung YJ, et al. Reciprocal Change in Glucose Metabolism of Cancer and Immune Cells Mediated by Different Glucose Transporters Predicts Immunotherapy Response. Theranostics (2020) 10(21):9579. doi: 10.7150/thno.48954
Keywords: 18F-FDG PET/CT, habitat imaging, radiomics, inflammation, non-small cell lung cancer
Citation: Chen L, Liu K, Zhao X, Shen H, Zhao K and Zhu W (2021) Habitat Imaging-Based 18F-FDG PET/CT Radiomics for the Preoperative Discrimination of Non-small Cell Lung Cancer and Benign Inflammatory Diseases. Front. Oncol. 11:759897. doi: 10.3389/fonc.2021.759897
Received: 17 August 2021; Accepted: 14 September 2021;
Published: 06 October 2021.
Edited by:
Xu Cao, Dartmouth College, United StatesReviewed by:
Wenbing Lv, Southern Medical University, ChinaCopyright © 2021 Chen, Liu, Zhao, Shen, Zhao and Zhu. This is an open-access article distributed under the terms of the Creative Commons Attribution License (CC BY). The use, distribution or reproduction in other forums is permitted, provided the original author(s) and the copyright owner(s) are credited and that the original publication in this journal is cited, in accordance with accepted academic practice. No use, distribution or reproduction is permitted which does not comply with these terms.
*Correspondence: Kui Zhao, emhhb2t1aTA5MDVAemp1LmVkdS5jbg==; Wentao Zhu, d2VudGFvLnpodUB6aGVqaWFuZ2xhYi5jb20=
†These authors have contributed equally to this work
Disclaimer: All claims expressed in this article are solely those of the authors and do not necessarily represent those of their affiliated organizations, or those of the publisher, the editors and the reviewers. Any product that may be evaluated in this article or claim that may be made by its manufacturer is not guaranteed or endorsed by the publisher.
Research integrity at Frontiers
Learn more about the work of our research integrity team to safeguard the quality of each article we publish.