 Jin-feng Pan1,2†
 Rui Su2,3,4†
 Jian-zhou Cao1,2Zhen-ya Zhao5Da-wei Ren5Sha-zhou Ye4,6Rui-da Huang1,2Zhu-lei Tao1,2Cheng-ling Yu4,6Jun-hui Jiang3,4*
 Qi Ma2,3,4,6*
- 1Medical School, Ningbo University, Ningbo, China
- 2Comprehensive Urogenital Cancer Center, Ningbo First Hospital, The Affiliated Hospital of Ningbo University, Ningbo, China
- 3Department of Urology, Ningbo First Hospital, The Affiliated Hospital of Ningbo University, Ningbo, China
- 4Ningbo Clinical Research Center for Urological Disease, Ningbo, China
- 5Department of Radiology, Ningbo First Hospital, The Affiliated Hospital of Ningbo University, Ningbo, China
- 6Translational Research Laboratory for Urology, the Key Laboratory of Ningbo City, Ningbo First Hospital, The Affiliated Hospital of Ningbo University, Ningbo, China
Purpose: The purpose of this study is to explore the value of combining bpMRI and clinical indicators in the diagnosis of clinically significant prostate cancer (csPCa), and developing a prediction model and Nomogram to guide clinical decision-making.
Methods: We retrospectively analyzed 530 patients who underwent prostate biopsy due to elevated serum prostate specific antigen (PSA) levels and/or suspicious digital rectal examination (DRE). Enrolled patients were randomly assigned to the training group (n = 371, 70%) and validation group (n = 159, 30%). All patients underwent prostate bpMRI examination, and T2-weighted imaging (T2WI) and diffusion-weighted imaging (DWI) sequences were collected before biopsy and were scored, which were respectively named T2WI score and DWI score according to Prostate Imaging Reporting and Data System version 2 (PI-RADS v.2) scoring protocol, and then PI-RADS scoring was performed. We defined a new bpMRI-based parameter named Total score (Total score = T2WI score + DWI score). PI-RADS score and Total score were separately included in the multivariate analysis of the training group to determine independent predictors for csPCa and establish prediction models. Then, prediction models and clinical indicators were compared by analyzing the area under the curve (AUC) and decision curves. A Nomogram for predicting csPCa was established using data from the training group.
Results: In the training group, 160 (43.1%) patients had prostate cancer (PCa), including 128 (34.5%) with csPCa. Multivariate regression analysis showed that the PI-RADS score, Total score, f/tPSA, and PSA density (PSAD) were independent predictors of csPCa. The prediction model that was defined by Total score, f/tPSA, and PSAD had the highest discriminatory power of csPCa (AUC = 0.931), and the diagnostic sensitivity and specificity were 85.1% and 87.5%, respectively. Decision curve analysis (DCA) showed that the prediction model achieved an optimal overall net benefit in both the training group and the validation group. In addition, the Nomogram predicted csPCa revealed good estimation when compared with clinical indicators.
Conclusion: The prediction model and Nomogram based on bpMRI and clinical indicators exhibit a satisfactory predictive value and improved risk stratification for csPCa, which could be used for clinical biopsy decision-making.
Introduction
PCa is the second leading cause of cancer death in American men (1). An estimated 174,650 new cases were diagnosed in America in 2019, and 31,620 men are likely to die due to this malignant disease (2). Serum PSA is widely used in PCa screening due to its high diagnostic sensitivity and low testing cost (3). However, decades of clinical experience have shown that PSA is not ideal in terms of specificity, often leading to either overdiagnosis or overtreatment (4–6). Prostate biopsy is the most valuable method in the diagnosis of PCa (7, 8). Although preoperative preparation is actively improved, hemospermia, hematuria, and urinary tract infection are still the main adverse effects (9). Therefore, development of specific biomarkers or diagnostic tools for PCa is necessary (4, 10).
Multiparametric MRI (mpMRI) is the optimum imaging technology for the diagnosis and monitoring of PCa (11). Prebiopsy mpMRI scan has also shown promising results in PCa risk stratification (12). The Prostate Imaging Reporting and Data System (PI-RADS) is the most accepted guideline for the assessment of PCa based on mpMRI (13). However, widespread adoption of the mpMRI requires long acquisition time, incurs prohibitive costs, and increases the risk associated with contrast agents (14, 15). Thus, efforts have been made to introduce bpMRI, which uses shorter scanning time and without intravenous contrast agent. Several previous studies have compared the diagnostic accuracy of mpMRI and bpMRI, which suggested that the bpMRI is comparable to the mpMRI in the diagnosis of PCa and csPCa (16–18).
Though PSA and MRI are widely performed to diagnose PCa, both of them have certain false-negative rate and false-positive rate, especially if results are near the diagnostic threshold regions. Therefore, some studies attempt to combine MRI with clinical indicators to construct risk prediction models or Nomogram to improve the diagnostic accuracy of PCa (19). Niu et al. (20) designed a prediction model based on bpMRI that included age, PI-RADS score, and PSAD, and the sensitivity and specificity for the diagnosis of csPCa were 87.3% and 78.4%, respectively. Another single-center retrospective study constructed a diagnostic Nomogram also based on PSA, PSAD, and PI-RADS (bpMRI), with an AUC of 0.832 for csPSA (21).
Recent studies have shown that the combination of T2WI and DWI in bpMRI has satisfied accuracy in the detection of csPCa (16, 22). In this study, we established a novel bpMRI-based score system and constructed a more convenient prediction model in combination of this score system with clinical indicators. The purpose of the study is to evaluate whether our prediction model improves detection of csPCa and reduces the number of unnecessary biopsies. Furthermore, we constructed a Nomogram based on this model, and we believe that the Nomogram is effective and helpful for clinicians in biopsy decision-making.
Patients and Methods
Study Design and Participants
Between January 2018 and August 2020, a total of 618 men with clinical suspicion of PCa (PSA > 4 ng/ml and/or suspicious DRE results) underwent transrectal ultrasound (TRUS)-guided transperineal prostate biopsy in Ningbo First Hospital (this included both biopsy naive men as well as those with a prior negative biopsy). Inclusion criteria were PSA > 4 ng/ml and/or suspicious DRE result, and patients who underwent prostate bpMRI scan within 3 months prior to biopsy. Clinical indicators including age, tPSA, fPSA, f/tPSA, prostate volume (PV), and PSAD were also collected and measured. Exclusion criteria were treatment prior to biopsy (e.g., prostate surgery, chemotherapy, radiation therapy, or androgen deprivation therapy), bpMRI scan performed after biopsy, and incomplete data. Finally, a total of 530 patients were included in this study, 70% (n = 371) of the patients were randomly assigned to the training group, and 30% (n = 159) of the patients were assigned to the validation group. This study protocol was reviewed and approved by the Ethical Committee of Ningbo First Hospital (Ethical Approval Number: 2021B005). Written informed consent for prostate biopsy was routinely obtained before operation, and the need for informed consent of this study from patients was waived.
bpMRI Protocol and Scoring Criteria
All bpMRI examinations were conducted with Siemens Magnetom Sonata 1.5-T superconducting MR scanner (sagittal, axial, and coronal T2WI: TR 3900 ms, TE 100 ms, FOV: 240×180, matrix: 240×160; DWI: TR 4900 ms, TE 89ms, FOV: 260×260, matrix: 100×124). The total scan time will be approximately 20 min. The routine scan protocol included T1WI, T2WI, and DWI (ADC) using body array coils (no endorectal coil). The maximum transverse diameter and anteroposterior diameter were measured in the transverse T2WI sequence, and the superoinferior diameter was measured in the sagittal T2WI sequence; PV was calculated by using the formula for prostate ellipsoid (transverse width × transverse length × longitudinal height × 0.52). Two experienced urological radiologists (Dr. ZYZ and Dr. DWR) who were blinded to pathological results and clinical information have analyzed and recorded the T2WI score and DWI score separately according to PI-RADS v.2 scoring protocol (23), and the comprehensive PI-RADS score was also performed on the bpMRI results. The different scores were discussed again until consensus was reached. Both the T2WI score and the DWI score of bpMRI results use a five-point scale based on findings on bpMRI performance. According to the PI-RADS v.2, we added the T2WI score and DWI score to obtain the Total score. The differences between PI-RADS v.2 score and Total score are summarized in Supplementary Table S1. In order to compare the diagnostic performance of PI-RADS score and Total score of bpMRI, they were separately included in multivariate analysis of the training group to determine independent predictors for PCa and csPCa.
Prostate Biopsy and Histopathology and Definition
All biopsy operations were performed by the same experienced urological radiologist (Dr. RS) using a 7.5-MHz endocavity ultrasonic probe with color Doppler ultrasonography. Ten biopsy samples were obtained from each patient. If hypoechoic suspicious areas in peripheral zones or transition zones were found in MRI or ultrasound images, additional one to two targeted cores were also performed. All biopsy samples’ histopathological results were reported by Ningbo Pathology Center using the 2014 International Society of Urological Pathology (ISUP) modified Gleason grading system. A Gleason score of 3 + 4 or higher (ISUP ≥ 2) was defined as csPCa as the European Association of Urology Guidelines on Prostate Cancer suggested (24).
Statistical Analysis
Patient characteristics were grouped according to biopsy results and summarized using descriptive statistics. Continuous variables are described as means ± standard deviations (SD) or medians and interquartile ranges (IQRs). Independent sample t-test was used for comparison between the csPCa group and the non-csPCa group. Multivariate regression analysis was used to determine the independent predictors for biopsy outcomes. Receiver operating characteristic (ROC) curve analysis and the AUC were used to examine the diagnostic performance of prediction models and clinical indicators. Spearman rank correlation was performed to analyze the relationship of categorical variables. AUC, sensitivity, specificity, negative predictive value (NPV), and positive predictive value (PPV) for each method were calculated and compared. The predictive accuracy of prediction models was validated using samples in the validation group to decrease the overfit bias. The best cutoff points for a biopsy threshold that balanced sensitivity and specificity was calculated using Youden’s J index (sensitivity + specificity − 1). ROC curves were compared by use of the method of DeLong et al. (25). Decision curve analysis (DCA) was performed and the greatest net benefit at a specific threshold probability was identified as that with the greatest clinical value. Further, Nomogram and calibration were also performed. The accuracy of the Nomogram was estimated in the training and validation groups. A p-value of <0.05 was considered statistically significant. Statistical analyses were performed with IBM SPSS (version 23.0), MedCalc (version 19.3), and R statistical software (version 4.0.4).
Results
Patient Characteristics and bpMRI Results
A total of 530 patients who met the inclusion criteria were enrolled in this study. Figure 1 is a flowchart that describes how patients and data were selected from the hospital information system (HIS). The training group and validation group consisted of 371 (70%) and 159 (30%) men, respectively, and there was no statistical difference in data characteristics between the two groups (p < 0.05). In the training group, 160 (43.1%) patients had PCa, namely, 128 (34.5%) with csPCa and 32 (8.6%) with low-grade PCa (Gleason score = 6) based on the results from both targeted and systemic biopsies (Table 1). Regarding the clinical indicators, age (69.85 ± 8.07 vs. 65.86 ± 8.33 years, p < 0.001), tPSA [16.63 (8.10–24.66) vs. 10.00 (7.09–15.57) ng/ml, p < 0.001], PV [34.41 (24.70–48.01) vs. 47.42 (32.05–67.10) ml, p < 0.001], f/tPSA [0.10 (0.07–0.13) vs. 0.15 (0.11–0.18), p < 0.001], and PSAD [0.46 (0.26–0.72) vs. 0.21 (0.14–0.33) ng/ml, p < 0.001] were significantly higher in csPCa patients compared with non-csPCa (low-grade PCa and non-malignant disease) (Table 1).
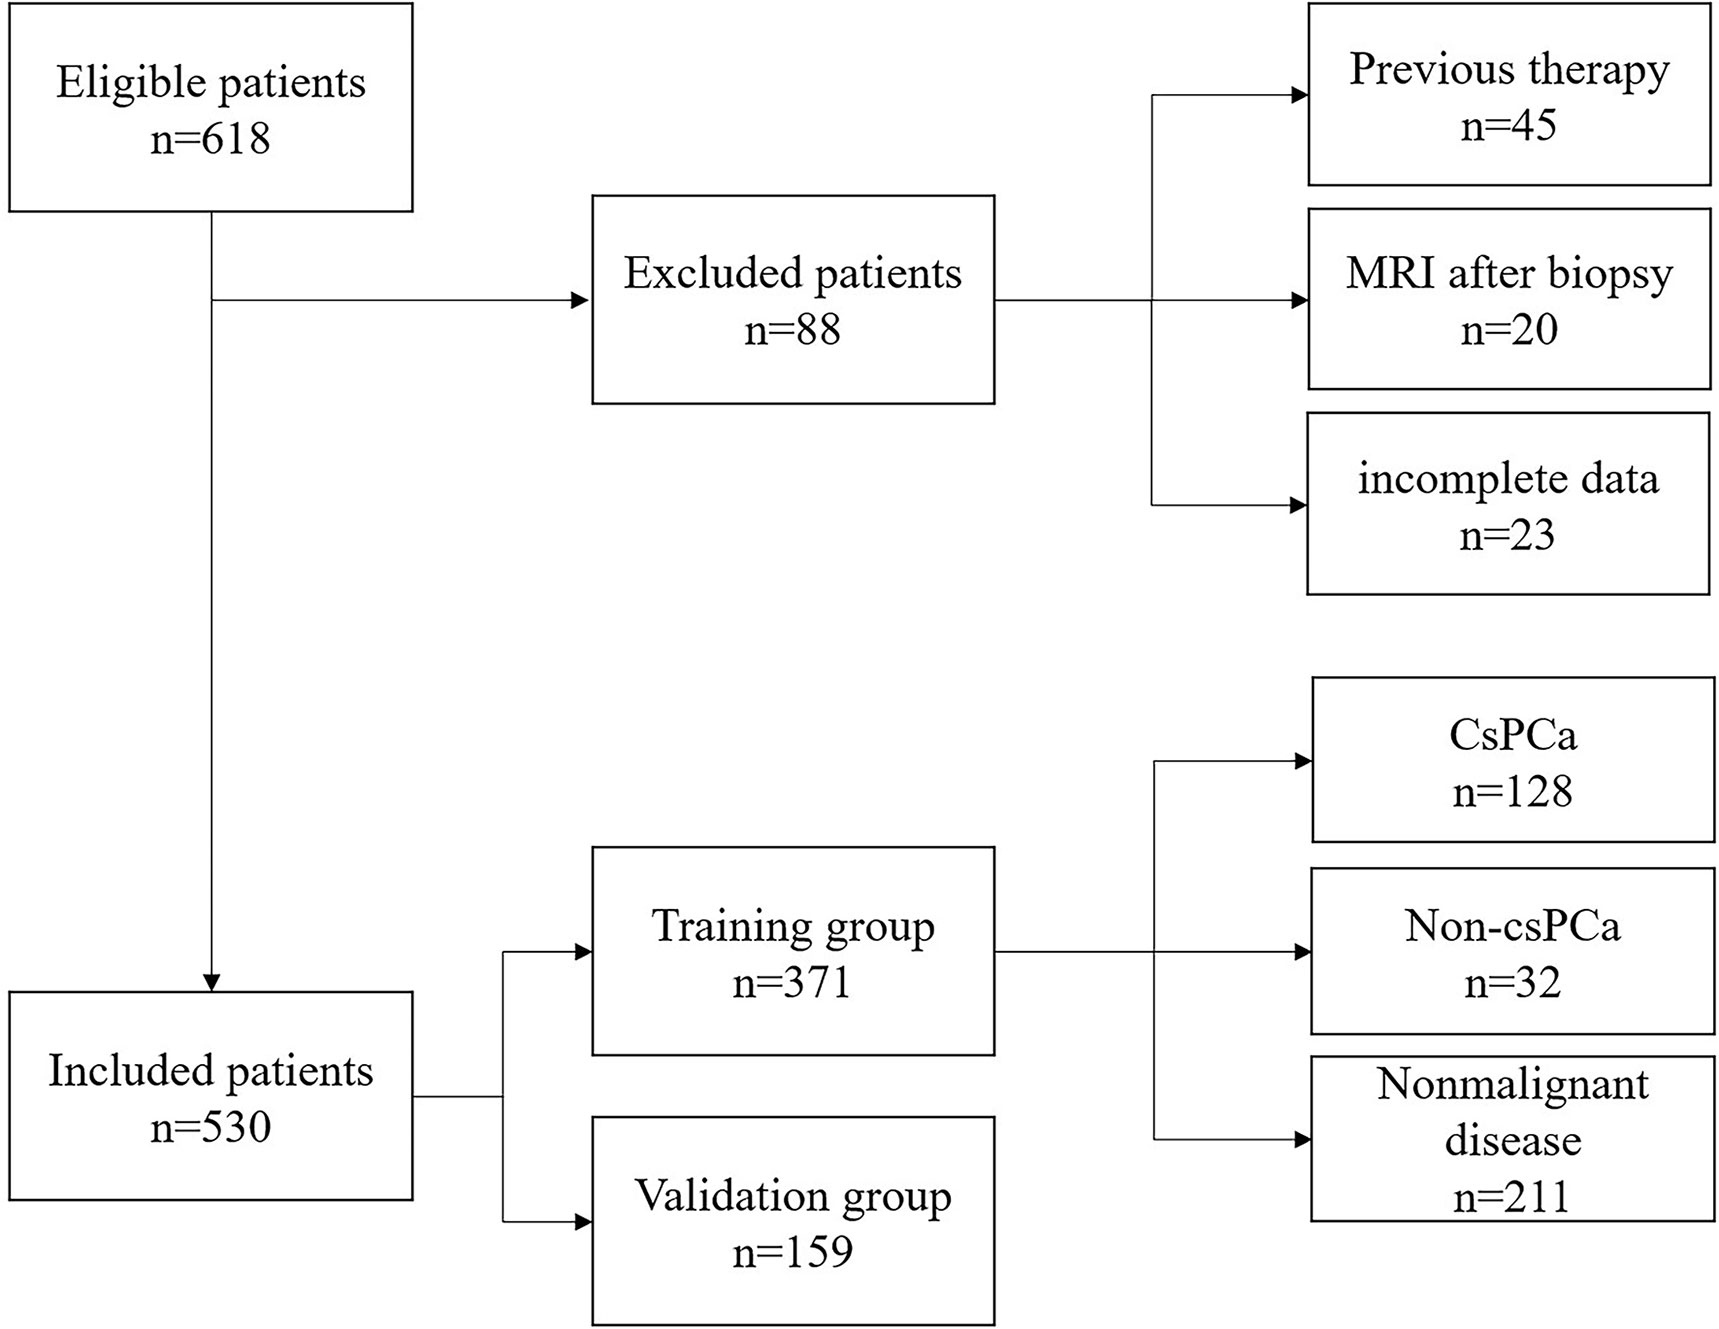
Figure 1 Flow diagram of the inclusion and exclusion criteria in this research.
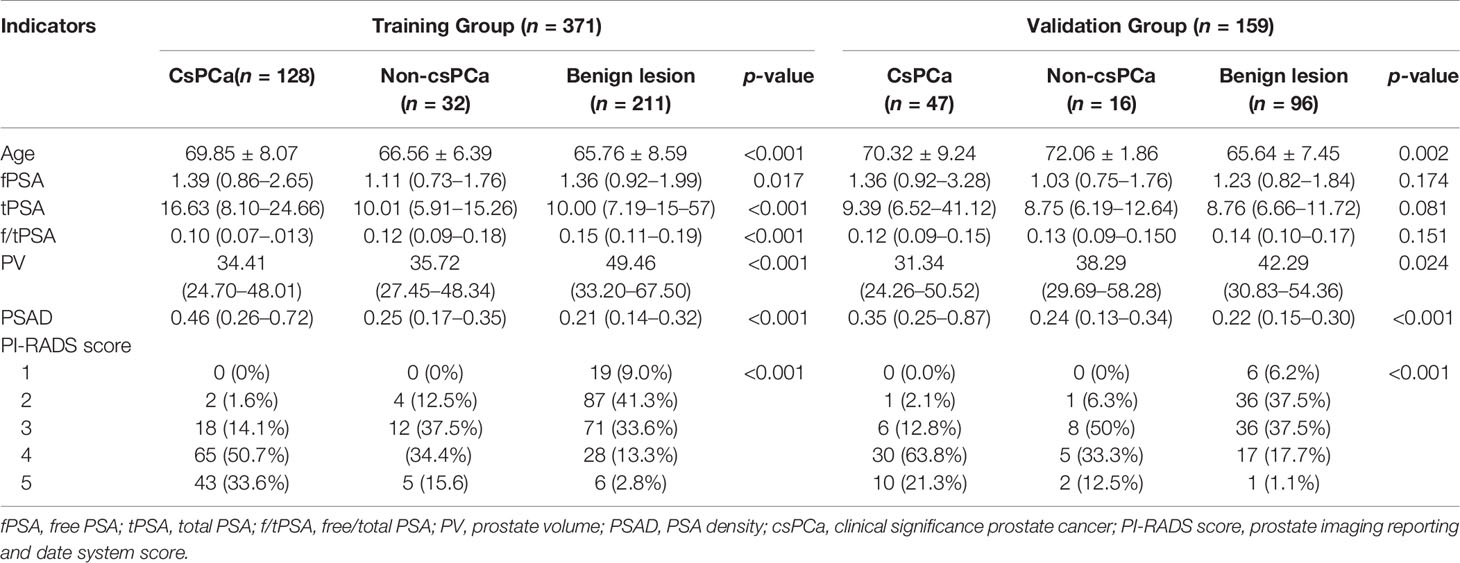
Table 1 Patient demographics and clinical characteristics of the training group and the validation group.
According to the bpMRI results, patients with PI-RADS score not less than three in the training group had a 59.5% (154/259) risk of PCa, compared to men with a lower score 5.4% (6/112). In addition, a total of 112 cases were scored as 1 and 2, namely, 2 cases of csPCa, 4 cases of low-grade PCa, and 106 cases of non-malignant lesions. A total of 101 cases were scored as 3, namely, 18 cases of csPCa, 12 cases of low-grade PCa, and 71 cases of non-malignant lesions. Regarding PI-RADS score 4 and 5, there were 108 cases of csPCa, 16 cases of non-csPCa, and 34 cases of non-malignant lesions (Table 1). If the cutoff value for biopsy decision is set as PI-RADS < 4, 83.1% (177/213) of patients could avoid biopsy, at the price of missing 11.3% (20/177) csPCa cases (Table 1). According to our results, it was apparent that a Total score of 6 was the optimal threshold for detecting csPCa according to ROC curve analysis and Youden’s index calculation; 87.2% (163/187) of patients with a Total score of 2–5 could avoid biopsy at the price of missing 6.9% (13/187) csPCa cases (Table 4A).
ROC Curve Analysis and Prediction Models Establishment
According to ROC curve analysis, the AUCs for diagnosing PCa and csPCa were summarized in Table 2. Total score achieved the highest diagnostic accuracy [AUC = 0.903 (0.872–0.933), p < 0.001] in distinguishing patients with or without csPCa compared with other indicators, and had 80.5% sensitivity and 86.4% specificity. Regarding PSA derivatives, PSAD has the best diagnostic accuracy in predicting PCa [AUC = 0.734 (0.682–0.787), p < 0.001] and csPCa [AUC = 0.765 (0.711–0.819), p < 0.001] compared with other PSA derivatives (Table 2). In univariable analysis, all clinical indicators were significant predictors for PCa and csPCa, except for fPSA (p > 0.05) (Table 1). Spearman analysis showed that age, fPSA, tPSA, PSAD, PI-RADS score, and Total score were significantly correlated with Gleason score; Total score was most strongly associated with the malignancy of PCa (Table 2).
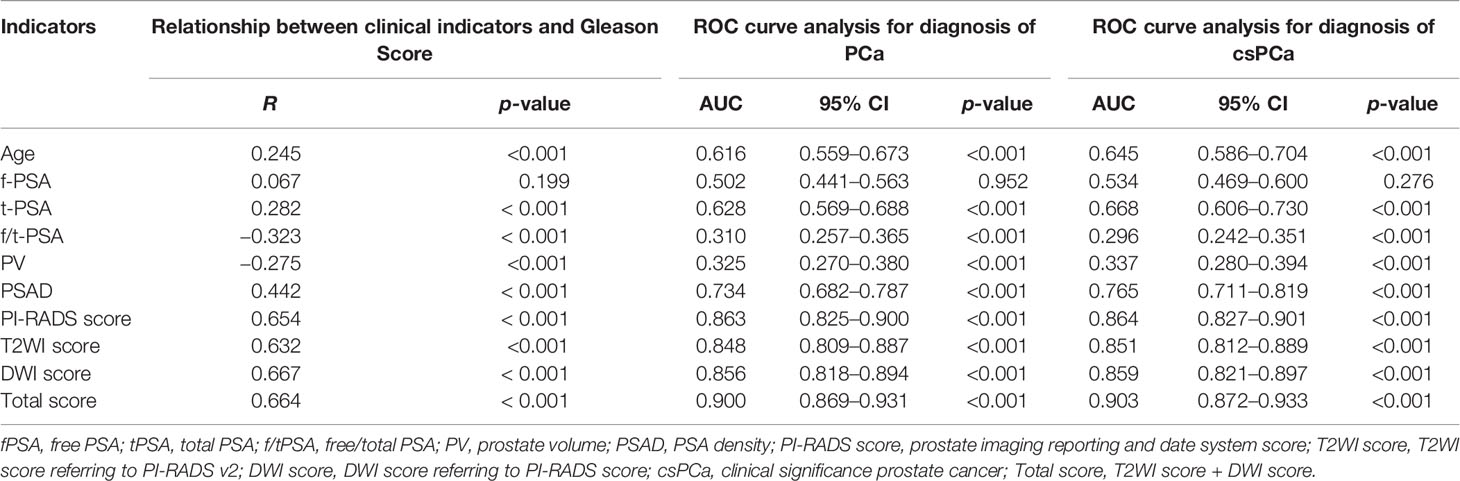
Table 2 Relationship between prebiopsy clinical indicators and Gleason score and evaluating the diagnostic performance of each variable for predicting PCa and csPCa using receiver operating characteristic curve analysis.
To further construct a predictive model for biopsy decision, we performed a stepwise multivariable logistic regression analysis to eliminating the redundant variables and avoiding multicollinearity. Finally, two prediction models were established. F/tPSA, PSAD, and PI-RADS score were incorporated in model 1 (each p < 0.001); f/tPSA, PSAD, and Total score were incorporated in model 2 (each p < 0.001) for detection of PCa and csPCa, respectively (Table 3). Regarding csPCa detection rate with prediction models, the AUCs of model 1 and model 2 were 0.910 (0.881–0.939, p < 0.001) and 0.931 (0.906–0.956, p < 0.001) for the training group and 0.878 (0.817–0.926, p < 0.001) and 0.910 (0.865–0.954, p < 0.001) for the validation group (Figure 2). The ROC curve analysis showed that model 2 was significantly better than model 1 in both the training group and the validation group according to Delong test (Supplementary Table S2). Model 2 had 88.3% sensitivity and 84.4% specificity for diagnosing csPCa. Using the model 2, 85.5% (188/220) of the study patients would have avoided biopsies and 15 csPCa (6.8%,15/220) would have been missed. Sensitivity, specificity, PPV, NPV, and AUC of PSAD; Total score; and two prediction models in the detection of csPCa are reported in Table 4.
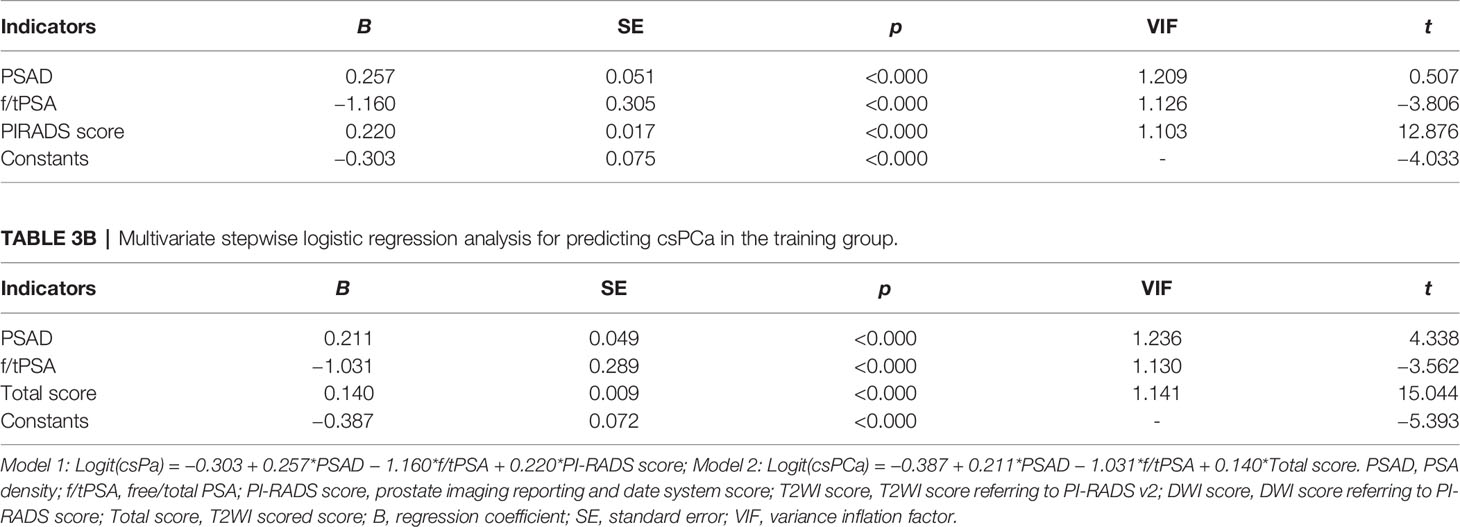
Table 3a Multivariate stepwise logistic regression analysis for predicting csPCa in the training group.
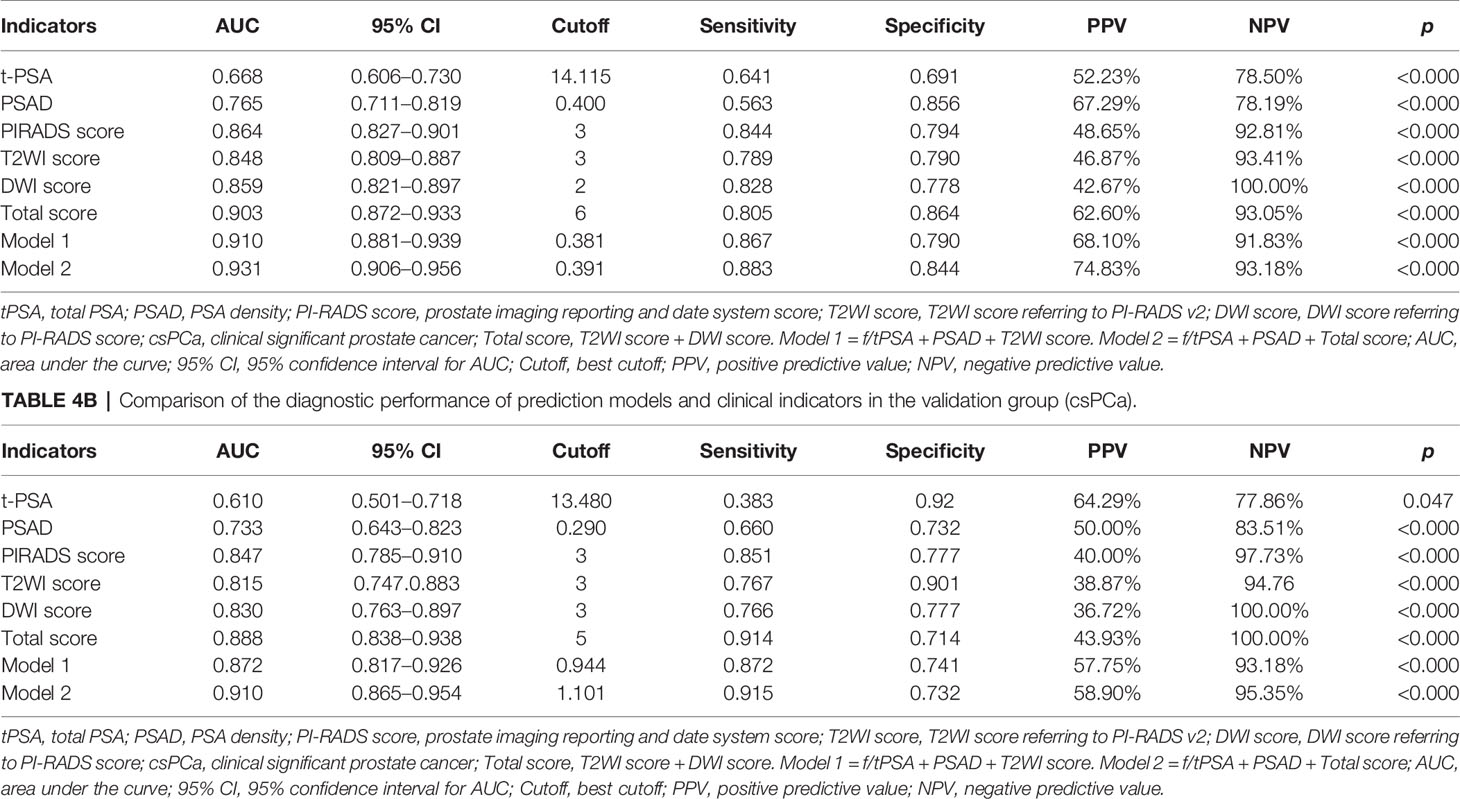
Table 4a Comparison of the diagnostic performance of prediction models and clinical indicators in the training group (csPCa).
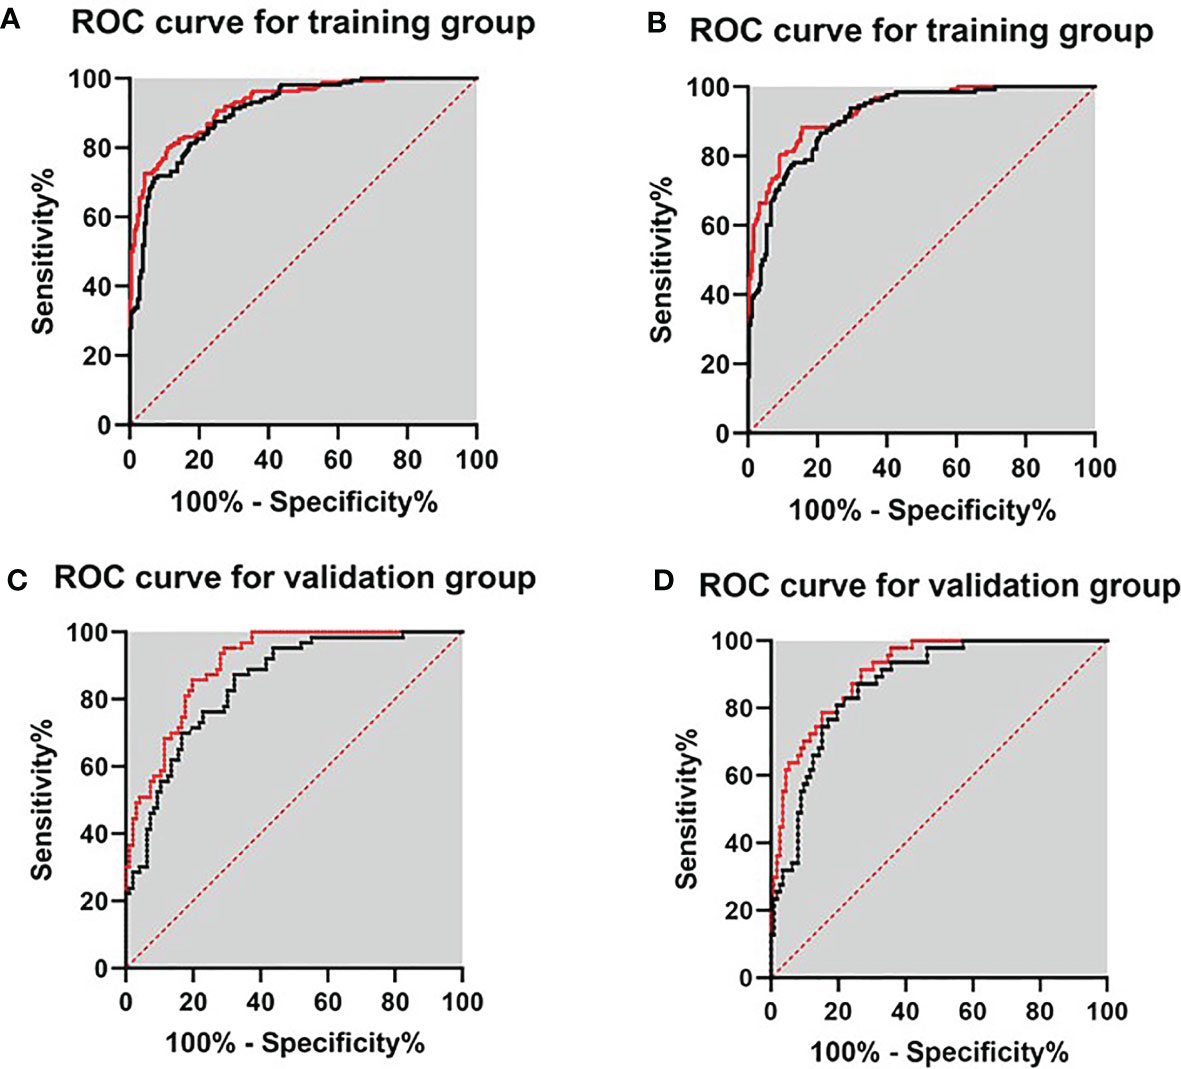
Figure 2 ROC curves for validating the discrimination of two prediction models in the training group and validation group. (A) Diagnosis of PCa in the training group. (B) Diagnosis of csPCa in the training group. (C) Diagnosis of PCa in the validation group. (D) Diagnosis of csPCa in the validation group.
DCA and Comparison of the Net Benefit of Models and Clinical Indicators
To assess the potential clinical benefit of the two models and clinical indicators, we performed DCA using the predicted risk in the training group and validation group. The overall utility of the decision models (i.e., PSA, PI-RADS score, Total score, model 1, and model 2) were examined (Figure 3 and Supplemental Figure S1). Two models showed a higher net benefit than PSA when the threshold probability was 0.05–0.80. Model 2 showed the highest net benefit with threshold probabilities > 0.25, superior to other indicators. Assuming we choose to diagnose and treat csPCa with a predicted probability of 20%, for every 100 men using Model 2, 32 will benefit without detriment to anyone else. For every 100 men who use PSA, only 25 men benefit and without detriment to anyone else. If the threshold probability > 20%, Model 2 also has a better net benefit than other indicators such as PI-RADS score and Total score (Figure 3). For example, applying a biopsy risk threshold of 40% meant that 57.1% of all men could avoid a biopsy; clinical impact curve (CIC) visually indicated the high clinical net benefit and confirmed the clinical value of model 2 (Supplemental Figure S2).
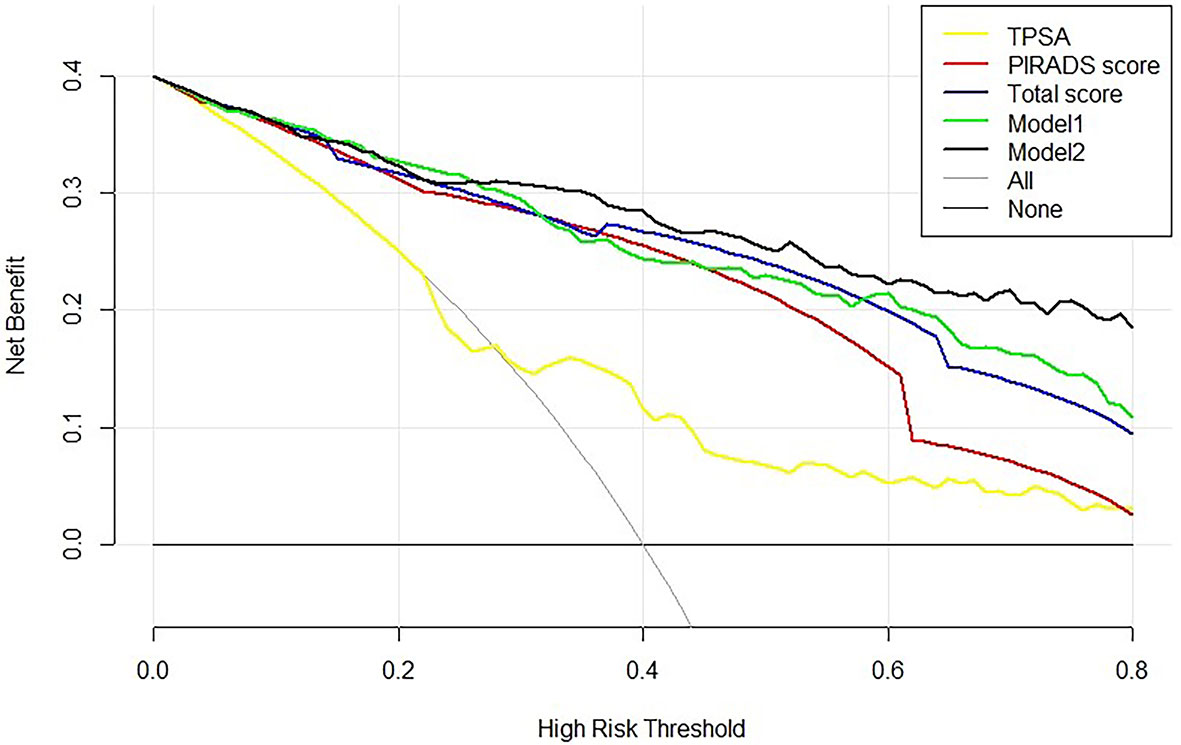
Figure 3 Decision curve analysis of the PSA, bpMRI score, and prediction models for csPCa. The net benefit curves for models are shown in this figure. The x-axis indicates the threshold probability for critical care outcome and the y-axis indicates the net benefit. For the baselines, solid transverse line = net benefit when all patients are considered as not having the outcome; dashed line = net benefit when all patients are considered as having the outcome. Solid black line = model 2, solid green line = model 1, solid blue line = Total score, solid red line = PI-RADS score, and solid yellow line = PSA. The preferred model is model 2, the net benefit of which was highest over the range of other parameters. Model 2 with the greatest net benefit at a given risk threshold had the greatest clinical value.
Internal Validation of the Nomogram for Predicting csPCa
In order to verify the predictive ability of Total score and Model 2, the Nomogram constructed by age, f/tPSA, PSAD, and Total score was established (Figure 4). Points from each variable are added and a straight line from the total point score shows the probability of harboring csPCa. Combining the Total score with clinical factors increased the AUC for diagnosis of csPCa (AUC = 0.933). Furthermore, the calibration curves were depicted in the training group to estimate the agreement between the estimated risk of Nomogram and the actual csPCa risk. In the validation group, we verified the diagnostic performance of Nomogram in csPCa and the AUC reached 0.904. We using bootstrap method and calibration plots also confirmed the stability of the Nomogram.

Figure 4 Nomogram predicts the probability of csPCa. Established a Nomogram based on bpMRI and other clinical indicators. (A) Nomogram for diagnosis of clinically significant cancer (csPCa). Higher total points indicated a higher prevalence for csPCa. (B) Nomogram-predicted probability of csPCa. (C) The AUC of Nomogram-predicted probability of csPCa in the training group. (D) The AUC of Nomogram-predicted probability of csPCa in the validation group.
Discussion
Currently, prostate biopsy is still the gold standard in diagnosing PCa. Though PSA is a widely accepted biomarker for PCa, it is not ideal and often criticized for leading to unnecessary biopsy. The use of PSA derivatives such as fPSA, f/tPSA, PSAD, and PSA velocity (PSAV) may improve the diagnostic accuracy of PCa (26), but the improvement in clinical benefits was still limited. In addition, several novel biomarkers including Prostate Health Index (PHI), Prostate Cancer Antigen 3 (PCA3), 4K Score, and a number of non-coding RNAs have been reported in improving the diagnosis accuracy of PCa, especially at initial biopsy (27–30), but most of them are not widely used at present.
The important role of MRI in the diagnosis of PCa was confirmed in the PRECISION study (31). MRI-based parameters are reflective of pathologically determined characteristics of PCa. Abnormal MRI performance is positively associated with increased tumor volume and higher tumor grade (32), and this is consistent with our research results (Table 2). The purpose of the DCE sequence of mpMRI is to assess tumor angiogenesis; however, uncertainty still exists about the added value or cost-effectiveness (33). In the version of PI-RADS 2.1, the role of T2WI and DWI sequences was more emphasized, and DCE plays a minor role in the assessment of the transitional zone of the prostate gland (34). A previous IMPROD trial demonstrated that bpMRI achieved a high sensitivity for the detection of malignant lesions, especially for csPCa (35). Simultaneously, bpMRI is a less-invasive imaging modality and functions as a rapid, affordable screening tool for PCa screening. Rosenkrantz et al. found that T2WI combined with DWI had higher sensitivity than T2WI alone, but the addition of DCE did not improve the diagnostic sensitivity (36). A meta-analysis reported that bpMRI was only 7% less sensitive than mpMRI in the diagnosis of PCa (37). In another meta-analysis, Woo et al. found that the performance of bpMRI was similar to that of mpMRI in the diagnosis of PCa (38). The diagnostic accuracy of bpMRI is comparable with that of mpMRI in the detection of PCa and the identification of csPCa. Thus, bpMRI may serve as a faster, cheaper, and contrast agent-free alternative to mpMRI.
According to previous studies, a PI-RADS score of 3 was found in 31%–32% of post-biopsy patients (39, 40). Of particular note, although the PI-RADS protocol provides detailed grading criteria, the guidelines do not describe how to deal with a PI-RADS score of 3 (13). Robertson et al. modified the PI-RADS score of MRI to increase the PI-RADS score by 3 to 4 scores based on the significant performance of a particular sequence in mpMRI (41). In the review of our study, the detection rate of PCa and csPCa in patients with a PI-RADS score of 3 was 29.1% (44/151) and 15.9% (24/151) respectively, which is consistent with previous research (40, 42, 43). Considering that the diagnosis is ambiguous for patients with a PI-RADS score of 3, we evaluated bpMRI performance by summation of T2WI score and DWI score and found that when PI-RADS score = 3 and Total score > 5, the detection rate of csPCa was 62.5% (Table 4), which provides important information for biopsy decision-making.
In this study, we further quantified the bpMRI parameters and provided good performance for identifying csPCa (AUC = 0.903). We evaluated prostate lesions on bpMRI and found that T2WI score and Total score alone could diagnose 68.4% and 75.7% of csPCa, respectively (Table 4). Despite the high sensitivity of T2WI score in the diagnosis of csPCa (Table 4), benign lesions like BPH, prostatic nodules, and prostatitis can also present as low signal appearance (44, 45). Regarding the bpMRI results, the Total score for PCa and csPCa detection achieved the highest prediction accuracy in both the training group and the validation group, and the AUCs were significantly higher than the PI-RADS score of bpMRI reported in other studies (0.771–0.830) (21, 46, 47).
Although the diagnostic specificity of PSA is poor, recent studies have shown that PSAD is an independent predictor of PCa compared with PSA or PSA derivatives (4, 48). Falagario et al. (49) used 10 strategies with combinations of bpMRI scoring and PSAD, but still had a 10% risk of missing csPCa. Using model 2 of our study, 85.5% of the patients would have avoided biopsies, and only 6.8% of csPCa were missed. Our study also confirms the additional role of PSAD in the diagnosis of PCa (Table 4). A prior systematic study also showed that f/tPSA < 0.15 had a relative high sensitivity and specificity with tPSA levels in 2–10 ng/ml (50). Then, f/tPSA was considered to be an important predictor in multivariate analysis, which led to analysis of combined bpMRI, f/tPSA, and PSAD in this study. Our study showed that the combination of the Total score, PSAD, and f/tPSA could improve the diagnosis of csPCa (AUC = 0.931), and had a sensitivity and specificity of 88.3% and 84.4%, respectively, which is significantly better than the predictive power of either the PI-RADS score (AUC =0.863) and other indicators. ROC curve analysis shows that the AUC was significantly enhanced when Total score was combined with f/tPSA and PSAD in this study.
There are also limitations of this study. First, the main limitation was the use of biopsy results as a reference standard, clinically significant lesions could have been missed, and the true rate of false negatives cannot be evaluated because post-prostatectomy specimens of patients were unknown. Second, the measurement of PV according to T2WI sequence results lacks contrast agent enhancement examination of DCE, which may reduce the bpMRI scoring and affect the detection rate of csPCa. Third, due to the limited sample size, patients with PSA gray zone (4–10 ng/ml) were not individually analyzed; further studies that include more patient information are ongoing. Finally, implicit bias may exist due to the single-center retrospective nature of the study, and multicenter studies will be carried out to confirm our findings.
In conclusion, this study not only validates the results of previous studies about bpMRI but also demonstrates that using a convenient, rapid, and less expensive bpMRI-based prediction model can achieve better diagnostic accuracy. Both the prediction model and Nomogram established in this study can be further used to guide clinical decision-making. It is hoped that in the future, a risk calculator, which contains T2WI, DWI, patient’s age, f/tPSA, prostate volume, and constructs based on our Nomogram, will be used as a computer program or smartphone application to guide biopsy more conveniently.
Data Availability Statement
The original contributions presented in the study are included in the article/Supplementary Material. Further inquiries can be directed to the corresponding authors.
Ethics Statement
The studies involving human participants were reviewed and approved by Ethics Review Committee of Ningbo First Hospital. Written informed consent for participation was not required for this study in accordance with the national legislation and the institutional requirements.
Author Contributions
J-FP and QM conceptualized, designed, and supervised the study. J-FP, J-ZC, R-DH, Z-LT, and C-LY coordinated and participated in data collection. J-FP, RS, S-ZY, and QM carried out the statistical analysis and drafted the manuscript. RS performed a prostate biopsy. Z-YZ and D-WR participated in the image scoring of bpMRI. QM provided guidance and revised the manuscript. All authors contributed to the article and approved the submitted version.
Funding
This study was supported by the Zhejiang Natural Science Fund (Grant No. LY20H050002 to QM, Grant No. LY18H050003 to J-HJ), the Medical Health Science and Technology Project of Zhejiang Provincial Health Commission (Grant No. 2021KY977 to RS), the Ningbo Social Development Fund (Grant No. 202002N3192 to QM), and the Fund of Ningbo Clinical Research Center for Urological Disease (2019A21001).
Conflict of Interest
The authors declare that the research was conducted in the absence of any commercial or financial relationships that could be construed as a potential conflict of interest.
Publisher’s Note
All claims expressed in this article are solely those of the authors and do not necessarily represent those of their affiliated organizations, or those of the publisher, the editors and the reviewers. Any product that may be evaluated in this article, or claim that may be made by its manufacturer, is not guaranteed or endorsed by the publisher.
Supplementary Material
The Supplementary Material for this article can be found online at: https://www.frontiersin.org/articles/10.3389/fonc.2021.740868/full#supplementary-material
Supplementary Figure 1 | Decision curve analysis of the PSA, bpMRI parameters and two prognostic models for PCa and csPCa in the training group and validation group. The net benefit curves for models and parameters are shown in this figure. X-axis indicates the threshold probability for critical care outcome and Y-axis indicates the net benefit. Solid black line = model 2, solid green line = model 1, solid red line = PI-RADS score, solid blue line = Total score and solid yellow line = PSA. The preferred model is the model 2, the net benefit of which was larger over the range of other parameters. For the base lines, solid transverse line = net benefit when all patients are considered as not having the outcome; dashed line = net benefit when all patients are considered as having the outcome. The model with the greatest net benefit at a given risk threshold had the greatest clinical value. (A): DCA for training group (PCa) (B): DCA for validation group (csPCa) (C): DCA for validation group (PCa).
Supplementary Figure 2 | Clinical impact curve (CIC) of model 2 in training group and validation group. (A): Clinical impact curve for training group; (B): Clinical impact curve for validation group. The red curve (number of high-risk individuals) indicates the number of people who are classified as positive (high risk) by the model at each threshold probability; the blue curve (number of high-risk individuals with outcome) is the number of true positives at each threshold probability. CIC visually indicated that nomogram conferred high clinical net benefit and confirmed the clinical value of the model 2.
Supplementary Table 1 | BpMRI PI-RADS v.2 score criteria and Total score scoring criteria (A) PI-RADS Assessment Category for the Peripheral Zone (PZ). (B) PI-RADS Assessment Category for the Transition Zone (TZ). (C) PI-RADS Assessment for Peripheral Zone on T2-Weighted Imaging. (D) PI-RADS Assessment for Transition Zone on T2-Weighted Imaging. (E) PI-RADS Assessment for DWI for both Peripheral Zone and Transition Zone
Supplementary Table 2 | DeLong test compared Model 1 and Model 2 to diagnose csPCa in the training group and the validation group, respectively. AUC, area under the curve; SE, standard error.
Supplementary Table 3 | The pathology findings of the patients with csPCa in the two groups. Biopsy specimens were reviewed by experienced pathologists according to the ISUP 2014 modified Gleason score (GS)/Grade Group (G) system: GG1, Gleason score 3 + 3; GG2, Gleason score 3 + 4 and; GG3, Gleason score 4 + 3; GG4, Gleason score include 3 + 5, 4 + 4 and 5 + 3; GG5, Gleason score include 4 + 5, 5 + 4 and 5 + 5. And Gleason score of 3 + 4 or higher was defined as csPCa.
References
1. Bray F, Ferlay J, Soerjomataram I, Siegel RL, Torre LA, Jemal A. Global Cancer Statistics 2018: GLOBOCAN Estimates of Incidence and Mortality Worldwide for 36 Cancers in 185 Countries. CA: Cancer J Clin (2018) 68(6):394–424. doi: 10.3322/caac.21492
2. Petrylak DP, Vogelzang NJ, Chatta K, Fleming MT, Smith DC, Appleman LJ, et al. PSMA ADC Monotherapy in Patients With Progressive Metastatic Castration-Resistant Prostate Cancer Following Abiraterone and/or Enzalutamide: Efficacy and Safety in Open-Label Single-Arm Phase 2 Study. Prostate (2019) 80(1):99–108. doi: 10.1002/pros.23922
3. Vickers A, Cronin A, Roobol M, Savage C, Peltola M, Pettersson K, et al. Reducing Unnecessary Biopsy During Prostate Cancer Screening Using a Four-Kallikrein Panel: An Independent Replication. J Clin Oncol Off J Am Soc Clin Oncol (2010) 28(15):2493–8. doi: 10.1200/jco.2009.24.1968
4. Nordström T, Akre O, Aly M, Grönberg H, Eklund M. Prostate-Specific Antigen (PSA) Density in the Diagnostic Algorithm of Prostate Cancer. Prostate Cancer Prostatic Dis (2018) 21(1):57–63. doi: 10.1038/s41391-017-0024-7
5. De Nunzio C, Lombardo R, Nacchia A, Tema G, Tubaro A. Repeat Prostate-Specific Antigen (PSA) Test Before Prostate Biopsy: A 20% Decrease in PSA Values is Associated With a Reduced Risk of Cancer and Particularly of High-Grade Cancer. BJU Int (2018) 122(1):83–8. doi: 10.1111/bju.14197
6. Loeb S, Bjurlin MA, Nicholson J, Tammela TL, Penson DF, Carter HB, et al. Overdiagnosis and Overtreatment of Prostate Cancer. Eur Urol (2014) 65(6):1046–55. doi: 10.1016/j.eururo.2013.12.062
7. Shen T, Xue J. Impact of a Novel Ultrasound Microvascular Imaging and Elastography on Prostate Cancer Classification. Trans Androl Urol (2019) 8(6):696–702. doi: 10.21037/tau.2019.11.15
8. Sedelaar J, de la Rosette J, Beerlage H, Wijkstra H, Debruyne F, Aarnink R. Transrectal Ultrasound Imaging of the Prostate: Review and Perspectives of Recent Developments. Prostate Cancer Prostatic Dis (1999) 2(5/6):241–52. doi: 10.1038/sj.pcan.4500326
9. Borghesi M, Ahmed H, Nam R, Schaeffer E, Schiavina R, Taneja S, et al. Complications After Systematic, Random, and Image-Guided Prostate Biopsy. Eur Urol (2017) 71(3):353–65. doi: 10.1016/j.eururo.2016.08.004
10. Jue J, Barboza M, Prakash N, Venkatramani V, Sinha V, Pavan N, et al. Re-Examining Prostate-Specific Antigen (PSA) Density: Defining the Optimal PSA Range and Patients for Using PSA Density to Predict Prostate Cancer Using Extended Template Biopsy. Urology (2017) 105:123–8. doi: 10.1016/j.urology.2017.04.015
11. Turkbey B, Brown A, Sankineni S, Wood B, Pinto P, Choyke P. Multiparametric Prostate Magnetic Resonance Imaging in the Evaluation of Prostate Cancer. CA: Cancer J Clin (2016) 66(4):326–36. doi: 10.3322/caac.21333
12. van Leeuwen P, Hayen A, Thompson J, Moses D, Shnier R, Böhm M, et al. A Multiparametric Magnetic Resonance Imaging-Based Risk Model to Determine the Risk of Significant Prostate Cancer Prior to Biopsy. BJU Int (2017) 120(6):774–81. doi: 10.1111/bju.13814
13. Weinreb JC, Barentsz JO, Choyke PL, Cornud F, Haider MA, Macura KJ, et al. PI-RADS Prostate Imaging - Reporting and Data System: 2015, Version 2. Eur Urol (2016) 69(1):16–40. doi: 10.1016/j.eururo.2015.08.052
14. Jambor I, Verho J, Ettala O, Knaapila J, Taimen P, Syvänen KT, et al. Validation of IMPROD Biparametric MRI in Men With Clinically Suspected Prostate Cancer: A Prospective Multi-Institutional Trial. PloS Med (2019) 16(6):e1002813. doi: 10.1371/journal.pmed.1002813
15. Ramalho M, Ramalho J, Burke LM, Semelka RC. Gadolinium Retention and Toxicity-An Update. Adv Chronic Kidney Dis (2017) 24(3):138–46. doi: 10.1053/j.ackd.2017.03.004
16. Kuhl CK, Bruhn R, Krämer N, Nebelung S, Heidenreich A, Schrading S. Abbreviated Biparametric Prostate MR Imaging in Men With Elevated Prostate-Specific Antigen. Radiology (2017) 285(2):493–505. doi: 10.1148/radiol.2017170129
17. Jambor I, Boström PJ, Taimen P, Syvänen K, Kähkönen E, Kallajoki M, et al. Novel Biparametric MRI and Targeted Biopsy Improves Risk Stratification in Men With a Clinical Suspicion of Prostate Cancer (IMPROD Trial). J Magn Reson Imaging (2017) 46(4):1089–95. doi: 10.1002/jmri.25641
18. Sherrer R, Glaser Z, Gordetsky J, Nix J, Porter K, Rais-Bahrami S. Comparison of Biparametric MRI to Full Multiparametric MRI for Detection of Clinically Significant Prostate Cancer. Prostate Cancer Prostatic Dis (2019) 22(2):331–6. doi: 10.1038/s41391-018-0107-0
19. Boesen L, Nørgaard N, Løgager V, Balslev I, Bisbjerg R, Thestrup K, et al. Prebiopsy Biparametric Magnetic Resonance Imaging Combined With Prostate-Specific Antigen Density in Detecting and Ruling Out Gleason 7-10 Prostate Cancer in Biopsy-Naïve Men. Eur Urol Oncol (2019) 2(3):311–9. doi: 10.1016/j.euo.2018.09.001
20. Niu X, Li J, Das S, Xiong Y, Yang C, Peng T. Developing a Nomogram Based on Multiparametric Magnetic Resonance Imaging for Forecasting High-Grade Prostate Cancer to Reduce Unnecessary Biopsies Within the Prostate-Specific Antigen Gray Zone. BMC Med Imaging (2017) 17(1):11. doi: 10.1186/s12880-017-0184-x
21. Zhu J, Liang Z, Song Y, Yang Y, Xu Y, Lu Y, et al. Can the Combination of Biparametric Magnetic Resonance Imaging and PSA-Related Indicators Predict the Prostate Biopsy Outcome? Andrologia (2020) 52(10):e13734. doi: 10.1111/and.13734
22. Boesen L, Nørgaard N, Løgager V, Balslev I, Bisbjerg R, Thestrup K, et al. Assessment of the Diagnostic Accuracy of Biparametric Magnetic Resonance Imaging for Prostate Cancer in Biopsy-Naive Men: The Biparametric MRI for Detection of Prostate Cancer (BIDOC) Study. JAMA Netw Open (2018) 1(2):e180219. doi: 10.1001/jamanetworkopen.2018.0219
23. Weinreb J, Barentsz J, Choyke P, Cornud F, Haider M, Macura K, et al. PI-RADS Prostate Imaging - Reporting and Data System: 2015, Version 2. Eur Urol (2016) 69(1):16–40. doi: 10.1016/j.eururo.2015.08.052
24. Mottet N, van den Bergh R, Briers E, Van den Broeck T, Cumberbatch M, De Santis M, et al. EAU-EANM-ESTRO-ESUR-SIOG Guidelines on Prostate Cancer-2020 Update. Part 1: Screening, Diagnosis, and Local Treatment with Curative Intent. Eur Urol (2021) 79(2):243–62. doi: 10.1016/j.eururo.2020.09.042
25. DeLong E, DeLong D, Clarke-Pearson D. Comparing the Areas Under Two or More Correlated Receiver Operating Characteristic Curves: A Nonparametric Approach. Biometrics (1988) 44(3):837–45. doi: 10.2307/2531595
26. Shen P, Zhao J, Sun G, Chen N, Zhang X, Gui H, et al. The Roles of Prostate-Specific Antigen (PSA) Density, Prostate Volume, and Their Zone-Adjusted Derivatives in Predicting Prostate Cancer in Patients With PSA Less Than 200 ng/mL. Andrology (2017) 5(3):548–55. doi: 10.1111/andr.12322
27. Lazzeri M, Haese A, de la Taille A, Palou Redorta J, McNicholas T, Lughezzani G, et al. Serum Isoform [-2]proPSA Derivatives Significantly Improve Prediction of Prostate Cancer at Initial Biopsy in a Total PSA Range of 2-10 Ng/Ml: A Multicentric European Study. Eur Urol (2013) 63(6):986–94. doi: 10.1016/j.eururo.2013.01.011
28. Loeb S, Catalona W. The Prostate Health Index: A New Test for the Detection of Prostate Cancer. Ther Adv Urol (2014) 6(2):74–7. doi: 10.1177/1756287213513488
29. Wei JT, Feng Z, Partin AW, Brown E, Thompson I, Sokoll L, et al. Can Urinary PCA3 Supplement PSA in the Early Detection of Prostate Cancer? J Clin Oncol Off J Am Soc Clin Oncol (2014) 32(36):4066–72. doi: 10.1200/JCO.2013.52.8505
30. Litwin M, Tan H. The Diagnosis and Treatment of Prostate Cancer: A Review. JAMA (2017) 317(24):2532–42. doi: 10.1001/jama.2017.7248
31. Kasivisvanathan V, Rannikko AS, Borghi M, Panebianco V, Mynderse LA, Vaarala MH, et al. MRI-Targeted or Standard Biopsy for Prostate-Cancer Diagnosis. N Engl J Med (2018) 378(19):1767–77. doi: 10.1056/NEJMoa1801993
32. Fütterer JJ, Briganti A, De Visschere P, Emberton M, Giannarini G, Kirkham A, et al. Can Clinically Significant Prostate Cancer Be Detected With Multiparametric Magnetic Resonance Imaging? A Systematic Review of the Literature. Eur Urol (2015) 68(6):1045–53. doi: 10.1016/j.eururo.2015.01.013
33. Tan C, Hobbs B, Wei W, Kundra V. Dynamic Contrast-Enhanced MRI for the Detection of Prostate Cancer: Meta-Analysis. AJR Am J Roentgenol (2015) 204(4):W439–48. doi: 10.2214/ajr.14.13373
34. Turkbey B, Rosenkrantz AB, Haider MA, Padhani AR, Villeirs G, Macura KJ, et al. Prostate Imaging Reporting and Data System Version 2.1: 2019 Update of Prostate Imaging Reporting and Data System Version 2. Eur Urol (2019) 76(3):340–51. doi: 10.1016/j.eururo.2019.02.033
35. Montoya Perez I, Jambor I, Pahikkala T, Airola A, Merisaari H, Saunavaara J, et al. Prostate Cancer Risk Stratification in Men With a Clinical Suspicion of Prostate Cancer Using a Unique Biparametric MRI and Expression of 11 Genes in Apparently Benign Tissue: Evaluation Using Machine-Learning Techniques. J Magn Reson Imaging JMRI (2020) 51(5):1540–53. doi: 10.1002/jmri.26945
36. Rosenkrantz AB, Kim S, Campbell N, Gaing B, Deng FM, Taneja SS. Transition Zone Prostate Cancer: Revisiting the Role of Multiparametric MRI at 3 T. AJR Am J Roentgenol (2015) 204(3):W266–72. doi: 10.2214/ajr.14.12955
37. Liang Z, Hu R, Yang Y, An N, Duo X, Liu Z, et al. Is Dynamic Contrast Enhancement Still Necessary in Multiparametric Magnetic Resonance for Diagnosis of Prostate Cancer: A Systematic Review and Meta-Analysis. Trans Androl Urol (2020) 9(2):553–73. doi: 10.21037/tau.2020.02.03
38. Woo S, Suh C, Kim S, Cho J, Kim S, Moon M. Head-To-Head Comparison Between Biparametric and Multiparametric MRI for the Diagnosis of Prostate Cancer: A Systematic Review and Meta-Analysis. AJR Am J Roentgenol (2018) 211(5):W226–W41. doi: 10.2214/ajr.18.19880
39. Borkowetz A, Platzek I, Toma M, Renner T, Herout R, Baunacke M, et al. Evaluation of Prostate Imaging Reporting and Data System Classification in the Prediction of Tumor Aggressiveness in Targeted Magnetic Resonance Imaging/Ultrasound-Fusion Biopsy. Urol Inter (2017) 99(2):177–85. doi: 10.1159/000477263
40. Radtke JP, Wiesenfarth M, Kesch C, Freitag MT, Alt CD, Celik K, et al. Combined Clinical Parameters and Multiparametric Magnetic Resonance Imaging for Advanced Risk Modeling of Prostate Cancer-Patient-Tailored Risk Stratification Can Reduce Unnecessary Biopsies. Eur Urol (2017) 72(6):888–96. doi: 10.1016/j.eururo.2017.03.039
41. Rosenkrantz AB, Babb JS, Taneja SS, Ream JM. Proposed Adjustments to PI-RADS Version 2 Decision Rules: Impact on Prostate Cancer Detection. Radiology (2017) 283(1):119–29. doi: 10.1148/radiol.2016161124
42. Hermie I, Van Besien J, De Visschere P, Lumen N, Decaestecker K. Which Clinical and Radiological Characteristics can Predict Clinically Significant Prostate Cancer in PI-RADS 3 Lesions? A Retrospective Study in a High-Volume Academic Center. Eur J Radiol (2019) 114:92–8. doi: 10.1016/j.ejrad.2019.02.031
43. Schoots IG. MRI in Early Prostate Cancer Detection: How to Manage Indeterminate or Equivocal PI-RADS 3 Lesions? Trans Androl Urol (2018) 7(1):70–82. doi: 10.21037/tau.2017.12.31
44. Barentsz JO, Richenberg J, Clements R, Choyke P, Verma S, Villeirs G, et al. ESUR Prostate MR Guidelines 2012. Eur Radiol (2012) 22(4):746–57. doi: 10.1007/s00330-011-2377-y
45. Kim C, Park B, Kim B. Localization of Prostate Cancer Using 3T MRI: Comparison of T2-Weighted and Dynamic Contrast-Enhanced Imaging. J Comput Assist Tomogr (2006) 30(1):7–11. doi: 10.1097/01.rct.0000185384.27765.09
46. Wei C-G, Chen T, Zhang Y-Y, Pan P, Dai G-C, Yu H-C, et al. Biparametric Prostate MRI and Clinical Indicators Predict Clinically Significant Prostate Cancer in Men With "Gray Zone" PSA Levels. Eur J Radiol (2020) 127:108977. doi: 10.1016/j.ejrad.2020.108977
47. Boesen L, Thomsen FB, Nørgaard N, Løgager V, Balslev I, Bisbjerg R, et al. A Predictive Model Based on Biparametric Magnetic Resonance Imaging and Clinical Parameters for Improved Risk Assessment and Selection of Biopsy-Naïve Men for Prostate Biopsies. Prostate Cancer Prostatic Dis (2019) 22(4):609–16. doi: 10.1038/s41391-019-0149-y
48. Magheli A, Hinz S, Hege C, Stephan C, Jung K, Miller K, et al. Prostate Specific Antigen Density to Predict Prostate Cancer Upgrading in a Contemporary Radical Prostatectomy Series: A Single Center Experience. J Urol (2010) 183(1):126–31. doi: 10.1016/j.juro.2009.08.139
49. Falagario U, Jambor I, Lantz A, Ettala O, Stabile A, Taimen P, et al. Combined Use of Prostate-Specific Antigen Density and Magnetic Resonance Imaging for Prostate Biopsy Decision Planning: A Retrospective Multi-Institutional Study Using the Prostate Magnetic Resonance Imaging Outcome Database (PROMOD). Eur Urol Oncol (2020) s2588-9311(20):30142–5. doi: 10.1016/j.euo.2020.08.014
50. Roddam A, Duffy M, Hamdy F, Ward A, Patnick J, Price C, et al. Use of Prostate-Specific Antigen (PSA) Isoforms for the Detection of Prostate Cancer in Men With a PSA Level of 2-10 Ng/Ml: Systematic Review and Meta-Analysis. Eur Urol (2005) 48(3):386–99; discussion 98-9. doi: 10.1016/j.eururo.2005.04.015
Keywords: prostate cancer, prostate biopsy, prostate-specific antigen, biparametric MRI (Bp-MRI), PIRADS score, prostate-specific antigen density (PSAD)
Citation: Pan J-f, Su R, Cao J-z, Zhao Z-y, Ren D-w, Ye S-z, Huang R-d, Tao Z-l, Yu C-l, Jiang J-h and Ma Q (2021) Modified Predictive Model and Nomogram by Incorporating Prebiopsy Biparametric Magnetic Resonance Imaging With Clinical Indicators for Prostate Biopsy Decision Making. Front. Oncol. 11:740868. doi: 10.3389/fonc.2021.740868
Received: 13 July 2021; Accepted: 20 August 2021;
Published: 13 September 2021.
Edited by:
Benyi Li, University of Kansas Medical Center, United StatesReviewed by:
Jing Li, Second Military Medical University, ChinaZhewei Zhang, Zhejiang University, China
Copyright © 2021 Pan, Su, Cao, Zhao, Ren, Ye, Huang, Tao, Yu, Jiang and Ma. This is an open-access article distributed under the terms of the Creative Commons Attribution License (CC BY). The use, distribution or reproduction in other forums is permitted, provided the original author(s) and the copyright owner(s) are credited and that the original publication in this journal is cited, in accordance with accepted academic practice. No use, distribution or reproduction is permitted which does not comply with these terms.
*Correspondence: Jun-hui Jiang, SmlhbmdqaDIwMDUwOUAxMjYuY29t; Qi Ma, cWkubWFAbmJkeXl5LmNvbQ==
†These authors have contributed equally to this work