 Tengfei Si1†
 Zhenlin Huang2†Yuanhang Jiang1
 Abigail Walker-Jacobs1Shaqira Gill1Robert Hegarty3Mohammad Hamza1
 Shirin Elizabeth Khorsandi1,4,5Wayel Jassem1,4
 Nigel Heaton1,4*
 Yun Ma1*
- 1Institute of Liver Studies, King’s College Hospital, Department of Inflammation Biology, Faculty of Life Sciences & Medicine, King’s College London, London, United Kingdom
- 2The Ministry of Education (MOE) Key Laboratory for Standardization of Chinese Medicine, Institute of Chinese Materia Medica, Shanghai University of Traditional Chinese Medicine, Shanghai, China
- 3Pediatric Liver, GI and Nutrition Centre, King’s College Hospital, London, United Kingdom
- 4Transplant Service, King’s College Hospital, London, United Kingdom
- 5The Roger Williams Institute of Hepatology, Foundation for Liver Research, London, United Kingdom
Introduction: Hepatocellular carcinoma (HCC) is the most common primary liver cancer with a low 5-year survival rate. The heterogeneity of HCC makes monotherapy unlikely. The development of diagnostic programs and new treatments targeting common genetic events in the carcinogenic process are providing further insights into the management of HCC. The aim of this study was firstly to validate key genes that are involved in promoting HCC development and as biomarkers for early diagnosis and, secondly, to define their links with antitumor immunity including inhibitory checkpoints.
Methods: Multiple databases including Gene Expression Omnibus (GEO), Gene Expression Profiling Interactive Analysis (GEPIA), Kaplan–Meier Plotter, UALCAN, and Oncomine were used for target gene screening and establishment of a co-expression network. Clinical data and RNAseq of 367 HCC patients were downloaded from the Cancer Genome Atlas (TCGA) database. The diagnostic and prognostic value of screened genes were tested by receiver operating characteristic (ROC) curve and correlation analysis. The links with the key genes in HCC and antitumor immunity were defined using both blood and liver tissue collected prospectively from HCC patients in our center.
Results: Upregulation of CCNB1, CDC20, and CENPF was commonly observed in HCC and are involved in the p53 signal pathway. The hepatic mRNA expression levels of these three genes were strongly associated with patients’ prognosis and expressed high value of area under the ROC curve (AUC). Further analysis revealed that these three genes were positively correlated with the gene expression levels of IFN-γ, TNF-α, and IL-17 in peripheral blood. In addition, the expression of CENPF showed positive correlation with the percentage of CD8pos T cells and negative correlation with the percentage of CD4pos T cells in the peripheral blood. In the HCC microenvironment, the transcript levels of these three genes and inhibitory checkpoint molecules including PD-1, CTLA-4, and TIM-3 were positively correlated.
Conclusion: The upregulation of CCNB1, CDC20, and CENPF genes was a common event in hepatocarcinogenesis. Expression levels of CCNB1, CDC20, and CENPF showed potential for early diagnosis and prediction of prognosis in HCC patients. There is a close association between three genes and Th1/Th17 cytokines as well as the count of CD4pos and CD8pos T cells. The positive correlation between the three genes and inhibitory checkpoint genes, PD-1, CTLA-4, and TIM-3, indicates that these genes are linked with weakened antitumor immunity in HCC. Our findings may provide further insights into developing novel therapies for HCC.
Introduction
Hepatocellular carcinoma (HCC) represents more than 90% of primary liver cancers and is a global health problem (1). It is ranked as the fourth leading cause of cancer-related death in the world with a growing incidence (2). Surgery including resection and liver transplantation remains the most effective treatment and could achieve a 5-year survival of 60% to 80%. HCC is usually asymptomatic in the early stage. At diagnosis, many patients have advanced disease with limited treatment options.
There is increasing evidence that genetic alterations play an important role in the development of HCC (3). With the advent of deep sequencing technology, increasing information regarding genetic mutations in HCC has identified several important pathways related to cancer formation (4–7). Attention is being focused on genes involved in key events in hepatocarcinogenesis, such p53, which has been identified as the most frequently mutated tumor suppressor gene in HCC. Research on p53 gene mutations has provided models for developing clinical treatments for HCC.
To date, several specific markers and key pathways involved in the HCC development have been identified potentially to assist early diagnosis and to predict prognosis. Although immunoregulatory therapies such as anti-PD-1 and CAR-T have made progresses in the treatment of solid tumors, the anti-PD-1/CTLA-4 therapy in HCC appears as a challenge. We aim to identify the key genes in the HCC environment, which are associated with the antitumor immunity including adaptive immunity, such as Th1/Th17, and immunoregulation with inhibitory checkpoints.
We conducted an analysis to screen gene markers related to the development of HCC. Using clinical data and RNA-seq (TCGA open-source data) from 367 HCC patients to confirm their diagnostic and prognostic value. In addition, we defined the relationship of these genes with anti-tumor immunity represented by the transcript levels of IFN-γ, TNF-α, and IL-17, the portion of T cell subsets in peripheral blood, and the expression level of inhibitory checkpoint molecules: PD-1, CTLA-4, and TIM-3 in HCC tumor tissue, as well as PD-1 plasma level in peripheral blood.
Materials and Methods
Common Differentially Expressed Genes Screening
Four GSE profiles (7–10) from platform GPL570 ([HG-U133_Plus_2] Affymetrix Human Genome U133 Plus 2.0 Array) were used to select differentially expressed genes (DEGs) between normal liver tissue (from healthy donor) and HCC cancer tissue (11). The condition was set at |log FC| > 2, p-value < 0.05. All DEGs were uploaded to Venn Diagram online software (http://bioinformatics.psb.ugent.be/webtools/Venn/) to detect commonly co-expressed genes.
Central Cluster Selection and Enrichment Analysis
The STRING online database (available at https://string-db.org/) was used to detect the functional PPI networks (12). Central cluster from the PPI network was identified through MCODE plug-in of Cytoscape (Node Score ≥ 2, K-Core Value ≥ 2, Max Depth = 100) (13). Genes of central cluster were submitted to the Kaplan–Meier Plotter (https://kmplot.com/analysis/) (14). Liver cancer database was chosen to detect poor prognosis-associated genes (lower overall survival) in HCC patients (log rank p-value < 0.05, FDR ≤ 5%). Gene Expression Profiling Interactive analysis (GEPIA) (15) online database (http://gepia.cancer-pku.cn/) was used to further validate the expression of survival-related genes.
Gene Ontology (GO) enrichment analysis was conducted on three main functions: Biological Process (BP), Molecular Function (MF), and Cellular Component (CC). For the Kyoto Encyclopedia of Genes and Genomes (KEGG) pathway analysis, ClueGo in Cytoscape was used to perform single cluster analysis. Bonferroni step down method was used by default for multiple testing correction. Only results with a p-value < 0.05 and false discovery rate (FDR) < 5% were selected (16). Genes commonly involved in the enriched pathways were screened as core genes.
Expression and Correlation Network of Core Genes
UALCAN (http://ualcan.path.uab.edu) (17), GEPIA and Oncomine (https://www.oncomine.org) (18) databases were searched for the relative expression of core genes across HCC and normal liver tissue, as well as in different tumor sub-groups based on tumor stages (AJCC-TNM), tumor grade (histology), or other settings. The correlations between core genes and cancer immune infiltrates were investigated via Tumor Immune Estimation Resource (TIMER) (http://timer.compgenomics.org/) (19). Principal component analysis (PCA) was performed to compare the distribution differences between LIHC tumor, LIHC normal (HCC adjacent non-tumor liver), and donors’ normal liver tissue on the expression of core genes. Raw data downloaded from TCGA database and processing were conducted by R studio software (version 3.6.1; R studio, Boston, Massachusetts); RNAseq and related clinical data of a total of 367 tumor tissues and 50 normal liver tissues were used to construct a co-expression network.
Validation Cohort: Patients and Sample Collection
Blood samples were accessed via King’s College Hospital, Liver Biobank (n = 50). Non-identifying clinical features are summarized in Table 1. Patients were stratified into three groups according to whether having received treatment including loco-regional therapy (microwave ablation, chemoembolization), radiation therapy, chemo-/biological therapy, immunotherapy, and surgery as well as tumor status before sample collection: (1) untreated group (n = 30), (2) treated HCC with active/residual tumor (n = 8), and (3) treated HCC without active/residual tumor (n = 12). Peripheral blood mononuclear cells (PBMCs) were isolated using density gradient centrifugation technique (20). Sixteen paired tumor tissue and adjacent liver tissue, as well as 12 normal liver tissue samples from patients with hemangioma or focal nodular hyperplasia (FNH) were accessed via the Liver Biobank, Institute of Liver Studies, King’s College Hospital (REC NOS). This study was approved by the Ethics Committee of King’s College Hospital (Ethic REC No. 15/LO/0363, IRAS No.169524) and full consent was obtained from each participant before blood and liver tissue sampling.
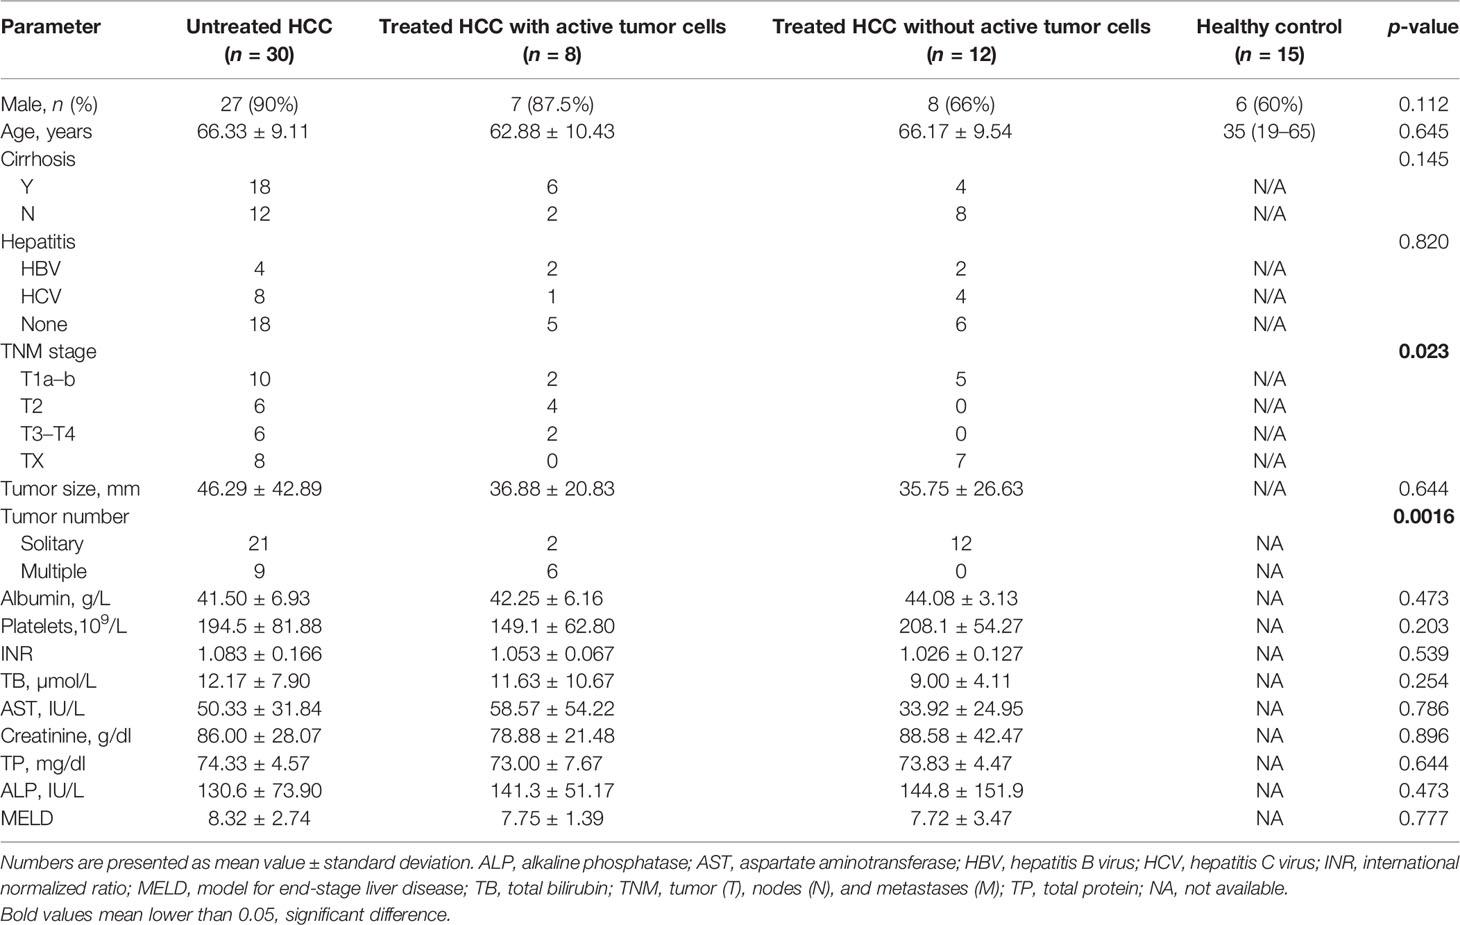
Table 1 Baseline characteristics of HCC patients.
Real-Time PCR
Cellular total RNA was isolated using RNeasy Plus Mini kit (Thermo Fisher Scientific, Waltham, USA). The RNA content was determined by measuring the optical density at 260 nm, and cDNA was synthesized according to the instruction described in Prime Scripts RT Master Mix kit. Real-time PCR was performed using SYBRs Premix Ex Taq™ kit (Thermo Fisher Scientific, Waltham, USA). The relative expression of target genes was normalized to GAPDH, analyzed by 2−ΔΔCt method and given as ratio compared with control. Commercial primers for IFN-γ, TNF-α, and IL-17 were purchased from Qiagen (Product No. 249900); primer sequences for other target genes are listed in Supplementary Table S1.
Phenotypic Analysis of PBMCs Using Flow Cytometry
PBMCs were stained for 20 min at 4°C using monoclonal antibodies (mAbs) specific for CD3/Vio-Green, CD4/Alexa Fluor®700, CD8/PE-Vio770, CD38/PE-Cyanine5, CD69/APC, PD-1/BV786, CTLA-4/BV421, TIM-3/PE, CXCR3/PE-Vio615, CXCR6/BV711, and CCR5/PE-Vio770. 7-Aminoactinomycin D was used to exclude dead cells from the analysis. Cells were acquired on a 5-laser BD LSRFortessa™ Flow Cytometer. FACS data analysis was performed using FlowJo software (Tree Star Inc., Ashland, USA). The comparisons on the percentages of three T-cell subsets (CD3+CD4+, CD3+CD8+, CD3+CD4-CD8-) were conducted between healthy control and HCC patients (Supplementary Figure S2 showing the gating strategy for T-cell subsets).
ELISA
Plasma PD-1 levels were detected using commercial ELISA kits (DuoSet® ELISA Development Systems, Minneapolis, USA) in patients with HCC. Plates were coated overnight at room temperature with capture antibody and then blocked for 1 h at room temperature with 300 µl of filtered 1% BSA in DPBS. For ELISA assays, recombinant PD-1 standards were run with 1:2 serial dilutions. Streptavidin-HRP antibody was used and ELISA plates were developed with SureBlue TMB Microwell Peroxidase Substrate. TMB Stop Solution was added to halt the reaction. The absorbance at 450 nm was measured on a microplate reader (FLUOstar® Omega, BMG Labtech Ltd, Great Britain).
Statistical Analysis
Statistical analysis was conducted by GraphPad Prism software (version 9.0; GraphPad Software Inc., San Diego, CA). For comparison between two groups, Student’s t-test was used while one-way ANOVA was performed for multiple groups. For correlation analysis, linear regression test was carried out. Receiver operator characteristic (ROC) curve was performed to validate diagnostic value. p-value <0.05 was considered as statistically different.
Results
Data Extraction and Gene Screening
The detailed study design is shown in the flow chart (Supplementary Figure S1). Of the large number of DEGs, there were 52 upregulated (Log FC >2) and 150 downregulated genes (Log FC < −2) which were found to be commonly expressed in all GSE files (Figures 1A, B and Supplementary Table S2). The PPI network of DEGs was exported to Cytoscape and 37 central genes were identified through MCODE module analysis (Figure 1C). The 37 central genes were further analyzed in the Kaplan–Meier Plotter and GEPIA (Supplementary Figures S3 and S4). A group of 12 genes were identified to be associated with poor prognosis and were significantly upregulated in HCC cancer tissue (Figure 1D).
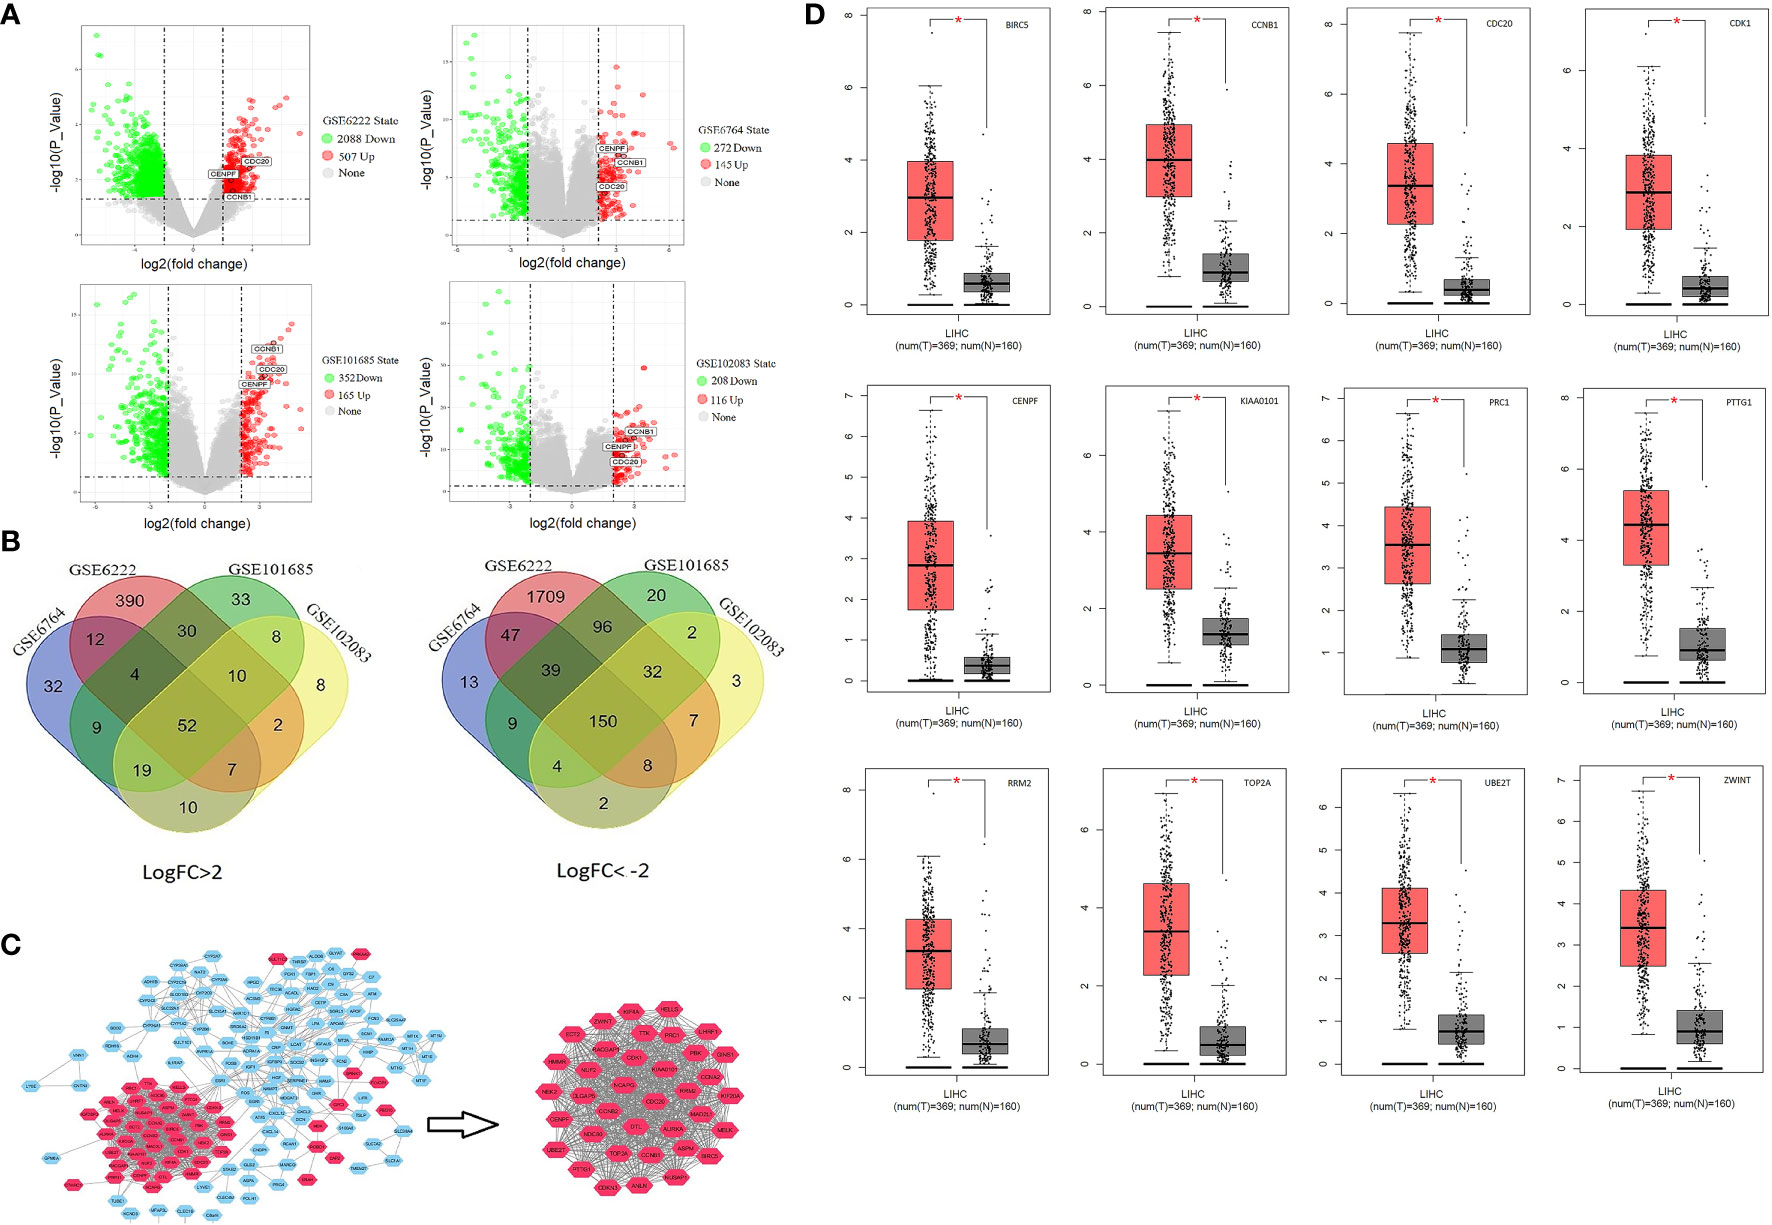
Figure 1 Identify central cluster and gene expression validation: (A) Volcano plots of differentially expressed genes. (B) Venn Diagram of commonly up-/downregulated genes. (C) Screening of central cluster using MCODE plug-in. (D) Validation of central cluster genes expression in LIHC (liver hepatocellular carcinoma); red boxplot represents HCC tissue, and black box represents normal liver tissue. *P < 0.05.
Enrichment Analysis and Core Gene Selection
KEGG pathway and GO enrichment analysis were performed for the 12 selected genes through ClueGO (GO Term Fusion), Cytoscape. The (KEGG:04115) p53 signaling pathway was found to be the most representative pathway (p = 9.60E-6) involved, while negative regulation of mitotic sister chromatid separation (GO: 2000816, p = 9.27E-8), chromosome separation (GO:0051304, p = 2.18E-8), and mitotic spindle assembly checkpoint (GO:0007094, p = 5.97E-6) were the most representative GO terms involved (Table 2). CCNB1, CDC20, and CENPF were identified to play an important role in the above pathways and screened as core genes.
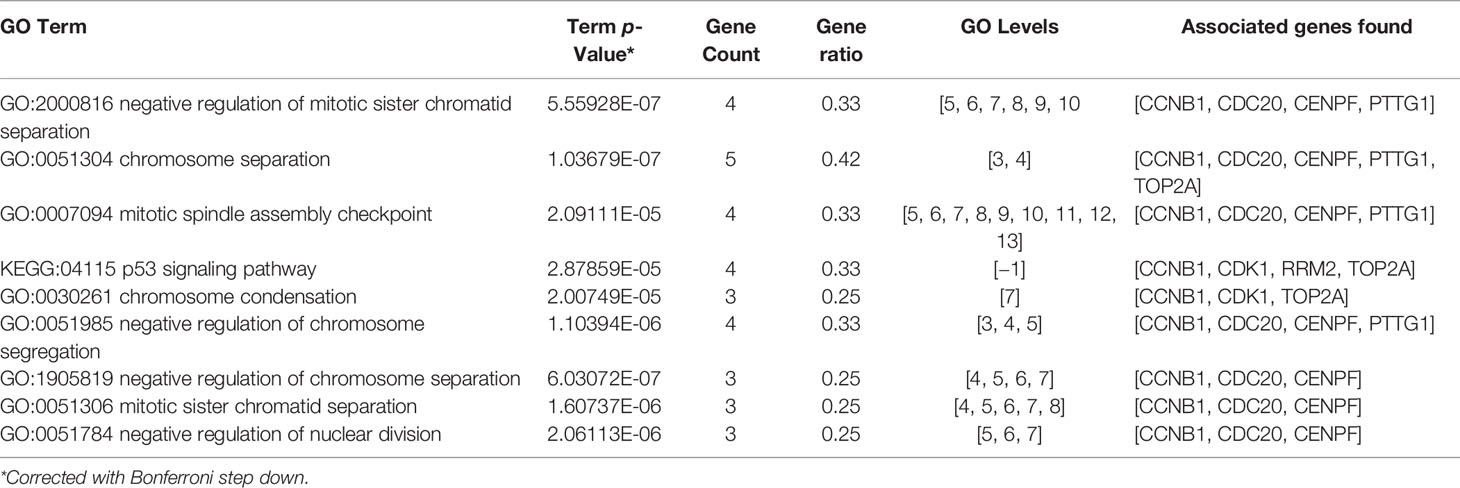
Table 2 Enrichment analysis of the 12 selected genes using ClueGO plug-in.
Co-Expression Network of Three Core Genes
Based on the TCGA data, the expression levels of CCNB1, CDC20, and CENPF varied slightly according to different classifications (TNM staging/Histology Grade/Vascular invasion), but were all upregulated compared with normal liver tissue. With disease progression, their expression levels seemed to increase and showed significant differences from early HCC (T1 stage, G1 grade, none vascular invasion) (Figure 2A). In all HCC with p53 mutation, these three genes presented with higher transcription levels. The meta-analysis of two datasets from Oncomine indicated that in comparison with normal liver tissue, the above three genes’ expression demonstrated no statistical differences between normal liver tissue and cirrhotic liver (Figures 2B, C).
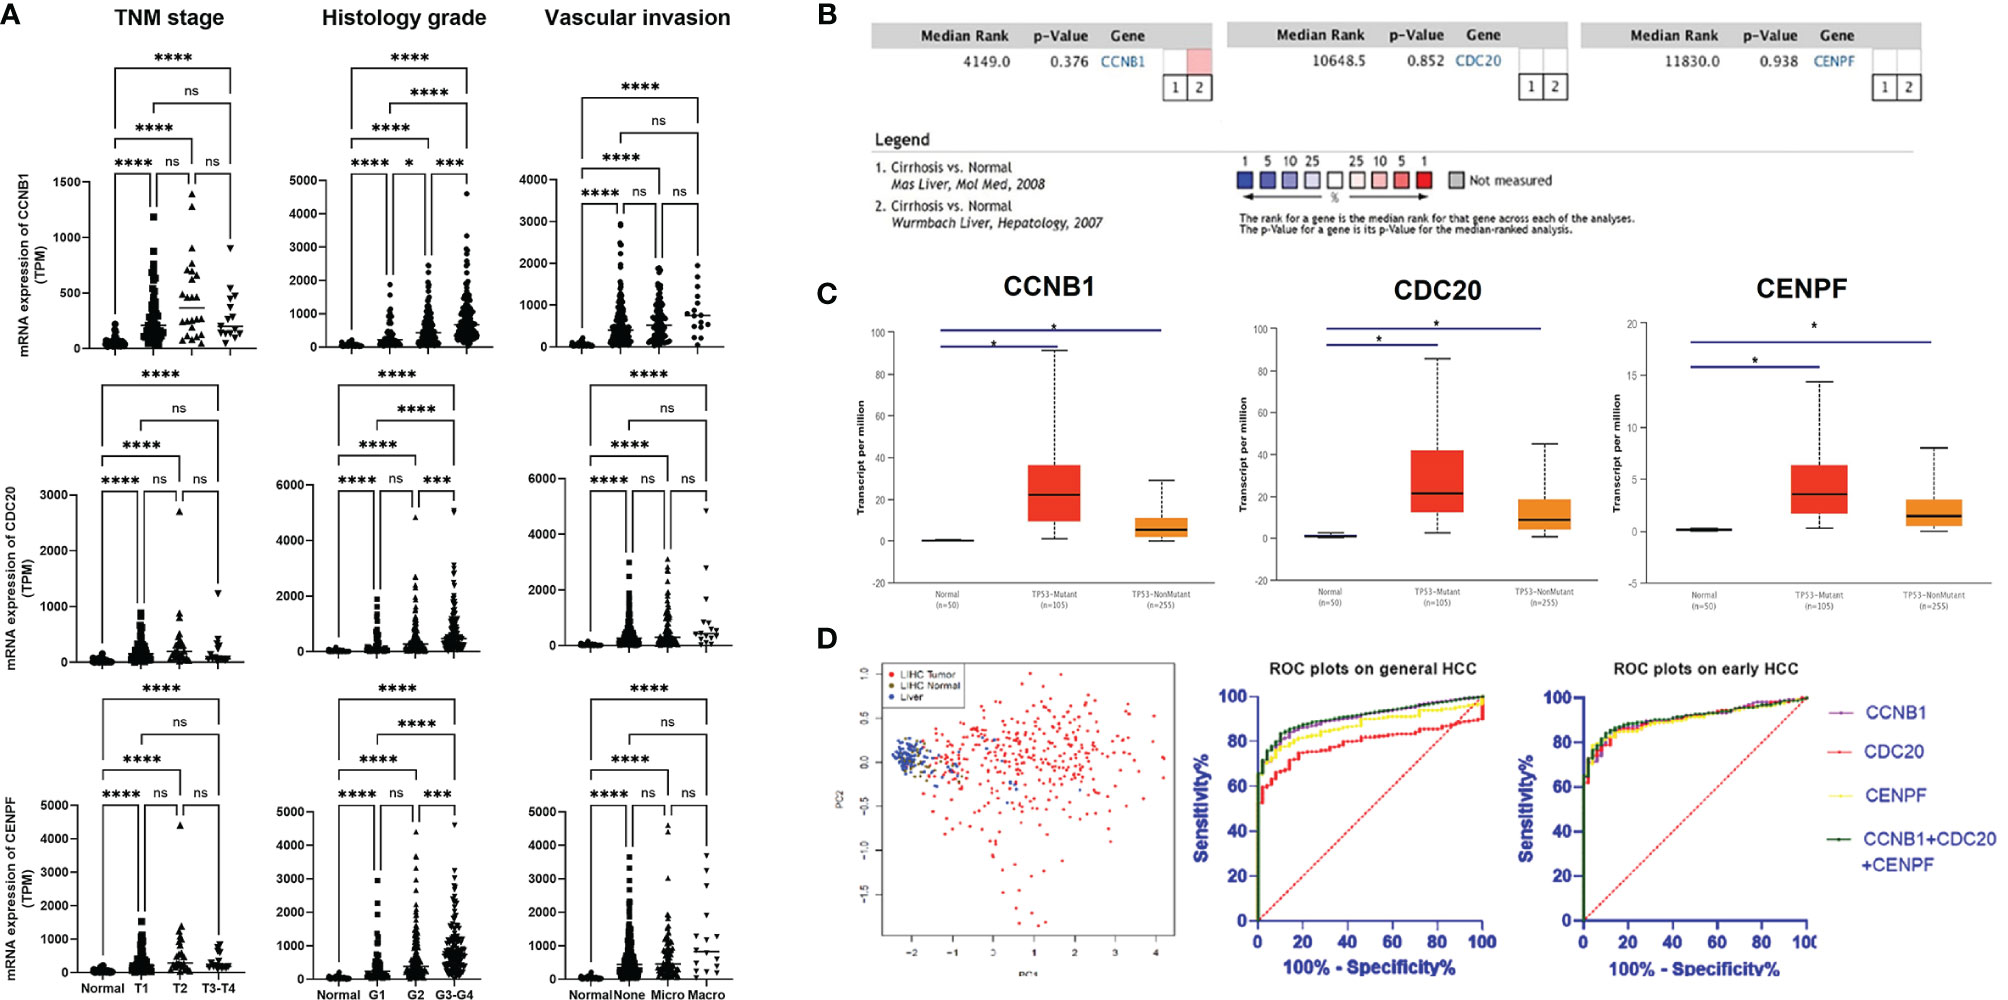
Figure 2 Expression of three core genes across HCC and normal liver tissue: (A) Expression of three genes in HCC tumor tissue based on tumor stage, tumor grade, and other classifications. (B) Meta-analysis on the expression of three genes in liver tissue based on whether they have cirrhosis or not. (C) Expression of three genes in HCC based on whether they have the p53 mutation or not. (D) Validation of diagnostic role of three genes using PCA and ROC analysis. Gene expression profiles were downloaded from TCGA database. *P < 0.05, ***P < 0.001, ****P < 0.0001. ns, no significance.
PCA showed a good diagnostic value using the three core genes. Based on the hepatic expression level of these three core genes, HCC could be clearly distinguished from normal liver tissue and LIHC normal tissue through dimensionality reduction. ROC plots validated that the expression levels of CCNB1 (AUC = 0.905, p < 0.001), CDC20 (AUC = 0.793, p < 0.0001), and CENPF (AUC = 0.872, p < 0.0001) had good diagnostic capabilities in both overall and early-stage (T1) HCC (Figure 2D). Further ROC plot also revealed good performance for non-AFP secretor (AFP <7) HCC diagnosis (Supplementary Figure S7).
Expression of Target Genes in Liver Tissue and Blood Samples of Patients
To further verify the results obtained from the gene screening, Real-time PCR was conducted using liver tissues and blood samples collected from HCC patients from King’s College Hospital. The expression levels of the three genes were all upregulated in HCC tumor tissue compared with normal liver (p = 0.029; p = 0.047; p = 0.027). In contrast, all three were downregulated in PBMCs from HCC patients (p = 0.034; p = 0.039; p = 0.0132). Furthermore, as the tumor status changed with treatment, the expression levels of these genes changed correspondingly in PBMCs; treated HCC patients without active/residual tumor cells had higher transcript levels of CCNB1, CDC20, and CENPF compared with the other two subgroups of HCC patients (Figure 3A).
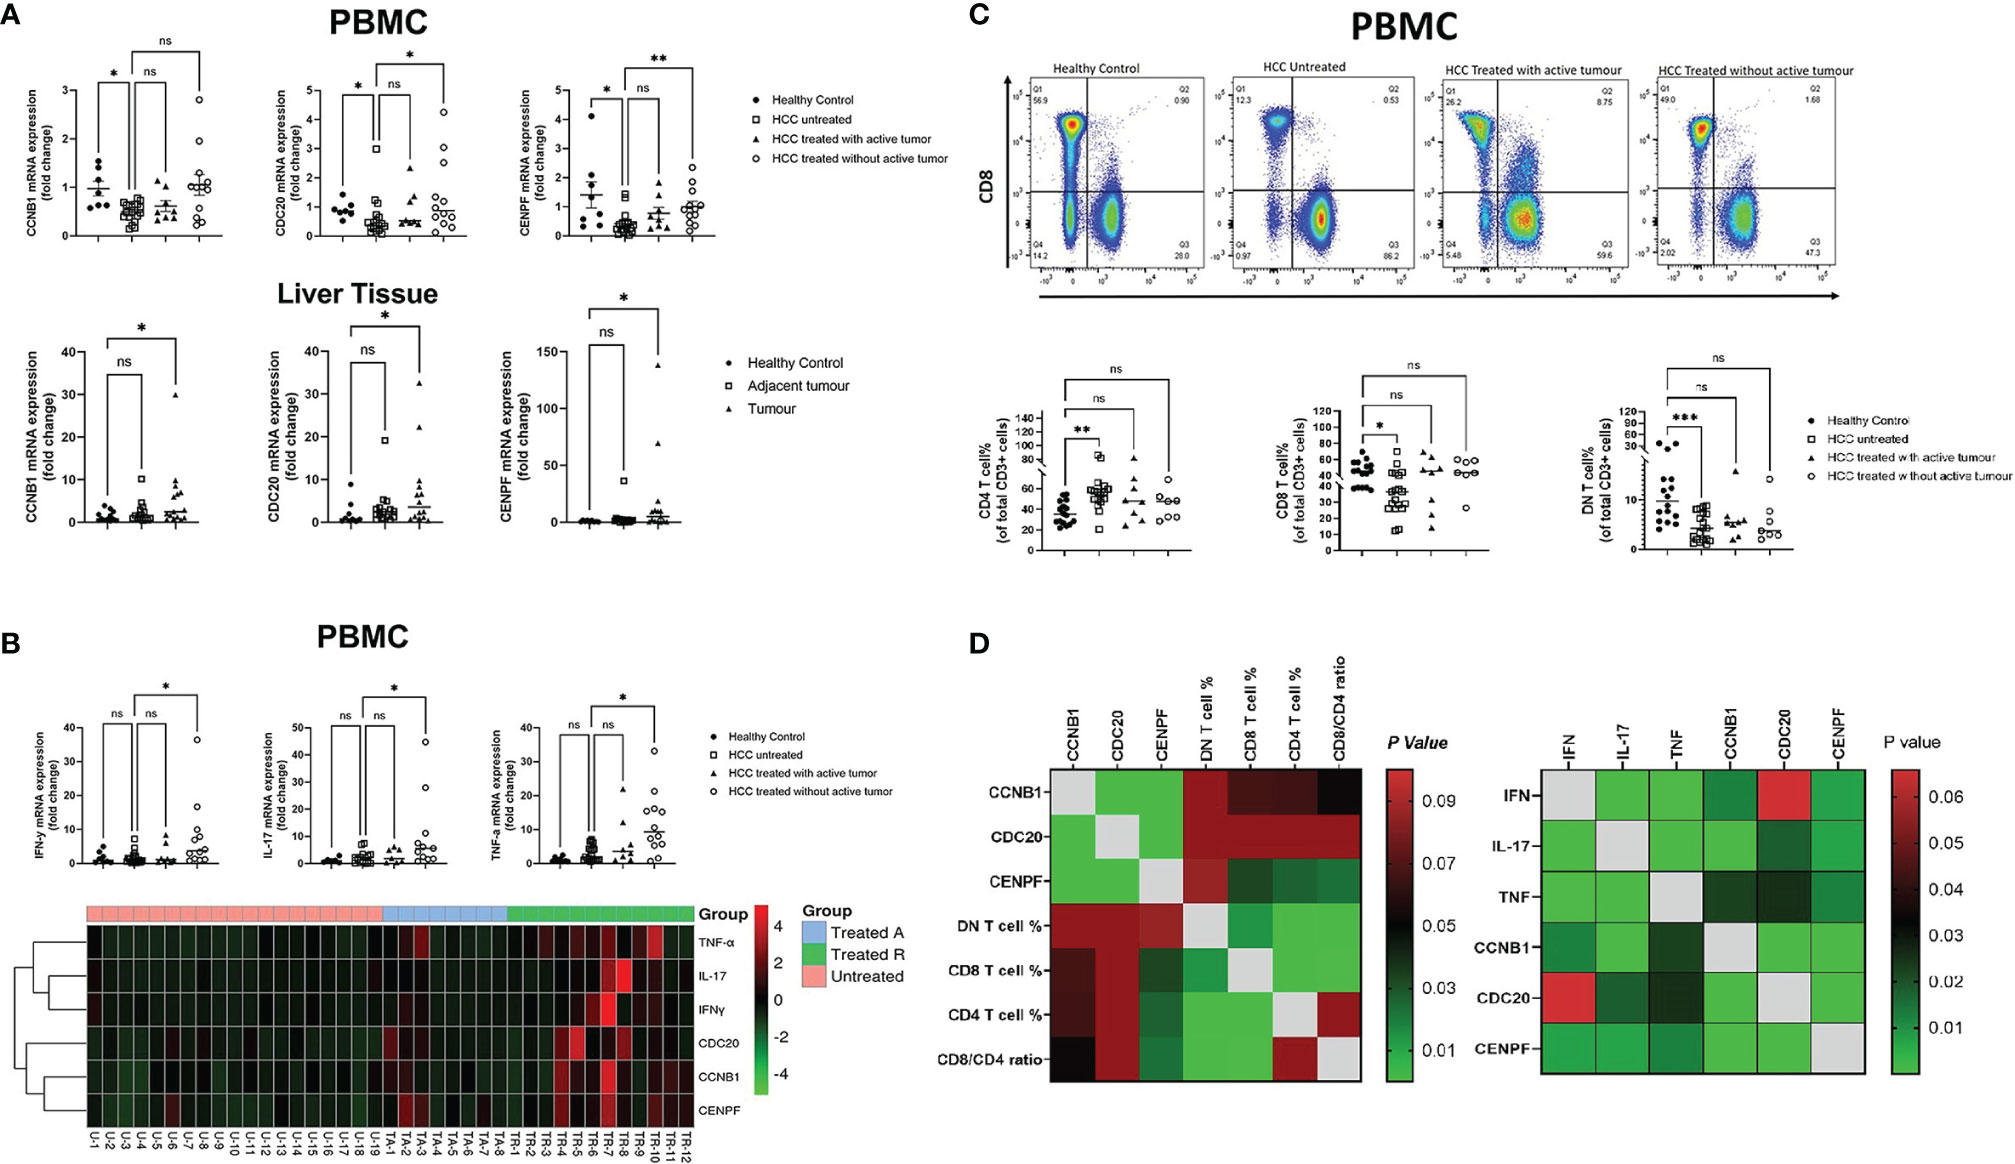
Figure 3 Correlation between core genes and peripheral blood immune cells/pro-inflammation cytokine transcript level: (A) PCR results of three genes’ transcript level in HCC PBMCs and liver tissue. (B) Transcript level of peripheral blood pro-inflammation cytokines in different subsets of HCC. (C) Percentage of three subsets of T cells, CD4+, CD8+, and double-negative (CD4-/CD8-) T cells in different HCC subgroups. (D) Correlation matrix of core genes with peripheral blood immune T cells and pro-inflammation cytokine transcript levels *P < 0.05, **P < 0.01, ***P < 0.001. ns, no significance.
Cytokine Gene Expression and Plasma PD-1 Levels
Treated HCC patients without active/residual tumor cells had higher mRNA expression levels of antitumor cytokines, including IFN-γ, TNF-α, and IL-17 when compared with untreated HCC patients (p = 0.016; p = 0.041; p = 0.0146). With tumor response to treatment, the transcript levels of these genes further increased (Figure 3B). Soluble PD-1 levels in plasma measured by ELISA were not significantly different between patients with untreated and treated HCC with active/residual tumor cells. However, untreated HCC patients had higher plasma PD-1 levels compared with healthy controls (p < 0.05) and treated HCC patients without active/residual tumor cells (p < 0.01) (Figure 3B).
T Cell Profiling
The percentages of peripheral blood T cell subsets were defined by flow cytometry and showed significant differences between untreated HCC patients and healthy controls. The percentages of both CD8+ and double-negative (CD8-CD4-) T cells were lower in untreated HCC patients (p = 0.01; p = 0.0009), while the portion of CD4+ T cells was higher in untreated HCC (p = 0.0014) (Figure 3C) compared with healthy controls. No difference was found in the percentage of cells positive for exhaustion/activation markers (CD38, CD69, CTLA-4, Tim-3, and PD-1). High levels of expression of CXCR3 and CCR5 were observed in peripheral blood T cells, although there was no difference between the three HCC untreated or treated subsets (Supplementary Figure S5).
Correlations Between the Three Target Genes and Immunity
Correlation matrix revealed that the expression levels of CCNB1, CDC20, and CENPF were all correlated with CD8+ and CD4+ T cells to an extent, but only CENPF showed statistical significance (p = 0.033; p = 0.026). Though CCNB1 showed a trend, no significance was observed (p = 0.067; p = 0.065). In addition, the three genes expressed positive association with antitumor cytokine mRNA expression level in PBMCs (Figure 3D).
Increasing expression of these three genes in HCC tumor tissue was associated with decreased overall and disease-free survival (Figure 4A). Though the expression levels of three core genes in PBMCs illustrated no correlation with the plasma PD-1 levels (Figure 4B), in HCC tumor tissue, all of them were positively associated with tumor purity (percentage of tumor cells within HCC tissue); the higher the expression in HCC tissue, the more tumor cells were present in the tissue with fewer infiltrating immune cells (Figure 4C). Moreover, a significant association between the transcript levels of these three genes and inhibitory checkpoint molecules was observed in the tumor environment (Supplementary Figure S6).
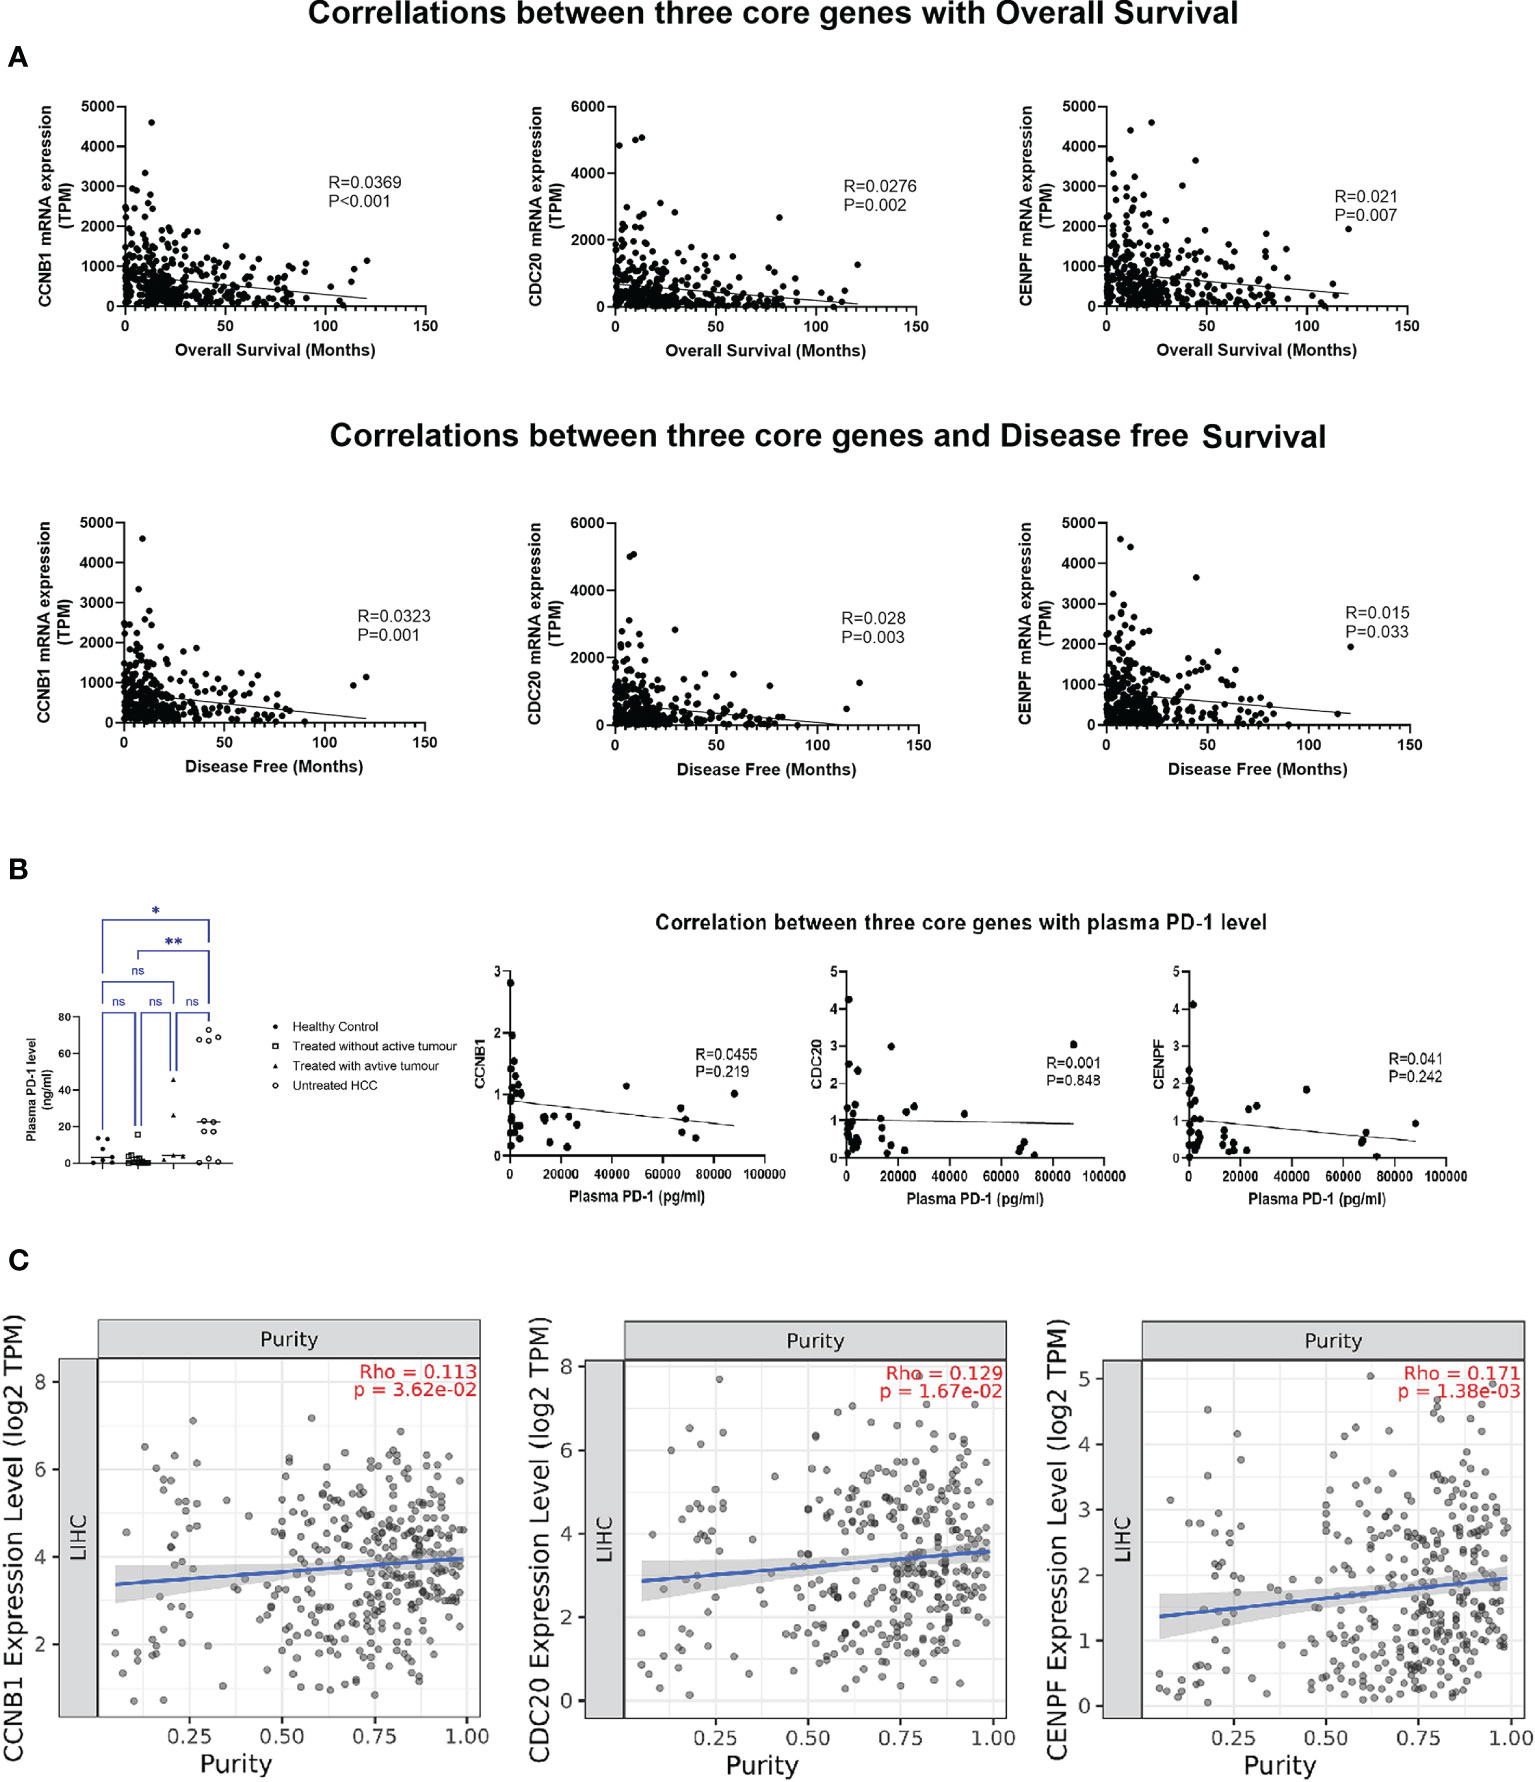
Figure 4 Correlation analysis of three core genes: (A) Correlation with overall survival and disease-free survival. (B) Correlation with plasma PD-1 level. (C) Correlation with tumor purity in HCC. *P < 0.05, **P < 0.01. ns, no significance.
Discussion
In this study, joint screening of multiple databases including GEO, TCGA, GEPIA, and Kaplan–Meier Plotter identified CCNB1, CDC20, and CENPF, three mutated gene markers. These three genes were found to be widely expressed and highly upregulated in HCC samples, and their upregulation was significantly associated with poor prognosis. By using meta-analysis through the Oncomine database, the influence of liver cirrhosis on the expression of above three genes was excluded. Our findings may be useful in tackling the difficulties caused by the heterogeneity of HCC, which contributes to the failure of precision therapy with targeted drugs (21–23). The differential expression of various genes in the tumor tissue makes it unlikely that a single treatment will be effective in all patients. For example, although anti-PD1 therapy is an effective cancer treatment, the overexpression or mutations of LAMA3, CXCR2, and JAK1/2 could prevent the immune system from boosting effective antitumor immunity (24, 25). Therefore, identifying genes that are commonly upregulated in HCC tissue may provide new targets for HCC treatment.
Enrichment analysis revealed that the above three genes mainly interact with each other in functions related to cell proliferation and cell cycle (Table 2). It is known that one of the distinguishing features of cancer is the dysregulation of the cell cycle, resulting in unrestricted proliferation of cancer cells (26, 27). Normally, p53 gene regulates all four checkpoints in the cell cycle (G1/S; S-phase; G2/M; M) (28, 29). It can halt the cell cycle when censored DNA damage or other gene mutation occurs, thereby encouraging repair of damaged DNA (30). However, in patients with HCC, the p53 gene has always presented with a degree of loss of function or dysfunction (31), resulting in cancer cells continually proliferating leading to tumor growth. The results of our investigation showed that the expression of CCNB1, CDC20, and CENPF are closely related to p53 mutations and the p53 signaling pathway (Table 2). In HCC tissue expressing the p53 mutation, the expression levels of the three genes are significantly higher than those without p53 mutator (Figure 2C). Meanwhile, it will also increase with the upgrading of TNM stage/histological grade and the deepening of vascular invasion degree (Figure 1). Thus, overexpression of CCNB1, CDC20, and CENPF in liver tissues imply an underlying cell cycle disorder. The higher the expression, the faster the proliferation of abnormal cells and the greater the possibility of tumor development. This was also confirmed in other solid tumors, not only in HCC. Fang et al. found that downregulation of CCNB1 impaired colorectal cancer proliferation in vitro and tumor growth in vivo (32). Through a long-term follow up, Karra et al. reported that CDC20 and securin overexpression predict short-term breast cancer survival (33). Han et al. also found that CENPF could promote papillary thyroid cancer progression by mediating cell proliferation and apoptosis (34).
Early stage of HCC is usually asymptomatic, and the guidelines of American Association for the Study of Liver Diseases (AASLD) and European Association for the Study of the Liver (EASL) recommend imaging (ultrasound, CT or MRI) combined with alpha-fetoprotein (AFP) to identify HCC (35–37). However, the sensitivity and specificity of AFP in the diagnosis of liver cancer is not ideal. The specificity of AFP is low and it can be elevated in pregnant women, acute and chronic hepatitis, gonadal tumors, and gastrointestinal tumors; in addition, approximately 40% of patients with HCC are non-secretors of AFP (38–40). Therefore, it is meaningful to identify new markers for HCC diagnosis. Some studies reported that YTH N6-methyladenosine RNA binding protein 1 (YTHDF1) and DNA primase subunit 1 (PRIM1) might be potential molecular targets for HCC (41, 42). Those two molecular targets regulated the proliferation, migration, and invasion of HCC cells. In the present study, we aim to identify key genes in HCC that are associated with antitumor immunity and also the pathways influencing the antitumor immunity, such as inhibitory checkpoints. Regardless of the classification standards (TNM staging/Histology Grade/Vascular invasion) used for analysis, all results revealed that CCNB1, CDC20, and CENPF were already significantly upregulated in the early stages of HCC tumor tissues (T1/G1/Stage I/no vascular invasion). There might be a limitation due to the fact that the final reading for RNA-seq is from the mean value of several reads at the same tumor site rather than the average value from different tumor sites. Further ROC analysis showed that these three genes have high value for the early diagnosis of HCC Moreover, even in non-AFP secretors, AUCs of CCNB1, CDC20, and CENPF can achieve a performance close to 0.90 (Supplementary Figure S7). Considering that genetic changes often occur earlier than clinical/pathological changes, the combination of serum AFP and tumor-related gene expression may enhance the efficacy of screening and early diagnosis of HCC (43–45).
Though the RNA-seq data from TCGA did not have detailed background information for patients’ underlying liver diseases, we found that the expression levels of the three genes were closely related to the survival of patients with HCC. Tumor immune infiltrate analysis through the TIMER database demonstrated that the expression levels of the three genes were proportional to the tumor purity. As mentioned above, due to the close relationship between CCNB1, CDC20, and CENPF and p53, overexpression of these three genes represents an imbalance in cell cycle regulation. In HCC, it indicates that cancer cells are rapidly proliferating, and the tumor is in an aggressive state. This feature could be used to assess the prognosis of HCC patients after surgery, to indicate the risk of recurrence, to stratify follow-up imaging, and to guide clinicians regarding adjuvant treatment.
Intriguingly, the expression levels of CCNB1, CDC20, and CENPE in PBMCs were completely opposite to those observed in tumor tissues. Compared with healthy controls, the expression of the three genes in PBMCs from untreated HCC was significantly downregulated, and with treatment, the expression levels in PBMCs gradually increased. The discrepancy in expression pattern between peripheral blood and liver tissue prompted us to set up the correlation network of three target genes in the peripheral blood with immune cells and antitumor cytokines, which showed that the three target genes not only correlated with the percentage of T-cell subtypes, but also showed a positive correlation with the transcription levels of antitumor cytokines (IFN-γ, TNF-α, and IL-17). It can be speculated that the discrepancy in the expressions of CCNB1, CDC20, and CENPF between tumor tissue and peripheral blood may be related to differences in the immune environment: the peripheral circulation has higher percentage of T effectors, such as CD8+T cells, representing cytotoxic T cells, NK cells, and other anti-tumor immune cells than that in HCC tissue where it was dominated by cancer cells and tumor-promoting lymphocytes. Therefore, the overall microenvironment in peripheral blood often presents an immune state of promoting antitumor activity while the HCC tissue shows a state of immunosuppression. The different immune status of peripheral blood and tumor tissue could also explain why the expression levels of the three genes in PBMCs have no correlation with the soluble PD-1 level, while in HCC, all of them were strongly associated with the mRNA expression of immune checkpoint molecules: PD-1, CTLA-4, and TIM-3. The close association between these three genes and p53 as well as inhibitory checkpoint molecules suggests that those genes are potentially treatment targets for HCC. The transcription level changes of the three genes in peripheral blood may assist in establishing rapid, reliable, and reproducible detection assays to assess the immune status and treatment response of HCC patients.
Given the fact that the mRNA expression of three target genes in PBMCs was opposite to that in tumor tissues, single-cell omics and spatial transcriptomics might be applied in future studies. The establishment of new models and algorithms (46, 47) allows information from various single-cell omics databases to be mutually compatible and integrated even though the experimental conditions, platforms, and omics types are different. Meanwhile, high-throughput spatial transcriptomics makes it possible to measure all genetic activity in the tissue samples and to locate the position of the activity. It looks encouraging that more novel methods have been developed to deconvolute spatial transcriptomics for decomposition of cell mixtures in the spatially resolved transcriptomics data (48, 49). Moreover, combining single-cell RNA-seq and spatial transcriptomics could be a promising new method to comprehensively analyze the spatial cell composition of tumor tissue, to characterize tumor cells and their immune microenvironment, and, more importantly, to define the interactions between tumor and microenvironment. Such applications have been found in cancer studies other than HCC (50, 51). Further integrative analysis by using both single-cell omics and spatial transcriptomics might provide a more comprehensive understanding about the cellular process in HCC development.
In conclusion, we confirmed that the three genes, CCNB1, CDC20, and CENPF, are commonly involved in the carcinogenesis of HCC and showed potential for early diagnosis. More importantly, the expression of these three genes is closely associated with Th1/Th17 cytokine gene expression and CD4pos/CD8pos T-cell percentage in peripheral blood and inhibitory checkpoints in tumor microenvironment.
Data Availability Statement
The original contributions presented in the study are included in the article/Supplementary Material. Further inquiries can be directed to the corresponding authors.
Ethics Statement
The studies involving human participants were reviewed and approved by Ethics Committee of King’s College Hospital. The patients/participants provided their written informed consent to participate in this study.
Author Contributions
Study design: TS, ZH, and YM. Manuscript writing: TS, ZH, YJ, AW-J, SG, and MH. Data analysis: TS, YJ, AW-J, SG, MH, and RH. Result discussion: TS, ZH, YJ, SG, MH, RH, and YM. Proofreading and editing: SK, WJ, NH, and YM. All authors contributed to the article and approved the submitted version.
Funding
TS is supported by State Scholarship Fund (201808310051), China Scholarship Council; The Henry Lester Trust; and Surgical Funds, King’s College Hospital Charity. ZH is supported by the Visiting Scholar Funding from Shanghai University of Traditional Chinese Medicine, China.
Conflict of Interest
The authors declare that the research was conducted in the absence of any commercial or financial relationships that could be construed as a potential conflict of interest.
Publisher’s Note
All claims expressed in this article are solely those of the authors and do not necessarily represent those of their affiliated organizations, or those of the publisher, the editors and the reviewers. Any product that may be evaluated in this article, or claim that may be made by its manufacturer, is not guaranteed or endorsed by the publisher.
Acknowledgments
We are grateful to Dr. Thomas Dowe, Biobank Manager at the Institute of Liver Studies, King’s College Hospital (KCH) for his help on HCC patient recruitment from KCH, London, UK and Dr. Xiaohong Huang’s assistance on several immunoassays.
Supplementary Material
The Supplementary Material for this article can be found online at: https://www.frontiersin.org/articles/10.3389/fonc.2021.738841/full#supplementary-material
References
1. Jelic S, Sotiropoulos GC, Group EGW. Hepatocellular Carcinoma: ESMO Clinical Practice Guidelines for Diagnosis, Treatment and Follow-Up. Ann Oncol (2010) 21(Suppl 5):v59–64. doi: 10.1093/annonc/mdq166
2. Villanueva A. Hepatocellular Carcinoma. N Engl J Med (2019) 380(15):1450–62. doi: 10.1056/NEJMra1713263
3. Niu ZS, Niu XJ, Wang WH. Genetic Alterations in Hepatocellular Carcinoma: An Update. World J Gastroenterol (2016) 22(41):9069–95. doi: 10.3748/wjg.v22.i41.9069
4. Cao Q, Anyansi C, Hu X, Xu L, Xiong L, Tang W, et al. Reconstruction of Enhancer-Target Networks in 935 Samples of Human Primary Cells, Tissues and Cell Lines. Nat Genet (2017) 49(10):1428–36. doi: 10.1038/ng.3950
5. Wei Y, Chen X, Liang C, Ling Y, Yang X, Ye X, et al. A Noncoding Regulatory RNAs Network Driven by Circ-CDYL Acts Specifically in the Early Stages Hepatocellular Carcinoma. Hepatology (2020) 71(1):130–47. doi: 10.1002/hep30795
6. Caruso S, Calatayud AL, Pilet J, La Bella T, Rekik S, Imbeaud S, et al. Analysis of Liver Cancer Cell Lines Identifies Agents With Likely Efficacy Against Hepatocellular Carcinoma and Markers of Response. Gastroenterology (2019) 157(3):760–76. doi: 10.1053/j.gastro.2019.05.001
7. Chiyonobu N, Shimada S, Akiyama Y, Mogushi K, Itoh M, Akahoshi K, et al. Fatty Acid Binding Protein 4 (FABP4) Overexpression in Intratumoral Hepatic Stellate Cells Within Hepatocellular Carcinoma With Metabolic Risk Factors. Am J Pathol (2018) 188(5):1213–24. doi: 10.1016/j.ajpath.2018.01.012
8. Liao YL, Sun YM, Chau GY, Chau YP, Lai TC, Wang JL, et al. Identification of SOX4 Target Genes Using Phylogenetic Footprinting-Based Prediction From Expression Microarrays Suggests That Overexpression of SOX4 Potentiates Metastasis in Hepatocellular Carcinoma. Oncogene (2008) 27(42):5578–89. doi: 10.1038/onc.2008.168
9. Barrett T, Wilhite SE, Ledoux P, Evangelista C, Kim IF, Tomashevsky M, et al. NCBI GEO: Archive for Functional Genomics Data Sets–Update. Nucleic Acids Res (2013) 41(Database issue):D991–995. doi: 10.1093/nar/gks1193
10. Wurmbach E, Chen YB, Khitrov G, Zhang W, Roayaie S, Schwartz M, et al. Genome-Wide Molecular Profiles of HCV-Induced Dysplasia and Hepatocellular Carcinoma. Hepatology (2007) 45(4):938–47. doi: 10.1002/hep.21622
11. Davis S, Meltzer PS. GEOquery: A Bridge Between the Gene Expression Omnibus (GEO) and BioConductor. Bioinformatics (2007) 23(14):1846–7. doi: 10.1093/bioinformatics/btm254
12. Szklarczyk D, Gable AL, Lyon D, Junge A, Wyder S, Huerta-Cepas J, et al. STRING V11: Protein-Protein Association Networks With Increased Coverage, Supporting Functional Discovery in Genome-Wide Experimental Datasets. Nucleic Acids Res (2019) 47(D1):D607–13. doi: 10.1093/nar/gky1131
13. Bindea G, Mlecnik B, Hackl H, Charoentong P, Tosolini M, Kirilovsky A, et al. ClueGO: A Cytoscape Plug-In to Decipher Functionally Grouped Gene Ontology and Pathway Annotation Networks. Bioinformatics (2009) 25(8):1091–3. doi: 10.1093/bioinformatics/btp101
14. Nagy A, Lanczky A, Menyhart O, Gyorffy B. Validation of miRNA Prognostic Power in Hepatocellular Carcinoma Using Expression Data of Independent Datasets. Sci Rep (2018) 8(1):9227. doi: 10.1038/s41598-018-27521-y
15. Tang Z, Li C, Kang B, Gao G, Li C, Zhang Z. GEPIA: A Web Server for Cancer and Normal Gene Expression Profiling and Interactive Analyses. Nucleic Acids Res (2017) 45(W1):W98–W102. doi: 10.1093/nar/gkx247
16. Fernando RL, Nettleton D, Southey BR, Dekkers JC, Rothschild MF, Soller M. Controlling the Proportion of False Positives in Multiple Dependent Tests. Genetics (2004) 166(1):611–9. doi: 10.1534/genetics.166.1.611
17. Chandrashekar DS, Bashel B, Balasubramanya SAH, Creighton CJ, Ponce Rodriguez I, Chakravarthi BVSK, et al. UALCAN: A Portal for Facilitating Tumor Subgroup Gene Expression and Survival Analyses. Neoplasia (2017) 19(8):649–58. doi: 10.1016/j.neo.2017.05.002
18. Rhodes DR, Yu J, Shanker K, Deshpande N, Varambally R, Ghosh D, et al. ONCOMINE: A Cancer Microarray Database and Integrated Data-Mining Platform. Neoplasia (2004) 6(1):1–6. doi: 10.1016/S1476-5586(04)80047-2
19. Li T, Fu J, Zeng Z, Cohen D, Li J, Chen Q, et al. TIMER2.0 for Analysis of Tumor-Infiltrating Immune Cells. Nucleic Acids Res (2020) 48(W1):W509–14. doi: 10.1093/nar/gkaa407
20. Riedhammer C, Halbritter D, Weissert R. Peripheral Blood Mononuclear Cells: Isolation, Freezing, Thawing, and Culture. Methods Mol Biol (2016) 1304:53–61. doi: 10.1007/7651_2014_99
21. Zheng H, Pomyen Y, Hernandez MO, Li C, Livak F, Tang W, et al. Single-Cell Analysis Reveals Cancer Stem Cell Heterogeneity in Hepatocellular Carcinoma. Hepatology (2018) 68(1):127–40. doi: 10.1002/hep.29778
22. Huang A, Zhao X, Yang XR, Li FQ, Zhou XL, Wu K, et al. Circumventing Intratumoral Heterogeneity to Identify Potential Therapeutic Targets in Hepatocellular Carcinoma. J Hepatol (2017) 67(2):293–301. doi: 10.1016/j.jhep.2017.03.005
23. Malumbres M, Barbacid M. Cell Cycle, CDKs and Cancer: A Changing Paradigm. Nat Rev Cancer (2009) 9(3):153–66. doi: 10.1038/nrc2602
24. Liao W, Overman MJ, Boutin AT, Shang X, Zhao D, Dey P, et al. KRAS-IRF2 Axis Drives Immune Suppression and Immune Therapy Resistance in Colorectal Cancer. Cancer Cell (2019) 35(4):559–72.e557. doi: 10.1016/j.ccell.2019.02.008
25. Shin DS, Zaretsky JM, Escuin-Ordinas H, Garcia-Diaz A, Hu-Lieskovan S, Kalbasi A, et al. Primary Resistance to PD-1 Blockade Mediated by JAK1/2 Mutations. Cancer Discov (2017) 7(2):188–201. doi: 10.1158/2159-8290.CD-16-1223
26. Massague J. G1 Cell-Cycle Control and Cancer. Nature (2004) 432(7015):298–306. doi: 10.1038/nature03094
27. Engeland K. Cell Cycle Arrest Through Indirect Transcriptional Repression by P53: I Have a DREAM. Cell Death Differ (2018) 25(1):114–32. doi: 10.1038/cdd.2017.172
28. Morgan SE, Kastan MB. P53 and ATM: Cell Cycle, Cell Death, and Cancer. Adv Cancer Res (1997) 71:1–25. doi: 10.1016/S0065-230X(08)60095-0
29. Wang X, Simpson ER, Brown KA. P53: Protection Against Tumor Growth Beyond Effects on Cell Cycle and Apoptosis. Cancer Res (2015) 75(23):5001–7. doi: 10.1158/0008-5472.CAN-15-0563
30. Nicolai S, Rossi A, Di Daniele N, Melino G, Annicchiarico-Petruzzelli M, Raschella G. DNA Repair and Aging: The Impact of the P53 Family. Aging (Albany NY) (2015) 7(12):1050–65. doi: 10.18632/aging.100858
31. Nakayama Y, Yamaguchi N. Role of Cyclin B1 Levels in DNA Damage and DNA Damage-Induced Senescence. Int Rev Cell Mol Biol (2013) 305:303–37. doi: 10.1016/B978-0-12-407695-2.00007-X
32. Fang Y, Yu H, Liang X, Xu J, Cai X. Chk1-Induced CCNB1 Overexpression Promotes Cell Proliferation and Tumor Growth in Human Colorectal Cancer. Cancer Biol Ther (2014) 15(9):1268–79. doi: 10.4161/cbt.29691
33. Karra H, Repo H, Ahonen I, Löyttyniemi E, Pitkänen R, Lintunen M, et al. Cdc20 and Securin Overexpression Predict Short-Term Breast Cancer Survival. Br J Cancer (2014) 110(12):2905–13. doi: 10.1038/bjc.2014.252
34. Han Y, Xu S, Cheng K, Diao C, Liu S, Zou W, et al. CENPF Promotes Papillary Thyroid Cancer Progression by Mediating Cell Proliferation and Apoptosis. Exp Ther Med (2021) 21(4):401. doi: 10.3892/etm.2021.9832
35. Bruix J, Sherman M, American Association for the Study of Liver D. Management of Hepatocellular Carcinoma: An Update. Hepatology (2011) 53(3):1020–2. doi: 10.1002/hep.24199
36. European Association for the Study of the Liver, Electronic address eee, European Association for the Study of the L. EASL Clinical Practice Guidelines: Management of Hepatocellular Carcinoma. J Hepatol (2018) 69(1):182–236. doi: 10.1016/j.jhep.2018.03.019
37. Lersritwimanmaen P, Nimanong S. Hepatocellular Carcinoma Surveillance: Benefit of Serum Alfa-Fetoprotein in Real-World Practice. Euroasian J Hepatogastroenterol (2018) 8(1):83–7. doi: 10.5005/jp-journals-10018-1268
38. Silva JP, Gorman RA, Berger NG, Tsai S, Christians KK, Clarke CN, et al. The Prognostic Utility of Baseline Alpha-Fetoprotein for Hepatocellular Carcinoma Patients. J Surg Oncol (2017) 116(7):831–40. doi: 10.1002/jso.24742
39. Song PP, Xia JF, Inagaki Y, Hasegawa K, Sakamoto Y, Kokudo N, et al. Controversies Regarding and Perspectives on Clinical Utility of Biomarkers in Hepatocellular Carcinoma. World J Gastroenterol (2016) 22(1):262–74. doi: 10.3748/wjg.v22.i1.262
40. Forner A, Diaz-Gonzalez A, Liccioni A, Vilana R. Prognosis Prediction and Staging. Best Pract Res Clin Gastroenterol (2014) 28(5):855–65. doi: 10.1016/j.bpg.2014.08.002
41. Zhu M, Wu M, Bian S, Song Q, Xiao M, Huang H, et al. DNA Primase Subunit 1 Deteriorated Progression of Hepatocellular Carcinoma by Activating AKT/mTOR Signaling and UBE2C-Mediated P53 Ubiquitination. Cell Biosci (2021) 11(1):42. doi: 10.1186/s13578-021-00555-y
42. Bian S, Ni W, Zhu M, Song Q, Zhang J, Ni R, et al. Identification and Validation of the N6-Methyladenosine RNA Methylation Regulator YTHDF1 as a Novel Prognostic Marker and Potential Target for Hepatocellular Carcinoma. Front Mol Biosci (2020) 7:604766. doi: 10.3389/fmolb.2020.604766
43. Zucman-Rossi J, Villanueva A, Nault JC, Llovet JM. Genetic Landscape and Biomarkers of Hepatocellular Carcinoma. Gastroenterology (2015) 149(5):1226–39.e1224. doi: 10.1053/j.gastro.2015.05.061
44. Liu F, Li H, Chang H, Wang J, Lu J. Identification of Hepatocellular Carcinoma-Associated Hub Genes and Pathways by Integrated Microarray Analysis. Tumori (2015) 101(2):206–14. doi: 10.5301/tj.5000241
45. Lin DC, Mayakonda A, Dinh HQ, Huang P, Lin L, Liu X, et al. Genomic and Epigenomic Heterogeneity of Hepatocellular Carcinoma. Cancer Res (2017) 77(9):2255–65. doi: 10.1158/0008-5472.CAN-16-2822
46. Song Q, Su J, Miller LD, Zhang W. scLM: Automatic Detection of Consensus Gene Clusters Across Multiple Single-Cell Datasets. Genomics Proteomics Bioinf (2020) mS1672-0229(20):30142–X. doi: 10.1016/j.gpb.2020.09.002
47. Song Q, Su J, Zhang W. scGCN Is a Graph Convolutional Networks Algorithm for Knowledge Transfer in Single Cell Omics. Nat Commun (2021) 12(1):3826.
48. Song Q, Su J. DSTG: Deconvoluting Spatial Transcriptomics Data Through Graph-Based Artificial Intelligence. Brief Bioinform (2021) 22(5):bbaa414. doi: 10.1093/bib/bbaa414
49. Elosua-Bayes M, Nieto P, Mereu E, Gut I, Heyn H. SPOTlight: Seeded NMF Regression to Deconvolute Spatial Transcriptomics Spots With Single-Cell Transcriptomes. Nucleic Acids Res (2021) 49(9):e50.
50. Lee J, Hyeon DY, Hwang D. Single-Cell Multiomics: Technologies and Data Analysis Methods. Exp Mol Med (2020) 52(9):1428–42. doi: 10.1038/s12276-020-0420-2
Keywords: HCC, prognosis, antitumor immunity, inhibitory checkpoint, hepatocarcinogenesis
Citation: Si T, Huang Z, Jiang Y, Walker-Jacobs A, Gill S, Hegarty R, Hamza M, Khorsandi SE, Jassem W, Heaton N and Ma Y (2021) Expression Levels of Three Key Genes CCNB1, CDC20, and CENPF in HCC Are Associated With Antitumor Immunity. Front. Oncol. 11:738841. doi: 10.3389/fonc.2021.738841
Received: 09 July 2021; Accepted: 13 September 2021;
Published: 30 September 2021.
Edited by:
Xing-Xing He, Huazhong University of Science and Technology, ChinaReviewed by:
Qianqian Song, Wake Forest Baptist Medical Center, United StatesDuc-Hau Le, Vingroup Big Data Institute, Vietnam
Copyright © 2021 Si, Huang, Jiang, Walker-Jacobs, Gill, Hegarty, Hamza, Khorsandi, Jassem, Heaton and Ma. This is an open-access article distributed under the terms of the Creative Commons Attribution License (CC BY). The use, distribution or reproduction in other forums is permitted, provided the original author(s) and the copyright owner(s) are credited and that the original publication in this journal is cited, in accordance with accepted academic practice. No use, distribution or reproduction is permitted which does not comply with these terms.
*Correspondence: Yun Ma, eXVuLm1hQGtjbC5hYy51aw==; Nigel Heaton, bmlnZWwuaGVhdG9uQG5ocy5uZXQ=
†These authors have contributed equally to this work