- 1Department of Ultrasonography, The First Affiliated Hospital of Nanchang University, Nanchang, China
- 2Department of Head and Neck Otolaryngology, The First Affiliated Hospital of Nanchang University, Nanchang, China
Purpose: To develop and validate a nomogram combining radiomics of B-mode ultrasound (BMUS) images and the American College of Radiology (ACR) Thyroid Imaging Reporting and Data System (TI-RADS) for predicting malignant thyroid nodules and improving the performance of the guideline.
Method: A total of 451 thyroid nodules referred for surgery and proven pathologically at an academic referral center from January 2019 to September 2020 were retrospectively collected and randomly assigned to training and validation cohorts (7:3 ratio). A nomogram was developed through combining the BMUS radiomics score (Rad-Score) with ACR TI-RADS score (ACR-Score) in the training cohort; the performance of the nomogram was assessed with respect to discrimination, calibration, and clinical application in the validation and entire cohorts.
Results: The ACR-Rad nomogram showed good calibration and yielded an AUC of 0.877 (95% CI 0.836–0.919) in the training cohort and 0.864 (95% CI 0.799–0.931) in the validation cohort, which were significantly better than the ACR-Score model (p < 0.001 and 0.031, respectively). The significantly improved AUC, net reclassification index (NRI), and integrated discriminatory improvement (IDI) of the nomogram were found for both senior and junior radiologists (all p < 0.001). Decision curve analysis indicated that the nomogram was clinically useful. When cutoff values for 50% predicted malignancy risk (ACR-Rad_50%) were applied, the nomogram showed increased specificity, accuracy and positive predictive value (PPV), and decreased unnecessary fine-needle aspiration (FNA) rates in comparison to ACR TI-RADS.
Conclusion: The ACR-Rad nomogram has favorable value in predicting malignant thyroid nodules and improving performance of the ACR TI-RADS for senior and junior radiologists.
Introduction
With the increasing number of imaging-detected thyroid nodules, overdiagnosis and overtreatment are major clinical challenges in the management of these nodules; therefore, an accurate and practical risk stratification tool is necessary (1). Because B-mode ultrasound (BMUS) is the most accurate imaging modality to assess thyroid nodules, there are a number of risk classification systems based on BMUS images formulated by authoritative associations (2–5). Previous studies have compared different guidelines to find a management guideline that is most beneficial to patients and demonstrated that the 2017 American College of Radiology (ACR) Thyroid Imaging Reporting and Data System (TIRADS) showed accurate diagnostic performance and meaningful reduction in the number of thyroid nodules recommended for biopsy (6–8). However, the relatively low specificity, positive predictive value (PPV), and interobserver variability of the ACR guidelines are impediments to achieving the desired clinical results (7, 9).
Radiomics has the ability to high-throughput mine quantitative image features and discover information reflecting the underlying pathophysiology that cannot be assessed by visual interpretation (10, 11). In recent years, radiomics has been applied to the thyroid, showing that it helps predict malignancy in thyroid nodules and preoperative cervical lymph node staging in papillary thyroid carcinoma (12–14). However, radiomics features are usually analyzed from a single-section image of the target nodule; therefore, radiomics alone might lose some important BMUS information, which makes it impossible to significantly improve the performance of risk stratification systems for all radiologists with different proficiency levels (15).
A nomogram is a graphical tool for a concise and intuitive display of the predicted value of individual outcome events based on multivariate regression analysis. We supposed that a nomogram could adequately combine the visual interpretation and radiomics of BMUS images to achieve better predictive performance. To the best of our knowledge, no published study has investigated the predictive performance of a nomogram combining radiomics with ACR TI-RADS scores for predicting malignant thyroid nodules.
Therefore, the purpose of our study was to develop and validate a nomogram that combines the radiomics score (Rad-Score) and ACR-TIRADS score (ACR-Score) for predicting malignant thyroid nodules and improving performance of the ACR TI-RADS.
Materials and Methods
Ethical approval and informed consent were waived because the retrospective study with de-identified data was used, and no protected health information was needed. The study was conducted following guidelines by the Declaration of Helsinki.
Patients
Between January 2019 and September 2020, patients with thyroid nodules (≥10 mm in maximum diameter) in the Head and Neck Otolaryngology Department of our institution were consecutively included. The nodules were enrolled using the following inclusion and exclusion criteria.
The inclusion criteria were as follows: 1) the target nodule had undergone surgical resection; 2) postoperative pathological results were obtained; and 3) BMUS was performed within 2 weeks before the resection. Exclusion criteria are as follows: 1) the pathological result of the nodule was ambiguous, 2) interventional procedures such as fine-needle aspiration (FNA) and radiofrequency ablation were performed before BMUS, and 3) the BMUS image of the target nodule was unclear.
A total of 451 patients (median age, 45 years, range, 20 to 81 years; 93 men and 358 women) were enrolled. If there were multiple nodules in one patient, the nodule with the largest diameter was selected as the target nodule. All nodules were randomly split into a training cohort (n = 315, median age, 45 years, range 20 to 81 years; 68 men and 247 women) and a validation cohort (n = 136, median age, 43 years, range 21 to 70 years; 25 men and 111 women) in a 7:3 ratio.
Clinical and BMUS Information
Clinicopathological data, including age, sex, and nodule pathology, were obtained from medical records. BMUS images were acquired with a Philips iU Elite and Philips EPIQ7 (ultrasound system, Philips Medical System, Bothell, WA, USA) using a 5–12-MHz linear transducer by two radiologists (PX and ZW) with more than 8 years of experience. Images of each target nodule were obtained in transverse and longitudinal planes, and video clips were obtained in at least one plane.
Analysis of the ACR TI-RADS
Two radiologists (AZ and XH, with more than 10 years and 3 years of experience, respectively) who were unaware of the pathological results reviewed the BMUS images of all nodules. The five feature categories in the ACR TI-RADS lexicon (composition, echogenicity, shape, margin, and echogenic foci) were evaluated, and the ACR-Score of each nodule was calculated (referred to as ACR-Score 1 for AZ, ACR-Score 2 for XH) (16). The Supplement presents the detailed process of calculating the ACR-Score (Supplementary Tables E1, 2). The diameter and location (subcapsular or intrathyroidal) were negotiated to a consensus by the two radiologists.
Analysis of the Radiomics Features
The region of interest (ROI) was delineated manually on the BMUS DICOM image of the target nodule with the largest diameter in sagittal view using open-source software (3D Slicer, version 4.10.2; https://www.slicer.org) (Supplementary Figure E1) (17, 18). The reproducibility of the intra- and interobserver agreement for the radiomics features was measured using the first 130 nodules that a radiologist (XH) redelineated twice within 2 weeks. The intraclass correlation coefficient (ICC) was used to evaluate the intra- and interobserver agreement. ICC > 0.75 represented satisfactory agreement. XH delineated the remaining nodules if strong agreement (ICC > 0.90) was achieved. To ensure repeatability of the results, resampling and z-score normalization were performed as preprocessing steps (Supplementary E1). Open-source software (Pyradiomics; http://pyradiomics.readthedocs.io/en/latest/index.html) (19) was used to extract a total of 837 texture, intensity, and wavelet features (Supplementary Table E3). Then, dimensionality reduction and radiomics feature selection were performed successively by ICC, univariate, least absolute shrinkage and selection operator (LASSO) and linear dependence analyses (20, 21). The methodology used to extract the radiomics features is further described in Supplementary E2 and Figure 1A. The radiomics score (Rad-Score) was generated using a linear combination of the selected features.
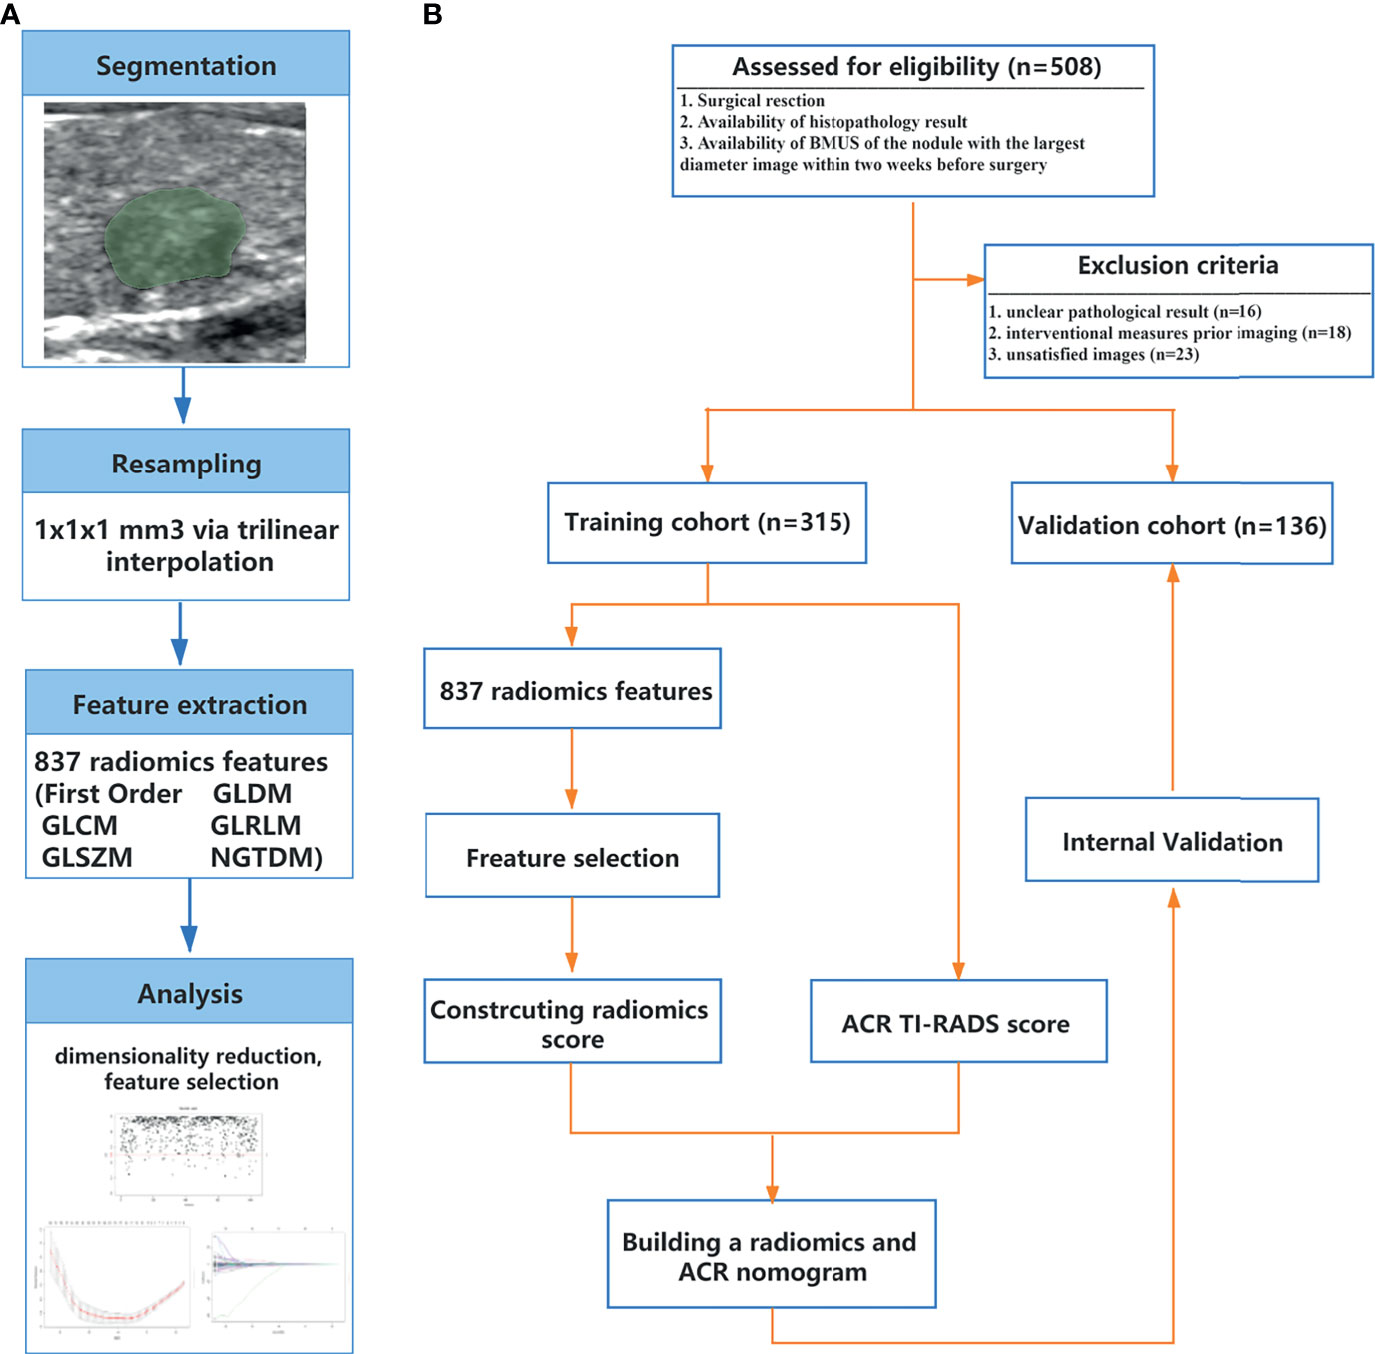
Figure 1 B-model ultrasound radiomics workflow (A) and study flowchart (B). ACR, American College of Radiology; BMUS, B-model ultrasound; GLCM, gray-level co-occurrence matrix; GLDM, gray-level dependence matrix; GLRLM, gray-level run length matrix; GLSZM, gray-level size zone matrix; NGTDM, neighboring gray tone difference matrix; TI-RADS, thyroid imaging reporting and data system.
Statistical Analysis
Statistical analysis was conducted with IBM SPSS 22.0 software (IBM, New York, USA) and R software (Version 4.0.1, https://www.r-project.org/). The packages of R4.0.1 used are provided in Supplementary Table E4. The Shapiro–Wilk test was used to evaluate the normality of the distribution. Continuous data conforming to a normal distribution are expressed as the mean ± standard deviation (SD) and were compared using Student’s t-test; nonconforming data are expressed as the median [interquartile range (IQR)] and were compared using the Mann–Whitney U test. Categorical data are expressed as numbers (%) and were compared using a chi-square test or Fisher’s exact test, as appropriate. A p < 0.05 represented a statistically significant difference.
Development of the ACR-Rad Nomogram
The ACR-Rad nomogram was developed based on the Rad-Score and the average of ACR-Score 1 and ACR-Score 2. For comparison, the ACR-Score model was built through a univariate logistic equation.
Performance of the ACR-Rad Nomogram
Calibration was evaluated using the Akaike information criterion (AIC), the Bayesian information criterion (BIC), calibration curve, and Hosmer–Lemeshow test (22). Discrimination performance was evaluated using the area under the receiver operator characteristic (ROC) curve (AUC). The Delong test was used to compare AUCs and the LR test to compare the effect across the nested logistic regression models.
Clinical Utility of the ACR-Rad Nomogram
The interobserver agreement for ACR-Score, Rad-Score, and the predicted malignancy risk by the ACR-Rad nomogram was evaluated. The improvement in the predictive accuracy of the nomogram by radiologists with different levels of experience was evaluated by the AUC, index integrated discrimination improvement (IDI), and net reclassification improvement (NRI). Decision curve analysis (DCA) was conducted to determine the clinical usefulness of the nomogram by quantifying the net benefits at different threshold probabilities in the entire cohort.
For clinical management, we compared the performance for biopsy recommended of the cutoff value which was determined in the training cohort with the maximum Youden index (referred to as ACR-Rad_max), and different cutoff values which were determined in the training cohort for prespecified predicted risks of malignancy (20%/30%/40%/50%) (referred to as ACR-Rad_20%/30%/40%/50%, respectively) with ACR TI-RADS in the entire cohort.
Results
Patient Characteristics
The study flowchart is shown in Figure 1B. Clinical and pathological characteristics in the training and validation cohorts are summarized in Tables 1, 2. There was no significant difference between the training and validation cohorts for clinicopathological and BMUS characteristics (all p > 0.05). The proportions of malignant nodules in the two groups were 62.9% (198/315) and 70.6% (96/136) (p = 0.114). Malignant nodules had significantly lower age, diameter, and nodular goiter and significantly higher ACR-Score 1 and ACR-Score 2 than benign nodules in the training and validation cohorts (all p < 0.05).
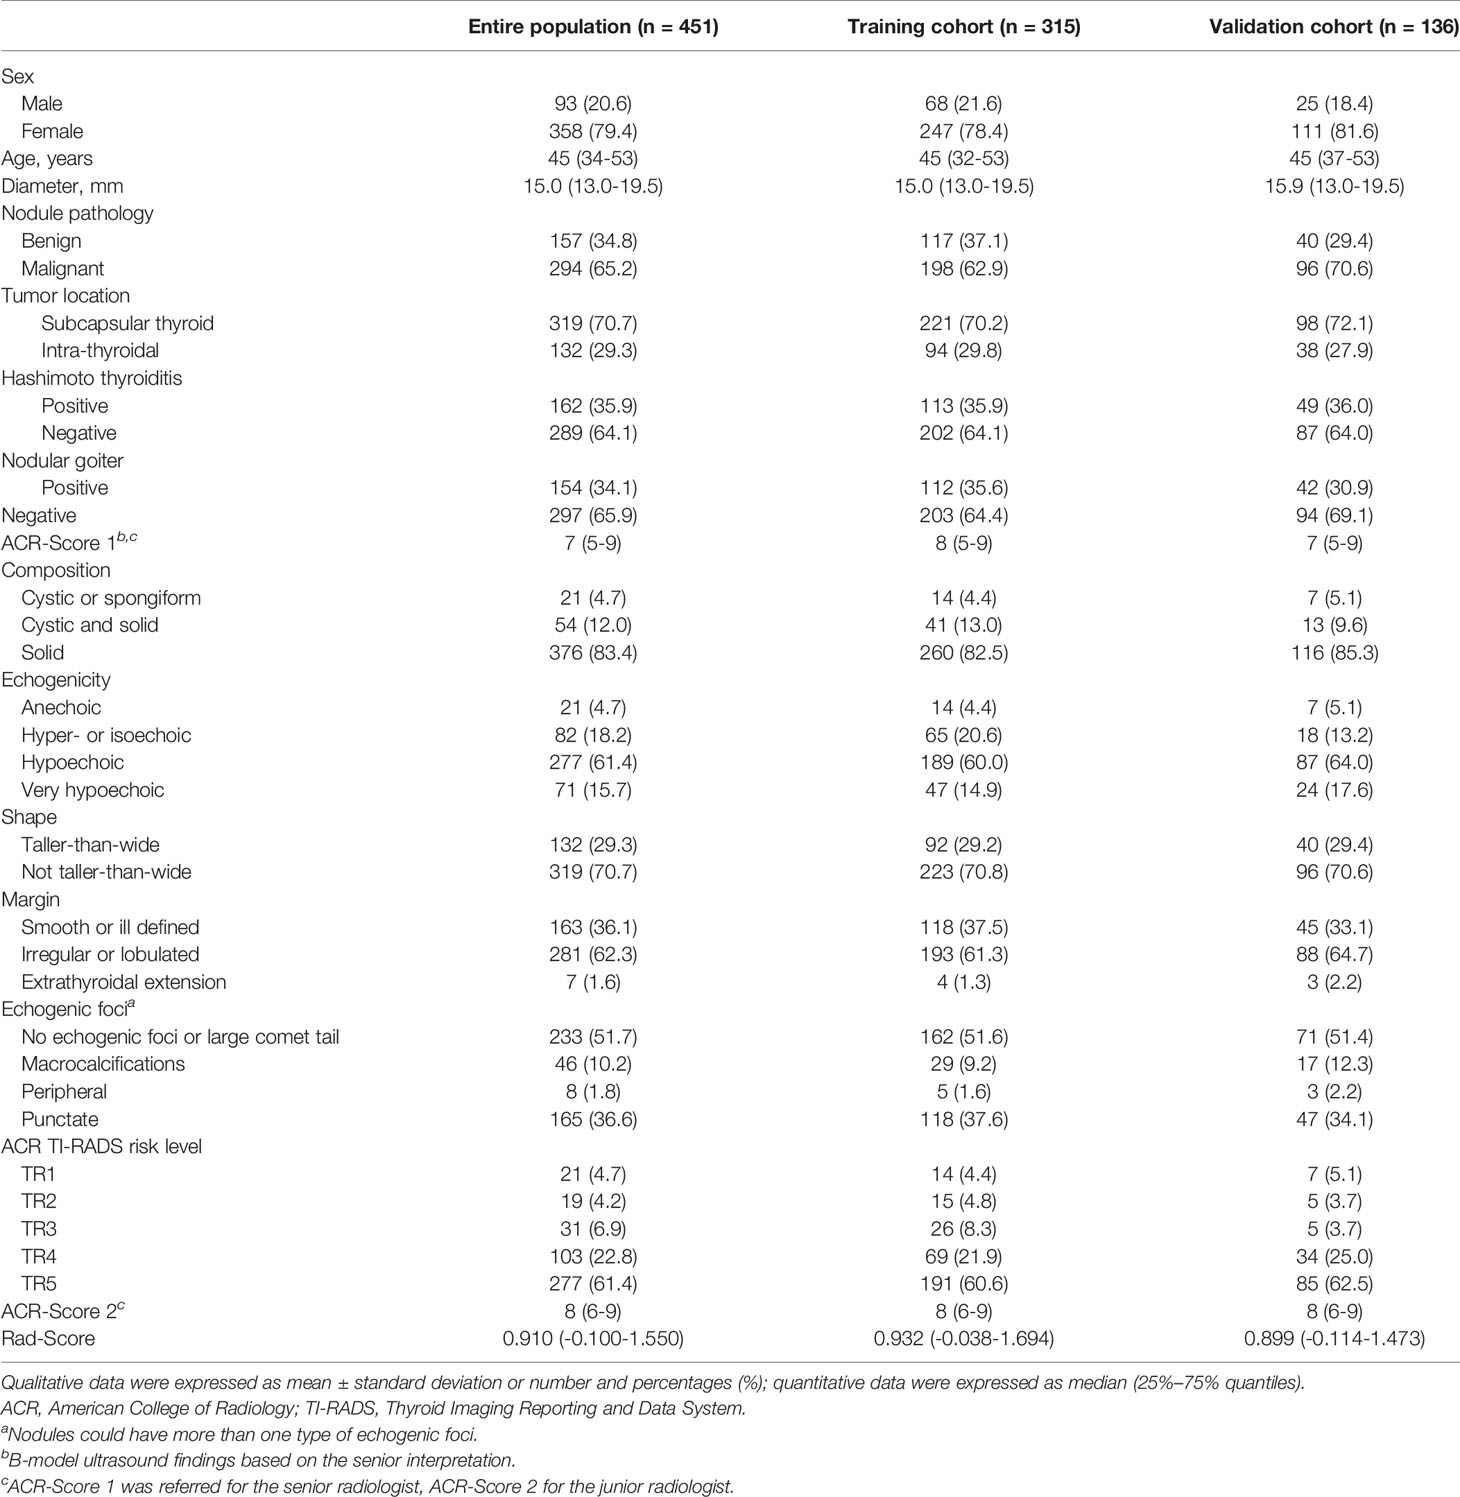
Table 1 Clinicopathological and ultrasonic characteristics of patients in the training and validation cohorts.
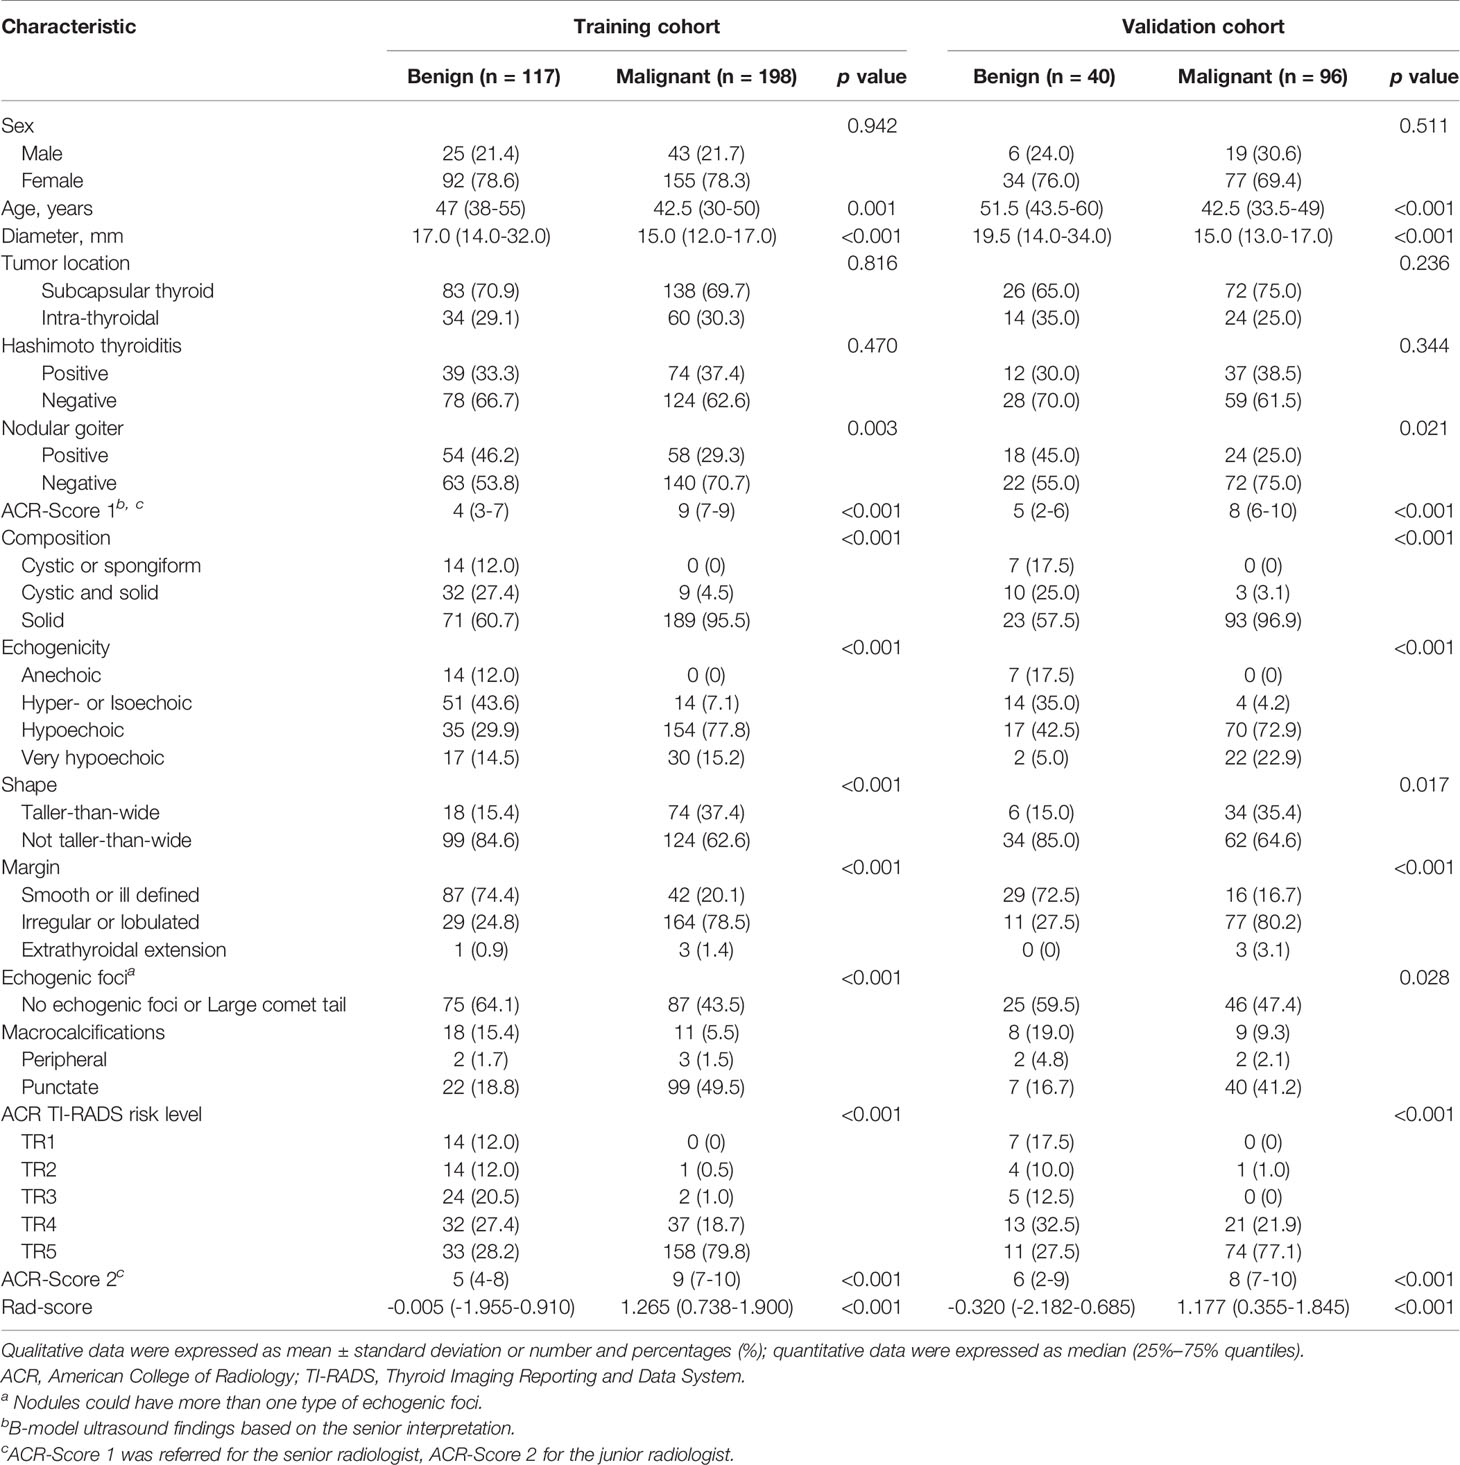
Table 2 Clinicopathological and ultrasonic characteristics for thyroid nodules in the training and validation cohorts by pathology.
Selecting Radiomics Features and Building the Rad-Score
The rates of intra- and interobserver agreement for the radiomics features reached 94.7% (794/837; mean ICC = 0.920) and 94.0% (787/837; mean ICC = 0.901), respectively (Supplementary Figure E2). Seventy-two features were excluded due to unsatisfactory agreement (ICC < 0.75); 192 features were excluded due to insignificant differences based on univariate analysis. Among 14 features selected by LASSO, 4 features were considered to have strong collinearity for the variance inflation factor [VIF] which was more than 10 (Supplementary Figure E3). The remaining 10 features were included in the Rad-Score formula (Supplementary Figure E4). The Rad-Score of malignant nodules was significantly higher than that of benign nodules in the training [1.265 (0.738–1.900) vs. -0.005 (-1.955–0.910), p < 0.001] and validation cohorts [1.177 (0.355–1.845) vs. -0.320 (-2.182–0.685), p < 0.001] (Table 2). The Rad-Score yielded an AUC of 0.801 (95% CI 0.750–0.851) in the training cohort and 0.820 (95% CI 0.742–0.898) in the validation cohort (Figure 2).
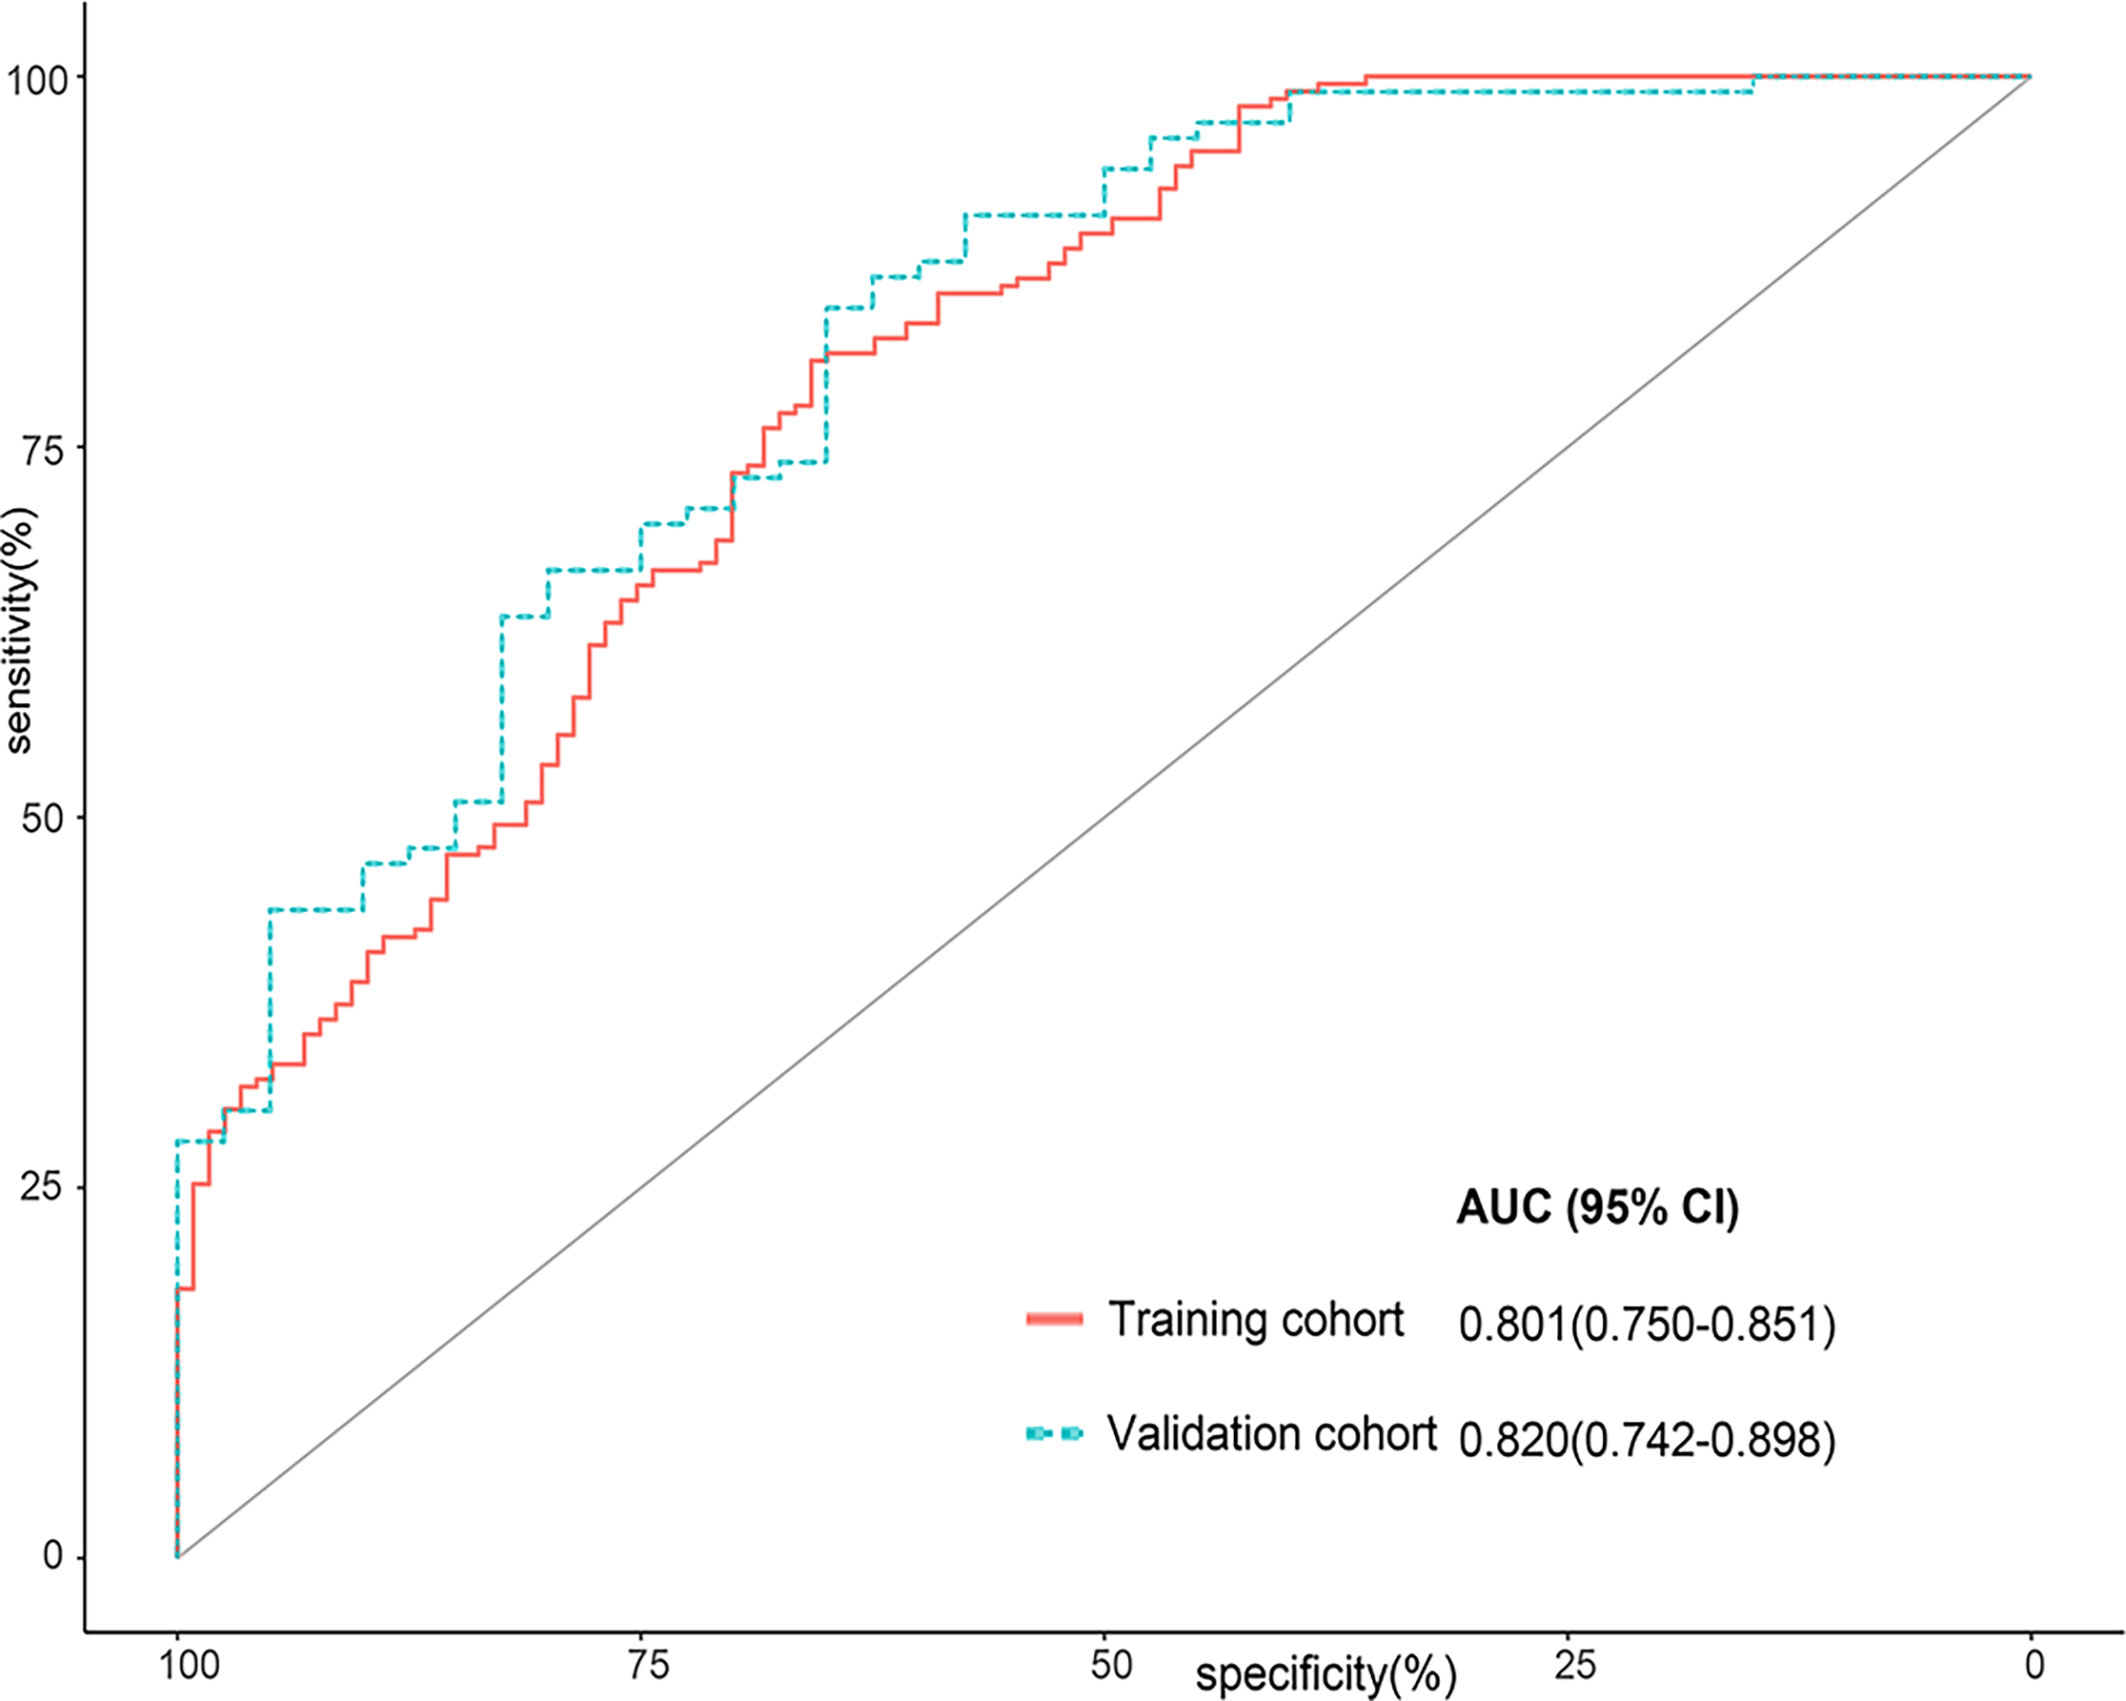
Figure 2 Receiver operator characteristic (ROC) curves for the Rad-Score in the training cohort and the validation cohort.
Development and Performance of the ACR-Rad Nomogram
The ACR-Rad nomogram incorporated two predictors: the average ACR-Score [odds ratio (OR) 1.644, 95% CI 1.423–1.928] and Rad-Score (OR 2.269, 95% CI 1.709–3.133) (both p < 0.001) (Figure 3A). The ACR-Score model was built using the following a univariate logistic regression equation:
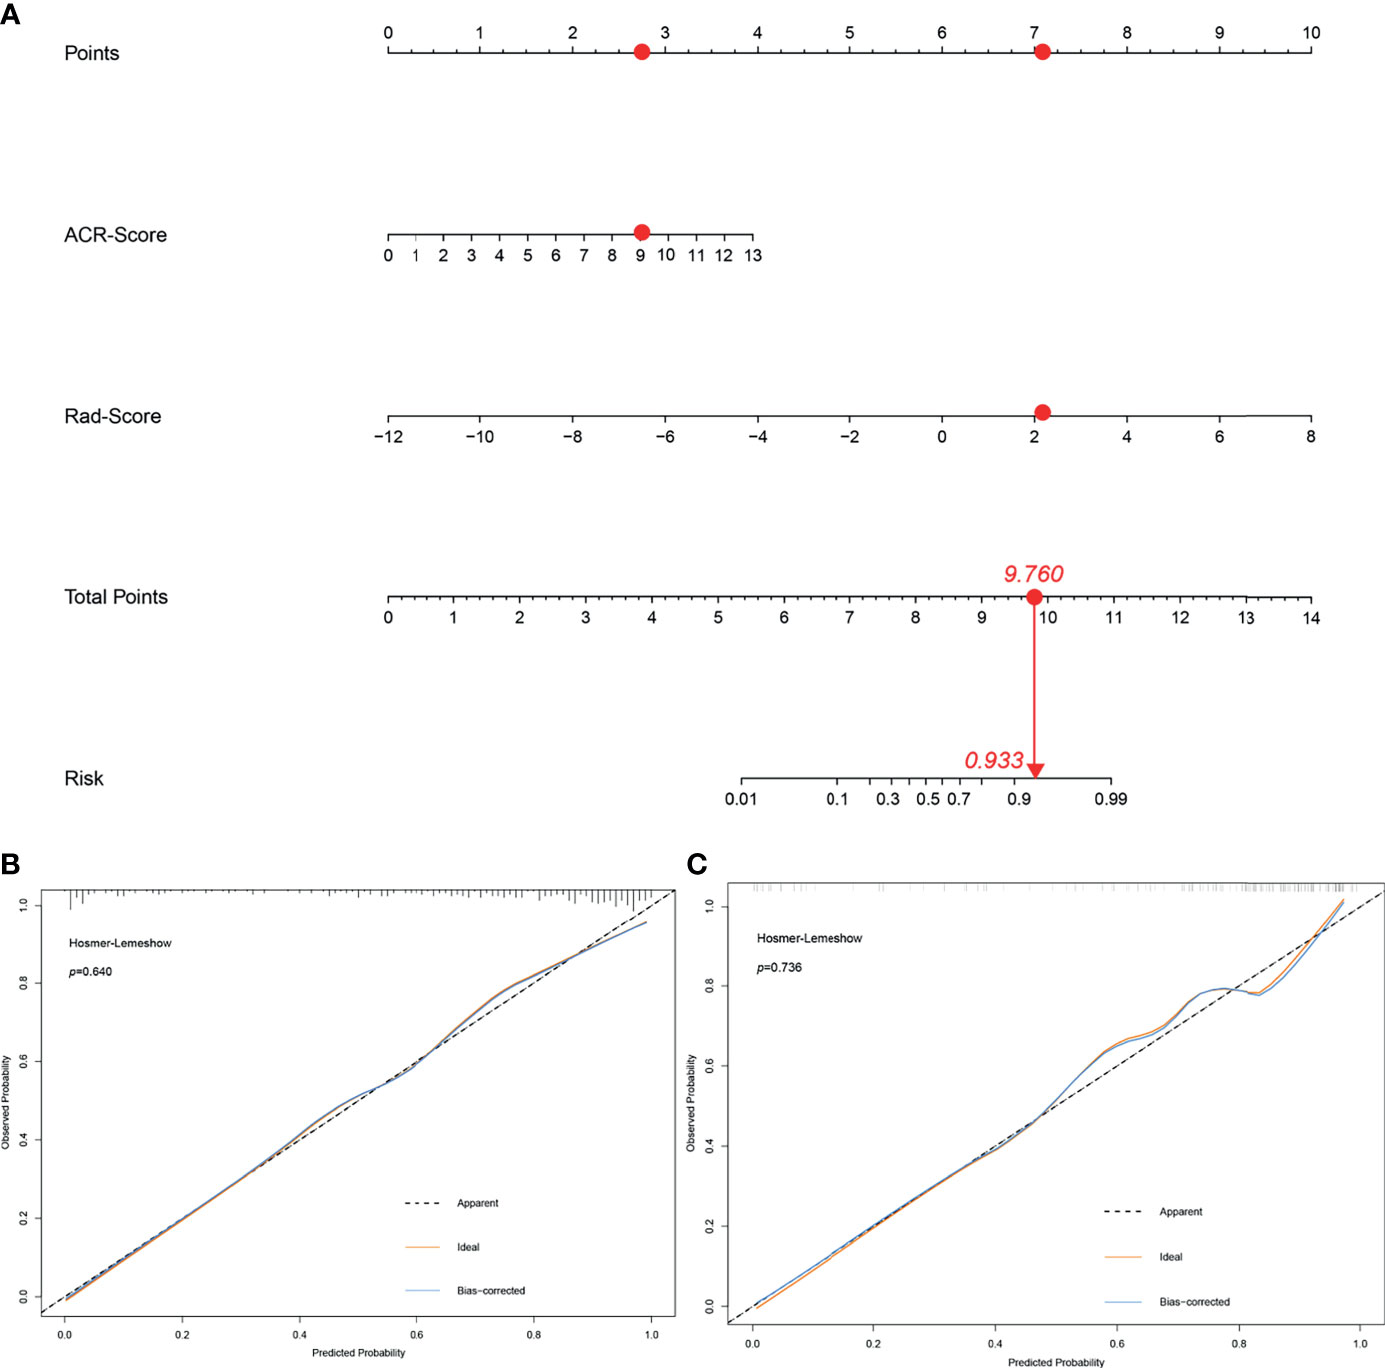
Figure 3 The ACR-Rad nomogram to predict malignancy in thyroid nodules (A) and calibration curves of the nomogram in the training (B) and validation (C) cohort. Red dots described the calculation process of an ACR-Rad nomogram point of a malignant thyroid nodule.
The LR test between the ACR-Rad nomogram and ACR-Score model was χ2 = 4.184 (p < 0.001). The AIC, BIC, calibration curve, and Hosmer–Lemeshow test statistic (p = 0.640) showed good calibration of the ACR-Rad nomogram in the training cohort (Table 3 and Figure 3B). An AUC of 0.877 (95% CI 0.836–0.919) also showed good discrimination, which was significantly higher than that of the ACR-Score model (0.833, 95% CI 0.785–0.880) in the training cohort (p < 0.001). The favorable calibration of the nomogram was confirmed in the validation cohort, whose Hosmer–Lemeshow test yielded a p value of 0.736 (Figure 3C). The AUC (0.864, 95% CI 0.799–0.931) was significantly higher than that of the ACR-Score model (0.802, 95% CI 0.719–0.886) in the validation cohort (Figures 4A, B).

Table 3 Performance of the ACR-Rad nomogram for predicting malignant thyroid nodules in the training and validation cohorts.

Figure 4 Receiver operating characteristic (ROC) curves of the ACR-Rad nomogram and ACR-Score model in the training (A), validation (B), and entire (C) cohorts.
Clinical Utility of the ACR-Rad Nomogram
The ICC of ACR-Score (0.677) was considerably lower than that of the Rad-Score and predicted malignancy risk (0.901 and 0.844, respectively). For senior and junior radiologists, the utilization of the ACR-Rad nomogram significantly improved the predictive value for predicting malignant thyroid nodules in terms of AUC, NRI, and IDI compared to the ACR-Score model in entire cohort (all p <0.001) (Table 4 and Figure 4C). Moreover, favorable calibration of the nomogram was confirmed in both radiologists (Hosmer–Lemeshow test p = 0.715 and 0.415, respectively) (Supplementary Figure E5). The DCA demonstrated that the nomogram had a higher overall net benefit than the ACR-Score model, and was more beneficial than either the treat-all or the treat-none strategy (Figure 5).

Table 4 Performance of the ACR-Rad nomogram for predicting malignant thyroid nodules with interpretations from the senior and junior radiologists.
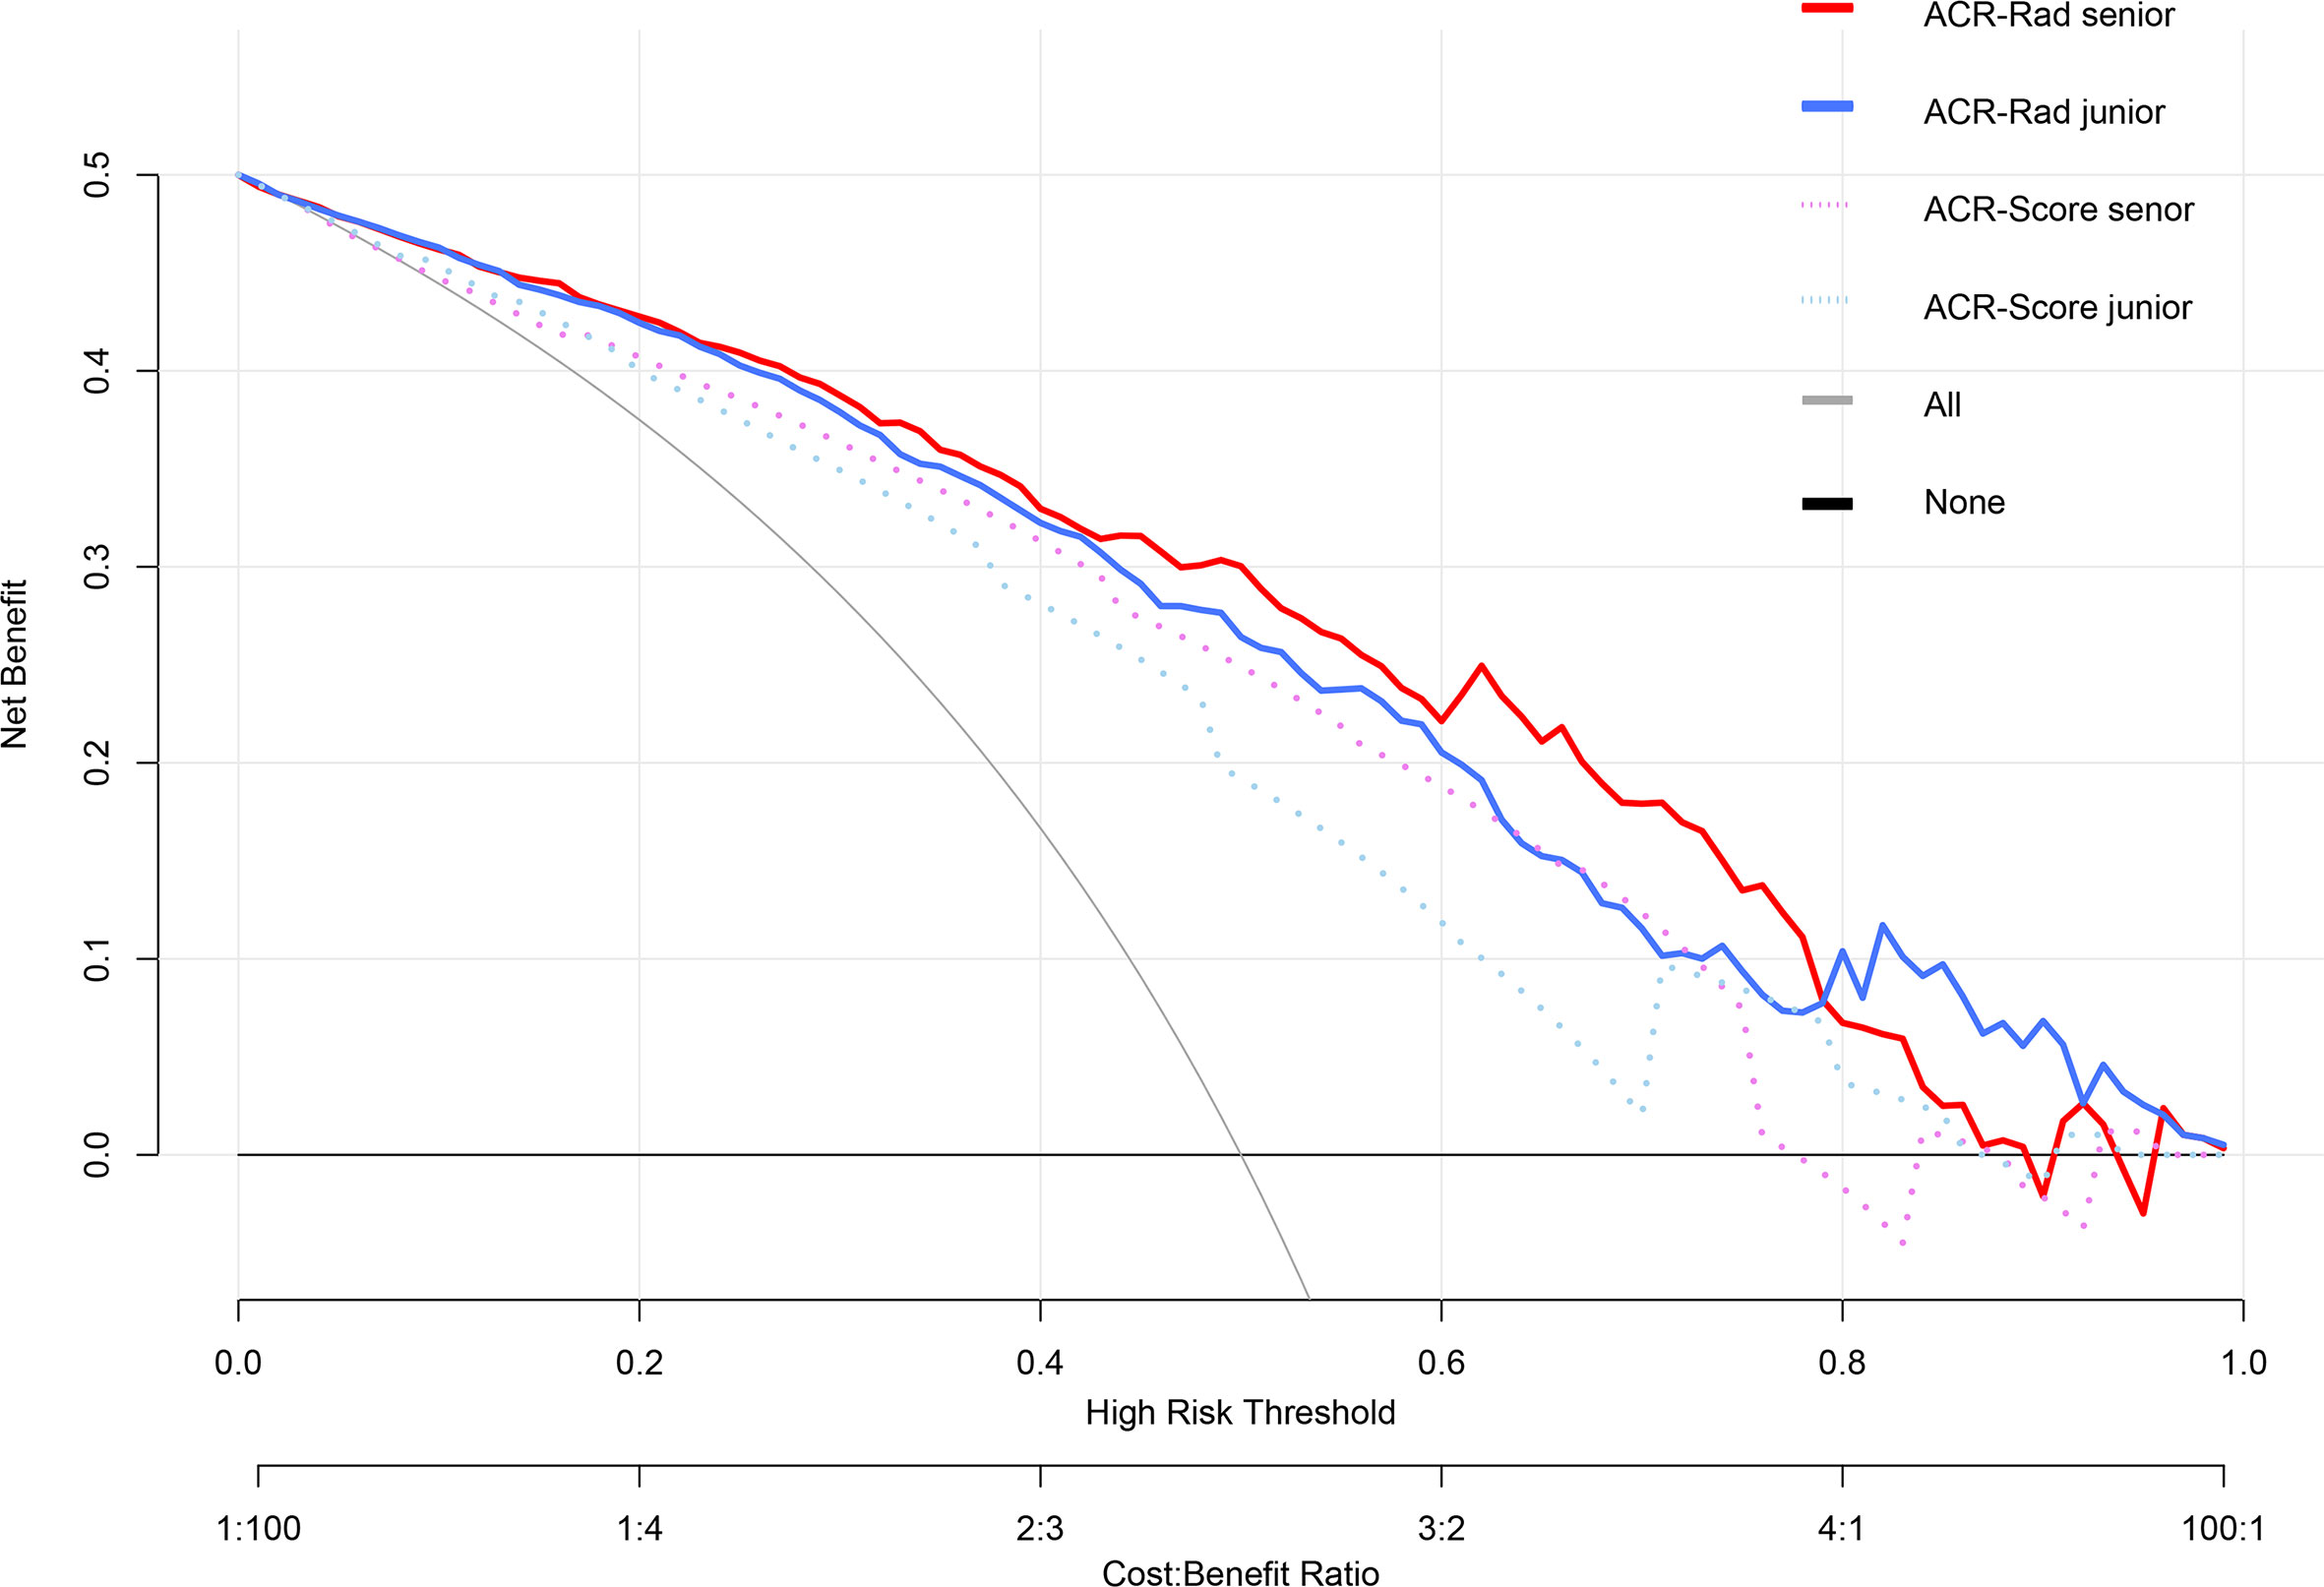
Figure 5 Decision curve analysis (DCA) of the ACR-Rad nomogram in predicting malignancy in thyroid nodules for the senior and junior radiologists. The vertical axis measures standardized net benefit. The horizontal axis shows the corresponding risk threshold. The DCA showed that the ACR-Rad nomogram had a higher overall net benefit than the ACR-Score model for both senior and junior radiologist.
When applied with the ACR-Rad_max, specificity, accuracy, and PPV significantly increased with unnecessary FNA rates significantly decreasing but at the expense of significantly decreased sensitivity in comparison to ACR TI-RADS for both senior and junior radiologists. With ACR-Rad_20%/30%/40%, the specificity improved insignificantly for the senior radiologist. With ACR-Rad_50%, the significantly increased specificity, accuracy, and PPV and decreased unnecessary FNA rate were observed for the junior radiologist, and the significantly increased specificity was presented for the senior radiologist as well (all p < 0.05), with no difference in sensitivity and negative predictive value (NPV) (p > 0.05) (Table 5).
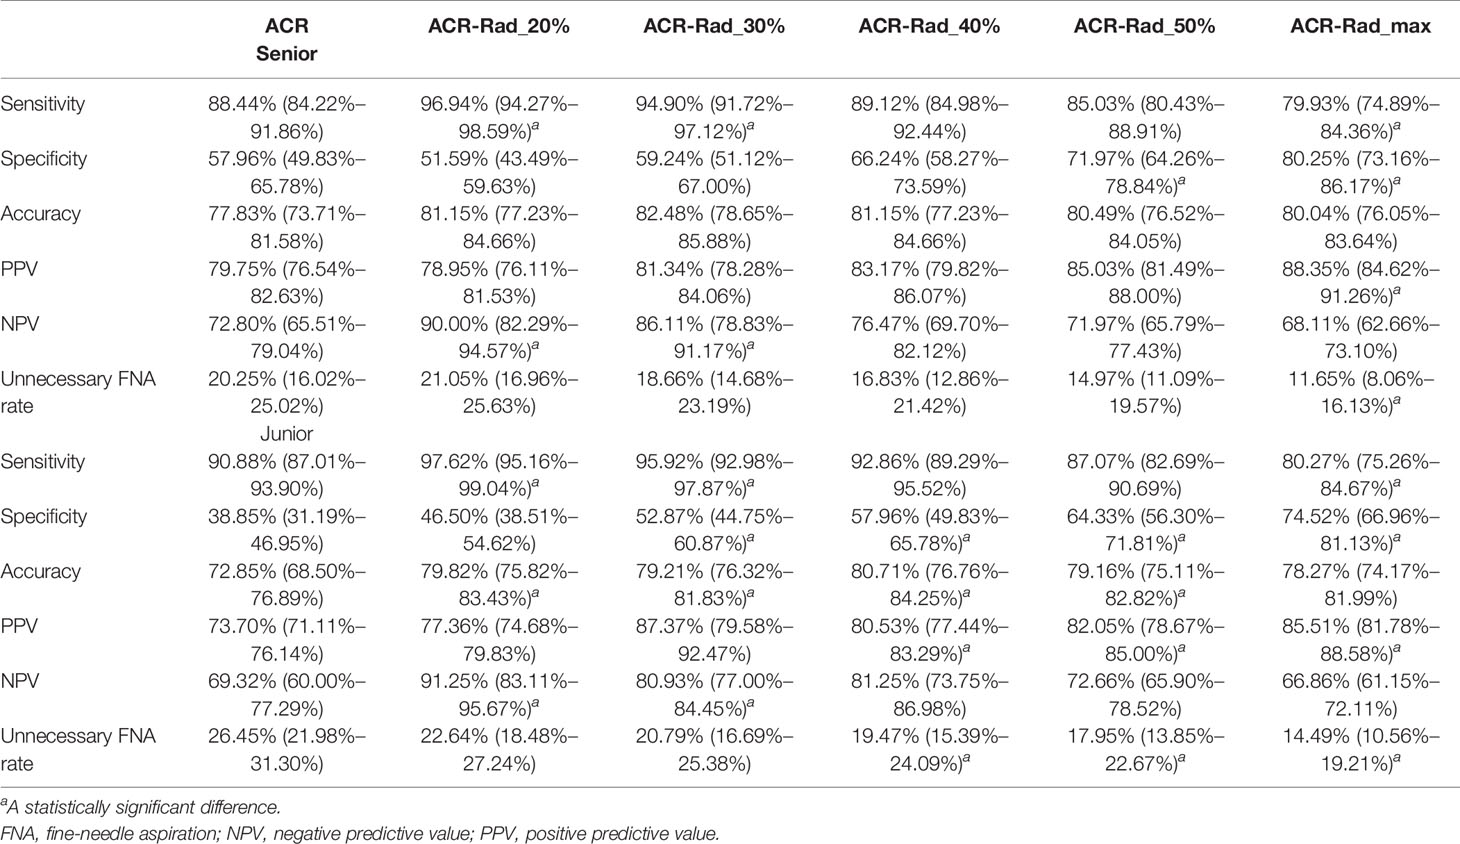
Table 5 Diagnostic performance and unnecessary FNA rates of ACR TI-RADS and risk cutoff values for the ACR-Rad nomogram.
Discussion
In this study, we proved that BMUS radiomics and the ACR-Rad nomogram based on it and ACR TI-RADS can accurately predict malignancy in thyroid nodules, and the nomogram showed significantly better discrimination and calibration performance than the guideline alone. Excellent repeatability and clinical application of the nomogram were demonstrated in the entire cohort. With performing with 50% risk cutoff, the nomogram increased the specificity, accuracy, and PPV and decreased the unnecessary FNA rates of ACR TI-RADS for radiologists of different proficiency levels.
Predicting malignant thyroid nodules and reduction in the number of meaningless biopsies are original intentions of many guidelines that the ACR TI-RADS can meet. The ACR guideline assigns points to the five feature categories of BMUS. The sum of the points is used to determine the probability of malignancy and provides recommended management procedures (16). However, the clinical application of the ACR guideline is strongly subjective (6, 13, 14). Hoang et al. (6) found that when the judgment of composition was wrong, malignant nodules would be misclassified. Although the ACR risk stratification system is fault-tolerant, in our study, the interobserver agreement was unsatisfactory (ICC = 0.677) and lower than that of the Rad-Score and risk prediction value of the nomogram (ICC = 0.901 and 0.844, respectively). The reason may be due to weaker judgment of the junior radiologist in scoring spongiform, very hypoechoic and ill defined. Furthermore, the specificity of the ACR TI-RADS is weak (38.85%–57.96% in our study).
Previous studies have reported that combining clinical characteristics (such as age, thyrotropin, or sex) with ultrasound features (such as ACR TI-RADS lexicon, hypoechoic halo, or blood flow) slightly increased the accuracy of these models in discriminating malignant nodules from benign nodules than risk stratification systems (23, 24). However, the abovementioned clinical characteristics in the study of Liang et al. (13) were not significantly different. In our study, there was no significant difference in the gender. Moreover, other subjective ultrasound features might make little contribution to solve current challenges.
With the recent development of radiomics, its application in predicting the malignancy of thyroid nodules has received attention. Previous studies reported that radiomics showed good performance in predicting thyroid cancer, which was even higher than the risk classification guidelines with interpretations from non-experts (13, 25, 26). In our study, both the ACR-Score and Rad-Score were independent predictive factors of malignant nodules, and the Rad-Score had favorable diagnostic performance in magnificent nodules. However, radiomics alone cannot improve the performance of the ACR TI-RADS for senior radiologists who are experienced to evaluate comprehensively ultrasound features correlated with properties of the nodules (15).
Park et al. (14) demonstrated that when combined with a 5% predicted malignancy risk cutoff of radiomics with the ACR or American Thyroid Association (ATA) guidelines, the performance significantly increased and unnecessary FNA rates reduced; in consequence, combining radiomics with ultrasound-based risk stratification systems is a potential approach to predict magnificent thyroid nodules. Luo et al. (27) constructed a nomogram including the Rad-Score and feature categories of the ACR TI-RADS and determined that a combination model was better than radiomics and the ACR TI-RADS alone for discriminating benign and malignant thyroid nodules. In our study, the ACR-Rad nomogram could be a more convenient tool to combine the ACR-Score and Rad-Score and a better predictive model for thyroid cancer. For senior and junior radiologists, the nomogram had significantly improved predictive performance in comparison with the ACR TI-RADS.
The radiomics model has not been sufficiently evaluated by prior studies, which were limited to comparisons of discrimination performance or only had senior radiologists assigned to score and delineate nodules (28, 29). Our study evaluated the repeatability, discrimination, and clinical utilization of the ACR-Rad nomogram applied by senior and junior radiologists, proving that there was strong consistency in processing nodule texture information and it significantly increased the predictive performance among radiologists of different proficiency levels, which can compensate for the relatively low repeatability and accuracy of ACR TI-RADS. Moreover, the appropriate cutoff of the ACR-Rad nomogram can significantly reduce unnecessary FNA rates, increase the specificity and PPV, and maintain the high sensitivity of the guideline especially for junior radiologists.
Our study had several limitations. First, this study was a single-center retrospective study; thus, selection bias may be inevitable. The proportion of benign nodules in this study was much lower than that in other studies (13–15), because we chose nodules with postoperative pathology instead of FNA or follow-up. Second, BMUS images were only acquired with Philips ultrasound instruments. We should investigate the influence from images of different ultrasound instruments. Third, on account of the overlap between the shape features and the ACR TI-RADS, we did not analyze them. The predictive performance of shape features should be explored further.
In conclusion, the ACR-Rad nomogram, combined with ACR TI-RADS and BMUS radiomics, has the potential to be a convenient and accurate tool to predict malignancy and improve performance for radiologists at different proficiency levels in thyroid nodules.
Data Availability Statement
The original contributions presented in the study are included in the article/Supplementary Material. Further inquiries can be directed to the corresponding author.
Ethics Statement
Ethical review and approval was not required for the study on human participants in accordance with the local legislation and institutional requirements. The requirement for informed consent was waived. Written informed consent was obtained from the individual(s) for the publication of any potentially identifiable images or data included in this article.
Author Contributions
XH performed the formal analysis, contributed to the methodology, administered the project, and wrote the original draft of the manuscript. ZW curated the data and collected the resources. AZ conceived the study and wrote and reviewed the manuscript. XM curated the data. QQ curated the data. CZ curated the data. SC curated the data. PX supervised the study and wrote, reviewed, and edited the manuscript. All authors contributed to the article and approved the submitted version.
Funding
This study was supported by “the key research and development projects of Jiangxi Province” (no. 20181BBG70031).
Conflict of Interest
The authors declare that the research was conducted in the absence of any commercial or financial relationships that could be construed as a potential conflict of interest.
Publisher’s Note
All claims expressed in this article are solely those of the authors and do not necessarily represent those of their affiliated organizations, or those of the publisher, the editors and the reviewers. Any product that may be evaluated in this article, or claim that may be made by its manufacturer, is not guaranteed or endorsed by the publisher.
Supplementary Material
The Supplementary Material for this article can be found online at: https://www.frontiersin.org/articles/10.3389/fonc.2021.737847/full#supplementary-material
References
1. Singh Ospina N, Iñiguez-Ariza NM, Castro MR. Thyroid Nodules: Diagnostic Evaluation Based on Thyroid Cancer Risk Assessment. BMJ (Clinical Res ed) (2020) 368:l6670. doi: 10.1136/bmj.l6670
2. Gharib H, Papini E, Garber JR, Duick DS, Harrell RM, Hegedüs L, et al. American Association of Clinical Endrocrinologist, American College of Endocrinoly, and Associazione Medici Endocrinologi Medical Guidelines for Clinical Practice for the Diagnosis and Management of Thyroid Nodules 2016 Update. Endocr Pract: Off J Am Coll Endocrinol Am Assoc Clin Endocrinologists (2016) 22(5):622–39. doi: 10.4158/ep161208.Gl
3. Haugen BR, Alexander EK, Bible KC, Doherty GM, Mandel SJ, Nikiforov YE, et al. 2015 American Thyroid Association Management Guidelines for Adult Patients With Thyroid Nodules and Differentiated Thyroid Cancer: The American Thyroid Association Guidelines Task Force on Thyroid Nodules and Differentiated Thyroid Cancer. Thyroid: Off J Am Thyroid Assoc (2016) 26(1):1–133. doi: 10.1089/thy.2015.0020
4. Hoang JK, Lee WK, Lee M, Johnson D, Farrell S. US Features of Thyroid Malignancy: Pearls and Pitfalls. Radiographics: Rev Publ Radiol Soc North Am Inc (2007) 27(3):847–60. doi: 10.1148/rg.273065038
5. Russ G, Bonnema SJ, Erdogan MF, Durante C, Ngu R, Leenhardt L. European Thyroid Association Guidelines for Ultrasound Malignancy Risk Stratification of Thyroid Nodules in Adults: The EU-TIRADS. Eur Thyroid J (2017) 6(5):225–37. doi: 10.1159/000478927
6. Hoang JK, Middleton WD, Farjat AE, Langer JE, Reading CC, Teefey SA, et al. Reduction in Thyroid Nodule Biopsies and Improved Accuracy With American College of Radiology Thyroid Imaging Reporting and Data System. Radiology (2018) 287(1):185–93. doi: 10.1148/radiol.2018172572
7. Ruan JL, Yang HY, Liu RB, Liang M, Han P, Xu XL, et al. Fine Needle Aspiration Biopsy Indications for Thyroid Nodules: Compare a Point-Based Risk Stratification System With a Pattern-Based Risk Stratification System. Eur Radiol (2019) 29(9):4871–8. doi: 10.1007/s00330-018-5992-z
8. Yoon JH, Lee HS, Kim EK, Moon HJ, Park VY, Kwak JY. Pattern-Based vs. Score-Based Guidelines Using Ultrasound Features Have Different Strengths in Risk Stratification of Thyroid Nodules. Eur Radiol (2020) 30(7):3793–802. doi: 10.1007/s00330-020-06722-y
9. Ha EJ, Na DG, Baek JH, Sung JY, Kim JH, Kang SY. US Fine-Needle Aspiration Biopsy for Thyroid Malignancy: Diagnostic Performance of Seven Society Guidelines Applied to 2000 Thyroid Nodules. Radiology (2018) 287(3):893–900. doi: 10.1148/radiol.2018171074
10. Gillies RJ, Kinahan PE, Hricak H. Radiomics: Images Are More Than Pictures, They Are Data. Radiology (2016) 278(2):563–77. doi: 10.1148/radiol.2015151169
11. Lambin P, Rios-Velazquez E, Leijenaar R, Carvalho S, van Stiphout RG, Granton P, et al. Radiomics: Extracting More Information From Medical Images Using Advanced Feature Analysis. Eur J Cancer (Oxford Engl: 1990) (2012) 48(4):441–6. doi: 10.1016/j.ejca.2011.11.036
12. Jiang M, Li C, Tang S, Lv W, Yi A, Wang B, et al. Nomogram Based on Shear-Wave Elastography Radiomics Can Improve Preoperative Cervical Lymph Node Staging for Papillary Thyroid Carcinoma. Thyroid: Off J Am Thyroid Assoc (2020) 30(6):885–97. doi: 10.1089/thy.2019.0780
13. Liang J, Huang X, Hu H, Liu Y, Zhou Q, Cao Q, et al. Predicting Malignancy in Thyroid Nodules: Radiomics Score Versus 2017 American College of Radiology Thyroid Imaging, Reporting and Data System. Thyroid: Off J Am Thyroid Assoc (2018) 28(8):1024–33. doi: 10.1089/thy.2017.0525
14. Park VY, Lee E, Lee HS, Kim HJ, Yoon J, Son J, et al. Combining Radiomics With Ultrasound-Based Risk Stratification Systems for Thyroid Nodules: An Approach for Improving Performance. Eur Radiol (2021) 31(4):2405–13. doi: 10.1007/s00330-020-07365-9
15. Zhao CK, Ren TT, Yin YF, Shi H, Wang HX, Zhou BY, et al. A Comparative Analysis of Two Machine Learning-Based Diagnostic Patterns With Thyroid Imaging Reporting and Data System for Thyroid Nodules: Diagnostic Performance and Unnecessary Biopsy Rate. Thyroid: Off J Am Thyroid Assoc (2021) 31(3):470–81. doi: 10.1089/thy.2020.0305
16. Tessler FN, Middleton WD, Grant EG, Hoang JK, Berland LL, Teefey SA, et al. ACR Thyroid Imaging, Reporting and Data System (TI-RADS): White Paper of the ACR TI-RADS Committee. J Am Coll Radiol: JACR (2017) 14(5):587–95. doi: 10.1016/j.jacr.2017.01.046
17. Fedorov A, Beichel R, Kalpathy-Cramer J, Finet J, Fillion-Robin JC, Pujol S, et al. 3d Slicer as an Image Computing Platform for the Quantitative Imaging Network. Magn Reson Imaging (2012) 30(9):1323–41. doi: 10.1016/j.mri.2012.05.001
18. Yip SSF, Parmar C, Blezek D, Estepar RSJ, Pieper S, Kim J, et al. Application of the 3D Slicer Chest Imaging Platform Segmentation Algorithm for Large Lung Nodule Delineation. PloS One (2017) 12(6):e0178944. doi: 10.1371/journal.pone.0178944
19. van Griethuysen JJM, Fedorov A, Parmar C, Hosny A, Aucoin N, Narayan V, et al. Computational Radiomics System to Decode the Radiographic Phenotype. Cancer Res (2017) 77(21):e104–7. doi: 10.1158/0008-5472.Can-17-0339
20. Huang YQ, Liang CH, He L, Tian J, Liang CS, Chen X, et al. Development and Validation of a Radiomics Nomogram for Preoperative Prediction of Lymph Node Metastasis in Colorectal Cancer. J Clin Oncol: Off J Am Soc Clin Oncol (2016) 34(18):2157–64. doi: 10.1200/jco.2015.65.9128
21. Li Y, Hong HG, Ahmed SE, Li Y. Weak Signals in High-Dimension Regression: Detection, Estimation and Prediction. Appl Stochastic Models business Industry (2019) 35(2):283–98. doi: 10.1002/asmb.2340
22. Kramer AA, Zimmerman JE. Assessing the Calibration of Mortality Benchmarks in Critical Care: The Hosmer-Lemeshow Test Revisited. Crit Care Med (2007) 35(9):2052–6. doi: 10.1097/01.Ccm.0000275267.64078.B0
23. Maia FF, Matos PS, Silva BP, Pallone AT, Pavin EJ, Vassallo J, et al. Role of Ultrasound, Clinical and Scintigraphyc Parameters to Predict Malignancy in Thyroid Nodule. Head Neck Oncol (2011) 3:17. doi: 10.1186/1758-3284-3-17
24. Xia J, Chen H, Li Q, Zhou M, Chen L, Cai Z, et al. Ultrasound-Based Differentiation of Malignant and Benign Thyroid Nodules: An Extreme Learning Machine Approach. Comput Methods Programs Biomed (2017) 147:37–49. doi: 10.1016/j.cmpb.2017.06.005
25. Bhatia KS, Lam AC, Pang SW, Wang D, Ahuja AT. Feasibility Study of Texture Analysis Using Ultrasound Shear Wave Elastography to Predict Malignancy in Thyroid Nodules. Ultrasound Med Biol (2016) 42(7):1671–80. doi: 10.1016/j.ultrasmedbio.2016.01.013
26. Nam SJ, Yoo J, Lee HS, Kim EK, Moon HJ, Yoon JH, et al. Quantitative Evaluation for Differentiating Malignant and Benign Thyroid Nodules Using Histogram Analysis of Grayscale Sonograms. J Ultrasound Med: Off J Am Inst Ultrasound Med (2016) 35(4):775–82. doi: 10.7863/ultra.15.05055
27. Luo P, Fang Z, Zhang P, Yang Y, Zhang H, Su L, et al. Radiomics Score Combined With ACR TI-RADS in Discriminating Benign and Malignant Thyroid Nodules Based on Ultrasound Images: A Retrospective Study. Diagn (Basel Switzerland) (2021) 11(6):1–12. doi: 10.3390/diagnostics11061011
28. Galimzianova A, Siebert SM, Kamaya A, Rubin DL, Desser TS. Quantitative Framework for Risk Stratification of Thyroid Nodules With Ultrasound: A Step Toward Automated Triage of Thyroid Cancer. AJR Am J Roentgenology (2020) 214(4):885–92. doi: 10.2214/ajr.19.21350
Keywords: thyroid nodule, radiomics, nomogram, ultrasound, prediction
Citation: Huang X, Wu Z, Zhou A, Min X, Qi Q, Zhang C, Chen S and Xu P (2021) Nomogram Combining Radiomics With the American College of Radiology Thyroid Imaging Reporting and Data System Can Improve Predictive Performance for Malignant Thyroid Nodules. Front. Oncol. 11:737847. doi: 10.3389/fonc.2021.737847
Received: 07 July 2021; Accepted: 21 September 2021;
Published: 13 October 2021.
Edited by:
Giorgio Russo, Institute of Bioimaging and Molecular Physiology (CNR), ItalyReviewed by:
Richa Vaish, Tata Memorial Hospital, IndiaChen Liu, Army Medical University, China
Yanbing Li, First Affiliated Hospital of Sun Yat-sen University, China
Copyright © 2021 Huang, Wu, Zhou, Min, Qi, Zhang, Chen and Xu. This is an open-access article distributed under the terms of the Creative Commons Attribution License (CC BY). The use, distribution or reproduction in other forums is permitted, provided the original author(s) and the copyright owner(s) are credited and that the original publication in this journal is cited, in accordance with accepted academic practice. No use, distribution or reproduction is permitted which does not comply with these terms.
*Correspondence: Pan Xu, eHVwYW5fMTk4OUAxMjYuY29t
†These authors have contributed equally to this work and share first authorship
 Xingzhi Huang1†
 Pan Xu