 Ashok K. Pullikuth1
 Eric D. Routh1,2
 Kip D. Zimmerman3
 Julia Chifman1,4
 Jeff W. Chou5,6
 Michael H. Soike7
 Guangxu Jin1,6
 Jing Su5,8
 Qianqian Song1,9
 Michael A. Black10
 Cristin Print11
 Davide Bedognetti12
 Marissa Howard-McNatt13Stacey S. O’Neill6,14Alexandra Thomas6,15Carl D. Langefeld5,6
 Alexander B. Sigalov16
 Yong Lu 6,17and
  Lance D. Miller1,6*
- 1Department of Cancer Biology, Wake Forest School of Medicine, Winston Salem, NC, United States
- 2Lineberger Comprehensive Cancer Center, University of North Carolina at Chapel Hill, Chapel Hill, NC, United States
- 3Center for Precision Medicine, Wake Forest School of Medicine, Winston Salem, NC, United States
- 4Department of Mathematics and Statistics, American University, Washington, DC, United States
- 5Department of Biostatistics and Data Science, Wake Forest School of Medicine, Winston Salem, NC, United States
- 6The Comprehensive Cancer Center of Wake Forest University, Winston Salem, NC, United States
- 7Department of Radiation Oncology, University of Alabama-Birmingham, Birmingham, AL, United States
- 8Department of Biostatistics and Health Data Science, Indiana University School of Medicine, Indianapolis, IN, United States
- 9Center for Cancer Genomics and Precision Oncology, Wake Forest School of Medicine, Winston Salem, NC, United States
- 10Department of Biochemistry, Otago School of Medical Sciences, University of Otago, Dunedin, New Zealand
- 11Department of Molecular Medicine and Pathology and Maurice Wilkins Institute, Faculty of Medical and Health Sciences, The University of Auckland, Auckland, New Zealand
- 12Cancer Program, Sidra Medicine, Doha, Qatar & Department of Internal Medicine and Medical Specialties, University of Genoa, Genoa, Italy
- 13Surgical Oncology Service, Department of Surgery, Wake Forest School of Medicine, Winston Salem, NC, United States
- 14Department of Pathology, Wake Forest School of Medicine, Winston Salem, NC, United States
- 15Section of Hematology and Oncology, Department of Internal Medicine, Wake Forest Baptist Medical Center, Winston Salem, NC, United States
- 16 SignaBlok, Inc. Shrewsbury, MA, United States
- 17Department of Microbiology & Immunology, Wake Forest School of Medicine, Winston Salem, NC, United States
Background: Triggering receptor expressed on myeloid cells (TREM)-1 is a key mediator of innate immunity previously associated with the severity of inflammatory disorders, and more recently, the inferior survival of lung and liver cancer patients. Here, we investigated the prognostic impact and immunological correlates of TREM1 expression in breast tumors.
Methods: Breast tumor microarray and RNAseq expression profiles (n=4,364 tumors) were analyzed for associations between gene expression, tumor immune subtypes, distant metastasis-free survival (DMFS) and clinical response to neoadjuvant chemotherapy (NAC). Single-cell (sc)RNAseq was performed using the 10X Genomics platform. Statistical associations were assessed by logistic regression, Cox regression, Kaplan-Meier analysis, Spearman correlation, Student’s t-test and Chi-square test.
Results: In pre-treatment biopsies, TREM1 and known TREM-1 inducible cytokines (IL1B, IL8) were discovered by a statistical ranking procedure as top genes for which high expression was associated with reduced response to NAC, but only in the context of immunologically “hot” tumors otherwise associated with a high NAC response rate. In surgical specimens, TREM1 expression varied among tumor molecular subtypes, with highest expression in the more aggressive subtypes (Basal-like, HER2-E). High TREM1 significantly and reproducibly associated with inferior distant metastasis-free survival (DMFS), independent of conventional prognostic markers. Notably, the association between high TREM1 and inferior DMFS was most prominent in the subset of immunogenic tumors that exhibited the immunologically hot phenotype and otherwise associated with superior DMFS. Further observations from bulk and single-cell RNAseq analyses indicated that TREM1 expression was significantly enriched in polymorphonuclear myeloid-derived suppressor cells (PMN-MDSCs) and M2-like macrophages, and correlated with downstream transcriptional targets of TREM-1 (IL8, IL-1B, IL6, MCP-1, SPP1, IL1RN, INHBA) which have been previously associated with pro-tumorigenic and immunosuppressive functions.
Conclusions: Together, these findings indicate that increased TREM1 expression is prognostic of inferior breast cancer outcomes and may contribute to myeloid-mediated breast cancer progression and immune suppression.
Introduction
The clinical behavior of cancer can be influenced by the composition and functional orientation of pro- and anti-tumor immune mediators within the tumor microenvironment (TME) (1, 2). In the TME and nearby lymphoid structures, tumor-reactive immune cells that favor tumor destruction (ie, cytotoxic T cells (CTLs), Natural Killer (NK) cells, T-helper (Th) and dendritic cells (DC)) can act to slow cancer growth and spread, and contribute directly to favorable therapeutic responses. However, this protective immunity is frequently counter-balanced by suppressive immune cell populations, such as myeloid-derived suppressor cells (MDSCs), regulatory T-cells (TREGs) and tumor associated macrophages (TAMs) that favor immunosuppression and immune escape (2, 3). Furthermore, paracrine signaling cascades initiated by cytokines and growth factors produced by the latter cell types can also directly promote cancer cell growth, survival, and metastasis, thereby contributing directly to tumor progression (4).
Genome-wide gene expression profiling studies in solid tumors have provided context for understanding how complex multicellular immune interactions impact tumor aggressiveness (5–7). Recent reports by us and others have described immune gene signatures in breast tumors that comprise genes with specialized roles in immuno-biology, and that quantify the relative abundance and functional properties of distinct tumor-infiltrating leukocyte populations (8–12). Significantly, these immune gene signatures have been shown to correlate with patient survival outcomes (8, 13, 14), chemotherapy responsiveness (13, 15), and more recently, response to immunotherapies (16–18). Prognostic and therapy-predictive signatures identified to date constitute a diverse genetic fingerprint of innate and adaptive immunity, inclusive of B cells, T cells, DCs, CTLs, NK cells, macrophages, neutrophils, and mast cells (5, 6, 10, 19). Yet, what these signatures reveal about specific immune-regulatory mechanisms operative in the TME remains largely unknown.
In previous reports, we demonstrated that the significant associations between breast tumor immune subclasses (defined by effector immune gene signatures) and patient clinical outcomes was strongly dependent on cancer-intrinsic properties such as tumor proliferation rate and mutational burden (8, 14, 20), thereby implicating these phenotypes in immune-mediated breast cancer outcomes. These observations prompted us to use logistic regression to identify specific genes that may antagonize otherwise favorable immune-mediated outcomes, as such genes could hold promise as novel immunotherapeutic targets. Herein, we describe the discovery and characterization of one such candidate, the gene encoding Triggering Receptor Expressed on Myeloid Cells (TREM)-1, which emerged as a robust therapy-predictive and prognostic marker by unsupervised analyses in large expression profiling data sets. TREM1 encodes a type I transmembrane receptor of the Ig superfamily expressed by effectors of innate immunity including neutrophils, monocytes and macrophages. The TREM-1 receptor is known to augment inflammatory signaling in response to infectious pathogens by promoting release of cytokines that modulate the activation, recruitment and survival of myeloid and lymphoid cells (21, 22), yet its function in cancer remains unclear.
In this report, we provide the first evidence that TREM1 expression in breast tumors has negative prognostic and therapy-predictive implications for breast cancer patients, and that TREM1 expression is mediated predominantly by breast tumor-infiltrating myeloid cells that may constitute a cell population that antagonizes anti-tumor immunity. Our findings raise the possibility that the targeting of TREM-1 signaling in breast tumors may represent a viable immunotherapeutic strategy.
Materials and Methods
Gene Expression Datasets
Gene expression profiles of breast tumors and monocytes were obtained from MIAME-compliant studies (23) that followed Institutional Review Board (IRB)-approved protocols. The assembly, normalization and clinical annotation of the MDACC-701 gene expression dataset has been described previously (15). Briefly, this data set consists of Affymetrix U133A microarray gene expression profiles of 701 breast tumor biopsies (acquired prior to administration of neoadjuvant chemotherapy) and corresponding clinical drug response annotation. Compilation of normalized gene expression data and clinical annotations constituting the breast tumor meta-cohort #1 (MC1) data set has been described previously (8, 20). Briefly, the MC1 data set consists of 1,954 patient samples and corresponding clinical annotations. Expression data were generated using the U133 series GeneChip microarray platform (Affymetrix) containing 22,268 probe sets common to U133A, U133A2 and U133 PLUS 2.0 array platforms. MC1 represents independent cohorts from 16 medical centers in the United States, Europe and Asia. The meta-cohort #2 (MC2) data set includes 616 breast tumor expression profiles from patients in the United States, Asia, Europe and New Zealand. For both cohorts, raw data (CEL files) were downloaded from the NCBI’s Gene Expression Omnibus (GEO) data repository and processed as previously described (8, 20). MC1 and MC2 were analyzed on the same Affymetrix platform, and RMA-normalized and batch corrected using R software package from the Bioconductor project (8, 20). Molecular subtype calls were assigned to MC1 and MC2 cohorts according to Nagalla et al. (8). To identify gene expression changes downstream of TREM-1 activation, the Dower et al. gene expression dataset (24) comparing expression profiles of human peripheral blood monocytes with TREM-1 activation (induced by ligation with agonist antibody, n=11 patients) to those of matched control-treated monocytes (isotype antibody, n=11 patients) was analyzed. Affymetrix U133 PLUS 2.0 CEL files were downloaded from the GEO data repository (accession GSE9988) and RMA-normalized as described above. Differential expression analyses were conducted using Wilcoxon rank-sum test. Genes with Benjamini-Hochberg FDR-adjusted p-values < 0.01 were considered significant.
Tumor Immune Subclasses
FID, WID and PID (Favorable, Weak and Poor Immune Dispositions, respectively) are gene expression-based, tumor immune subclasses that reflect the continuum from immunologically “inflamed” (FID) to immune “cold” (PID) tumors (8, 20). The immune subclasses are based on the integration of scores for three distinct effector immune gene signatures, identified in a previous breast tumor study using the MC1 data set (8). These immune signatures reflect the relative abundance of tumor-infiltrating effector cells associated with cytolytic activity (T/NK signature; CD8+ T cells/NK cells), antigen presentation (M/D signature; myeloid/dendritic cells), and humoral immunity (B/P signature; B cells/plasma cells). Each immune signature is scored in tumors using the geometric mean of expression of a set of immune-specialized genes, and each signature was found to provide additive prognostic information in multivariable Cox regression models (8). Patients were assigned to immune subclasses as follows. For each of the three immune signatures, tumors were ranked into population tertiles according to their immune signature scores. Tumors with upper-tertile expression scores for all three signatures, simultaneously, are classified as FID; tumors with lowest-tertile expression scores for any one signature are classified as PID; and tumors with combined intermediate- and upper-tertile signature scores are classified as WID, as established previously (8, 20). Accordingly, patients with FID tumors were observed to experience significantly better distant metastasis-free survival than those with WID or PID tumors, while those with PID tumors experienced significantly worse survival than those with WID or FID tumors. In a similar vein, FID tumors (at biopsy) were found to exhibit a significantly higher rate of responsiveness to neoadjuvant chemotherapy as compared to WID or PID tumors, consistent with reports that breast tumors with elevated TIL at baseline show greater responsiveness to neoadjuvant chemotherapy (25, 26); while PID tumors showed a significantly poorer response to neoadjuvant treatment as compared to WID or FID tumors (15).
Analysis of Gene Interactions With Immune Subclasses and Chemotherapy Response
Logistic regression was used to identify genes with antagonistic interactions with the effect of FID, WID and PID immune subclasses on tumor response to neoadjuvant chemotherapy. The MDACC-701 data set was utilized, and the analysis was restricted to the most well detected genes defined as being the probe sets whose mean expression levels across tumors were greater than the median of the mean expression among genes (n=11,108 probe sets). Tumor response was defined as favorable (Pathologic Complete Response (pCR) or Residual Cancer Burden (RCB) score = 0 or 1) or unfavorable (RCB score = 2 or 3) as previously described for this data set (15). In the logistic regression model, covariates included tumor response (0, 1), immune subclass (FID, WID, PID), patient age (continuous) and expression profile of each microarray gene (MG, dichotomous (using median as cut point)), while the interaction between MG expression and immune subclass was defined as being the parameter of interest. The magnitude of an interaction was represented by the regression coefficient of the product term. The logistic regression was run in R, and a Wald test was used to evaluate the statistical significance of each coefficient in the model. The Wald test computes a Z statistic as the ratio of the square of the regression coefficient to the square of the standard error of the coefficient and then computes significance. The unadjusted significance of discovered genes ranged from P = 0.05 to P = 0.00005, and gene ontology enrichment analysis was used to identify significantly-associated biological processes in the top genes ranked by Z statistic (Z values ≤ -2.0).
Gene Ontology (GO) Term Enrichment
The DAVID Functional Annotation Tool (DAVID Bioinformatics Resources version 6.7, NIAID/NIH) (27) was used to study associations between gene sets and GO terms related to biological processes and pathways.
Survival Analyses
Molecular and clinical markers were analyzed as continuous or categorical variables for significant associations with DMFS by Cox proportional hazards regression (including multivariable models containing clinical and molecular covariates) and Kaplan-Meier analysis. GraphPad Prism, Sigmaplot 12.0 and the R package “survival” (v3.3-2) were used for these analyses, with DMFS endpoints defined as “no evidence of distant recurrence” (censored) or “clinical evidence of distant recurrence” (event), within 10 years of diagnosis.
Expression of TREM1-Associated Genes in Tissues and Various Cell Types
To compute tissue-specific gene enrichment scores, we used the procedure and data set described in Benita et al., (28) and the limma package of Bioconductor (29). Briefly, one compares each group to all others and computes the linear model coefficient for each pair, which is a measure of the difference between two groups. For each linear model coefficient, limma also computes an associated P value (Bonferroni-corrected P ≤ 0.05). Genes that are specific to one tissue subset will result in higher enrichment scores. Proportions of immune cell types in tumors of the MC1 data set were estimated from RNA transcripts according to the CIBERSORT method and the LM-22 gene matrix (547 genes that distinguish 22 human hematopoietic cell types) (19, 30). CIBERSORT employs a novel support vector regression (SVR) to deconvolve proportions of distinct cell types found within complex mixtures. The resultant cell proportion estimates were mean-centered and averaged within quartiles of TREM1 expression. The R package gplots was used to visualize the cell proportion averages by heat map (31, 32). Cell proportion estimates were analyzed by Spearman’s rank-ordered correlation for significant associations with TREM1 expression. TREM1 expression in The Cancer Genome Atlas (TCGA)-breast cancer (BRCA) database was analyzed by TIMER (cistrome.org/TIMER/) (33) for significant correlations between TREM1, downstream target genes and markers of myeloid cell populations. The whole dataset (Breast Invasive Carcinoma; n = 1,093) and the Basal-like tumors (BRCA-Basal; n = 139) were utilized.
Histological Analysis of TREM-1 and CD68 in Breast Tumor Specimens
Human breast tumor tissue microarrays consisting of a variety of invasive ductal and lobular carcinomas were fabricated in-house by the Wake Forest Baptist Comprehensive Cancer Center’s Tumor Tissue and Pathology Shared Resource and used in immunofluorescence staining studies as follows. Formalin-fixed paraffin-embedded (FFPE) sections (5 μm) on slides were deparaffinized, antigen retrieved with sodium citrate method, blocked with 2.5% heat-inactivated horse serum, and incubated with polyclonal goat anti-TREM-1 antibody (ab) (1:50; R&D systems #AF1278) and mouse anti-CD68 (pan-myeloid) monoclonal ab (1:100; DAKO #2015-08, Clone KP1) in a humid chamber overnight at 4°C. After washing with PBS-T (PBS with 0.05% Tween-20), sections were incubated with rabbit anti-goat-Alexa 546 (1:200; Invitrogen) and goat anti-mouse Alexa 488 (1:250; Invitrogen) for 2 hours at room temperature in a humid chamber. After rinsing with PBS-T, sections were stained with DAPI or DRAQ5 (1:1000, 5μM, Cell Signaling) for 30 min, rinsed and mounted in Prolong anti-fade (Invitrogen) or FluoroShield (Sigma). Negative control and isotype matched mouse IgG1 (DAKO # 2015-07) were used to confirm staining specificity. Slides were imaged on an Olympus VS-110 Virtual Microscopy System at the Wake Forest School of Medicine Virtual Microscopy Core Facility.
Single-Cell RNAseq Analysis
Remnant surgical tissue from an AJCC stage III triple negative invasive ductal carcinoma resected at Wake Forest Baptist Medical Center (WFBMC) in Winston Salem, NC, was accessed via Wake Forest University Health Sciences Institutional Review Board protocol IRB00048977. Fresh tumor tissue was minced by razor blade into ~1 mm pieces and digested for 1 hr at 37°C with Human Dissociation Kit (Miltenyi Biotec, Auburn, CA) as per manufacturer’s instruction with the aid of gentleMACS Octo Dissociator fitted with heating collar (Miltenyi Biotec). Digested tissue was passed through a 70 µm strainer, washed and resuspended in RPMI plus 10% fetal bovine serum (FBS), then underlaid with Histopaque-1077 (Sigma-Aldrich) and centrifuged at 400 x g for 30 min. The resulting buffy coat was harvested and washed in RPMI plus 10% FBS, resuspended in the same media, and counted. Approximately 1 million cells were frozen in 90% FBS/10% DMSO. A single-cell cDNA library was generated from thawed cells exhibiting >80% viability using the 10X Genomics Chromium Controller (34) maintained by the Wake Forest Baptist Comprehensive Cancer Center’s Cancer Genomics Shared Resource. Indexed libraries were paired-end sequenced using an Illumina NextSeq 500 at an average read depth of 173,842 mapped reads per cell (n = 770 cells). Raw bcl and fastq data were demultiplexed, mapped to the GRCh38 human reference genome, and post-processed using Cell Ranger (10X Genomics) mkfastq pipelines and QC algorithms. Processed data files have been deposited in the Gene Expression Omnibus (GEO; www.ncbi.nlm. nih.gov/geo/) and can be accessed through GEO Series accession number GSE188600. Cells that expressed less than 400 genes or that contained mitochondrial reads comprising >20% of their total count of unique molecular identifiers were excluded. T-distributed stochastic neighbor embedding (t-SNE) (35) was used to reduce data dimensionality and cluster cells based on gene expression patterns. In accordance with the Cell Ranger R software, the statistical significance of genes differentially expressed between cell clusters or identified cell populations was assessed by negative binomial exact test [for genes with low counts, based on sSeq method (36)] and fast asymptotic beta test [for genes with high counts, edgeR method (37)]. Genes with Benjamini-Hochberg FDR-adjusted p-values < 0.01 were considered significant. A linear normalized expression value threshold > 0 was used to identify cells positive for TREM1 expression or expression of other marker genes studied.
In parallel, we analyzed a publicly available single cell RNAseq dataset (the Bassez et al. dataset) that profiled 175,942 cells from 31 treatment-naïve primary breast tumors (European Genome-phenome Archive (EGA) accession no. EGAS00001004809). Consistent with the analysis of the TNBC specimen from WFBMC, this study also utilized the 10X Genomics Chromium system for single cell library production, followed by Illumina sequencing (NextSeq 500 and NovaSeq 6000 platforms), and utilized Cell Ranger data processing workflows and similar quality control filters for cell selection (38). Analysis of the Bassez et al. dataset was facilitated by the BioTuring BBrowser and associated analytical tools (39) and the Seurat v3 R toolkit (40).
Results
TREM1 Expression Antagonizes Favorable Immune-Associated Chemotherapy Responses
To identify genes with potential to antagonize anti-tumor immunity, we investigated breast tumor immune subclasses predictive of neoadjuvant chemotherapy response. Previous studies have shown that the abundance of tumor infiltrating lymphocytes in breast tumors is predictive of chemotherapy response in the neoadjuvant setting (41, 42). In earlier studies we identified three breast tumor immune gene signatures that reflect the relative abundance of tumor-infiltrating effector cell populations associated with cytolytic activity (T/NK signature), antigen presentation (M/D signature) and humoral immunity (B/P signature), each with independent prognostic power (8). These signatures allowed discernment of three tumor immune subclasses, termed FID, WID and PID (i.e., Favorable, Weak and Poor Immune Dispositions, respectively), that reflect the continuum from immunologically “inflamed” (FID) to immune “cold” (PID) tumors (see Materials and Methods). These subclasses were reported previously to differ significantly in terms of patient survival (8, 14, 20) and response to neoadjuvant chemotherapy (15) with FID tumors associating with more favorable clinical outcomes as compared to PID tumors, consistent with protective anti-tumor immunity being associated with FID status. To discover genes expressed in the TME that antagonize immune-mediated protective effects, we utilized a retrospective microarray dataset, MDACC-701 (15), consisting of 701 breast tumor expression profiles from core or needle biopsies taken from patients prior to neoadjuvant chemotherapy. In this data set, the FID immune subclass was found to identify patients with a significantly higher chemotherapy response rate as compared to WID or PID tumors. Using logistic regression (see Materials and Methods), we ranked genes from the MDACC-701 dataset based on the magnitude of antagonistic interaction, where higher gene expression in the FID immune subclass tumors was associated with a decrease in favorable chemotherapy response. Ranking genes by Z statistic, we identified 195 genes (207 probe sets) with interaction Z values ≤ -2.0 (see Supplemental Table 1), and analyzed these genes for significant enrichment of Gene Ontology (GO) terms. The one significant biological process identified was Neutrophil Chemotaxis (univariate P = 5.8x10⁻⁵, Benjamini-Hochberg adjusted P = 0.06) which was supported by 7 genes. Among these genes, the most significant by Z statistic was TREM1 [ranked #6 overall for negative Z value (Z = -3.3, P = 0.001, Wald test)]. Moreover, included among the seven genes were the two well-characterized TREM-1 target genes, IL1B and CXCL8 (IL8), both of which showed a highly significant positive correlation with TREM1 expression in the MDACC-701 dataset (Pearson and Spearman correlations >0.6; see Supplemental Figure 1).
TREM-1 is a type-1 cell surface receptor expressed on cells of myeloid origin that triggers the transcriptional activation of numerous cytokines and chemokines in response to inflammatory signals, such as pathogen- and damage-associated molecular patterns (43). Moreover, TREM-1 was recently shown to inhibit anti-tumor immunity in a model of hepatocellular carcinoma (44). To further examine the relationship between TREM1 expression and the therapy-predictive power of the immune subclasses, we stratified patients first according to subclass (FID, WID or PID), and then according to low or high TREM1 expression (Figure 1A). We observed that the higher frequency of favorable response in FID tumors was dependent on low TREM1 expression. Specifically, the frequency of favorable response was 1.9-fold higher in TREM1-low FID tumors as compared to TREM1-high FID tumors (P = 0.005, Chi-square test), while no difference in response was observed among WID or PID tumors in the context of TREM1 low or high status (Figure 1B).
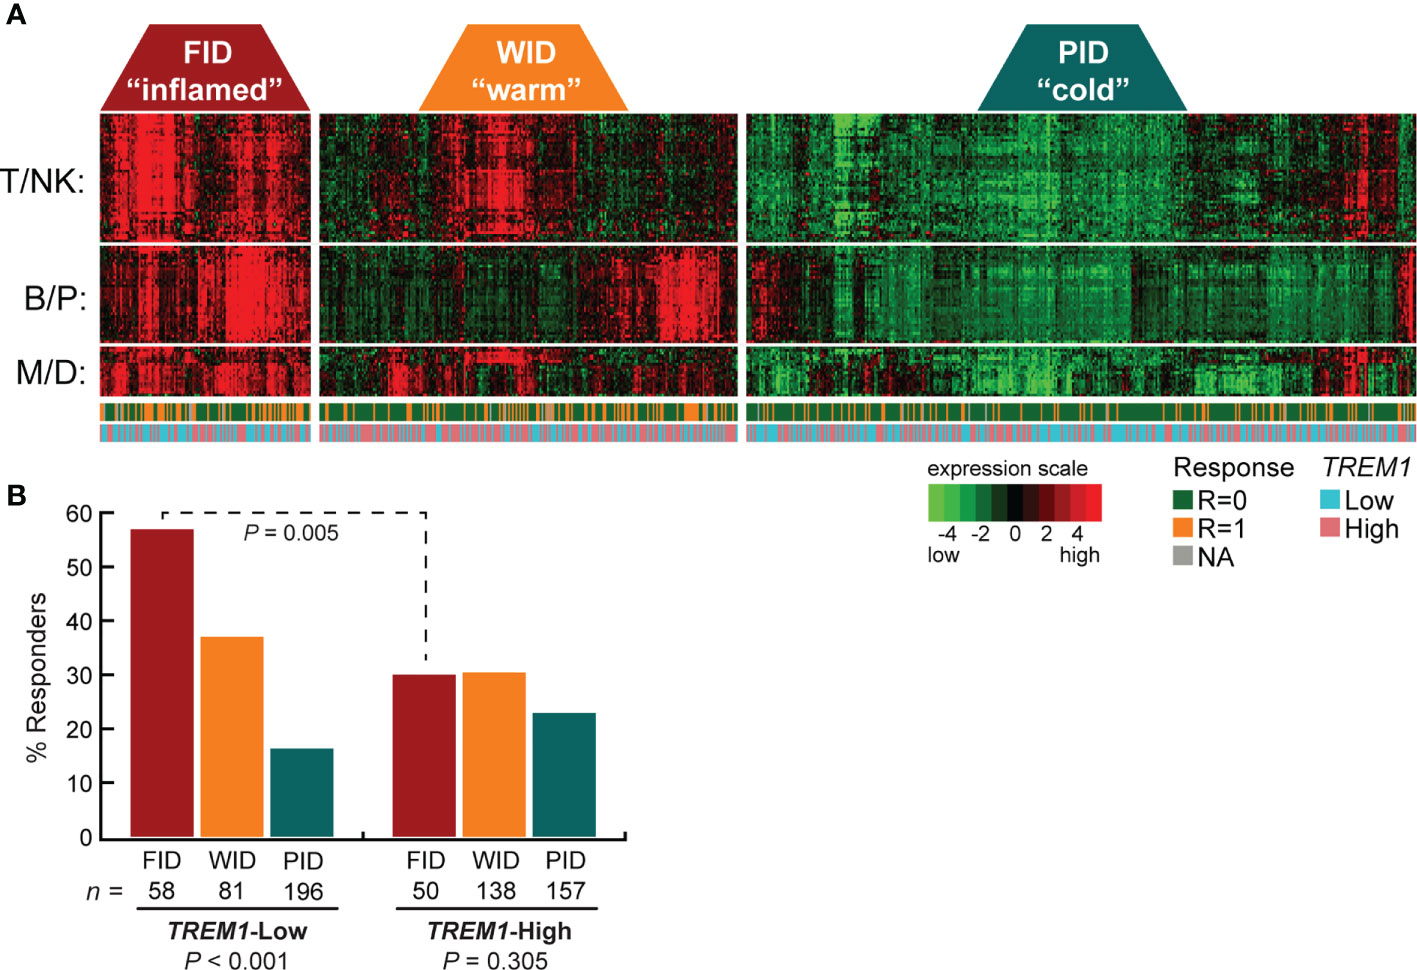
Figure 1 High TREM1 expression in breast tumor biopsies associates with reduced efficacy of neoadjuvant chemotherapy in tumors with high effector immune infiltrates. The breast tumor biopsy expression profiling data set of Alistar et al. (15) was used to evaluate interactions between TREM1 expression and neoadjuvant chemotherapy response within immune subclasses. (A) Heatmap of the genes comprising the T/NK (T cell/NK cell), B/P (B-cell/Plasma cell), and M/D (Myeloid/Dendritic cell) gene signatures are shown for tumors classified into the FID, WID and PID immune subclasses (see Materials and Methods for additional details). Tumor response to neoadjuvant chemotherapy (1 = responder, 0 = nonresponder) and tumor TREM1 expression level (Low = below median, High = above median) are indicated beneath the heatmap. (B) The fraction of chemotherapy-responsive tumors (Y-axis) is shown for each immune subclass as a function of low or high TREM1 (X-axis). Chemotherapy response rates were compared across immune subclasses (within low or high TREM1 groups) and within immune subclasses (across low and high TREM1 groups) by Chi-square test with Yates correction. Only the FID subclass exhibited a difference in chemotherapy response across TREM1 low and high tumors (P = 0.005).
High TREM1 Expression Predicts Inferior Distant Metastasis-Free Survival (DMFS)
To examine the association between TREM1 expression and patient prognosis, we utilized a multi-institutional data set (Meta-Cohort 1 (MC1)) consisting of 1,954 breast tumor expression profiles characterized on the Affymetrix U133 platform and annotated for distant metastasis-free survival, molecular subtype, and other clinical and demographic features (8, 45). First, we subdivided the MC1 cohort into two evaluation cohorts (termed 977A and 977B, respectively) by randomizing the tumor expression profiles equally into two cohorts. Cox regression analysis was performed for each gene and within each evaluation cohort to identify genes with significant associations with DMFS. Genes significantly associated with DMFS (P < 0.1, Benjamini-Hochberg) in 977A (n = 3,094) and 977B (n = 3,304) were then used as input for hierarchical clustering of samples and genes (Supplemental Figures 2A, B). Previously reported prognostic gene clusters were identified, including a cluster of inferior outcome-associated, proliferation-related genes that mirror cancer proliferative capacity (8) and several correlated clusters of immune-specialized genes that reflect infiltrating B cells, T cells and dendritic cells and associate with good survival outcomes (8). TREM1 was found to be significantly inversely associated with DMFS in both 977A and 977B, and reproducibly clustered together with a set of co-expressed inferior outcome-associated genes enriched for myeloid cell functions including SPP1, IL8 (CXCL8), INHBA, GREM1, PLAU, PLAUR, AQP9, ADM, HPSE, and CTSL1. Among the genes of this cluster, TREM1 was found to have the most statistically significant association with inferior DMFS in both the 977A and 977B data sets (P = 5.3x10⁻⁶ and P = 1.6x10⁻⁴, respectively) (Supplemental Figure 2C). To further study this association, patients from the full MC1 cohort were stratified into quartiles based on TREM1 expression levels, and the quartiles were examined by Kaplan-Meier analysis. Patients whose tumors ranked in the highest quartile of TREM1 (Q4) experienced poorer DMFS as compared to those ranked in lower quartiles (P = 2.5x10⁻¹¹, log-rank test), with progressively worse DMFS observed for each increment of TREM1 quartile (Figure 2A). This observation was reproducible in an independent breast cancer data set, Meta-Cohort 2 (MC2), consisting of 616 patients whose tumors were also profiled on the Affymetrix U133 platform (8, 20) (P = 3.1x10-03; Figure 2B). Analysis of molecular subtypes showed that the highest quartile of TREM1 expression (Q4) contained proportionally more Basal-like, Claudin-low and HER2E tumors, and fewer Luminal A (LumA) and Normal-like tumors, as compared to the lowest quartile (Q1) (Figures 2C, D). However, TREM1 expression distributions only showed moderate variation between different molecular subtypes, with decreased expression of TREM1 observed in LumA and Normal-like tumors, in particular (Figures 2E, F). Notably, we observed that TREM1 expression associated with poorer DMFS within certain clinical and molecular subtypes. By univariate Cox regression analysis (Table 1), TREM1 was associated with DMFS in both estrogen receptor positive (ER+) and negative (ER-) breast cancers, as well as lymph node positive (LN+) and negative (LN-) disease. Within molecular subtypes, TREM1 levels showed significant associations with DMFS in Basal-like, Luminal B (LumB) and Luminal A (LumA) tumor subtypes. We further examined the prognostic relevance of TREM1 by adjusting for conventional variables in multivariable Cox models (Table 2). As a continuous variable, TREM1 expression was associated with poorer DMFS, univariately (P = 1.9x10⁻¹³), as well as in the multivariable model (P = 3.2x10-05), where it remained significant in the presence of molecular subtype, immune subclass, histologic grade, tumor size, lymph node status, ER status, patient age, and treatment status.
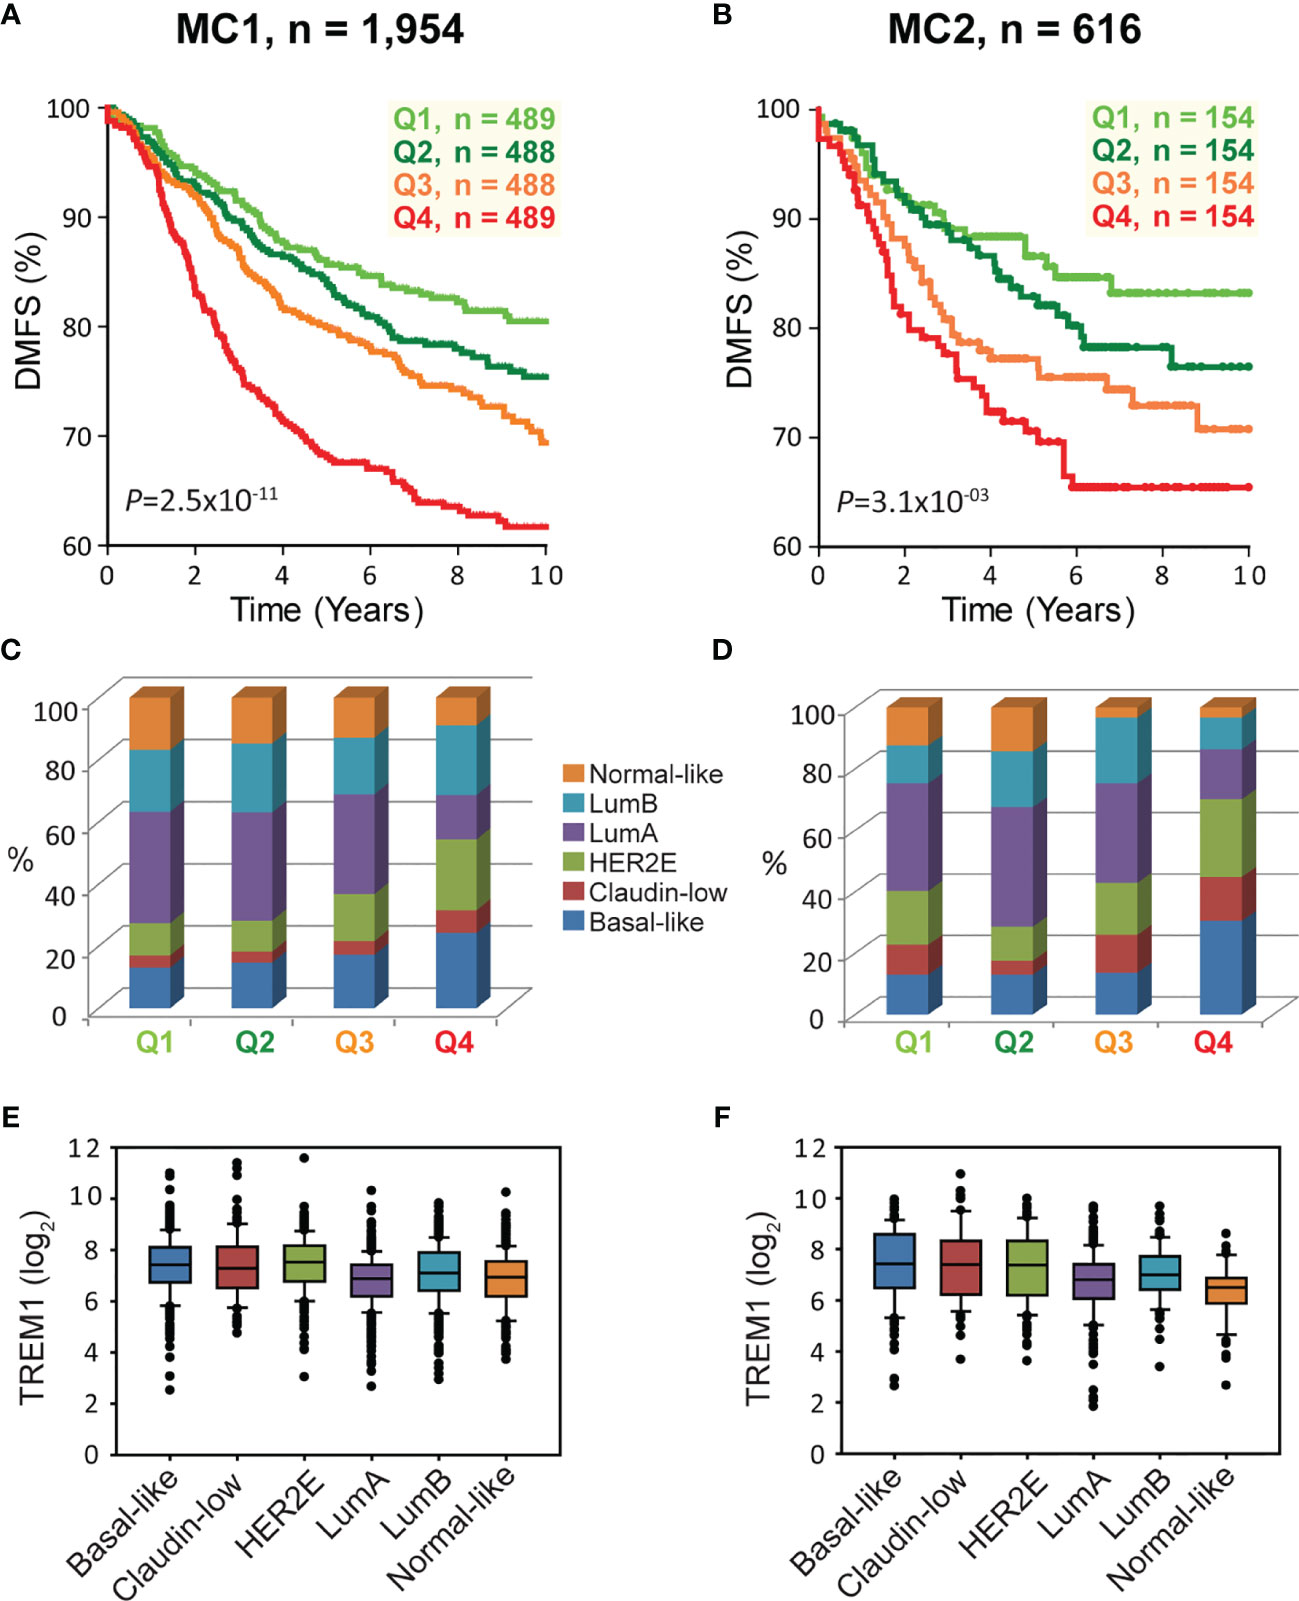
Figure 2 High TREM1 is associated with greater risk of distant metastasis in two independent meta-cohorts. (A, B) Kaplan-Meier survival analysis of patients according to TREM1 expression quartiles in (A) the MC1 cohort and (B) the MC2 cohort. Proportions of molecular subtypes within TREM1 quartiles are shown for (C) the MC1 cohort and (D) the MC2 cohort. Box plots of TREM1 expression distributions within molecular subtypes are shown for (E) the MC1 cohort and (F) the MC2 cohort.
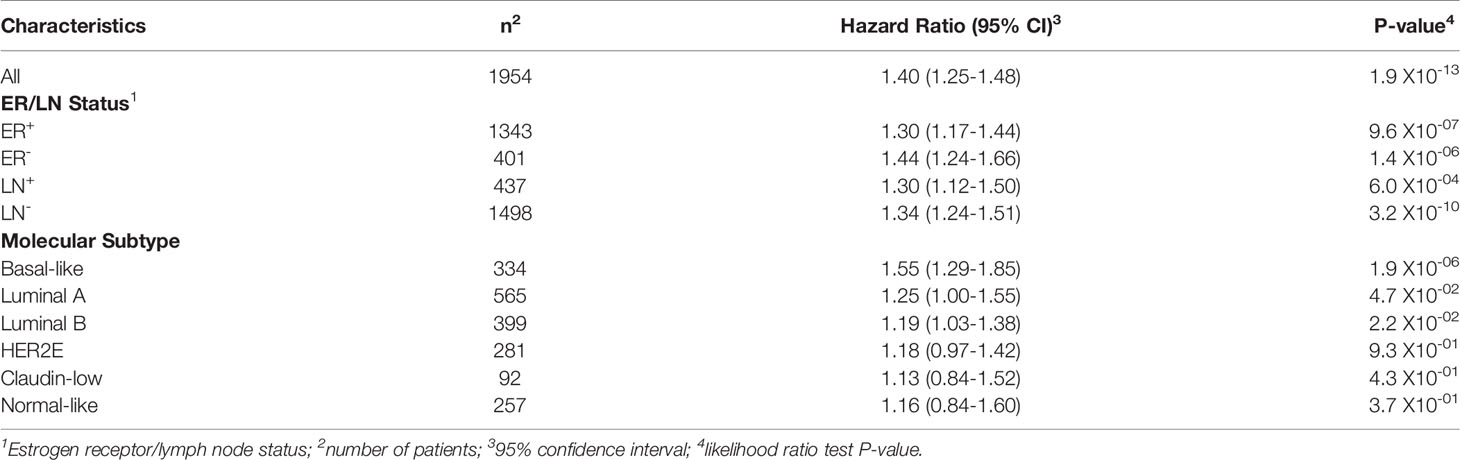
Table 1 Cox proportional hazards regression analysis of TREM1 in clinical and molecular subtypes of the MC1 cohort.
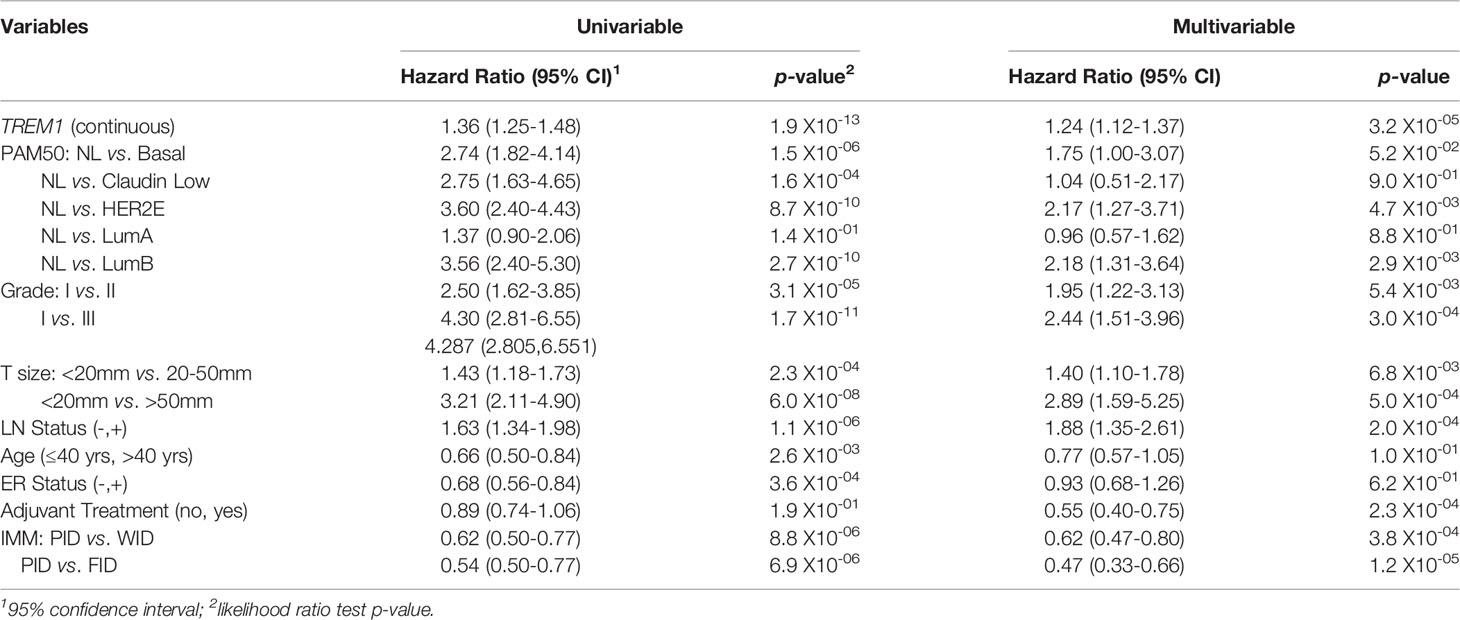
Table 2 Cox proportional hazards regression analysis for associations with distant metastasis-free survival.
TREM1 Expression Antagonizes Immune-Dependent DMFS
We hypothesized that the negative association between TREM1 expression and DMFS may reflect, in part, TREM-1-related immunoregulatory signaling that antagonizes favorable immune-mediated outcomes. In previous work, we showed that the FID, WID and PID immune subclasses exhibited a reproducible significant prognostic stratification in breast tumors classified as immune benefit-enabled (IBE), consisting mostly of highly proliferative Basal-like, HER2-enriched and Luminal B subtypes, but not in immune benefit-disabled (IBD) tumors defined by a reduced proliferative phenotype (20). Using the CIBERSORT algorithm (19) which deconvolves gene expression profiles from complex cellular mixtures and estimates the relative proportions of 22 different leukocyte types, we investigated the prognostic significance of TREM1 in the context of the estimated proportions of CD8+ T cells in IBD and IBE breast tumors (Figure 3). CD8+ T cell scores were used to stratify the MC1 cohort into CD8+ T cell quartiles (Q1=lowest quartile, Q4=highest quartile). While higher quartiles of CD8+ T cells associated with improved DMFS in IBE tumors (P = 0.0002) (Figures 3A, B), the prognostic power of TREM1 was most significant in IBE CD8+ T cell-High tumors (defined as quartiles 3 and 4 combined; P = 0.0002) as compared to CD8+ T cell-Low tumors (defined as quartiles 1 and 2 combined; P = 0.58) (Figures 3C, D), with TREM1-Low tumors exhibiting a more favorable DMFS. This observation is consistent with a possible role for TREM-1 in attenuating protective T cell-mediated immunity in breast cancer.
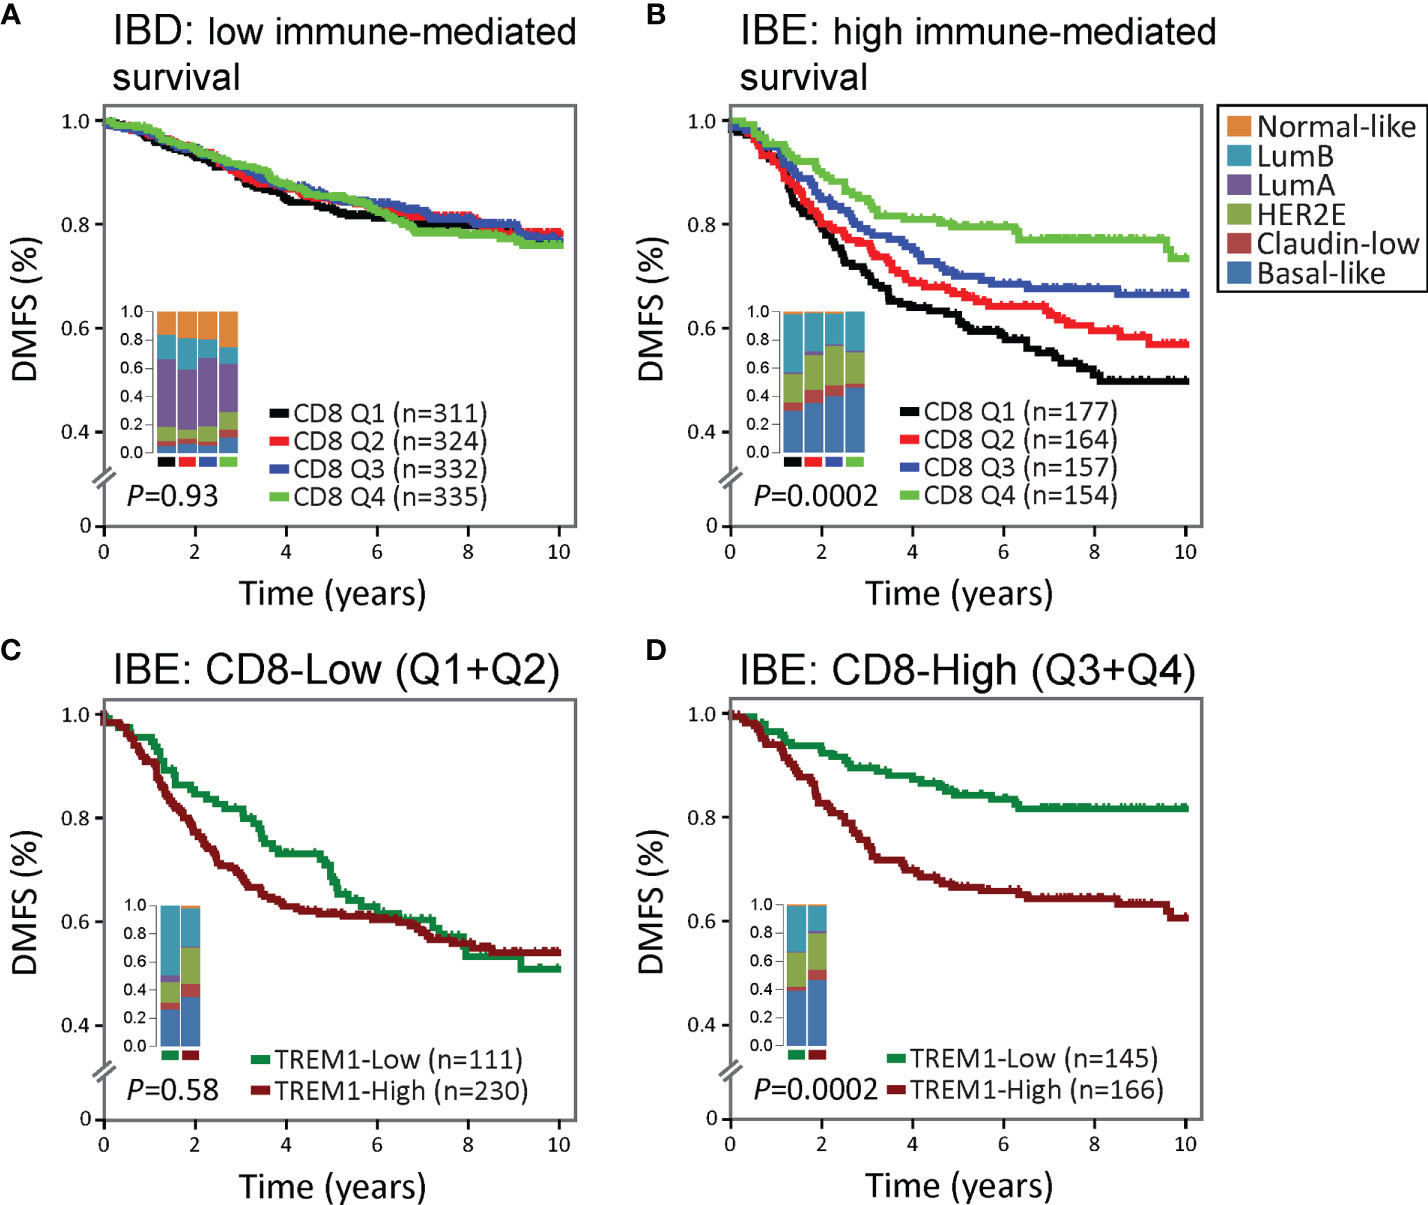
Figure 3 The association between high TREM1 and increased metastatic risk is most significant in immunogenic tumors with DMFS-protective high CD8+ T cell infiltrates. The prognostic relevance of TREM1 expression was examined in (A) poorly immunogenic tumors of the MC1 cohort with low proliferative capacity [classified previously as immune benefit-disabled (IBD) (20)], and (B) moderate to highly immunogenic tumors of the MC1 cohort with high proliferative capacity [classified previously as immune benefit-enabled (IBE) (20)]. Patients were stratified into DMFS survival curves based on the relative magnitude of tumor-infiltrating CD8+ T cells (CD8) estimated by the CIBERSORT algorithm (19). Q1, lowest CD8 quartile (black); Q2 and Q3, intermediate CD8 quartiles (red and blue); Q4, highest CD8 quartile (green). (C, D) Survival rates of patients with low (below-median) versus high (above-median) TREM1 expression were compared in the context of low versus high CD8+ T cell fraction estimates. The most significant difference was observed in IBE tumors. TREM1 expression level was not significantly associated with DMFS in IBE CD8-low tumors (C), but showed marked significance in IBE CD8-high tumors (D), where high TREM1 expression was significantly associated with increased risk of distant metastasis.
TREM1 Expression in the TME Is Associated With a Myeloid Phenotype
To determine the cellular source of TREM1 expression, we first analyzed the expression patterns of TREM1 and the genes comprising the TREM1-associated gene cluster observed in breast tumors using the Gene Enrichment Profiler tool (28), which measures tissue-specific gene enrichment in 126 normal human cell subsets and tissues. This analysis showed that in non-malignant tissues, TREM1 is highly enriched in macrophages and neutrophils (Supplemental Figure 3), consistent with previous reports (46, 47). Similarly, a number of genes comprising the TREM1-associated gene cluster that we identified by hierarchical clustering (ie, SPP1, PLAUR, AQP9, IL8 (CXCL8), ADM, UPP1, and INHBA) were also highly enriched in myeloid cells, and in lipopolysaccharide (LPS)-stimulated macrophages, in particular (Supplemental Figure 3), suggesting a common myeloid origin for TREM1 and this gene expression cassette. In parallel, we investigated TREM-1 expression directly by immunofluorescence staining using a breast tumor tissue microarray consisting of >40 invasive ductal and lobular carcinomas positive or negative for the clinical markers ER, PGR and HER-2. Across tumor types, the predominant TREM-1 staining pattern observed was moderate to strong TREM-1 staining in a fraction of tumor-infiltrating myeloid cells that co-expressed CD68, with negative staining in tumor cells (pattern P-1, Figure 6A). In some instances we observed only CD68-positive cells negative for TREM-1 staining, which coincided with malignant (and normal) epithelium also negative for TREM-1 (P2). In more rare instances we observed TREM-1 staining in non-myeloid cells of tumors (P3), such as moderate TREM-1 staining in cancer cells (n=2), or moderate to high TREM1 staining in cells morphologically consistent with cancer-associated fibroblasts (n=3). To further investigate the relationship between TREM1 and tumor infiltrating immune cells, we used the CIBERSORT algorithm to study the relationship between immune cell abundance estimates and TREM1 expression quartiles in the MC1 cohort. As shown in Figure 4, a number of immune cell types showed marked proportional differences across TREM1 expression quartiles. In the highest TREM1 quartile (Q4), we observed significant enrichment of neutrophils, macrophages (M0 and M2, but not M1), mast cells (activated, but not resting) and dendritic cells (activated). By contrast, significant depletion in TREM1 Q4 was observed for CD8+ T cells, monocytes, follicular helper T cells, mast cells (resting), dendritic cells (resting) and plasma and memory B cells. These observations are consistent with a positive correlation between high TREM1 expression, increasing proportions of immunosuppressive myeloid cell types (M2 macrophages, neutrophils and mast cells) and decreasing proportions of anti-tumor effector cells (CD8+ T cells and follicular helper T cells).
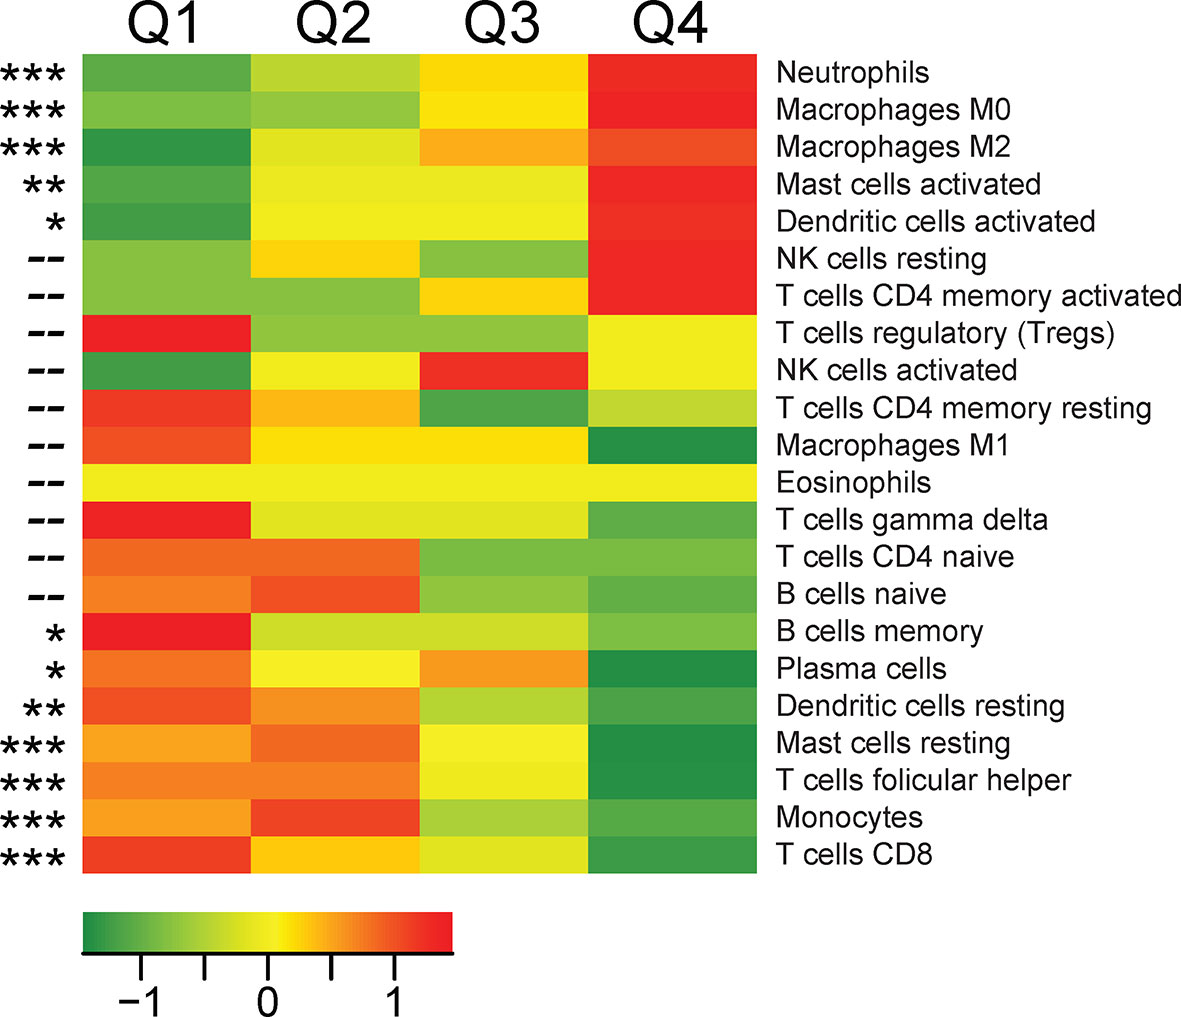
Figure 4 Associations between TREM1 expression quartiles and abundance of leukocyte populations in breast tumors. For each tumor of the MC1 cohort, a CIBERSORT estimate of relative immune cell proportion was computed for each of 22 immune cell types. Heat map values represent the mean CIBERSORT immune cell proportions for each quartile of TREM1 expression (mean-centered). Red color, high average cell proportion; green color, low average cell proportion. For cell types where cell abundance correlates positively or negatively with TREM1 expression quartiles, Spearman correlation p-values are shown. *P < 0.05; **P < 0.01; ***P < 0.001.
Next, we examined the TCGA breast cancer (BRCA) RNAseq data set for TREM1 correlations with known target genes (Figure 5A) and myeloid markers (Figure 5B). Side-by-side analyses were conducted for the set of all breast tumors, and for the basal-like breast tumors, alone, since they showed the highest average expression of TREM-1 as compared to other subtypes in the MC1 and MC2 cohorts. Significant positive correlations were identified between intratumoral TREM1 expression and downstream TREM-1 target genes that encode cytokines with direct roles in the recruitment and activation of pro-tumorigenic myeloid cells (IL1B, IL8, IL6, MCP-1/CCL2), as well as markers of pro-tumorigenic myeloid cells including CD11B/ITGAM (a general MDSC marker), CD14 [marker for monocytic (M)-MDSCs (48)], OLR1 [marker for PMN-MDSC (49)] and CD206/MRC1 (M2 macrophage marker).
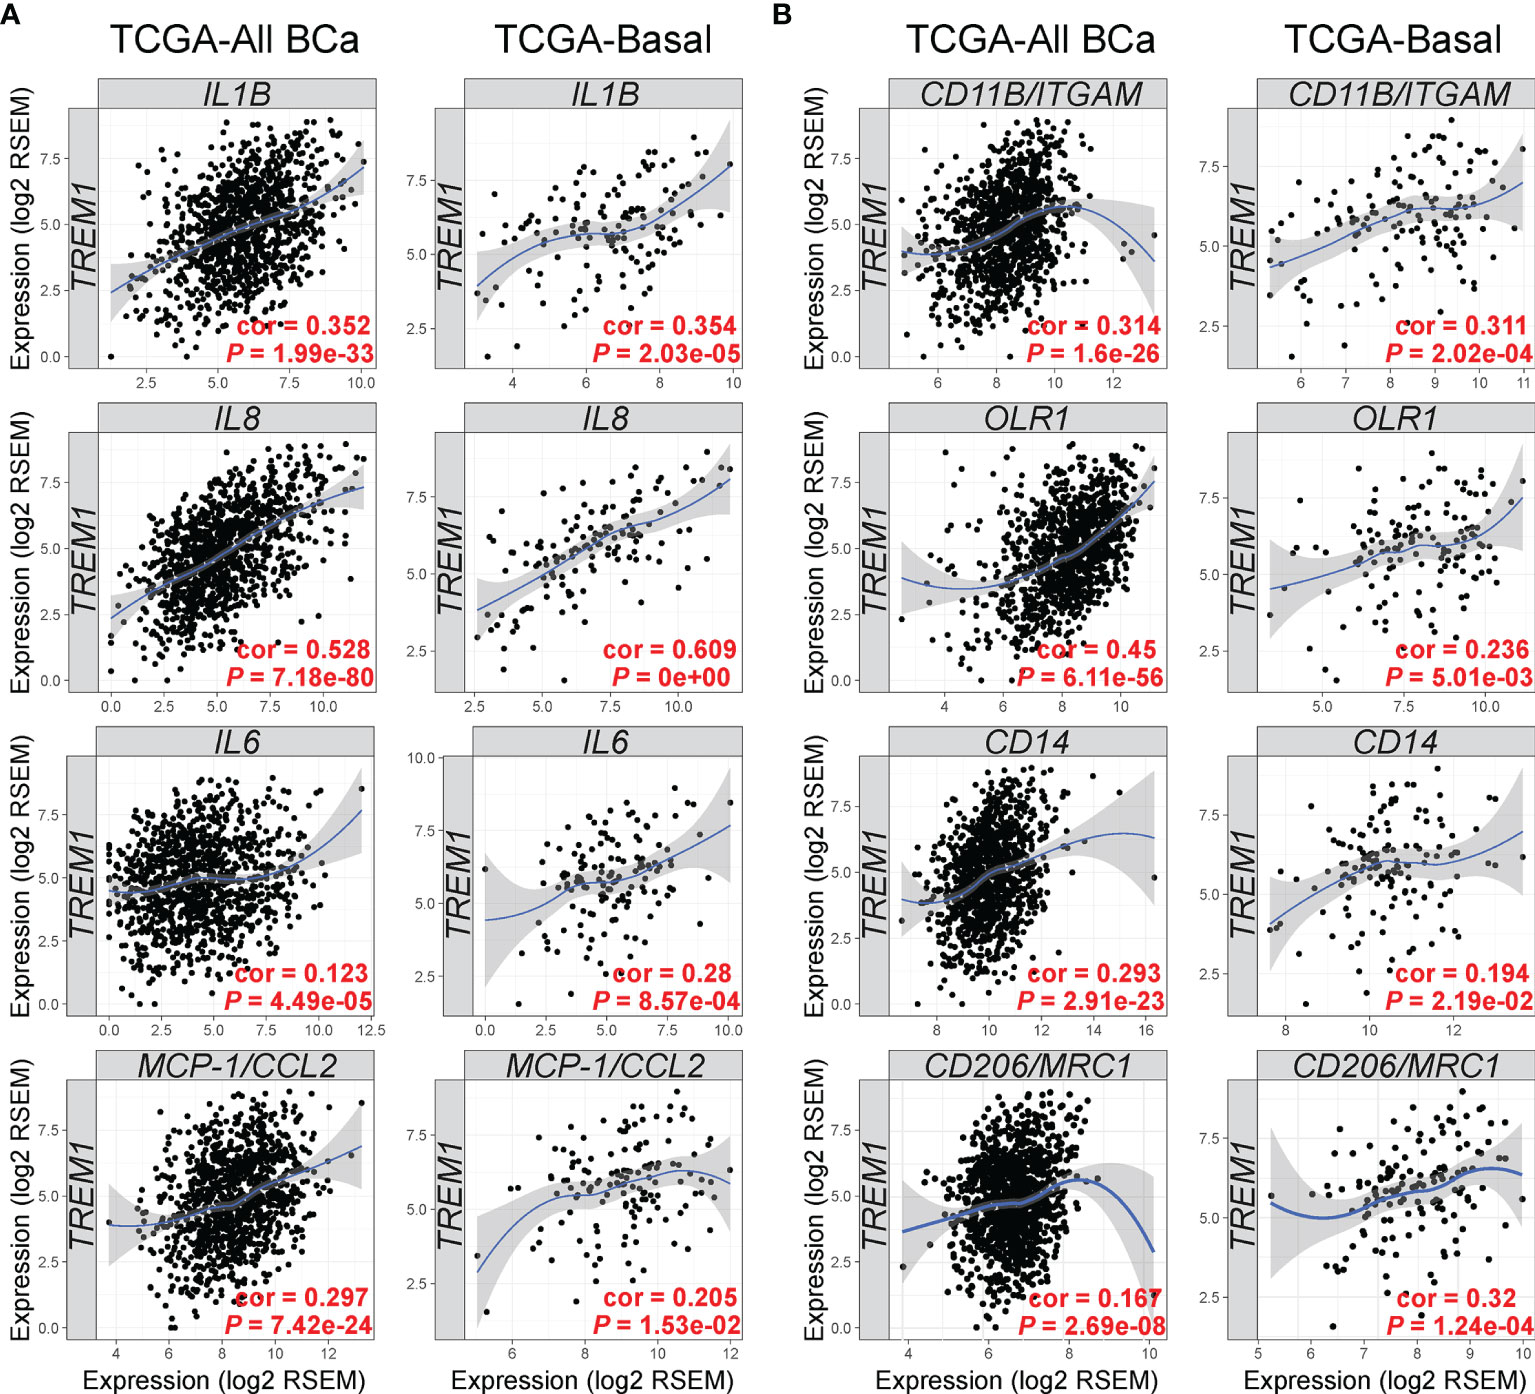
Figure 5 TREM1 correlates with expression of TREM-1-inducible cytokines and markers of tumor-associated myeloid cell populations. The Tumor Immune Estimation Resource (TIMER) (33) was used to analyze gene expression correlations between TREM1 and (A) its cognate cytokines and (B) markers of MDSCs and M2 macrophages. Correlations were analyzed in tumor populations representing all TCGA breast cancer (BCa) cases (n = 1,093) or the Basal-like/TNBC cases (n = 139) only. Spearman’s correlation coefficient (rho) and P-value are shown.
Single-Cell RNA Sequencing Verifies TREM-1 Signaling and Association With MDSC and TAM Compartments in Breast Tumors
To more precisely characterize TREM1 expression in the breast tumor microenvironment, we profiled 770 cells from a fresh surgical TNBC specimen by single-cell (sc) RNAseq. Of 8 cell types identified by clustering (Figures 6B, C), prevalent and high-level TREM1 expression was observed in the myeloid cell population (n=301 cells), while low-level TREM1 was observed sparsely in tumor cells and T cells (Figure 6D, left panel). Notably, TREM1 expression overlapped sharply with markers of M2 macrophages (MRC1/CD206) and polymorphonuclear (PMN)-MDSCs (OLR1) (Figure 6D). To substantiate these findings, we analyzed a large publicly available scRNAseq dataset that profiled 175,942 cells from 31 breast tumors biopsied prior to treatment (38). Consistent with the initial scRNAseq and TREM-1 IF staining analyses, the prevalence and level of TREM1 expression in the Bassez et al. dataset was greatest in the myeloid compartment, with sparse expression observed in other cell types, including cancer cells and fibroblasts, and to a lesser extent, B cells and endothelial cells (Figures 7A, B). Similar TREM1 expression patterns were observed among cell types grouped by tumor subtype (TNBC, n=13; ER+, n=15; HER2+ (ER+/-), n=3) (Supplemental Figure 4), and within tumors of individual patients (Supplemental Figure 5), confirming that TREM1 expression in breast cancer is a predominantly myeloid phenomenon. Within the myeloid compartment (n=16,485 cells), TREM1 was significantly overexpressed in cells positive for expression of OLR1 or MRC1 expression, as compared to cells negative for marker expression, respectively (Figure 7C; P<0.0001, both comparisons), consistent with our initial observations in the TNBC specimen (Figure 6), as well as the positive correlations observed between TREM1 and OLR1 and MRC1 in the TCGA cohort (Figure 5).
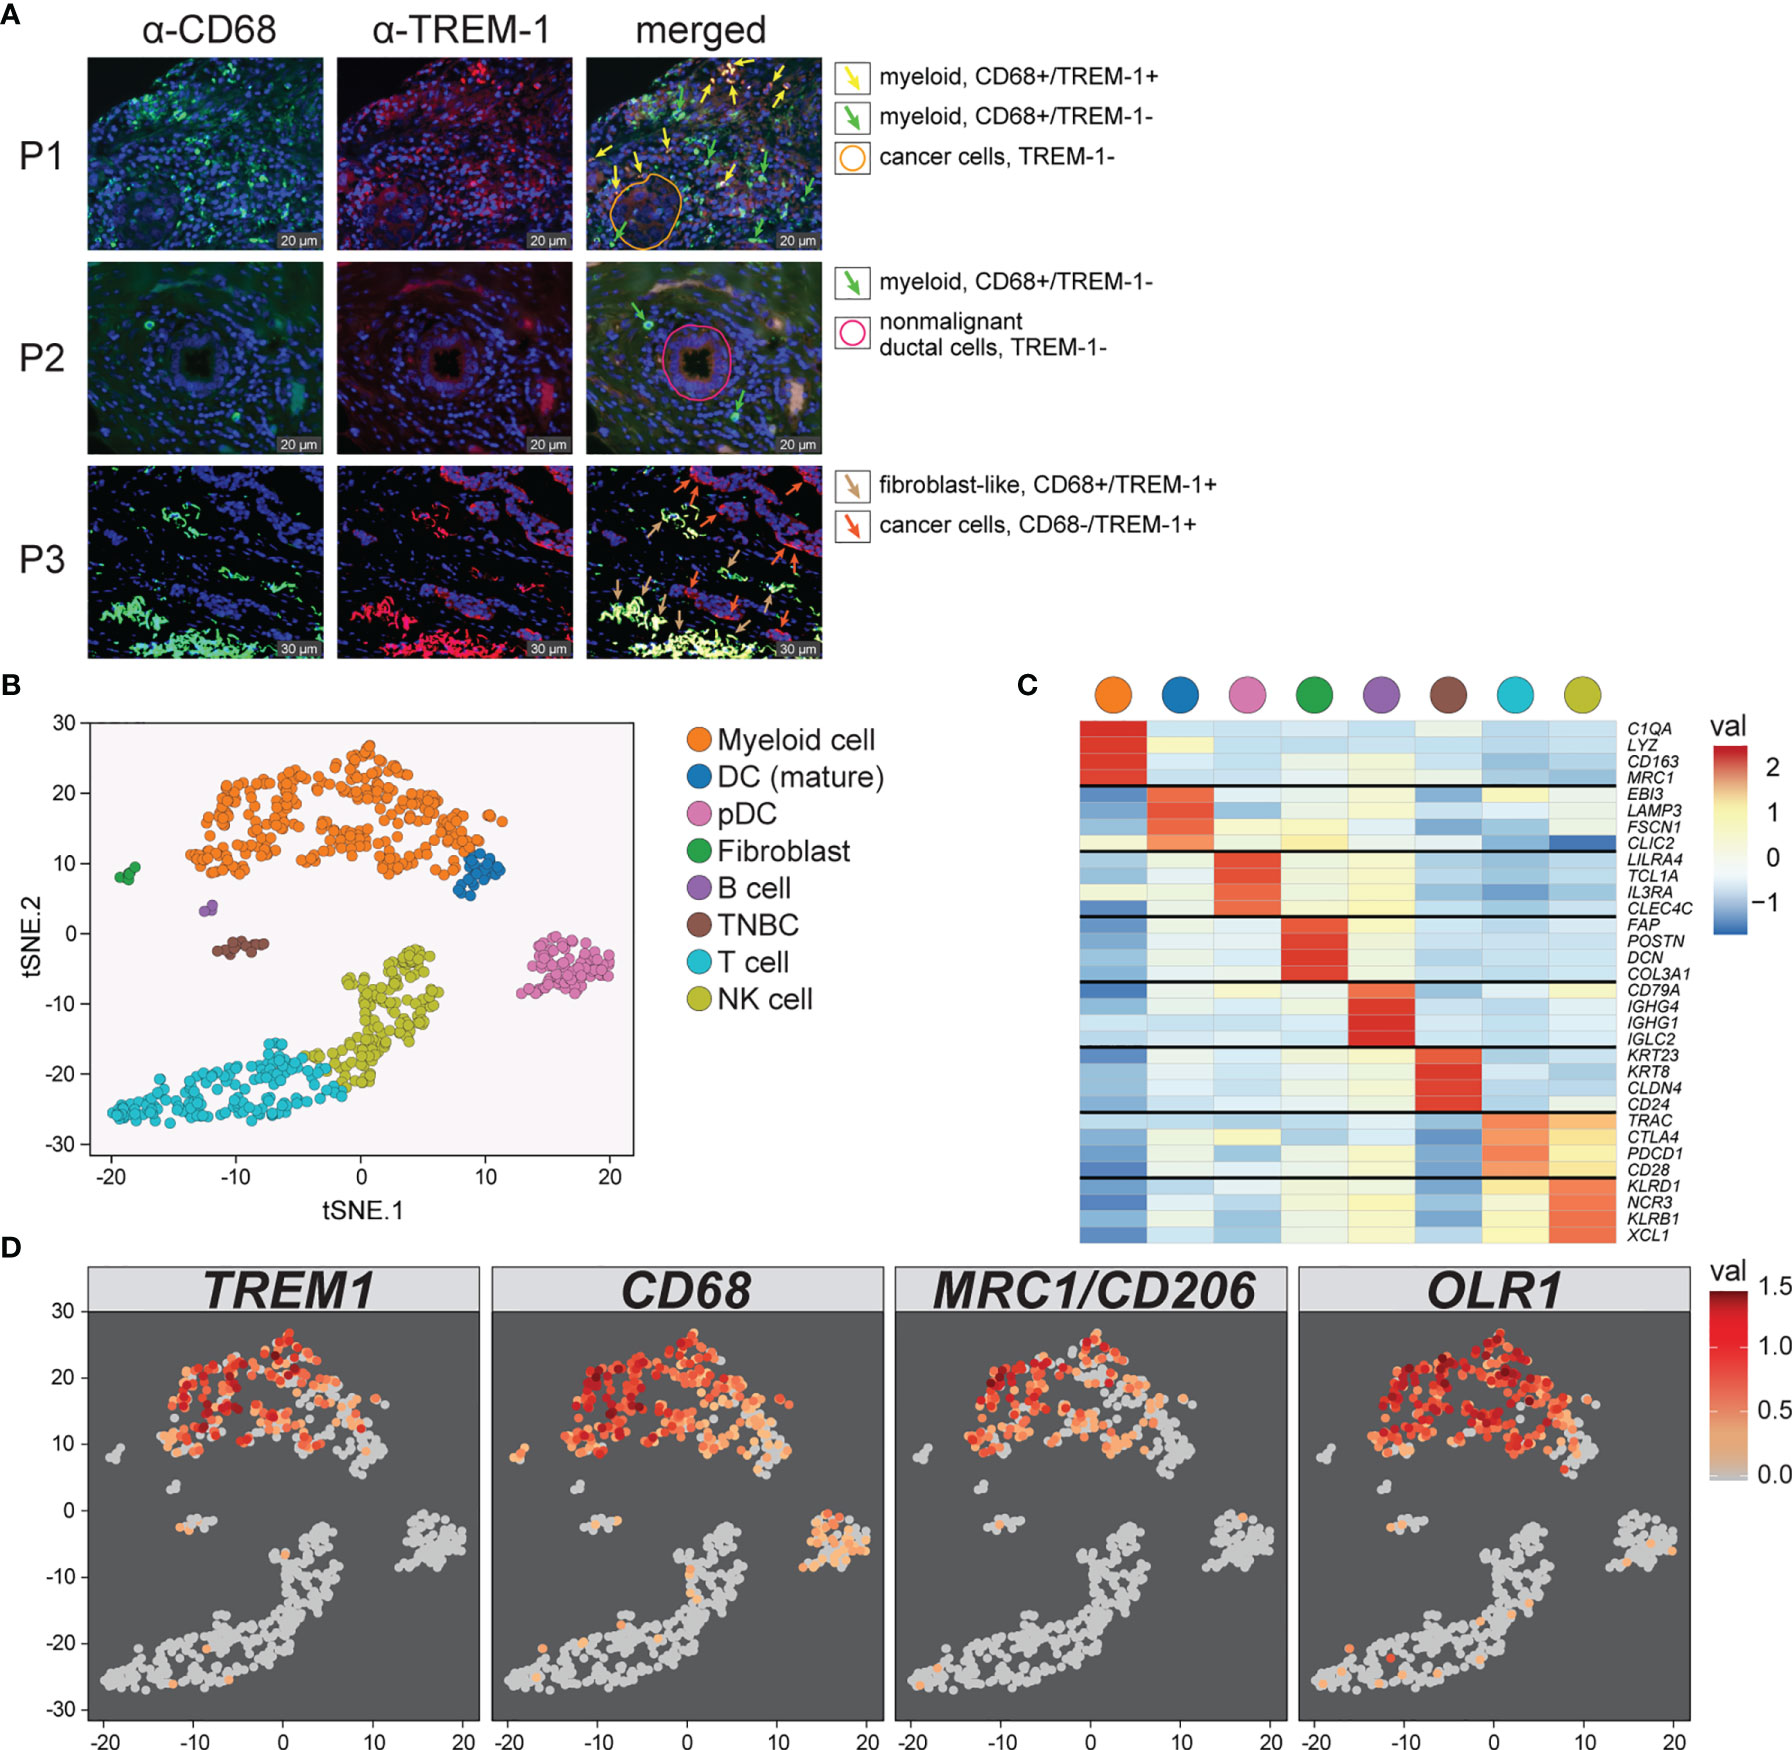
Figure 6 Characterization of TREM1 expression in the breast tumor microenvironment by IF and single-cell RNAseq. (A) Representative patterns (P) of TREM-1 (red) and CD68 (green) immunofluorescent staining in breast tumor sections. DRAQ5-stained nuclei are shown in blue pseudocolor. (B) Single-cell RNA sequencing was performed on freshly dissociated cells of a stage III primary triple negative breast tumor. Expression profiles of 770 cells were K-means clustered and resolved spatially in a tSNE plot. (C) Cell identities in (B) were assigned based on significant expression of canonical marker genes. Mean-centered averages of cluster-specific gene expression are shown in the heatmap. (D) Relative expression levels of TREM1, CD68, MRC1 (M2 macrophage marker) and OLR1 (MDSC marker) are shown.
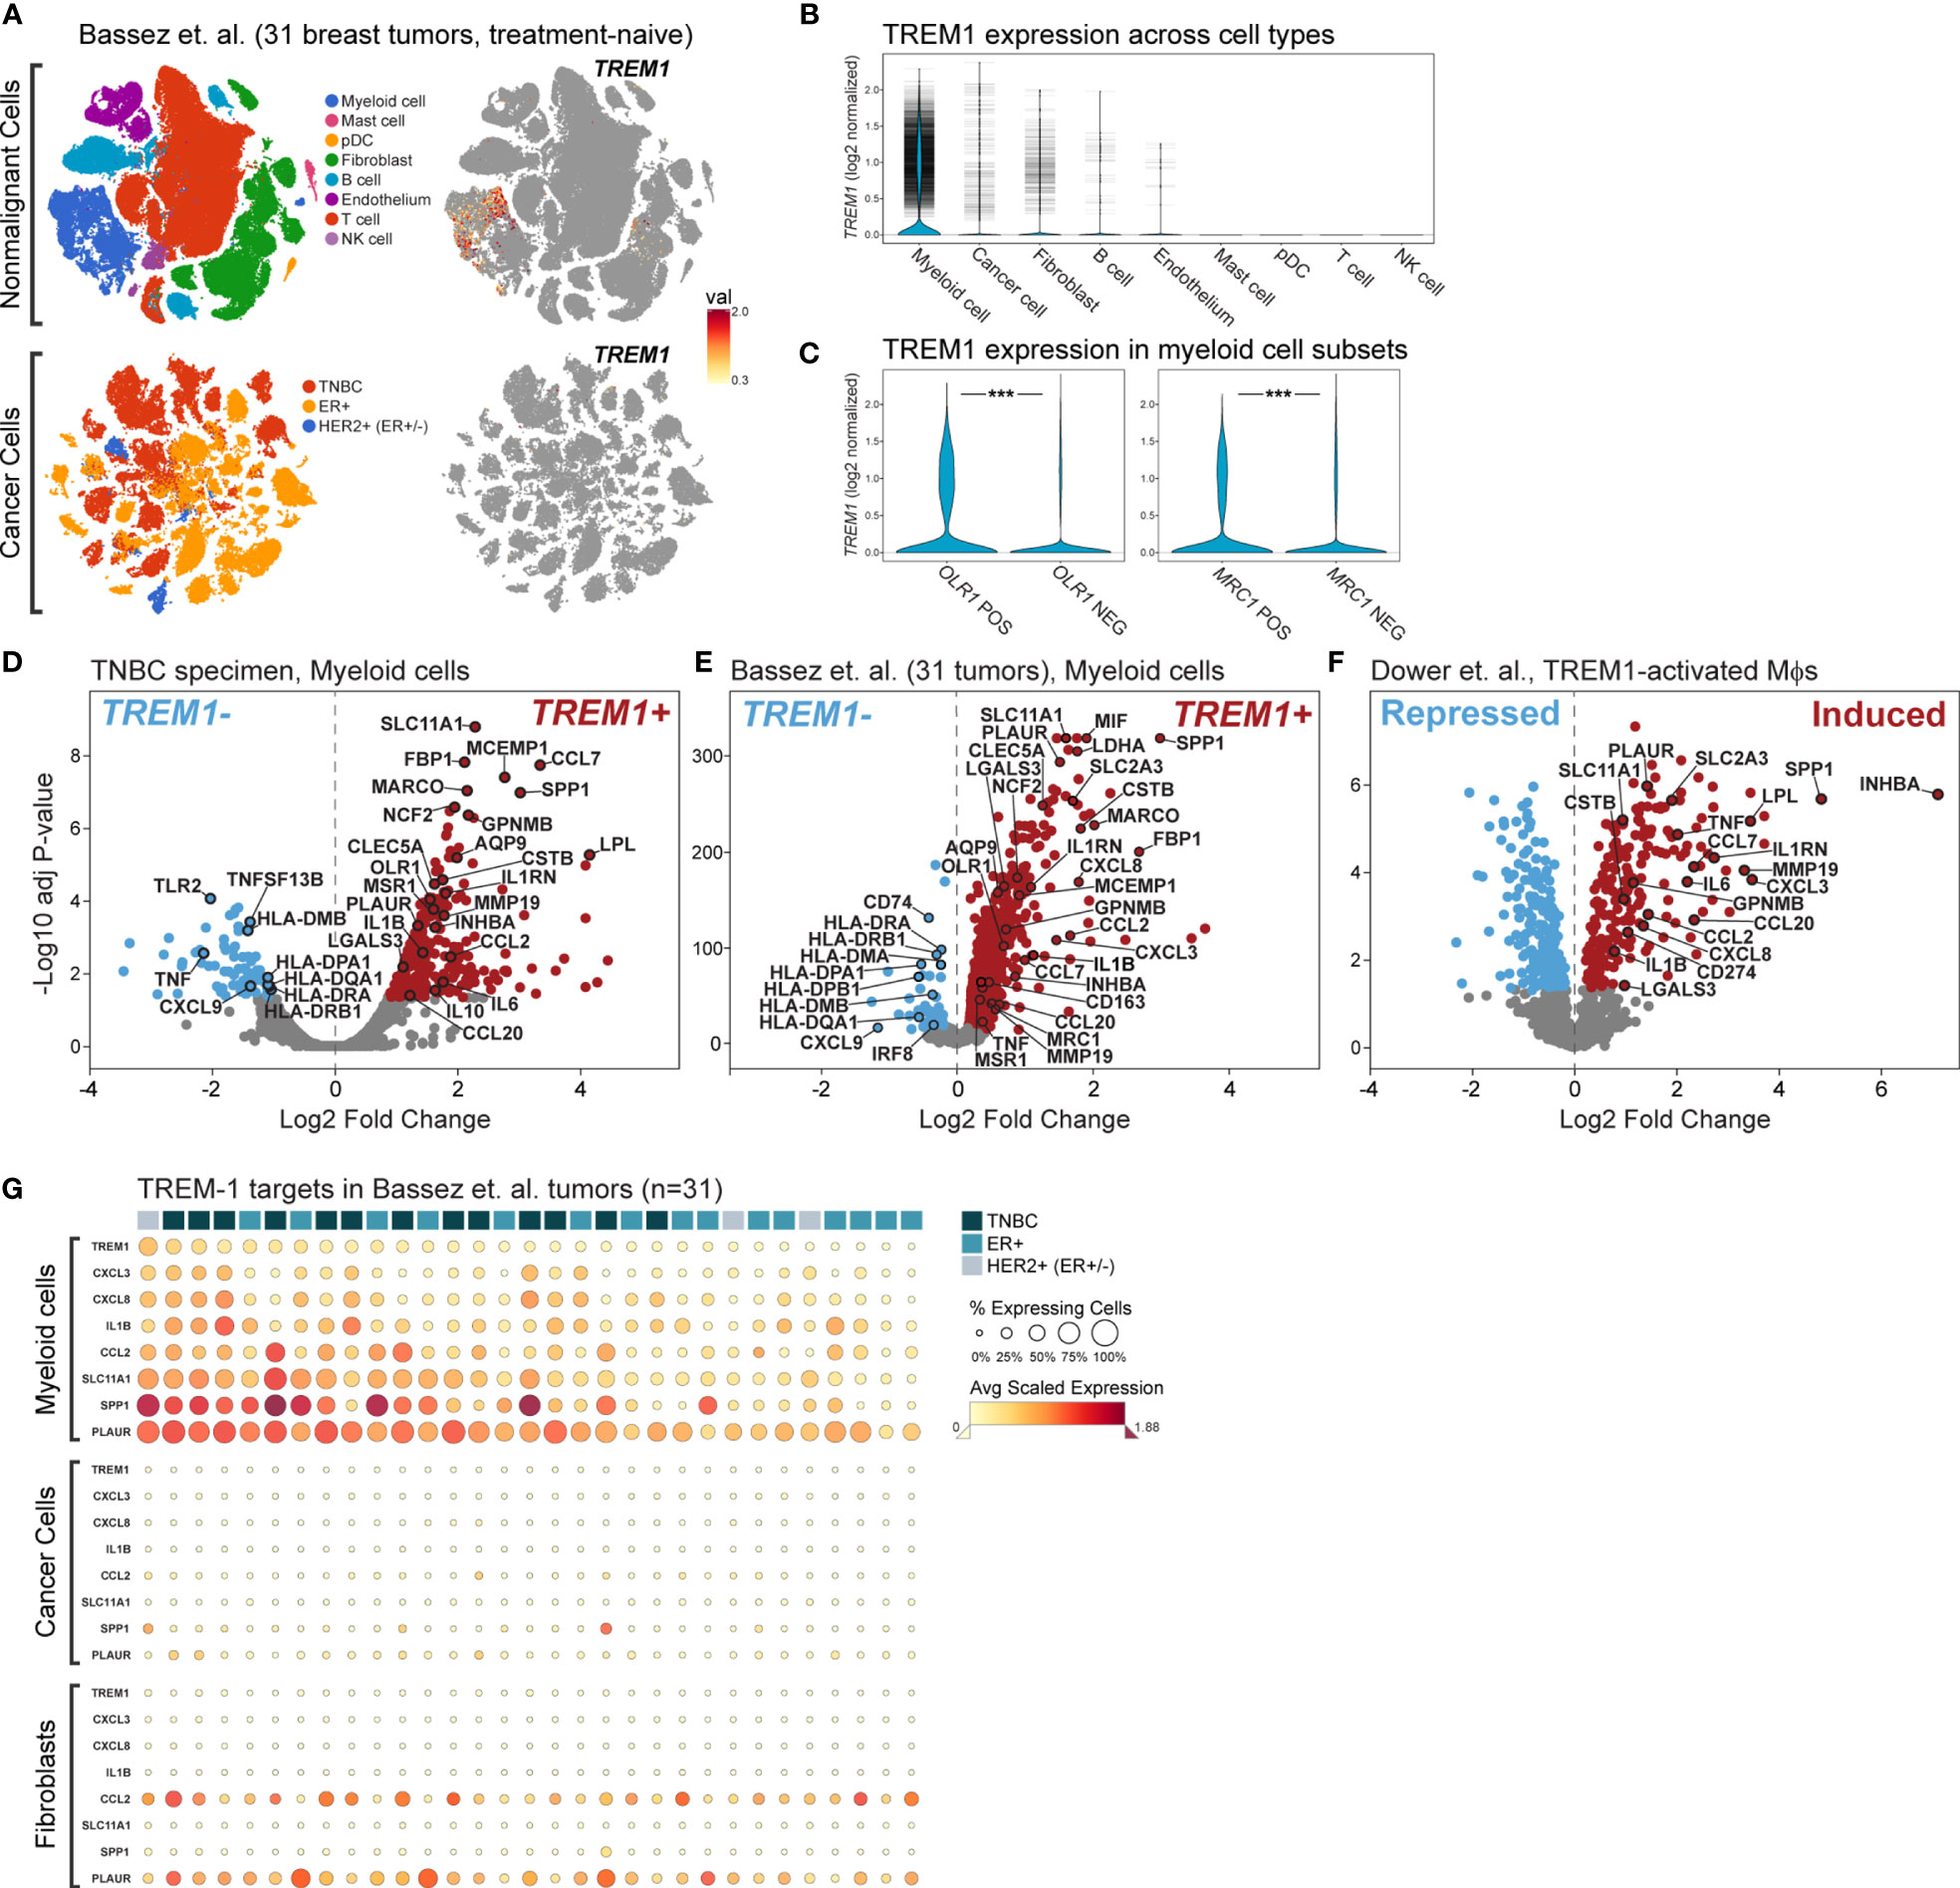
Figure 7 Single cell analysis of TREM1 and correlated genes in a breast tumor panel. (A) Shown are tSNE plots derived from the Bassez et al. single cell RNAseq data for 175,942 cells from 31 primary breast tumors comprising TNBC (n = 13), ER+ (n = 15) and HER2+/ER+/- (n = 3) subtypes. Plots are shown for nonmalignant cells (upper panels) and cancer cells (lower panels). The magnitude of TREM1 expression across cell populations is illustrated spatially (right panels), and in (B) violin plots across cell types. Horizontal tick marks denote individual cell measurements. (C) TREM1 expression is compared between myeloid cells grouped according to positive or negative expression of OLR1 (MDSC marker, left panel) or MRC1 (M2 TAM marker, right panel). ***P < 0.001. Volcano plots of genes differentially expressed between myeloid cells positive or negative for TREM1expression are shown for (D) the WFBMC TNBC specimen [204 genes differentially expressed between TREM1+ cells (n=123) and TREM1– cells (n = 178)], and (E) the set of 31 breast tumors of Bassez et al. [3,223 genes differentially expressed between TREM1+ cells (n = 3,333) and TREM1– cells (n = 13,152)]. (F) Volcano plot of genes differentially expressed between TREM-1-activated (agonist Ab-treated) and control (isotype Ab-treated) human blood monocytes of Dower et al. [2,010 genes differentially expressed between treated samples (n = 11) and control samples (n = 11)] (24). (G) Heatmap of average gene expression levels of TREM1 and select target genes in myeloid, cancer, and fibroblast cell populations of individual tumors. Tumor samples (columns) are ranked left to right (descending order) according to the percentage of TREM1-expressing cells in the myeloid compartment.
To gain insight into the transcriptional programming downstream of TREM-1, we performed differential expression analysis in the myeloid cell population differentiated by TREM1 expression (positive vs. negative). First, we observed a number of significantly differentially expressed genes that were reproducibly identified between the TNBC specimen dataset and that of Bassez et al. (Figures 7D, E). Cross-referencing these genes with genes previously identified by Dower and colleagues (24) as being significantly induced by TREM-1-specific activation in human monocytes isolated from peripheral blood (Figure 7F), resulted in a list of confirmed transcriptional targets robustly overexpressed in the TREM1+ cells of the breast cancer TME. Among these genes were known targets of TREM-1 signaling with pro-inflammatory functions (IL1B, CCL7, CXCL3) and known targets with anti-inflammatory or mixed pro- and anti-inflammatory functions (IL1RN, INHBA, IL6, IL8, CCL2). Also identified in the TREM1+ positive myeloid cells of the breast tumors were genes shown by Dower et al. to be uniquely upregulated in monocytes by TREM-1-specific activation (by agonist antibody ligation) but not by LPS stimulation, including MMP19, IL1RN, PLAUR, CCL7 and SPP1. Notably, SLC11A1 and SPP1 were among the top-most differentially expressed genes in all three datasets. Finally, in tumor myeloid cells negative for TREM1 expression, we observed consistently higher expression of MHC class II antigen-presenting genes (HLA-DRA, HLA-DRB1, HLA-DMB, HLA-DPA1, HLA-DQA1) and the Th1-associated chemokine, CXCL9. However, these genes were not observed to be down-regulated by TREM-1 activation in the Dower et al. study, suggesting they represent a phenotype of non-TREM1 expressing cells in the breast TME. Of note, genes encoding canonical immunosuppressive factors such as TGF-β (TGFB1), IL-10 (IL10) and PD-L1 (CD274) were not consistently differentially expressed in our analyses; although IL10 and CD274 were moderately associated with TREM1 expression (Figure 7D) or activation (Figure 7F), respectively, these observations lacked reproducibility across datasets.
Next, we assembled a TREM-1 target gene panel comprising genes significantly induced by TREM-1 activation (in Figure 7F) and associated with intratumoral TREM1+ myeloid cells (in Figure 7E) to serve as an estimator of TREM-1 signaling output in different cell and tumor populations.
Where TREM1 expression was significantly higher in OLR1+ or MRC1+ cells as compared to cells negative for OLR1 or MRC1 expression (Figure 7C), the TREM-1 target genes also exhibited a simultaneous increase in frequency and magnitude of expression in the OLR1+ or MRC1+ cell compartments (Supplemental Figure 6), consistent with heightened TREM-1 signaling in these populations. We next used the target gene panel to profile individual tumors and major cell types expressing TREM1, including myeloid cells, cancer cells and fibroblasts (Figure 7G). By ranking tumor samples (columns) on TREM1 expression frequency in the myeloid compartment, a clear correlation was observed between the percentage of TREM1-expressing myeloid cells and the frequency and magnitude of expression of the target genes. Moreover, we observed that myeloid TREM1 frequency also associated with clinical breast cancer subtype (TNBC, ER+, HER2+), whereby an overall difference in rank of the percentage of TREM1-expressing cells was significant (P=0.03, three-group Kruskal-Wallis test). This difference in rank was also significant for the TNBC and ER+ subtypes alone (P=0.007, two-group comparison), where higher TREM1 frequency associated with TNBC status while lower TREM1 frequency associated with ER-positive tumor status. Notably, this observation was consistent with our findings in the MC1 and MC2 cohorts where TREM1 expression by bulk tumor analysis was higher in basal-like tumors as compared to luminal tumors (Figures 2C–F). Across individual tumors, we examined the frequencies and expression levels of TREM1 and its target genes in cancer cells and fibroblasts (Figure 7G) where sparse, yet moderate to high TREM1 expression could be detected in some cells (Figure 7B). In contrast to myeloid cells, neither the cancer cell nor fibroblast compartments showed high frequency TREM1 expression in individual tumors or coordinated expression of target genes. Similar results were observed for the B cell and endothelial compartments (data not shown). Together, these findings suggest that TREM-1 signaling is frequently operative in breast cancer, and that myeloid cells are the predominant source of TREM-1 signaling in the TME.
Finally, we investigated the relationships between TREM1 myeloid expression and the expression of other myeloid receptors related to TREM-1 activation and function. Historically, TREM-1 signaling has been widely studied in the context of lipopolysaccharide (LPS)-induced Toll-like receptor (TLR) signaling in innate immunity, where TLR activation via PAMP/DAMP-sensing can potently induce the expression and activation of TREM-1 in a pro-inflammatory amplification loop (21). In the Bassez et al. breast tumor myeloid cells, the expression of 5 TLR genes (TLR1, TLR2, TLR4, TLR7 and TLR8) were detected in >10% of cells and at moderate to high expression levels. Upon comparing TREM1 expression levels between myeloid cells positive or negative for TLR expression (Supplemental Figure 7A), no TLRs exhibited a substantial positive association with TREM1 expression, suggesting that TLRs are not major determinants of TREM1 expression in the breast TME. The TREM-2 receptor is a TREM family member with strong homology to TREM-1, known for its various roles in anti-inflammatory signaling (50) which may antagonize TREM-1 activity (51). Like TREM-1, TREM-2 also requires binding to the DAP12 adaptor protein to mediate signal transduction (52), thus potentially competing with TREM-1 in the presence of activating signals. TREM2 expression was observed in approximately one-third of breast tumor myeloid cells, but with no significant association with TREM1 expression (Supplemental Figure 7B). Moreover, in myeloid cells either positive or negative for TREM2, TREM1+ cells were consistently associated with greater frequency and magnitude of expression of the TREM-1 target genes (Supplemental Figure 7C) consistent with TREM-1 activation occurring independent of TREM-2 status. Together, these findings suggest that neither TLRs nor TREM-2 substantially influence TREM1 expression characteristics in the breast TME.
Discussion
During acute inflammation, myeloid TREM-1 signaling stimulates production of cytokines and other factors that drive the expansion and survival of myeloid and lymphoid cells involved in pathogen clearance (21, 22, 53–55). This potent, but typically short-lived inflammatory response has been associated with M1 polarization and initiation of Th1 immunity (56, 57). However, in chronic infection and cancer, persistent activation signals and unresolved inflammation drive the production and accumulation of MDSCs with immunosuppressive properties (58, 59). Under such conditions, TREM-1 function is poorly understood.
Historically, TREM-1 signaling has been widely studied in the context of lipopolysaccharide (LPS)-induced TLR signaling, where TLR activation leads to dual TLR/TREM-1 signaling and subsequent M1-like polarization (24). Dower and colleagues investigated the cellular consequences of TREM-1 activation in human monocytes (24). They compared gene expression profiles of TREM-1-specific activation, where TREM-1 was activated by ligation with a TREM-1-specific agonist antibody (αTREM-1), to that of LPS-induced TLR/TREM-1 signaling, or the combination of the two. While the treatments similarly induced expression of certain TREM-1 cytokines, the authors noted that where LPS/TLR signaling showed bias toward expression of M1 markers, TREM-1-specific activation (without LPS) induced expression of TNFSF14 (M2 marker) and PPARG (required for M2 maturation) consistent with an alternative form of activation. Further, the authors noted that TREM-1 hyperactivation strongly repressed expression and secretion of IL-12 which was otherwise strongly induced by LPS/TLR activation. IL-12 is an M1 cytokine and potent promoter of anti-tumor immunity (60). Thus, the authors concluded that while LPS-induced TLR/TREM-1 signaling promotes the classical M1 phenotype, TREM-1-specific activation imparts a skewed phenotype with immunoregulatory properties. TREM-1-specific activation is believed to occur through direct binding of TREM-1 with its known ligands, HMGB1 and PGLYRP1 (43). Notably, many cancers types are known to express HMGB1 (61), including breast cancers (62, 63), suggesting TREM-1 hyperactivation could be a common feature of the tumor microenvironment.
To date, only a handful of studies have investigated roles for TREM-1 in cancer. In non-small cell lung cancer (NSCLC) and hepatocellular carcinoma (HCC), TREM-1 protein levels significantly correlate with poorer overall and disease-free survival (64, 65). In NSCLC, TREM-1 expression in tumors was restricted to tumor-infiltrating CD68+ myeloid cells (64), yet soluble TREM-1 in serum was also reported to have prognostic significance (66). In glioblastoma, a hypoxia-inducible inflammatory gene signature inclusive of myeloid-derived TREM1 and IL8 expression was significantly associated with poorer overall survival of patients (67). Similarly, in colorectal cancer (CRC), a risk score based on 19 genes transcriptionally regulated by TREM-1 and/or CTGF activation was found to be an independent risk factor for cancer recurrence and a significant prognostic indicator that may associate with reduced response to adjuvant chemotherapy (68).
In this report, we present first evidence that high TREM1 expression in breast tumors is associated with inferior clinical outcomes of patients. TREM1 expression in breast tumors was predominantly associated with the tumor-infiltrating myeloid compartment, and while TREM1 was observed in all breast cancer subtypes, it was expressed to a higher degree in the non-luminal Basal-like and HER2E subtypes, suggesting that yet unknown molecular properties of these tumors may be more conducive to TREM-1 expression and downstream activation. Higher TREM1 expression was robustly associated with worse distant metastasis-free survival in both ER-negative (basal-like) and ER-positive (Luminal A/B) breast cancers. In the presence of conventional prognostic markers, TREM1 expression remained significantly associated with DMFS, indicating that TREM1 contributes additive prognostic information not captured by conventional variables.
We also observed evidence that TREM1’s inferior outcome association in breast cancer may depend, in part, on an otherwise favorable immunological context. Previously described FID tumors are defined by the heightened expression of immune genes that reflect abundant effector cell infiltrates and equate with significantly better chemotherapy response and recurrence-free survival as compared to WID and PID tumors (8, 14, 20). Here, we found that the therapy-predictive power of TREM1 was most prominent in the FID subclass, as evidenced by the significant relationship between low TREM1 expression and a 1.9-fold increase in the relative frequency of response to neoadjuvant chemotherapy as compared to FID tumors with high TREM1 expression. Similarly, we observed that high TREM1 expression associated with inferior DMFS, and that this association was most prominent in breast tumors that otherwise exhibited a survival advantage in the context of high CD8+ T cell infiltration (as estimated by CIBERSORT). These observations are consistent with a model where TREM1 expression reflects a pro-tumorigenic biology that, in part, antagonizes immune effector cell-mediated cancer control.
TREM-1 is known to signal through its signaling partner DAP12, which transactivates expression of numerous cytokines that chiefly include IL-1β, IL-6, IL-8, MCP-1/CCL2, M-CSF, and TNF-α (21). These cytokines comprise the inflammatory effectors of TREM-1 responsible for the pathological effects of TREM-1 signaling described in septic shock, rheumatoid arthritis, atherosclerosis, myocardial infarction, inflammatory bowel disease and retinal neovascular disorders (43, 69). Strikingly, these same cytokines overlap extensively with those required for the function and trafficking of MDSCs in cancer. In breast and other cancer types, MDSCs promote cancer cell growth, suppress anti-tumor immunity and antagonize immunotherapy responsiveness (70–72). MDSCs are recruited to tumors by the TREM-1 related cytokines IL-8, IL-6 and MCP-1/CCL2 (73–75). In the TME, IL-1β, IL-6, TNF-α and M-CSF are known to promote intratumoral MDSC expansion as well as activation of MDSC immunosuppressive functions (76–83). Moreover, the targeted inactivation of IL-6, MCP-1/CCL2 or M-CSF has been shown to augment anti-tumor immunity and reverse resistance to immunotherapy (84–88). More recently, TREM-1 signaling was reported to directly promote immunosuppression in hepatocellular carcinoma and abrogate immune checkpoint inhibition. In this study, TREM-1 signaling in TAMs was shown to impair anti-tumor activity of CD8+ T cells through the recruitment and activation of T-regs, thereby inducing resistance to anti-PD-L1 treatment (44). Together, these observations suggest that chemotactic signals downstream of TREM-1 activation could functionally contribute to immunosuppressed states in the TME.
In our analysis of the TCGA breast tumor cohort, we observed significant positive correlations between TREM1 expression and the expression of TREM-1 target cytokines (IL1B, IL8, IL6 and CCL2) and markers of MDSCs and TAMs (CD11B/ITGAM, OLR1, CD14 and CD206/MRC1). By analyzing single-cell sequencing datasets, we further characterized cellular aspects of TREM1 expression in breast tumors and identified TREM1 transcriptional correlates indicative of myeloid TREM-1 activation in the breast TME and candidate mechanisms of pro-tumorigenic growth. In the breast TME, TREM1 expression was observed predominantly in myeloid cells that expressed markers of MDSCs and TAMs. While TREM1 expression was also observed in other cellular compartments, such as cancer cells and fibroblasts (as corroborated by IF staining results), TREM1 expression in non-myeloid cell types was sparse, and showed no correlation with downstream TREM-1 targets. In both intra-tumoral myeloid cells and monocytes induced for TREM-1 activation by Dower et al. (24), TREM1 was robustly associated with increased expression of known TREM-1 target genes (IL1B, CCL7, CXCL3, IL1RN, INHBA, IL6, IL8, CCL2), including genes with anti-inflammatory functions not generally associated with the conventional view of TREM-1 pro-inflammatory signaling in innate immunity. For example, IL1RN encodes the Interleukin 1 Receptor Antagonist cytokine that competes with IL-1 cytokines (IL-1α and IL-1β) to inhibit IL-1 signaling. As IL-1 signaling can enhance Th1 polarization, promote activation of CD8+ T cells, and facilitate T cell priming by dendritic cells (89), IL1RN could play an immune suppressive role in the TME. INHBA encodes the TGF-β family member Activin A, which has been reported to: 1) impair anti-tumor immunity by inhibiting NK cell proliferation and granzyme B production (90); 2) promote regulatory T cell infiltration into tumors treated with radiotherapy and TGF-β blockade (91); and 3) function as a Th2 cytokine to induce macrophage M2 polarization (92). SPP1, which encodes the cytokine Osteopontin, was identified in our study as one of only several genes ranked in all three datasets as a top-most significantly differentially expressed gene. Interestingly, in the Dower et al. study, SPP1 expression and Osteopontin protein levels were shown to be highly induced by TREM-1-specific activation, but not by LPS/TLR stimulation. Osteopontin, through interaction with the CD44 receptor, modulates inflammatory signaling in T cells and macrophages, and can induce migration, proliferation and survival of non-lymphoid cells. While Osteopontin can enhance activation and survival of T cells in graft-versus-host disease (93), in cancer models, Osteopontin is a newly identified immune checkpoint expressed by intra-tumoral myeloid cells that upregulates PD-L1 expression (94) and directly inhibits activation and proliferation of tumor-reactive CD8+ T cells, thereby blocking anti-tumor immunity (95). Thus, it is feasible that TREM-1 signaling in the breast TME could, through multiple different mechanisms, contribute to the blockade of specific anti-tumor immune responses. Importantly, key anti-inflammatory molecules characteristic of TAMs and MDSCs, such as TGF-β (TGFB1), IL-10 (IL10) and PD-L1 (CD274), were not consistently associated with TREM1 expression in tumors and TREM-1 activation in monocytes. These genes were also not identified among the negative immune interactors associated with reduced neoadjuvant chemotherapy response in the MDACC-701 dataset, nor were they identified with the inferior DMFS-associated genes correlated with TREM1 expression in the MC1 cohort. A plausible explanation is that these anti-inflammatory factors are not direct targets of TREM-1, or are not solely modulated by TREM-1, and therefore, are likely not major contributors to TREM-1-related tumor phenotypes.
TREM-1 paracrine signaling may also activate tumor-intrinsic pathways. MDSC-secreted factors that overlap with TREM-1 target genes, including IL-1β, TNF-α, IL-8 and IL-6, have been reported to promote angiogenesis and induce cancer cell migration, invasion, and survival (96). In co-culture experiments, TREM-1 signaling was reported to induce migration of liver cancer cells, which could be abrogated by incubation with a TREM-1-blocking peptide (65). In T-cell-deficient, but myeloid-competent mouse xenograft models, TREM-1 blockade inhibited infiltration of TAMs into pancreatic tumors, and significantly reduced formation of both human pancreatic and lung tumors (97, 98). A role for TREM-1 signaling in tumor formation is supported by studies in TREM1 knockout mice that model inflammation-driven liver cancer (99) and CRC (100). In the latter studies, TREM-1 deficiency delayed tumor formation with concomitant decreases in IL-1β and IL-6 (100). TREM-1 deficiency also reduced the number of tumor-infiltrating neutrophils in both models, with alterations observed in cytokine and chemokine profiles (100). These reports, together with our findings in breast cancer, support the emerging view that TREM-1 signaling may contribute to immunosuppressive and tumor-intrinsic cancer-promoting pathways, and may represent an oncogenic axis common to many cancer types.
Several limitations of this study are noteworthy. First, our interpretations regarding the role of TREM-1 in breast cancer are based solely on correlative analyses, statistical associations and inferences drawn from other cancer research. Second, from our studies, we cannot rule out the possibility that TREM-1 activation may, in certain instances, promote anti-tumor immunity. For example, it is possible that in some tumors, TREM-1 signaling could be triggered downstream of TLR activation which may induce a more M1-like polarization in monocytes (24) and therefore contribute to a pro-inflammatory shift in the TME; however, our findings of a lack of robust association between myeloid TREM1 and TLR gene expression suggests that such a phenomenon is not common in breast tumors. Third, how other pathological processes and pathways operative in breast cancer correlate with TREM-1 expression, the immune subclasses, or clinical endpoints cannot be comprehensively determined from this study. TREM-1 functional studies that take advantage of TREM-1-activating antibodies (101, 102) and inhibitory peptides (44, 52) in the context of murine immuno-oncology models will be necessary to test the hypotheses presented here, and to establish the therapeutic value of targeting TREM-1 in the clinical management of breast cancer.
Conclusions
This work demonstrates, for the first time, that TREM1 expression in breast tumors associates with a reduced interval to clinical metastasis and a decreased responsiveness to neoadjuvant chemotherapy. While TREM1 expression positively correlates with markers of alternatively activated macrophages and MDSCs, as well as known cytokine targets downstream of TREM-1 activation, TREM1 negatively correlates with markers of anti-tumor immunity and exhibits associations with inferior clinical outcomes in tumors with otherwise advantageous immune characteristics. Our findings fit a model where myeloid-derived TREM-1 signaling is operative in human breast tumors and antagonizes anti-tumor immune processes. Further study of the role of TREM-1 inhibition in breast cancer as a tool to overcome resistance to immune checkpoint blockade is warranted.
Data Availability Statement
Raw and processed data files have been deposited in the Gene Expression Omnibus (GEO; www.ncbi.nlm.nih.gov/geo/) and can be accessed through GEO Series accession number GSE188600.
Ethics Statement
The studies involving human participants were reviewed and approved by Wake Forest University Health Sciences Institutional Review Board. The patients/participants provided their written informed consent to participate in this study.
Author Contributions
AP and LM conceived of the study and analytical strategies. Data analyses were performed by AP, KZ, JC, JS, GJ, JWC, QS, MB, and ER, AP, MS, MH-M and QS conducted the scRNA-seq studies. AP and LM wrote the paper with critical input and technical guidance from CL, KZ, AS, YL, AT, DB, CP, and MB. All authors critically reviewed the findings, edited the paper and approved the final version to be published.
Funding
This work was supported by the American Cancer Society (RSG-12-198-01-TBG; to LM), the Mary Kirkpatrick Professorship for Breast Cancer Research (to LM) and the NIH (T32-CA079448 Cancer Biology Training Grant; to JC). This study was also supported by the Wake Forest Baptist Compressive Cancer Center’s Cancer Genomics Shared Resource (CGSR), Bioinformatics Shared Resource (BISR), and Tumor Tissue and Pathology Shared Resource (TTPSR) funded by the National Cancer Institute’s Cancer Center Support Grant award number P30CA012197. This work was also partially supported by the Indiana University Precision Health Initiative (to JS).
Author Disclaimer
The content of this publication is solely the responsibility of the authors and does not necessarily represent the official views of the National Cancer Institute.
Conflict of Interest
AS is an employee of SignaBlok, Inc. LM has an advisory role for Bristol Myers Squibb. AT has research funding (to the institution) from Sanofi, stock ownership of Gilead Sciences, Johnson and Johnson, Bristol Myers Squibb and Pfizer, and advisory roles for BeyondSpring and Lilly.
The remaining authors declare that the research was conducted in the absence of any commercial or financial relationships that could be construed as a potential conflict of interest.
Publisher’s Note
All claims expressed in this article are solely those of the authors and do not necessarily represent those of their affiliated organizations, or those of the publisher, the editors and the reviewers. Any product that may be evaluated in this article, or claim that may be made by its manufacturer, is not guaranteed or endorsed by the publisher.
Supplementary Material
The Supplementary Material for this article can be found online at: https://www.frontiersin.org/articles/10.3389/fonc.2021.734959/full#supplementary-material
References
1. Denardo DG, Brennan DJ, Rexhepaj E, Ruffell B, Shiao SL, Madden SF, et al. Leukocyte Complexity Predicts Breast Cancer Survival and Functionally Regulates Response to Chemotherapy. Cancer Discov (2011) 1:54–67. doi: 10.1158/2159-8274.CD-10-0028
2. Fridman WH, Zitvogel L, Sautes-Fridman C, Kroemer G. The Immune Contexture in Cancer Prognosis and Treatment. Nat Rev Clin Oncol (2017) 14:717–34. doi: 10.1038/nrclinonc.2017.101
3. Bindea G, Mlecnik B, Tosolini M, Kirilovsky A, Waldner M, Obenauf AC, et al. Spatiotemporal Dynamics of Intratumoral Immune Cells Reveal the Immune Landscape in Human Cancer. Immunity (2013) 39:782–95. doi: 10.1016/j.immuni.2013.10.003
4. Kitamura T, Qian BZ, Pollard JW. Immune Cell Promotion of Metastasis. Nat Rev Immunol (2015) 15:73–86. doi: 10.1038/nri3789
5. Rody A, Holtrich U, Pusztai L, Liedtke C, Gaetje R, Ruckhaeberle E, et al. T-Cell Metagene Predicts a Favorable Prognosis in Estrogen Receptor-Negative and HER2-Positive Breast Cancers. Breast Cancer Res (2009) 11:R15.bcr2234. doi: 10.1186/bcr2234
6. Thorsson V, Gibbs DL, Brown SD, Wolf D, Bortone DS, Ou Yang TH, et al. The Immune Landscape of Cancer. Immunity (2018) 48:812–30.e814. doi: 10.1016/j.immuni.2018.03.023
7. Sayaman RW, Saad M, Thorsson V, Hu D, Hendrickx W, Roelands J, et al. Germline Genetic Contribution to the Immune Landscape of Cancer. Immunity (2021) 54:367–86.e368. doi: 10.1016/j.immuni.2021.01.011
8. Nagalla S, Chou JW, Willingham MC, Ruiz J, Vaughn JP, Dubey P, et al. Interactions Between Immunity, Proliferation and Molecular Subtype in Breast Cancer Prognosis. Genome Biol (2013) 14:R34. doi: 10.1186/gb-2013-14-4-r34
9. Bedognetti D, Hendrickx W, Ceccarelli M, Miller LD, Seliger B. Disentangling the Relationship Between Tumor Genetic Programs and Immune Responsiveness. Curr Opin Immunol (2016) 39:150–8. doi: 10.1016/j.coi.2016.02.001
10. Chifman J, Pullikuth A, Chou JW, Bedognetti D, Miller LD. Conservation of Immune Gene Signatures in Solid Tumors and Prognostic Implications. BMC Cancer (2016) 16:911. doi: 10.1186/s12885-016-2948-z
11. Hendrickx W, Simeone I, Anjum S, Mokrab Y, Bertucci F, Finetti P, et al. Identification of Genetic Determinants of Breast Cancer Immune Phenotypes by Integrative Genome-Scale Analysis. Oncoimmunology (2017) 6:e1253654. doi: 10.1080/2162402X.2016.1253654
12. Bertucci F, Finetti P, Simeone I, Hendrickx W, Wang E, Marincola FM, et al. The Immunologic Constant of Rejection Classification Refines the Prognostic Value of Conventional Prognostic Signatures in Breast Cancer. Br J Cancer (2018) 119:1383–91. doi: 10.1038/s41416-018-0309-1
13. Bedognetti D, Hendrickx W, Marincola FM, Miller LD. Prognostic and Predictive Immune Gene Signatures in Breast Cancer. Curr Opin Oncol (2015) 27:433–44. doi: 10.1097/cco.0000000000000234
14. Thomas A, Routh ED, Pullikuth A, Jin G, Su J, Chou JW, et al. Tumor Mutational Burden is a Determinant of Immune-Mediated Survival in Breast Cancer. Oncoimmunology (2018) 7:e1490854. doi: 10.1080/2162402X.2018.1490854
15. Alistar A, Chou JW, Nagalla S, Black MA, D'agostino R Jr., Miller LD. Dual Roles for Immune Metagenes in Breast Cancer Prognosis and Therapy Prediction. Genome Med (2014) 6:80. doi: 10.1186/s13073-014-0080-880
16. Cristescu R, Mogg R, Ayers M, Albright A, Murphy E, Yearley J, et al. Pan-Tumor Genomic Biomarkers for PD-1 Checkpoint Blockade-Based Immunotherapy. Science (2018) 362:eaar3593. doi: 10.1126/science.aar3593
17. Hwang S, Kwon AY, Jeong JY, Kim S, Kang H, Park J, et al. Immune Gene Signatures for Predicting Durable Clinical Benefit of Anti-PD-1 Immunotherapy in Patients With non-Small Cell Lung Cancer. Sci Rep (2020) 10:643. doi: 10.1038/s41598-019-57218-9
18. Roelands J, Hendrickx W, Zoppoli G, Mall R, Saad M, Halliwill K, et al. Oncogenic States Dictate the Prognostic and Predictive Connotations of Intratumoral Immune Response. J Immunother Cancer (2020) 8:e000617. doi: 10.1136/jitc-2020-000617
19. Newman AM, Liu CL, Green MR, Gentles AJ, Feng W, Xu Y, et al. Robust Enumeration of Cell Subsets From Tissue Expression Profiles. Nat Methods (2015) 12:453–7. doi: 10.1038/nmeth.3337
20. Miller LD, Chou JA, Black MA, Print C, Chifman J, Alistar A, et al. Immunogenic Subtypes of Breast Cancer Delineated by Gene Classifiers of Immune Responsiveness. Cancer Immunol Res (2016) 4:600–10. doi: 10.1158/2326-6066.CIR-15-0149
21. Colonna M. TREMs in the Immune System and Beyond. Nat Rev Immunol (2003) 3:445–53. doi: 10.1038/nri1106nri1106
22. Tammaro A, Stroo I, Rampanelli E, Blank F, Butter LM, Claessen N, et al. Role of TREM1-DAP12 in Renal Inflammation During Obstructive Nephropathy. PloS One (2013) 8:e82498. doi: 10.1371/journal.pone.0082498
23. Edgar R, Barrett T. NCBI GEO Standards and Services for Microarray Data. Nat Biotechnol (2006) 24:1471–2. doi: 10.1038/nbt1206-1471
24. Dower K, Ellis DK, Saraf K, Jelinsky SA, Lin LL. Innate Immune Responses to TREM-1 Activation: Overlap, Divergence, and Positive and Negative Cross-Talk With Bacterial Lipopolysaccharide. J Immunol (2008) 180:3520–34. doi: 10.4049/jimmunol.180.5.3520
25. Denkert C, Loibl S, Noske A, Roller M, Muller BM, Komor M, et al. Tumor-Associated Lymphocytes as an Independent Predictor of Response to Neoadjuvant Chemotherapy in Breast Cancer. J Clin Oncol (2010) 28:105–13. doi: 10.1200/JCO.2009.23.7370
26. Ono M, Tsuda H, Shimizu C, Yamamoto S, Shibata T, Yamamoto H, et al. Tumor-Infiltrating Lymphocytes are Correlated With Response to Neoadjuvant Chemotherapy in Triple-Negative Breast Cancer. Breast Cancer Res Treat (2012) 132:793–805. doi: 10.1007/s10549-011-1554-7
27. Dennis G Jr., Sherman BT, Hosack DA, Yang J, Gao W, Lane HC, et al. DAVID: Database for Annotation, Visualization, and Integrated Discovery. Genome Biol (2003) 4:P3. doi: 10.1186/gb-2003-4-5-p3
28. Benita Y, Cao Z, Giallourakis C, Li C, Gardet A, Xavier RJ. Gene Enrichment Profiles Reveal T-Cell Development, Differentiation, and Lineage-Specific Transcription Factors Including ZBTB25 as a Novel NF-AT Repressor. Blood (2010) 115:5376–84. doi: 10.1182/blood-2010-01-263855
29. Ritchie ME, Phipson B, Wu D, Hu Y, Law CW, Shi W, et al. Limma Powers Differential Expression Analyses for RNA-Sequencing and Microarray Studies. Nucleic Acids Res (2015) 43(7):e47. doi: 10.1093/nar/gkv007
30. Gentles AJ, Newman AM, Liu CL, Bratman SV, Feng W, Kim D, et al. The Prognostic Landscape of Genes and Infiltrating Immune Cells Across Human Cancers. Nat Med (2015) 21:938–45. doi: 10.1038/nm.3909
31. Team, R.C. R: A Language and Environment for Statistical Computing. Vienna, Austria: R Foundation for Statistical Computing (2016).
32. Warnes GR, Bolker B, Bonebakker L, Gentleman E, Huber W, Liaw A, et al. Gplots: Various R Programming Tools for Ploting Data. R Pacakge Version 3.0.1. (2016). Available at: https://rdrr.io/cran/gplots/.
33. Li B, Severson E, Pignon JC, Zhao H, Li T, Novak J, et al. Comprehensive Analyses of Tumor Immunity: Implications for Cancer Immunotherapy. Genome Biol (2016) 17:174. doi: 10.1186/s13059-016-1028-7
34. Zheng GX, Terry JM, Belgrader P, Ryvkin P, Bent ZW, Wilson R, et al. Massively Parallel Digital Transcriptional Profiling of Single Cells. Nat Commun (2017) 8:14049. doi: 10.1038/ncomms14049
35. Acuff NV, Linden J. Using Visualization of T-Distributed Stochastic Neighbor Embedding To Identify Immune Cell Subsets in Mouse Tumors. J Immunol (2017) 198:4539–46. doi: 10.4049/jimmunol.1602077
36. Yu D, Huber W, Vitek O. Shrinkage Estimation of Dispersion in Negative Binomial Models for RNA-Seq Experiments With Small Sample Size. Bioinformatics (2013) 29:1275–82. doi: 10.1093/bioinformatics/btt143
37. Robinson MD, Smyth GK. Moderated Statistical Tests for Assessing Differences in Tag Abundance. Bioinformatics (2007) 23:2881–7. doi: 10.1093/bioinformatics/btm453
38. Bassez A, Vos H, Van Dyck L, Floris G, Arijs I, Desmedt C, et al. A Single-Cell Map of Intratumoral Changes During Anti-PD1 Treatment of Patients With Breast Cancer. Nat Med (2021) 27:820–32. doi: 10.1038/s41591-021-01323-8
39. Tri Le TP, Pham M, Tran D, Lam L, Nguyen T, Truong T, et al. BBrowser: Making Single-Cell Data Easily Accessible. BioRxiv (2020). doi: 10.1101/2020.12.11.414136
40. Butler A, Hoffman P, Smibert P, Papalexi E, Satija R. Integrating Single-Cell Transcriptomic Data Across Different Conditions, Technologies, and Species. Nat Biotechnol (2018) 36:411–20. doi: 10.1038/nbt.4096
41. Mao Y, Qu Q, Zhang Y, Liu J, Chen X, Shen K. The Value of Tumor Infiltrating Lymphocytes (TILs) for Predicting Response to Neoadjuvant Chemotherapy in Breast Cancer: A Systematic Review and Meta-Analysis. PloS One (2014) 9:e115103. doi: 10.1371/journal.pone.0115103
42. Dieci MV, Miglietta F, Guarneri V. Immune Infiltrates in Breast Cancer: Recent Updates and Clinical Implications. Cells (2021) 10:223. doi: 10.3390/cells10020223
43. Tammaro A, Derive M, Gibot S, Leemans JC, Florquin S, Dessing MC. TREM-1 and its Potential Ligands in non-Infectious Diseases: From Biology to Clinical Perspectives. Pharmacol Ther (2017) 177:81–95. doi: 10.1016/j.pharmthera.2017.02.043
44. Wu Q, Zhou W, Yin S, Zhou Y, Chen T, Qian J, et al. Blocking Triggering Receptor Expressed on Myeloid Cells-1-Positive Tumor-Associated Macrophages Induced by Hypoxia Reverses Immunosuppression and Anti-Programmed Cell Death Ligand 1 Resistance in Liver Cancer. Hepatology (2019) 70:198–214. doi: 10.1002/hep.30593
45. Roelands J, Decock J, Boughorbel S, Rinchai D, Maccalli C, Ceccarelli M, et al. A Collection of Annotated and Harmonized Human Breast Cancer Transcriptome Datasets, Including Immunologic Classification. F1000Res (2017) 6:296. doi: 10.12688/f1000research.10960.2
46. Bouchon A, Dietrich J, Colonna M. Cutting Edge: Inflammatory Responses can be Triggered by TREM-1, a Novel Receptor Expressed on Neutrophils and Monocytes. J Immunol (2000) 164:4991–5. doi: 10.4049/jimmunol.164.10.4991
47. Bouchon A, Facchetti F, Weigand MA, Colonna M. TREM-1 Amplifies Inflammation and is a Crucial Mediator of Septic Shock. Nature (2001) 410:1103–7. doi: 10.1038/3507411435074114
48. Bronte V, Brandau S, Chen SH, Colombo MP, Frey AB, Greten TF, et al. Recommendations for Myeloid-Derived Suppressor Cell Nomenclature and Characterization Standards. Nat Commun (2016) 7:12150. doi: 10.1038/ncomms12150
49. Condamine T, Domiguez GA, Youn JI, Kossenkov AV, Mony S, Alicea-Torres K, et al. Lectin-Type Oxidized LDL Receptor-1 Distinguishes Population of Human Polymorphonuclear Myeloid-Derived Suppressor Cells in Cancer Patients. Sci Immunol (2016) 1:1–15. doi: 10.1126/sciimmunol.aaf8943
50. Deczkowska A, Weiner A, Amit I. The Physiology, Pathology, and Potential Therapeutic Applications of the TREM2 Signaling Pathway. Cell (2020) 181:1207–17. doi: 10.1016/j.cell.2020.05.003
51. Thankam FG, Dilisio MF, Dougherty KA, Dietz NE, Agrawal DK. Triggering Receptor Expressed on Myeloid Cells and 5'adenosine Monophosphate-Activated Protein Kinase in the Inflammatory Response: A Potential Therapeutic Target. Expert Rev Clin Immunol (2016) 12:1239–49. doi: 10.1080/1744666X.2016.1196138
52. Pelham CJ, Pandya AN, Agrawal DK. Triggering Receptor Expressed on Myeloid Cells Receptor Family Modulators: A Patent Review. Expert Opin Ther Pat (2014) 24:1383–95. doi: 10.1517/13543776.2014.977865
53. Arts RJ, Joosten LA, Dinarello CA, Kullberg BJ, van der Meer JW, Netea MG. TREM-1 Interaction With the LPS/TLR4 Receptor Complex. Eur Cytokine Netw (2011) 22:11–4. doi: 10.1684/ecn.2011.0274
54. Roe K, Gibot S, Verma S. Triggering Receptor Expressed on Myeloid Cells-1 (TREM-1): A New Player in Antiviral Immunity? Front Microbiol (2014) 5:627. doi: 10.3389/fmicb.2014.00627
55. Yuan Z, Syed MA, Panchal D, Joo M, Colonna M, Brantly M, et al. Triggering Receptor Expressed on Myeloid Cells 1 (TREM-1)-Mediated Bcl-2 Induction Prolongs Macrophage Survival. J Biol Chem (2014) 289:15118–29. doi: 10.1074/jbc.M113.536490
56. Bleharski JR, Kiessler V, Buonsanti C, Sieling PA, Stenger S, Colonna M, et al. A Role for Triggering Receptor Expressed on Myeloid Cells-1 in Host Defense During the Early-Induced and Adaptive Phases of the Immune Response. J Immunol (2003) 170:3812–8. doi: 10.4049/jimmunol.170.7.3812
57. Lo TH, Tseng KY, Tsao WS, Yang CY, Hsieh SL, Chiu AW, et al. TREM-1 Regulates Macrophage Polarization in Ureteral Obstruction. Kidney Int (2014) 86:1174–86. doi: 10.1038/ki.2014.205S0085-2538(15)30452-X
58. Shalapour S, Karin M. Immunity, Inflammation, and Cancer: An Eternal Fight Between Good and Evil. J Clin Invest (2015) 125:3347–55. doi: 10.1172/JCI8000780007
59. Wang D, Dubois RN. Immunosuppression Associated With Chronic Inflammation in the Tumor Microenvironment. Carcinogenesis (2015) 36:1085–93. doi: 10.1093/carcin/bgv123
60. Colombo MP, Trinchieri G. Interleukin-12 in Anti-Tumor Immunity and Immunotherapy. Cytokine Growth Factor Rev (2002) 13:155–68. doi: 10.1016/s1359-6101(01)00032-6
61. Sims GP, Rowe DC, Rietdijk ST, Herbst R, Coyle AJ. HMGB1 and RAGE in Inflammation and Cancer. Annu Rev Immunol (2010) 28:367–88. doi: 10.1146/annurev.immunol.021908.132603
62. Flohr AM, Rogalla P, Meiboom M, Borrmann L, Krohn M, Thode-Halle B, et al. Variation of HMGB1 Expression in Breast Cancer. Anticancer Res (2001) 21:3881–5.
63. Sohun M, Shen H. The Implication and Potential Applications of High-Mobility Group Box 1 Protein in Breast Cancer. Ann Transl Med (2016) 4:217. doi: 10.21037/atm.2016.05.36
64. Ho CC, Liao WY, Wang CY, Lu YH, Huang HY, Chen HY, et al. TREM-1 Expression in Tumor-Associated Macrophages and Clinical Outcome in Lung Cancer. Am J Respir Crit Care Med (2008) 177:763–70. doi: 10.1164/rccm.200704-641OC
65. Liao R, Sun TW, Yi Y, Wu H, Li YW, Wang JX, et al. Expression of TREM-1 in Hepatic Stellate Cells and Prognostic Value in Hepatitis B-Related Hepatocellular Carcinoma. Cancer Sci (2012) 103:984–92. doi: 10.1111/j.1349-7006.2012.02273.x
66. Kuemmel A, Alflen A, Schmidt LH, Sebastian M, Wiewrodt R, Schulze AB, et al. Soluble Triggering Receptor Expressed on Myeloid Cells 1 in Lung Cancer. Sci Rep (2018) 8:10766. doi: 10.1038/s41598-018-28971-0
67. Murat A, Migliavacca E, Hussain SF, Heimberger AB, Desbaillets I, Hamou MF, et al. Modulation of Angiogenic and Inflammatory Response in Glioblastoma by Hypoxia. PloS One (2009) 4:e5947. doi: 10.1371/journal.pone.0005947
68. Kim SK, Kim SY, Kim JH, Roh SA, Cho DH, Kim YS, et al. A Nineteen Gene-Based Risk Score Classifier Predicts Prognosis of Colorectal Cancer Patients. Mol Oncol (2014) 8:1653–66. doi: 10.1016/j.molonc.2014.06.016
69. Rojas MA, Shen ZT, Caldwell RB, Sigalov AB. Blockade of TREM-1 Prevents Vitreoretinal Neovascularization in Mice With Oxygen-Induced Retinopathy. Biochim Biophys Acta Mol Basis Dis (2018) 1864:2761–8. doi: 10.1016/j.bbadis.2018.05.001
70. Markowitz J, Wesolowski R, Papenfuss T, Brooks TR, Carson WE 3rd. Myeloid-Derived Suppressor Cells in Breast Cancer. Breast Cancer Res Treat (2013) 140:13–21. doi: 10.1007/s10549-013-2618-7
71. Marvel D, Gabrilovich DI. Myeloid-Derived Suppressor Cells in the Tumor Microenvironment: Expect the Unexpected. J Clin Invest (2015) 125:3356–64. doi: 10.1172/JCI80005
72. Fleming V, Hu X, Weber R, Nagibin V, Groth C, Altevogt P, et al. Targeting Myeloid-Derived Suppressor Cells to Bypass Tumor-Induced Immunosuppression. Front Immunol (2018) 9:398. doi: 10.3389/fimmu.2018.00398
73. Huang B, Lei Z, Zhao J, Gong W, Liu J, Chen Z, et al. CCL2/CCR2 Pathway Mediates Recruitment of Myeloid Suppressor Cells to Cancers. Cancer Lett (2007) 252:86–92. doi: 10.1016/j.canlet.2006.12.012
74. Yang L, Huang J, Ren X, Gorska AE, Chytil A, Aakre M, et al. Abrogation of TGF Beta Signaling in Mammary Carcinomas Recruits Gr-1+CD11b+ Myeloid Cells That Promote Metastasis. Cancer Cell (2008) 13:23–35. doi: 10.1016/j.ccr.2007.12.004S1535-6108(07)00373-X
75. David JM, Dominguez C, Hamilton DH, Palena C. The IL-8/IL-8r Axis: A Double Agent in Tumor Immune Resistance. Vaccines (Basel) (2016) 4:22. doi: 10.3390/vaccines4030022E22
76. Tu S, Bhagat G, Cui G, Takaishi S, Kurt-Jones EA, Rickman B, et al. Overexpression of Interleukin-1beta Induces Gastric Inflammation and Cancer and Mobilizes Myeloid-Derived Suppressor Cells in Mice. Cancer Cell (2008) 14:408–19. doi: 10.1016/j.ccr.2008.10.011S1535-6108(08)00334-6
77. Bierie B, Moses HL. Transforming Growth Factor Beta (TGF-Beta) and Inflammation in Cancer. Cytokine Growth Factor Rev (2010) 21:49–59. doi: 10.1016/j.cytogfr.2009.11.008
78. Elkabets M, Ribeiro VS, Dinarello CA, Ostrand-Rosenberg S, Di Santo JP, Apte RN, et al. IL-1beta Regulates a Novel Myeloid-Derived Suppressor Cell Subset That Impairs NK Cell Development and Function. Eur J Immunol (2010) 40:3347–57. doi: 10.1002/eji.201041037
79. Zhou Z, French DL, Ma G, Eisenstein S, Chen Y, Divino CM, et al. Development and Function of Myeloid-Derived Suppressor Cells Generated From Mouse Embryonic and Hematopoietic Stem Cells. Stem Cells (2010) 28:620–32. doi: 10.1002/stem.301
80. Zhao X, Rong L, Zhao X, Li X, Liu X, Deng J, et al. TNF Signaling Drives Myeloid-Derived Suppressor Cell Accumulation. J Clin Invest (2012) 122:4094–104. doi: 10.1172/JCI64115
81. Narita Y, Kitamura H, Wakita D, Sumida K, Masuko K, Terada S, et al. The Key Role of IL-6-Arginase Cascade for Inducing Dendritic Cell-Dependent CD4(+) T Cell Dysfunction in Tumor-Bearing Mice. J Immunol (2013) 190:812–20. doi: 10.4049/jimmunol.1103797
82. Sade-Feldman M, Kanterman J, Ish-Shalom E, Elnekave M, Horwitz E, Baniyash M. Tumor Necrosis Factor-Alpha Blocks Differentiation and Enhances Suppressive Activity of Immature Myeloid Cells During Chronic Inflammation. Immunity (2013) 38:541–54. doi: 10.1016/j.immuni.2013.02.007
83. Xu M, Zhao Z, Song J, Lan X, Lu S, Chen M, et al. Interactions Between Interleukin-6 and Myeloid-Derived Suppressor Cells Drive the Chemoresistant Phenotype of Hepatocellular Cancer. Exp Cell Res (2017) 351:142–9. doi: 10.1016/j.yexcr.2017.01.008
84. Fridlender ZG, Buchlis G, Kapoor V, Cheng G, Sun J, Singhal S, et al. CCL2 Blockade Augments Cancer Immunotherapy. Cancer Res (2010) 70:109–18. doi: 10.1158/0008-5472.CAN-09-2326
85. Fridlender ZG, Kapoor V, Buchlis G, Cheng G, Sun J, Wang LC, et al. Monocyte Chemoattractant Protein-1 Blockade Inhibits Lung Cancer Tumor Growth by Altering Macrophage Phenotype and Activating CD8+ Cells. Am J Respir Cell Mol Biol (2011) 44:230–7. doi: 10.1165/rcmb.2010-0080OC
86. Sumida K, Wakita D, Narita Y, Masuko K, Terada S, Watanabe K, et al. Anti-IL-6 Receptor mAb Eliminates Myeloid-Derived Suppressor Cells and Inhibits Tumor Growth by Enhancing T-Cell Responses. Eur J Immunol (2012) 42:2060–72. doi: 10.1002/eji.201142335
87. Holmgaard RB, Zamarin D, Lesokhin A, Merghoub T, Wolchok JD. Targeting Myeloid-Derived Suppressor Cells With Colony Stimulating Factor-1 Receptor Blockade can Reverse Immune Resistance to Immunotherapy in Indoleamine 2,3-Dioxygenase-Expressing Tumors. EBioMedicine (2016) 6:50–8. doi: 10.1016/j.ebiom.2016.02.024
88. Ohno Y, Toyoshima Y, Yurino H, Monma N, Xiang H, Sumida K, et al. Lack of Interleukin-6 in the Tumor Microenvironment Augments Type-1 Immunity and Increases the Efficacy of Cancer Immunotherapy. Cancer Sci (2017) 108:1959–66. doi: 10.1111/cas.13330
89. Van Den Eeckhout B, Tavernier J, Gerlo S. Interleukin-1 as Innate Mediator of T Cell Immunity. Front Immunol (2020) 11:621931. doi: 10.3389/fimmu.2020.621931
90. Rautela J, Dagley LF, De Oliveira CC, Schuster IS, Hediyeh-Zadeh S, Delconte RB, et al. Therapeutic Blockade of Activin-A Improves NK Cell Function and Antitumor Immunity. Sci Signal (2019) 12:eaat7527. doi: 10.1126/scisignal.aat7527
91. De Martino M, Daviaud C, Diamond JM, Kraynak J, Alard A, Formenti SC, et al. Activin A Promotes Regulatory T-Cell-Mediated Immunosuppression in Irradiated Breast Cancer. Cancer Immunol Res (2021) 9:89–102. doi: 10.1158/2326-6066.CIR-19-0305
92. Ogawa K, Funaba M, Chen Y, Tsujimoto M. Activin A Functions as a Th2 Cytokine in the Promotion of the Alternative Activation of Macrophages. J Immunol (2006) 177:6787–94. doi: 10.4049/jimmunol.177.10.6787
93. Zhao F, Zhang Y, Wang H, Jin M, He S, Shi Y, et al. Blockade of Osteopontin Reduces Alloreactive CD8+ T Cell-Mediated Graft-Versus-Host Disease. Blood (2011) 117:1723–33. doi: 10.1182/blood-2010-04-281659
94. Zhang Y, Du W, Chen Z, Xiang C. Upregulation of PD-L1 by SPP1 Mediates Macrophage Polarization and Facilitates Immune Escape in Lung Adenocarcinoma. Exp Cell Res (2017) 359:449–57. doi: 10.1016/j.yexcr.2017.08.028
95. Klement JD, Paschall AV, Redd PS, Ibrahim ML, Lu C, Yang D, et al. An Osteopontin/CD44 Immune Checkpoint Controls CD8+ T Cell Activation and Tumor Immune Evasion. J Clin Invest (2018) 128:5549–60. doi: 10.1172/JCI123360
96. Condamine T, Ramachandran I, Youn JI, Gabrilovich DI. Regulation of Tumor Metastasis by Myeloid-Derived Suppressor Cells. Annu Rev Med (2015) 66:97–110. doi: 10.1146/annurev-med-051013-052304
97. Sigalov AB. A Novel Ligand-Independent Peptide Inhibitor of TREM-1 Suppresses Tumor Growth in Human Lung Cancer Xenografts and Prolongs Survival of Mice With Lipopolysaccharide-Induced Septic Shock. Int Immunopharmacol (2014) 21:208–19. doi: 10.1016/j.intimp.2014.05.001
98. Shen ZT, Sigalov AB. Novel TREM-1 Inhibitors Attenuate Tumor Growth and Prolong Survival in Experimental Pancreatic Cancer. Mol Pharm (2017) 14:4572–82. doi: 10.1021/acs.molpharmaceut.7b00711
99. Wu J, Li J, Salcedo R, Mivechi NF, Trinchieri G, Horuzsko A. The Proinflammatory Myeloid Cell Receptor TREM-1 Controls Kupffer Cell Activation and Development of Hepatocellular Carcinoma. Cancer Res (2012) 72:3977–86. doi: 10.1158/0008-5472.CAN-12-0938
100. Saurer L, Zysset D, Rihs S, Mager L, Gusberti M, Simillion C, et al. TREM-1 Promotes Intestinal Tumorigenesis. Sci Rep (2017) 7:14870. doi: 10.1038/s41598-017-14516-4
101. Gibot S, Kolopp-Sarda MN, Bene MC, Bollaert PE, Lozniewski A, Mory F, et al. A Soluble Form of the Triggering Receptor Expressed on Myeloid Cells-1 Modulates the Inflammatory Response in Murine Sepsis. J Exp Med (2004) 200:1419–26. doi: 10.1084/jem.20040708
Keywords: TREM-1, tumor infiltrating myeloid cells, transcriptomics, immune signature, cytokines, breast cancer, immune suppression
Citation: Pullikuth AK, Routh ED, Zimmerman KD, Chifman J, Chou JW, Soike MH, Jin G, Su J, Song Q, Black MA, Print C, Bedognetti D, Howard-McNatt M, O’Neill SS, Thomas A, Langefeld CD, Sigalov AB, Lu Y and Miller LD (2021) Bulk and Single-Cell Profiling of Breast Tumors Identifies TREM-1 as a Dominant Immune Suppressive Marker Associated With Poor Outcomes. Front. Oncol. 11:734959. doi: 10.3389/fonc.2021.734959
Received: 01 July 2021; Accepted: 15 November 2021;
Published: 08 December 2021.
Edited by:
Mariana Segovia, National Autonomous University of Mexico, MexicoReviewed by:
Camila O Dos Santos, Cold Spring Harbor Laboratory, United StatesSamantha Henry, Cold Spring Harbor Laboratory, United States, contributed to the review of CDS
Helioswilton Sales-Campos, Universidade Federal de Goiás, Brazil
Copyright © 2021 Pullikuth, Routh, Zimmerman, Chifman, Chou, Soike, Jin, Su, Song, Black, Print, Bedognetti, Howard-McNatt, O’Neill, Thomas, Langefeld, Sigalov, Lu and Miller. This is an open-access article distributed under the terms of the Creative Commons Attribution License (CC BY). The use, distribution or reproduction in other forums is permitted, provided the original author(s) and the copyright owner(s) are credited and that the original publication in this journal is cited, in accordance with accepted academic practice. No use, distribution or reproduction is permitted which does not comply with these terms.
*Correspondence: Lance D. Miller, bGRtaWxsZXJAd2FrZWhlYWx0aC5lZHU=