- 1Department of Radiology, Jinshan Hospital, Fudan University, Shanghai, China
- 2Department of Diagnostic and Interventional Radiology, Shanghai Jiao Tong University Affiliated Sixth People’s Hospital, Shanghai, China
- 3Precision Health Institution, GE Healthcare, Shanghai, China
- 4Department of Radiology, Obstetrics & Gynecology Hospital, Fudan University, Shanghai, China
Background: Ovarian preservation treatment (OPT) was recommended in young women with early-stage endometrial cancer [superficial myometrial invasion (MI) and grades (G) 1/2-endometrioid adenocarcinoma (EEC)]. A radiomics nomogram was developed to assist radiologists in assessing the depth of MI and in selecting eligible patients for OPT.
Methods: From February 2014 to May 2021, 209 G 1/2-EEC patients younger than 45 years (mean 39 ± 4.3 years) were included. Of them, 104 retrospective patients were enrolled in the primary group, and 105 prospective patients were enrolled in the validation group. The radiomics features were extracted based on multi-parametric magnetic resonance imaging, and the least absolute shrinkage and selection operator algorithm was applied to reduce the dimensionality of the data and select the radiomics features that correlated with the depth of MI in G 1/2-EEC patients. A radiomics nomogram for evaluating the depth of MI was developed by combing the selected radiomics features with the cancer antigen 125 and tumor size. Receiver operating characteristic (ROC) curves were used to evaluate the diagnostic performance of the radiomics nomogram and of radiologists without and with the aid of the radiomics nomogram. The net reclassification index (NRI) and total integrated discrimination index (IDI) based on the total included patients to assess the clinical benefit of radiologists with the radiomics nomogram were calculated.
Results: In the primary group, for evaluating the depth of MI, the AUCs were 0.96 for the radiomics nomogram; 0.80 and 0.86 for radiologists 1 and 2 without the aid of the nomogram, respectively; and 0.98 and 0.98 for radiologists 1 and 2 with the aid of the nomogram, respectively. In the validation group, the AUCs were 0.88 for the radiomics nomogram; 0.82 and 0.83 for radiologists 1 and 2 without the aid of the nomogram, respectively; and 0.94 and 0.94 for radiologists 1 and 2 with the aid of the nomogram, respectively. The yielded NRI and IDI values were 0.29 and 0.43 for radiologist 1 and 0.23 and 0.37 for radiologist 2, respectively.
Conclusions: The radiomics nomogram outperformed radiologists and could help radiologists in assessing the depth of MI and selecting eligible OPTs in G 1/2-EEC patients.
Introduction
Endometrial cancer (EC) is the most common gynecological cancer in developed countries (1). Approximately 11% of EC patients are diagnosed before the age of 50, and 5% are diagnosed before the age of 40 (2). Staging surgery (including hysterectomy and bilateral salpingo-oophorectomy [BSO]) is the primary treatment for EC. Adequate preoperative staging and triage are essential for determining the surgical procedures and adjuvant therapy.
However, BSO results in the abrupt disruption of hormone levels, with short-term intense menopausal symptoms that can compromise one’s quality of life and lead to osteoporosis, metabolic syndrome, and cardiovascular disease (3, 4). Studies have suggested that BSO and ovarian preservation treatment (OPT) have similar mortality in young women with early-stage EC and that OPT does not decrease the overall survival of these patients (5–7). Furthermore, young patients with early-stage EC are more likely to die from cardiovascular diseases than from EC (5). Thus, the decision to preserve the ovaries in young EC patients is critical. More recently, studies recommended that OPT can be considered for patients younger than 45 years with early-stage EC [grade 1 and 2 (G 1/2) endometrioid adenocarcinoma (EEC), and myometrial invasion (MI) < 50%] and without ovarian mass (8–10).
Dilatation and curettage (D&C) and magnetic resonance imaging (MRI) are two recommended ways to preoperatively evaluate the tumor grade and EC staging (11, 12). Radiomics is an emerging technology that correlates image-based features with clinically relevant oncological outcomes. Studies suggest that quantitative radiomics or texture features may be useful for evaluating the deep myometrial invasion (DMI), with a similar accuracy of 84.8% compared with the subjective interpretation by experienced radiologists (13, 14). Moreover, tumor size or volume as determined on MRI is also useful for evaluating the depth of MI (11, 15). The radiomics nomogram includes a numerical probability of important clinical tumor diagnostic information and is considered a useful tool for quantifying tumor risk factors (16–18).
Therefore, in this study, we developed an MRI radiomics nomogram to assist radiologists in selecting eligible candidates for OPT by assessing DMI in G 1/2-EEC patients younger than 45 years.
Materials and Methods
Patients
The Institutional Review Board approved this study (approval number 2020-10). Informed consent was obtained. From February 2014 to September 2019, the electronic medical records of a total of 135 consecutive histopathologically proven EC patients under 45 years of age were reviewed.
Potential candidates for this study met the following criteria: 1) premenopausal patients younger than 45 years; 2) patients who underwent total hysterectomy with BSO and were histopathologically diagnosed with G1/2 and early-stage (International Federation of Gynecology and Obstetrics [FIGO] stages I–II) EEC; 3) patients without other or previous malignancies in the reproductive system, without family history of breast cancer, ovarian cancer, or Lynch syndrome; and 4) patients who underwent MRI scanning with sequences of T2-weighted imaging (T2WI), contrast-enhanced T1-weighted imaging (CE-T1WI), diffusion-weighted imaging (DWI), and apparent diffusion coefficient (ADC) maps. The exclusion criteria were as follows: 1) receiving anticancer treatment before surgery (n = 1); 2) absence of preoperative pelvic MRI (n = 9); 3) poor imaging quality due to artifacts or tumor invisible on MRI (n = 3); 4) no total hysterectomy performed (n = 5); 5) patients diagnosed with G3 EEC or non-EEC, or having a history of other cancer (n = 1); or 6) without serum cancer antigen 125 (CA125) information (n = 12). Furthermore, from September 2019 to May 2021, another 105 eligible EEC out of 109 patients were prospectively enrolled and formed the validation group. Figure 1 shows the workflow of this study.
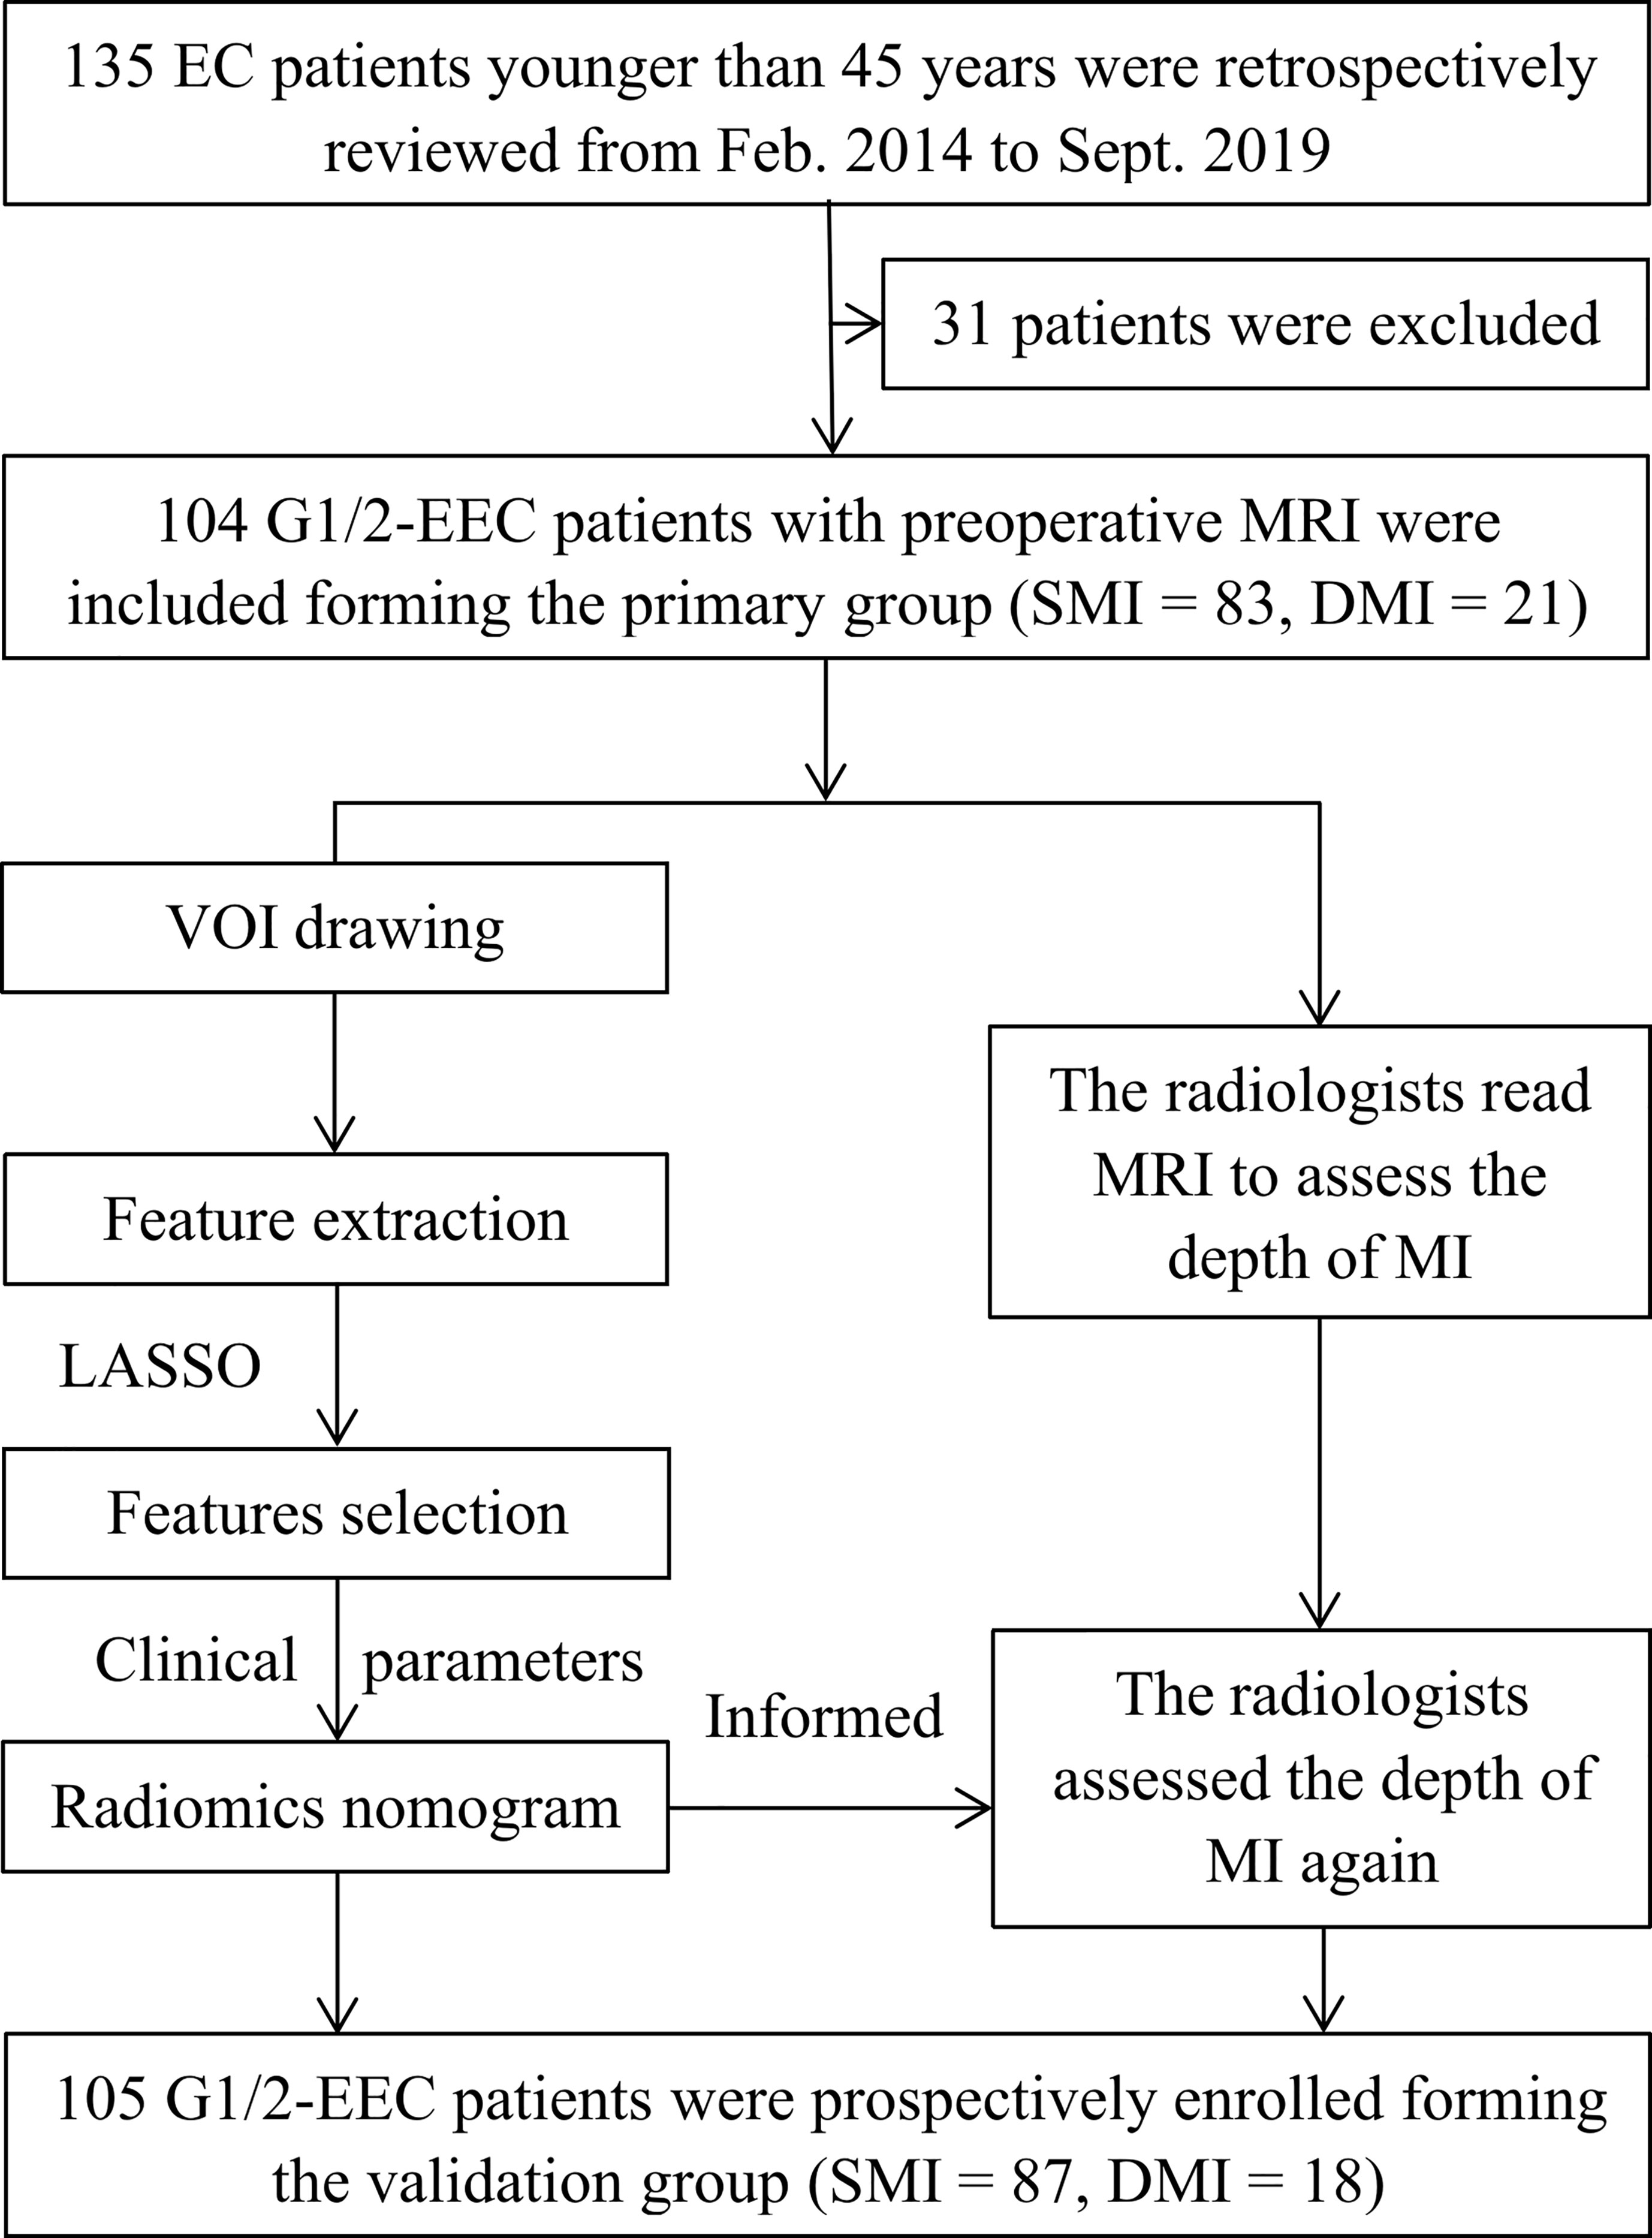
Figure 1 The workflow of this study. G 1/2, grade 1 and 2; DMI, deep myometrial invasion; EC, endometrial cancer; EEC, endometrioid adenocarcinoma; SMI, superficial myometrial invasion; MI, myometrial invasion; LASSO, least absolute shrinkage and selection operator.
General clinical information, including age and tumor size (tumor maximum diameter measured retrospectively on T2WI), and CA125 from preoperative information, ER (estrogen receptor), PR (progesterone receptor), Ki67, and CK7 from postoperative pathology were collected. The univariate and multivariate logistic regression analyses were performed to analyze the predictive factors for DMI in G 1/2-EECs for OPT. The tumor stage was determined according to the 2014 FIGO staging system based on the final pathologic reports.
Imaging
All enrolled patients received pelvic MRI within 30 days before surgery. The mean interval between MRI and surgery was 20 days (range, 5–26 days). MRI was performed using 1.5-T scanners (Avanto, Siemens, Erlangen, Germany) with an eight-channel pelvic phased-array coil. The patients lay supine and breathed freely during acquisition. The following sequences were obtained with a field of view (FOV) of 360 × 280 mm; axial T1WI (time of repetition [TR]/time of echo [TE] = 761/10 ms, matrix = 256 × 256, thickness = 4 mm); axial T2WI (TR/TE = 4,000/98, matrix = 256 × 256, thickness = 4 mm) with and without fat saturation (FS), coronal T2WI (FOV 400 mm, TR/TE = 3849/83 ms, matrix 320 × 256, thickness = 4 mm, slice gap = 1 mm), and sagittal T2WI (FOV 270 mm, TR/TE = 4,490/83 ms, matrix 320 × 256, thickness = 4 mm, slice gap = 1 mm); axial DWI (TR/TE = 4,000/100 ms, b = 0, 1,000 s/mm2, matrix = 128 × 128, thickness = 5 mm); and axial CE-T1WI with FS (TR/TE = 196/2.9 ms, matrix = 128 × 128, thickness = 4 mm) and sagittal CE-T1WI with FS (FOV 400 mm, TR/TE = 439/10 ms, thickness = 4 mm, matrix 320 × 256). CE-T1WI with FS was performed at the arterial phase (30–40 s), venous phase (75–90 s), and delayed phase (120–180 s) after the intravenous administration of gadopentetate dimeglumine (0.5 mmol/ml, GE Healthcare, Shanghai, China) at a dose of 0.2 mmol/kg of body weight and a rate of 2 to 3 ml/s. An ADC map was automatically generated based on DWI (b = 0 and b = 1000 s/mm2).
Radiomics Feature Extraction
The patients’ images were first imported into MITK Workbench software (http://mitk.org/wiki/The_Medical_Imaging_Interaction_Toolkit_ (MITK)). The multisequence images from axial DWI, ADC map, and CE-T1WI-FS (delay phase) were subsequently aligned to axial T2WI images. Regions of interest (ROIs) were manually drawn by radiologist 1 (with 5 years of MRI experience in gynecological imaging) along the tumor margin on each T2WI slice and automatically matched to T1WI, DWI (1,000 s/mm2), ADC map, and CE sequences. After tumor segmentation, a 3D volume of interest (VOI) was obtained by resampling the image with sitkBSpline interpolator. The radiomics features were extracted using Pyradiomics (https://pypi.org/project/pyradiomics/). Imaging preprocessing was performed to ensure comparability of MRI gray values, and a fixed bin width of 1 was used to compute textural features. All radiomics feature implementations followed the IBSI recommendation (https://arxiv.org/abs/1612.07003).
Feature Selection
One month later, 50 patients were randomly chosen, and tumors were drawn by radiologist 1 repeatedly and by radiologist 2 (with 10 years of MRI experience in gynecological imaging) independently. The interclass and intraclass correlation coefficients (ICCs) of the extracted features were calculated to assess the reproducibility of radiomics features. We devised a three-step procedure for dimensionality reduction and selection of robust features (19). Firstly, features with both interclass and intraclass ICCs larger than 0.75 were considered robust and reproducible (20). Secondly, Pearson’s correlation was used to identify redundant features and the feature was selected for subsequent investigation. If two features had a Pearson correlation coefficient > 0.9 (21), the feature with the larger mean absolute coefficient was removed. Thirdly, the least absolute shrinkage and selection operator (LASSO) was used to select nonzero coefficient features associated with DMI in G 1/2-EEC patients with 10-fold cross-validation by the penalty parameter to avoid overfitting. The process of feature selection using the LASSO algorithm is shown in Figure 2. A radiomics signature was generated via a linear combination of selected features weighted by their respective coefficients.
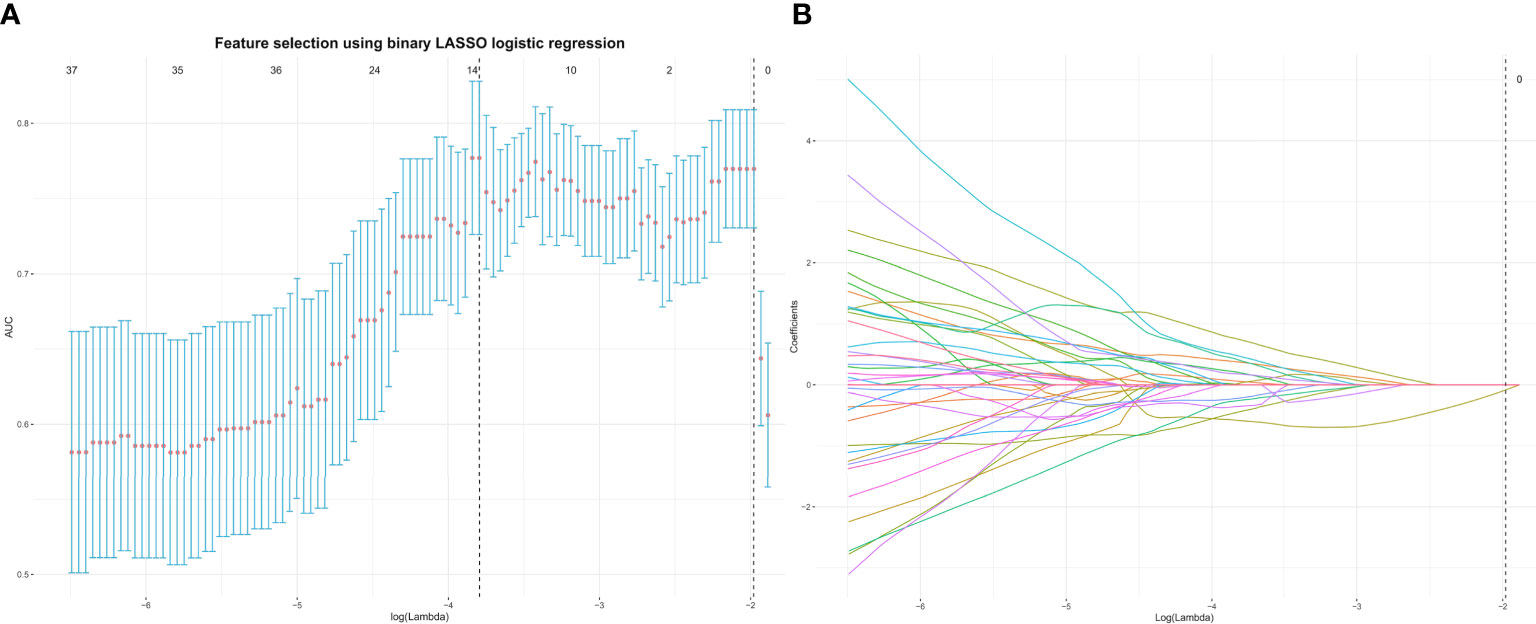
Figure 2 The top 13 radiomics features associated with DMI in G 1/2-EEC patients younger than 45 years were identified using the least absolute shrinkage and selection operator (LASSO) method in the primary group. (A) The parameter lambda (λ) is chosen using 10-fold cross-validation. (B) LASSO coefficient profiles of the selected features. A vertical line is plotted at the optimal value, resulting in 13 features with nonzero coefficients. EEC, endometrioid adenocarcinoma; DMI, deep myometrial invasion.
Radiomics Nomogram Development, Validation, and Diagnostic Performance
Based on the data of the primary group, the radiomics nomogram was developed using multivariable logistic regression by combining the radscore with the clinical parameters (CA125 and tumor size) selected and referred to other studies (22–24). The nomogram was then validated in the validation group.
All the MRI sequences (axial, sagittal, and/or coronal) were reviewed independently by the two radiologists who were available for preoperative clinical information, but blind to the results of surgical histopathology. MI was evaluated as the absence or superficial myometrial invasion (SMI) (MI < 50%) and DMI (MI ≥ 50%). To investigate the clinical application of the radiomics nomogram, after a period of 60 days, all cases were repeatedly reviewed by the same radiologists referring to the nomogram’s prediction possibility for DMI of each patient, the diagnoses were made, and the radiologists were named with the aid of nomogram.
To evaluate DMI in G 1/2-EEC for OPT, the diagnostic performances of the radiomics nomogram and the radiologists without and with the aid of the nomogram were assessed using receiver operating characteristic (ROC) curves in the primary and validation groups. The net reclassification index (NRI) and total integrated discrimination index (IDI) based on the whole data set of the radiologists without and with the aid of the nomogram were compared. Calibration curves were plotted using the Hosmer–Lemeshow (H-L) test to evaluate the calibration performance, which measured how close the prediction value generated by the nomogram was to the observed outcome. A significant result indicated a disagreement between the prediction value and the observed outcome of the nomogram.
Statistical Analysis
The sample size for this study in the validation group was calculated as the following: if the study achieves 99% diagnostic performance (β = 0.01, α = 0.05) with mean nomogram scores of 0.6 and 0.1 in SMI and DMI patients, respectively, 115 samples are needed. If the study achieves 85%–95% diagnostic performance, 70 samples are needed. We included 105 patients finally.
All statistical analyses were performed using R software (Version 4.0.2; http://www.r-project.org). Student’s t-test was used to compare quantitative variables (age, tumor size, and CA125), and the Mann–Whitney U test, chi-squared test, or Fisher’s exact test was used to compare qualitative variables. The DeLong test was used to compare the diagnostic performance of the radiomics nomogram, the radiologists without and with the aid of the nomogram. The “rms” package, “pROC” package, “dca. R” package, and “PredictABEL” package were used for the analyses. The R code is supplied in the Supplement Material. A p value < 0.05 was considered statistically significant.
Results
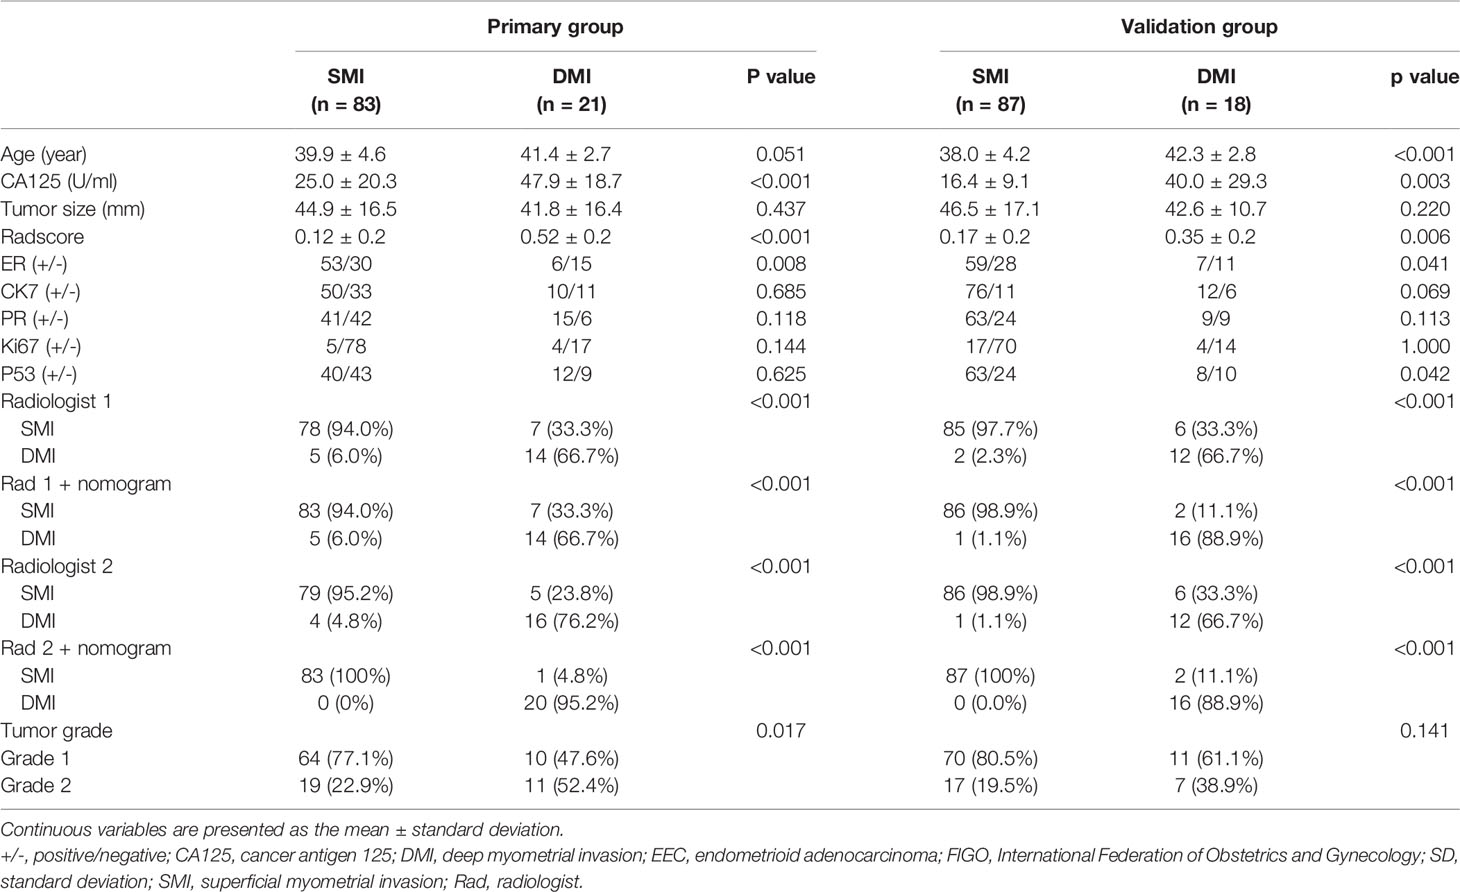
Finally, 209 G 1/2-EEC patients (mean 39 ± 4.3 years; range 25–45 years) were retrospectively included in the primary group. The clinicopathological characteristics of the included G 1/2-EEC patients are summarized in Table 1. The 209 EEC patients included 155 G1 and 54 G2 patients. The multivariate logistic regression analysis showed that the predictive factors for DMI in G 1/2-EEC were ER (with 0.75 of OR), PR (with 1.26 of OR), and CA125 (with 1.01 of OR), which are shown in Table 2.

Table 2 The univariate and multivariate logistic regression analyses for independent predictive factors of DMI in patients for ovarian preservation.
Feature Selection and Model Building
A total of 358 radiomics features, including 14 shape features, 72 first-order features, and 272 texture features, were extracted from the T2WI, DWI, ADC, and CE-T1WI sequences. Features with either interobserver or intraobserver ICC < 0.75 were removed, leaving 191 features. Based on the primary group, features with Pearson correlation coefficients > 0.9 were removed, leaving 160 features. After LASSO analysis, 13 radiomics features were finally included to form the radiomics signature. The 13 radiomics features including ADC_firstorder_Minimum and other features for assessing the depth of MI are shown in Figure 3A. The radscore calculation is shown in the following:
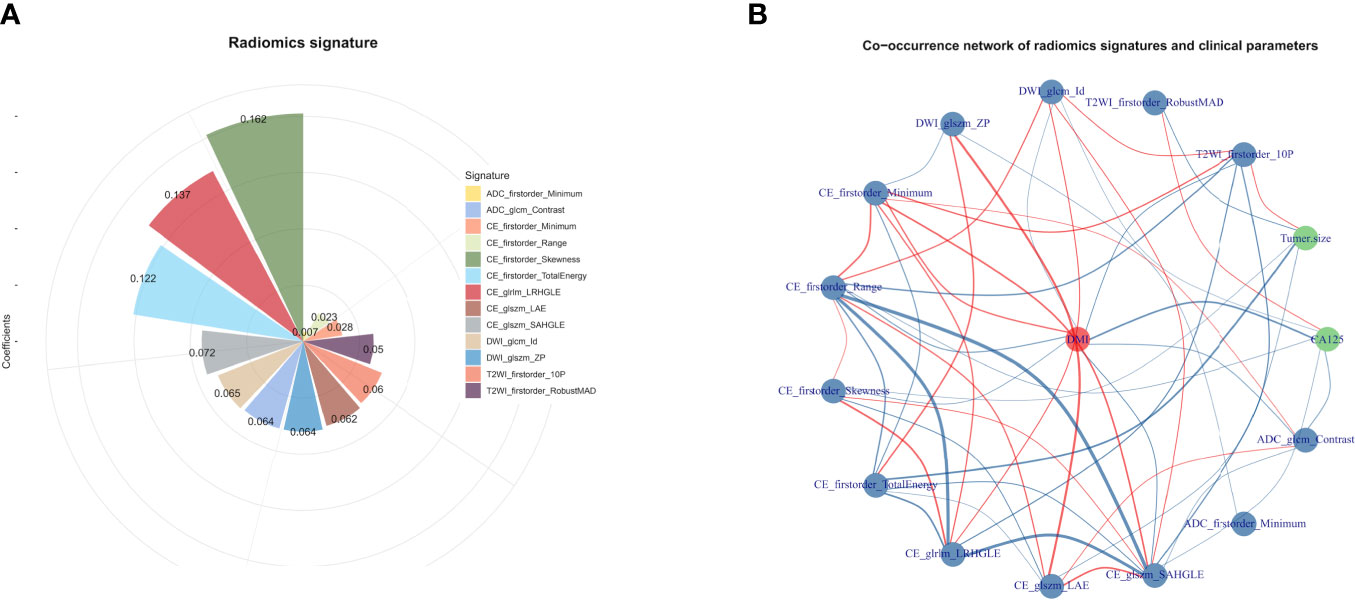
Figure 3 (A) The selected features for DMI in G 1/2-EEC patients for ovarian preservation. The chart shows that the features contribute to the radiomics signature with their coefficients obtained from linear regression. (B) The co-occurrence matrix plots the correlations of the patients for DMI (red spot), clinical parameters (CA125 and tumor size), and radiomics features. The blue line indicates a negative correlation, and the red line indicates a positive correlation (p < 0.05).
Radscore = 0.20192 + 0.05968×T2WI_firstorder_10P + -0.05049 × T2WI_firstorder_RobustMAD + 0.06464 × DWI_glcm_Id + -0.06397 × DWI_glszm_ZP + -0.0279 × CE_firstorder_Minimum + -0.02266 × CE_firstorder_Range + 0.16195 × CE_firstorder_Skewness + -0.12198 × CE_firstorder_TotalEnergy + 0.13675 × CE_glrlm_LRHGLE + -0.06215 × CE_glszm_LAE + 0.07236 × CE_glszm_SAHGLE + 0.00689 × ADC_firstorder_Minimum + 0.06399 × ADC_glcm_Contras
The co-occurrence network of the connection of each radiomics feature and clinical information are shown in Figure 3B. An MRI radiomics nomogram was further developed by incorporating the 13 radiomics features with CA125 and tumor size by linear regression to assess DMI in G 1/2-EEC in the primary group and is shown in Figure 4. Moreover, the calibration curves of the nomogram in the primary and validation groups are as shown in Figure 5.
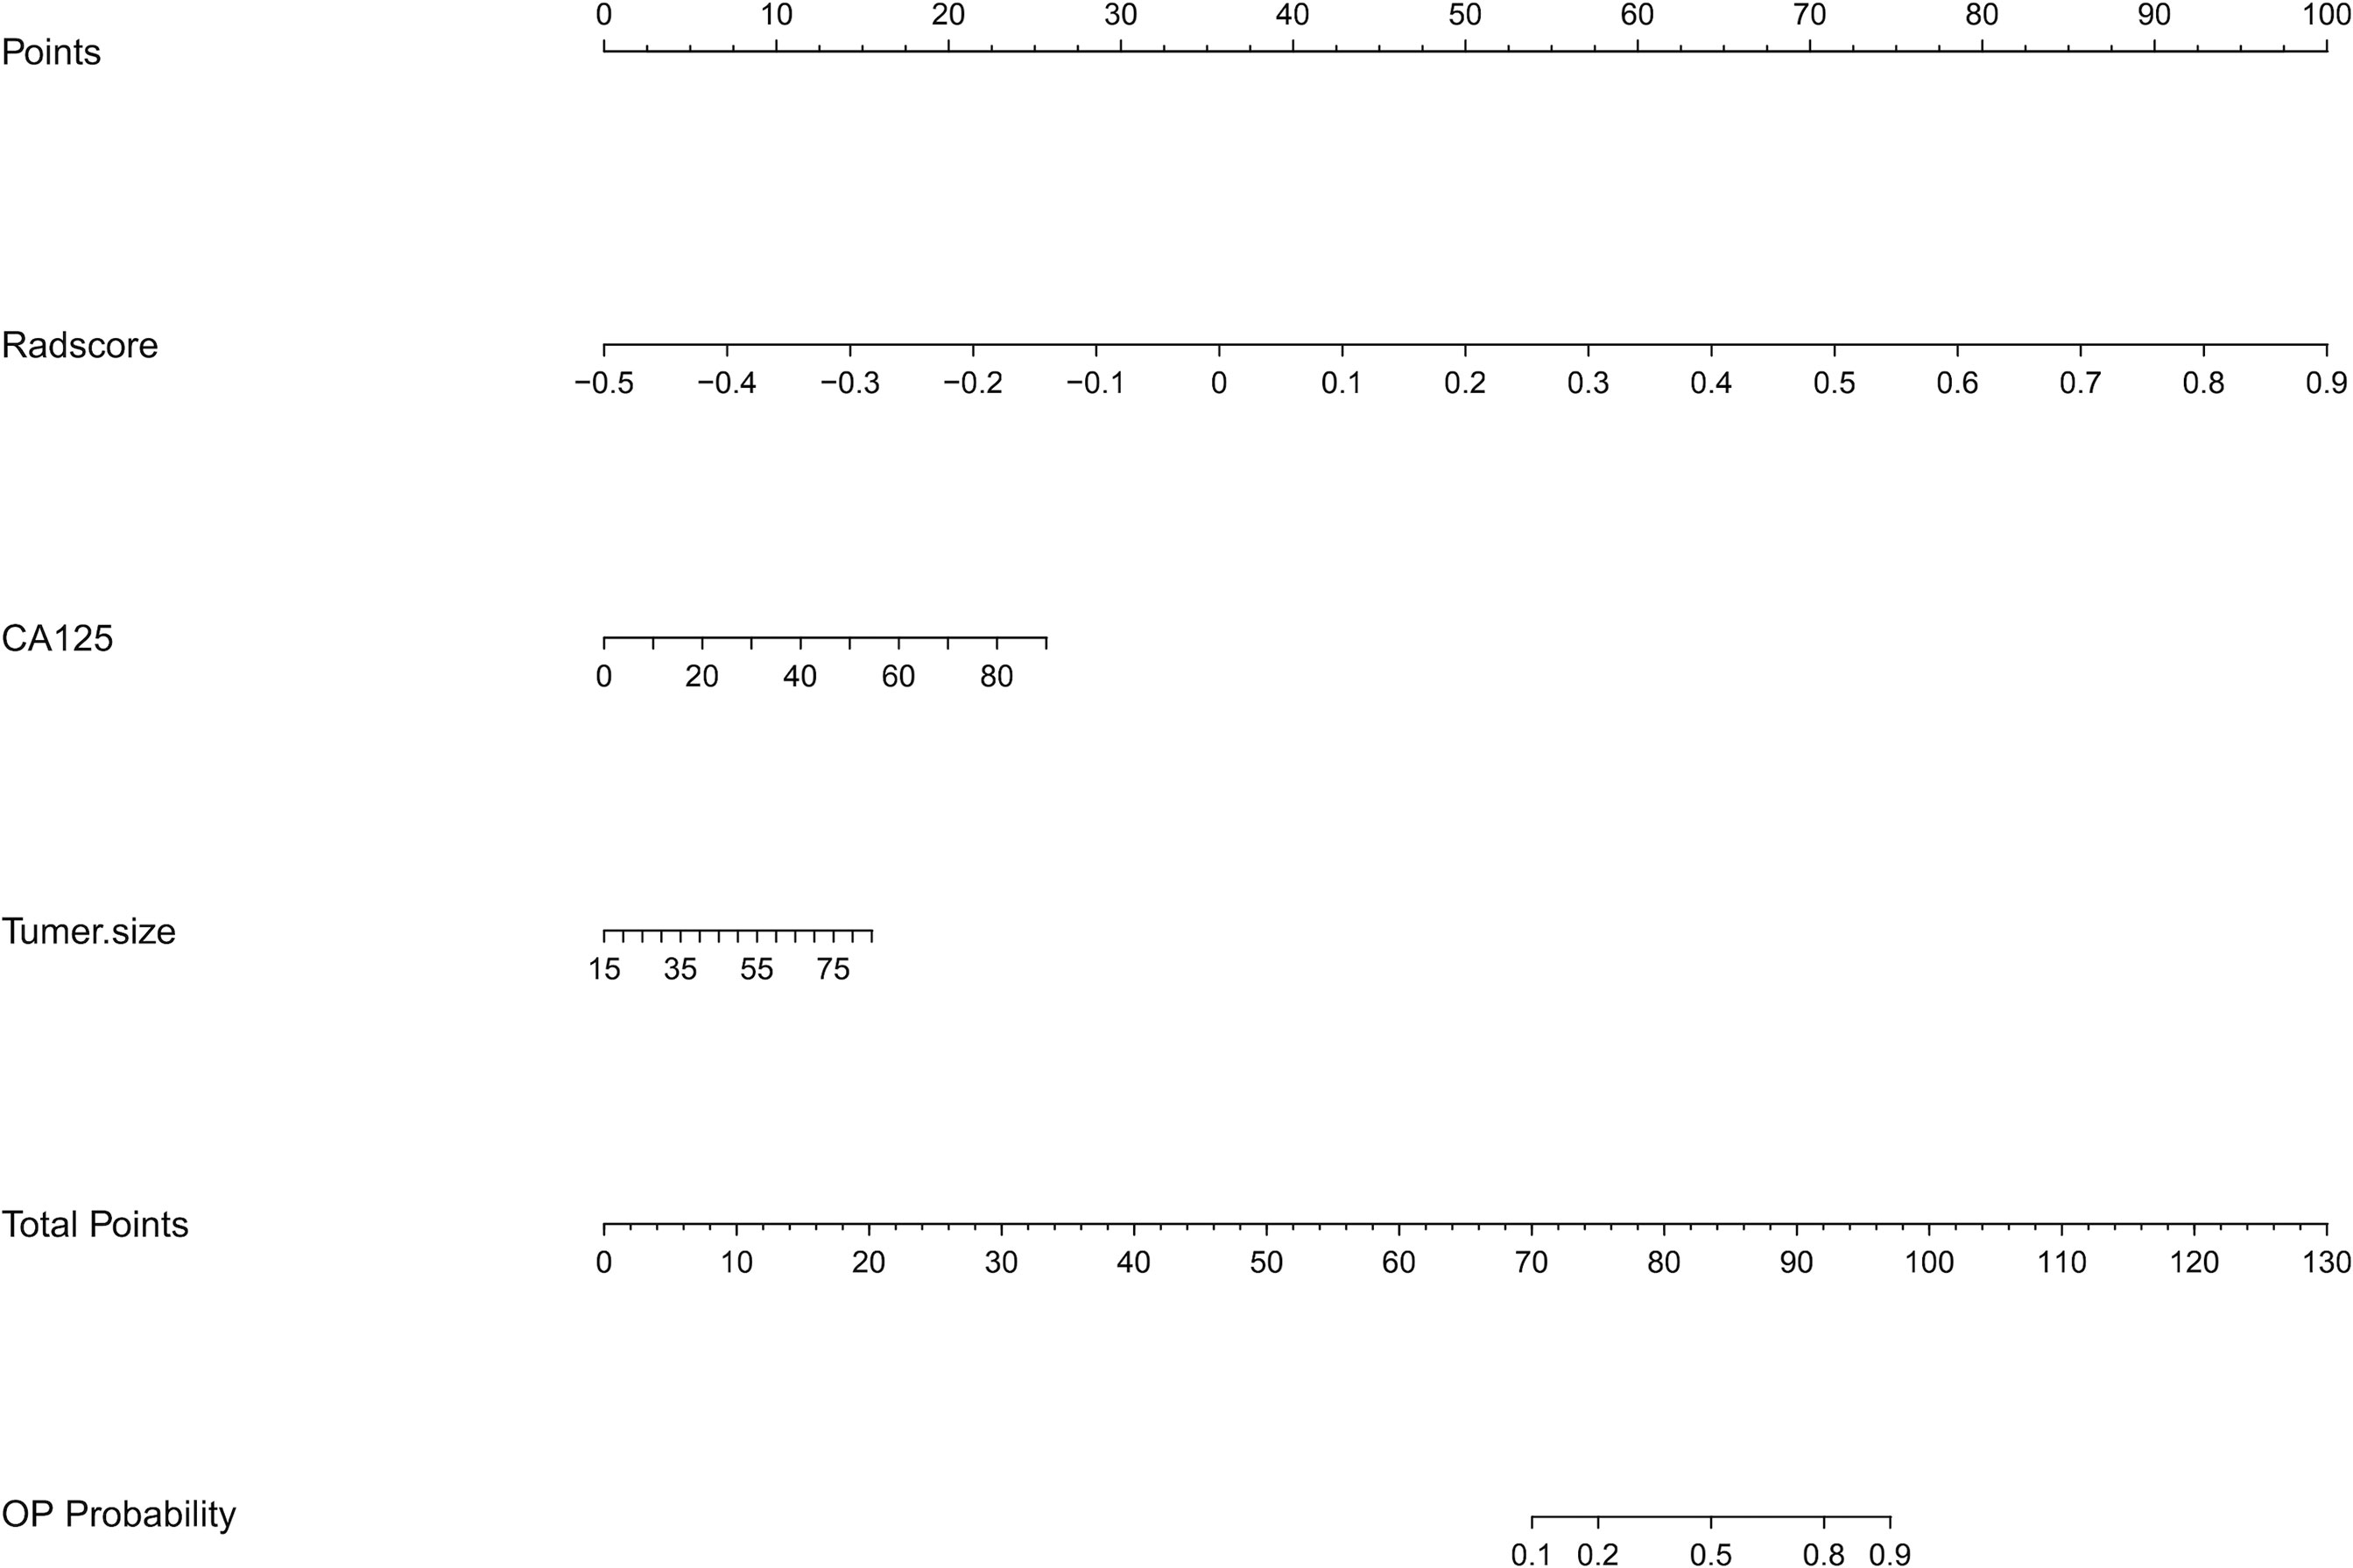
Figure 4 The radiomics nomogram incorporating the selected radiomics features with clinical parameters (CA125 and tumor size) in the primary group. To use the nomogram, locating the margin according to the patient information, drawing a line straight up to the point axis to obtain the score associated with the margin, and repeating for the radscore. By summing the scores of each point and locating it on the total points and drawing a line straight down to the bottom axis, the estimated probability of DMI in G 1/2-EEC patients for ovarian preservation can be determined.
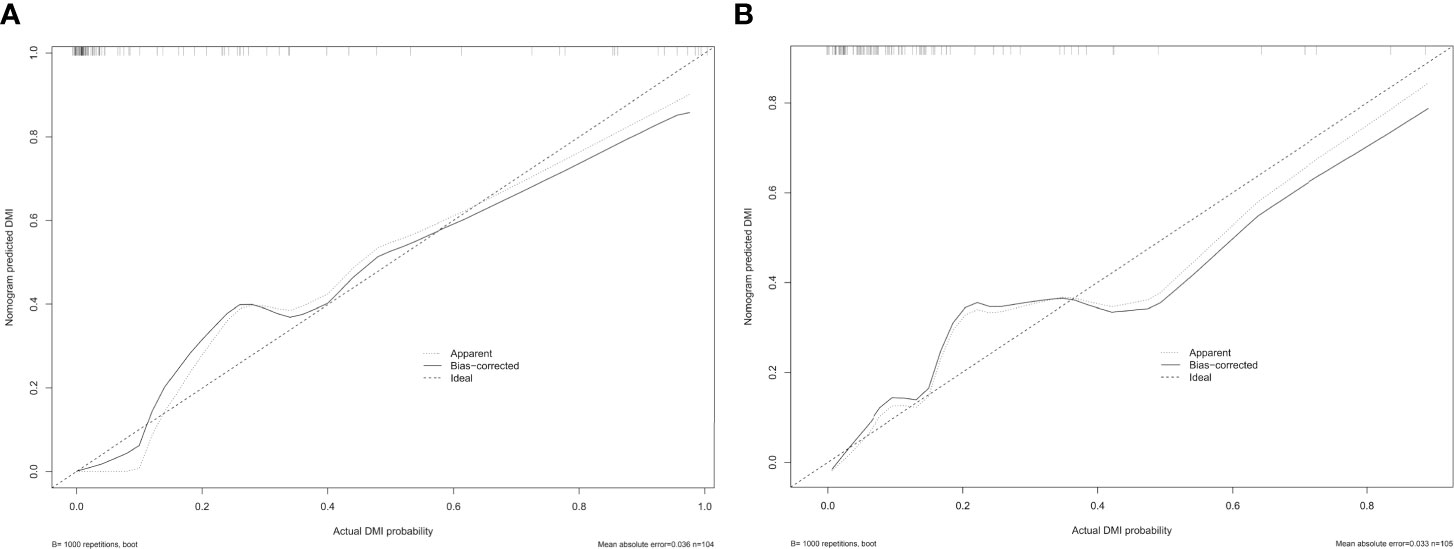
Figure 5 The calibration curve of the radiomics nomogram for predicting DMI in G 1/2-EEC patients, (A) in the primary group (p = 0.987) and (B) in the validation group (p = 0.437), which indicates the agreement between the prediction value and the observed outcome of the radiomics nomogram.
The Reason for Misjudgment
In the 209 EEC patients, 27 patients had adenomyosis, 70 patients had leiomyoma, and 22 patients had both adenomyosis and leiomyoma at the final pathological diagnosis. The misjudgment reasons and cases for the radiomics nomogram and radiologists are exhibited in Table 3. The radiomics nomogram misjudged the depth of MI mostly due to the small tumor size, which indicated that the drawing of ROI might influence the diagnostic performance (Figure 6).

Table 3 The certain cases of misjudgment with the reason in the radiomics nomogram and radiologists.
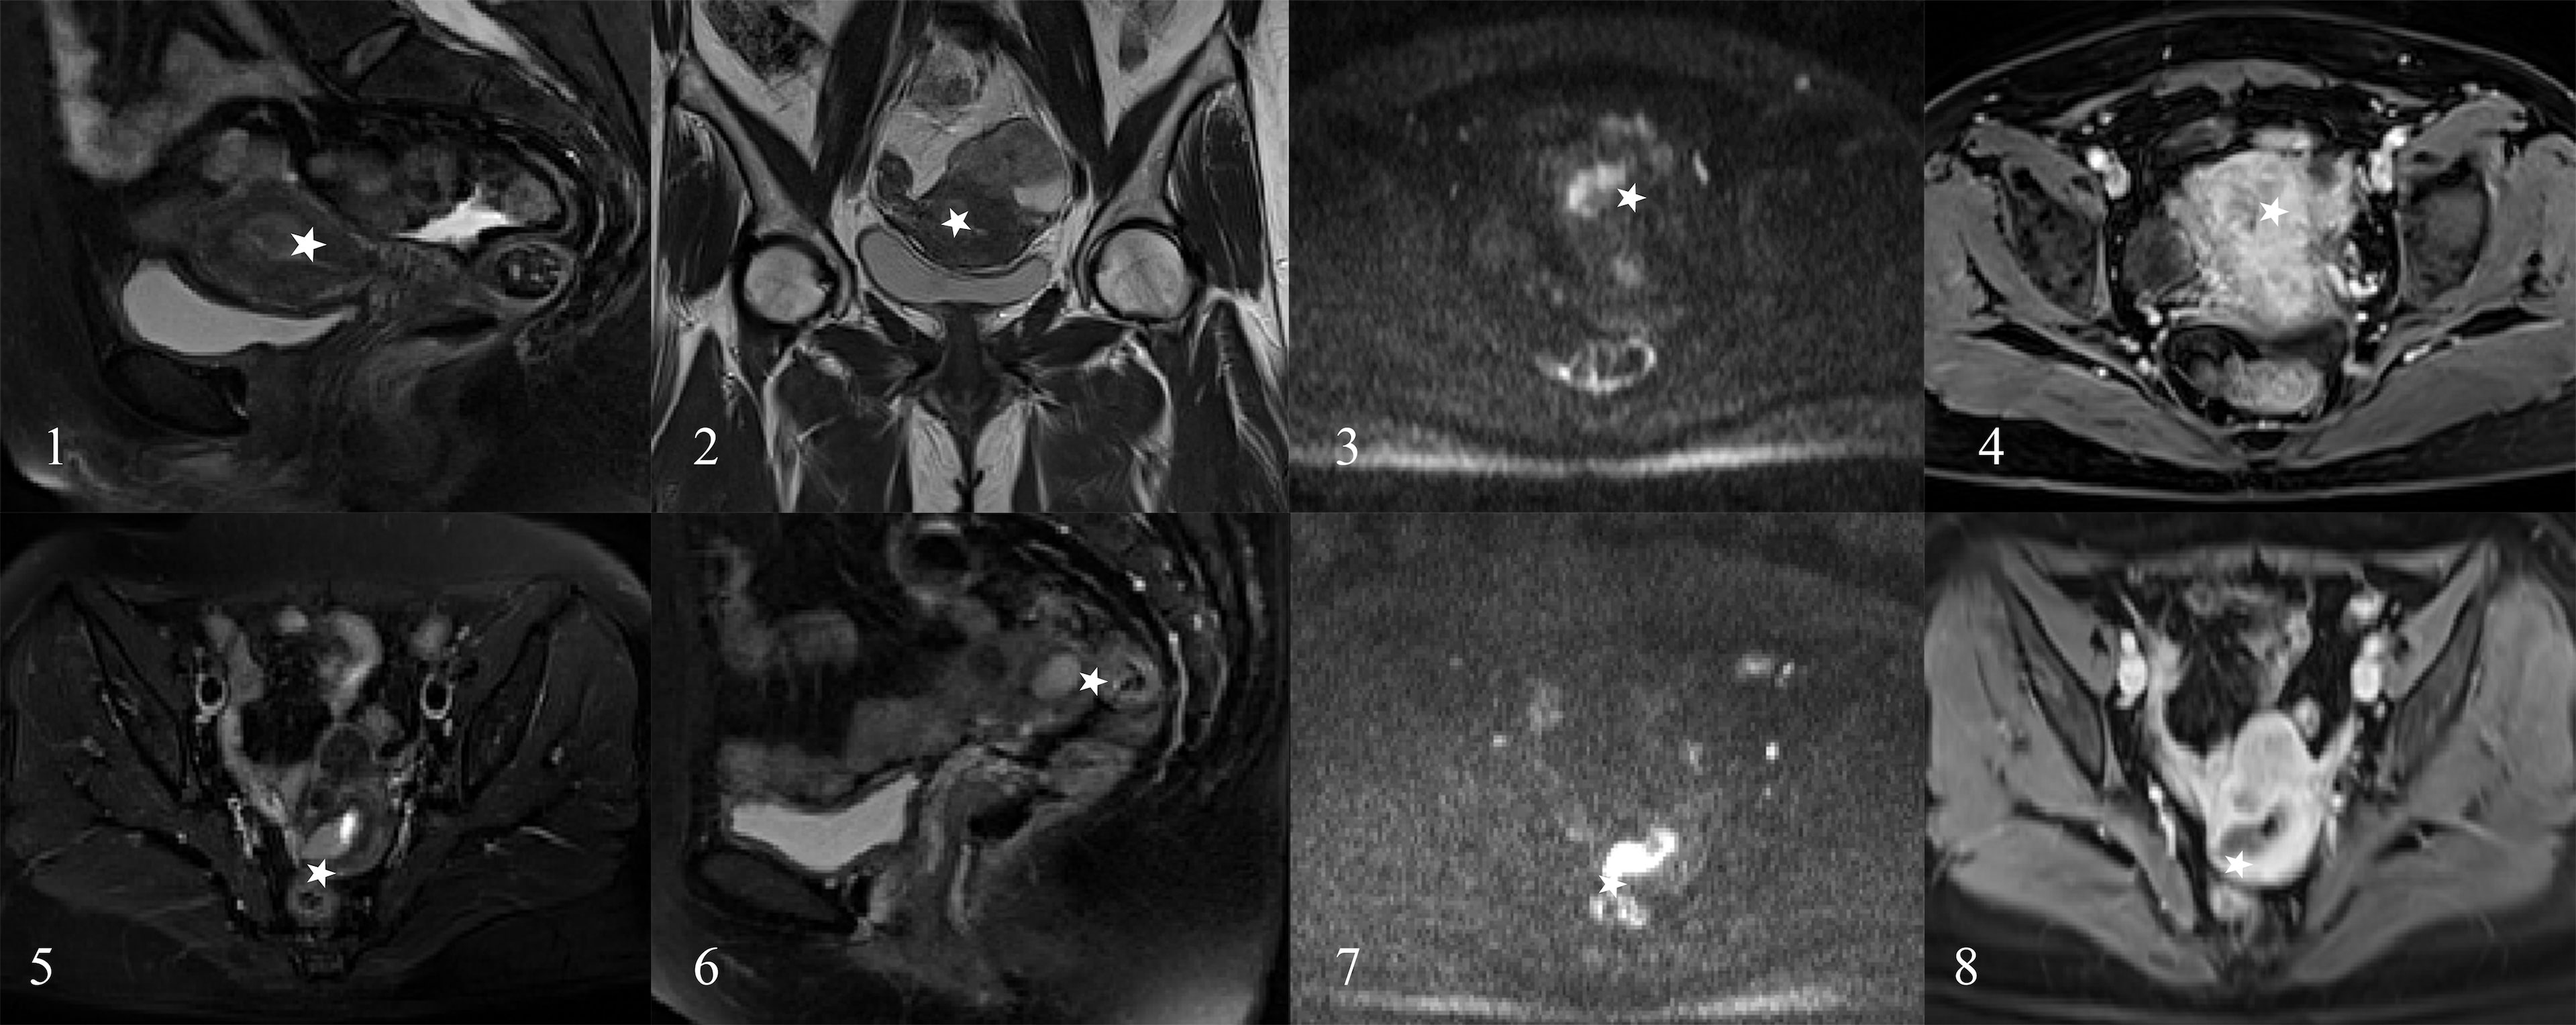
Figure 6 The EC patients misjudged by radiologists. A 45-year-old woman (images 1 to 4) and a 43-year-old woman (images 5 to 8) who were diagnosed as the DMI by radiologists (stars) and diagnosed as superficial myometrial invasion (SMI) by the radiomics nomogram and proven the SMI by pathology.
Diagnostic Performance Assessment
The AUC, sensitivity, specificity, accuracy, and negative and positive predictive values (NPV and PPV) for the radiologists without and with the aid of the nomogram in the primary and validation groups for identifying DMI in G 1/2-EEC patients for OPT are shown in Table 4 and Figure 7. For identifying DMI in G 1/2-EEC, ROC curve analyses showed that the AUCs were 0.92 and 0.70 for the radiomics signature; were 0.96 and 0.88 for the radiomics nomogram in the primary and validation groups, respectively; were 0.80, 0.86, 0.98, and 0.98 for radiologists 1 and 2 without and with the nomogram aid in the primary group; and were 0.82, 0.83, 0.94, and 0.94 in the validation group, respectively. The DeLong test showed that the AUCs of the radiomics nomogram were higher than that of radiologist 1 (p = 0.009), but not in the primary group of radiologist 2 (p = 0.061) and radiologists 1 and 2 in the validation group (p = 0.405 and 0.450, respectively). The AUC of the radiologists with the aid of the nomogram was higher than those of radiologists 1 and 2 alone in the primary (p < 0.001 and p = 0.009) and validation groups (p = 0.023 and 0.021). The AUCs of each selected clinical characteristic and radiomics feature are shown in the Supplementary Table.
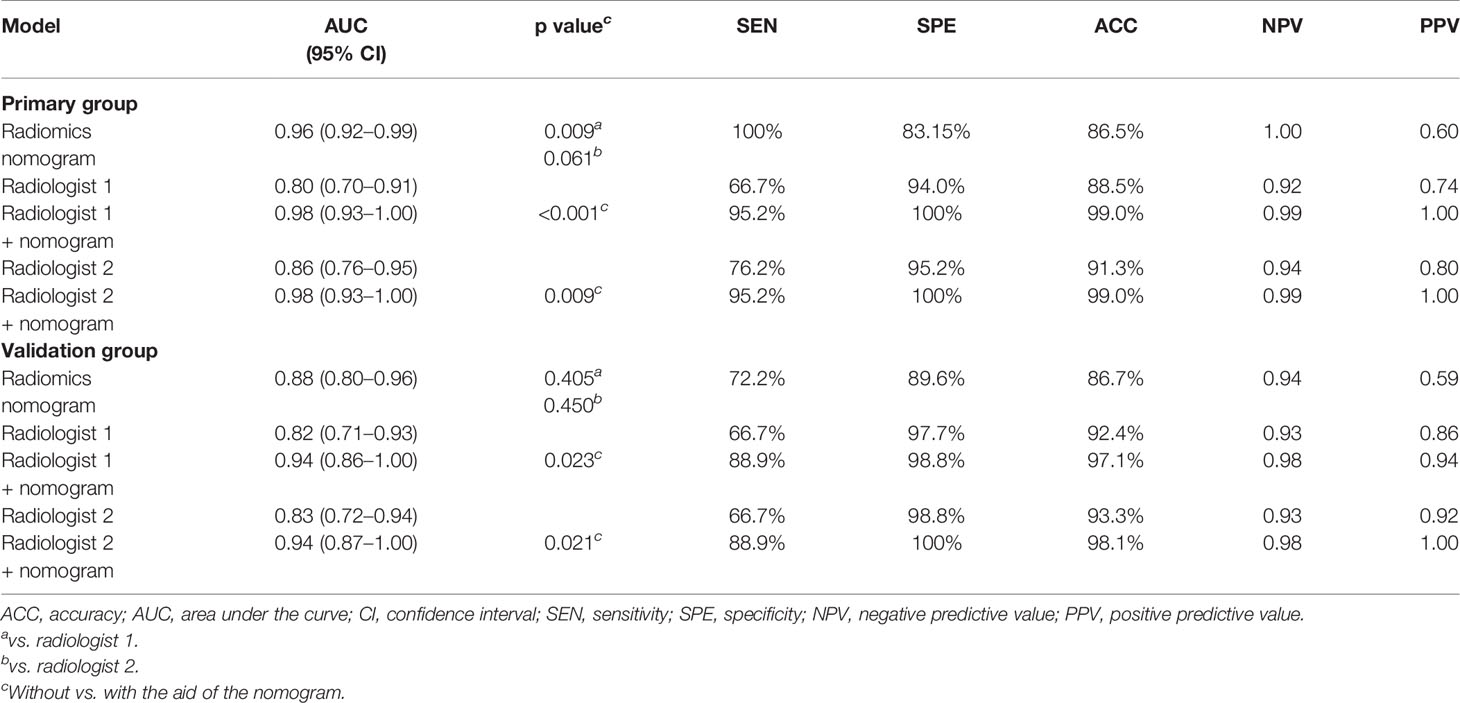
Table 4 The diagnostic performance of the radiologists without and with the aid of the nomogram in the primary and validation groups.
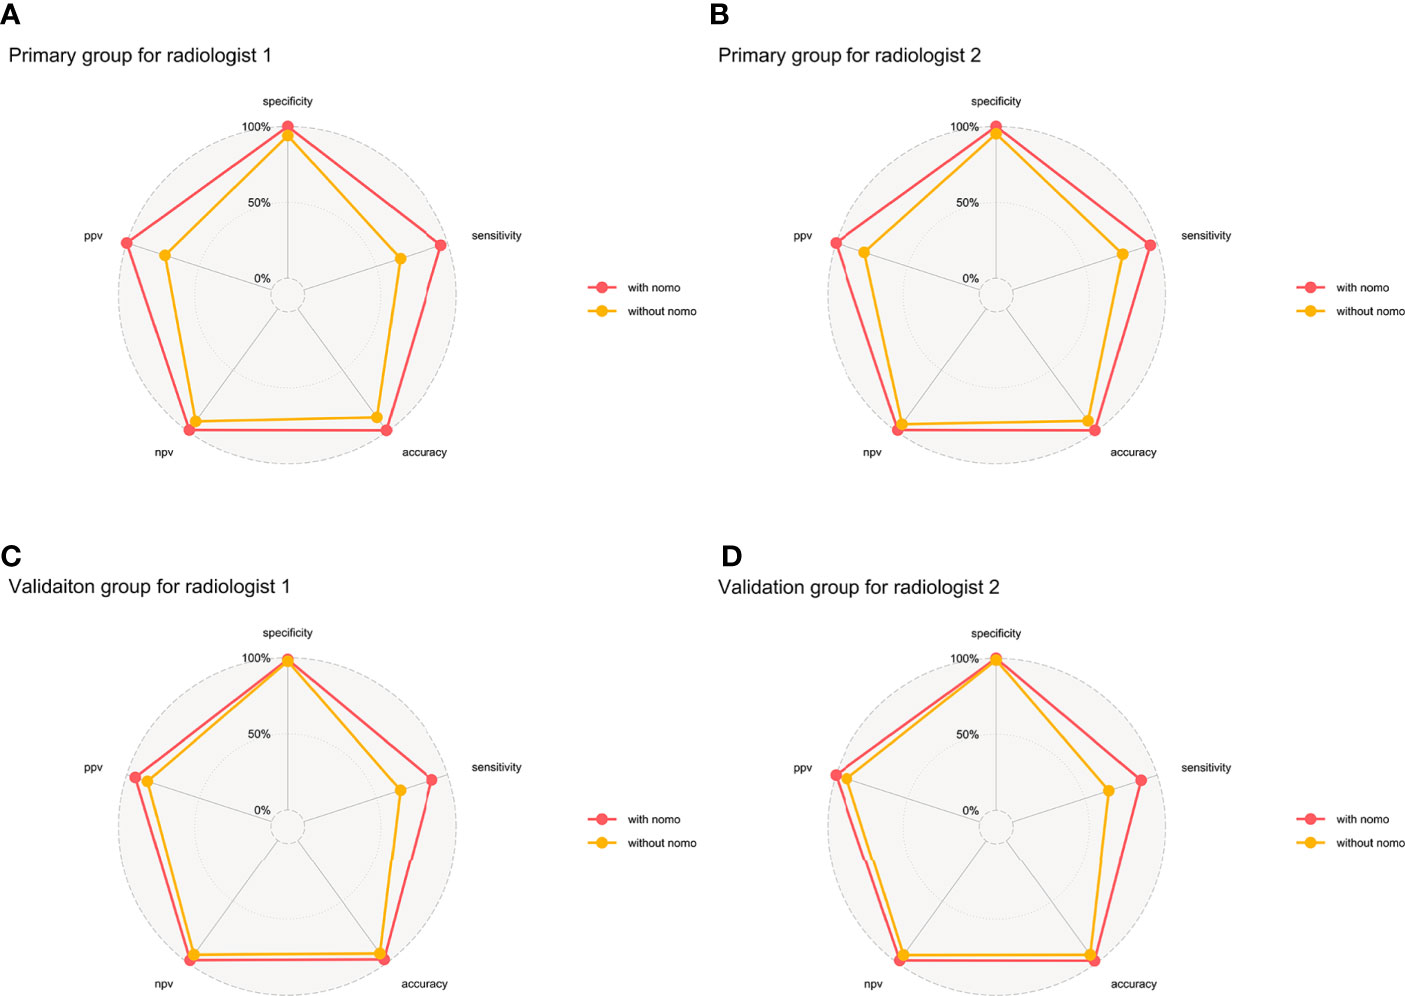
Figure 7 Binary diagnosis of the two radiologists without and with the aid of a nomogram. (A, B) are for the primary group; (C, D) are for the validation group. PPV, positive predictive value; NPV, negative predictive value.
The reclassification measures of discrimination confirmed that the radiologists with the aid of the nomogram performed better than the radiologists alone based on the whole data, with an NRI of 0.29 (95% CI: 0.15–0.43) and an IDI of 0.43 (95% CI: 0.32–0.54) for radiologist 1 and with an NRI of 0.23 (95% CI: 0.10–0.36) and an IDI of 0.37 (95% CI: 0.26–0.47) for radiologist 2 (both p < 0.01) (Figure 8). These results indicated that 37–43 patients per 100 patients would have an accurate assessment of DMI using the MRI radiomics nomogram.
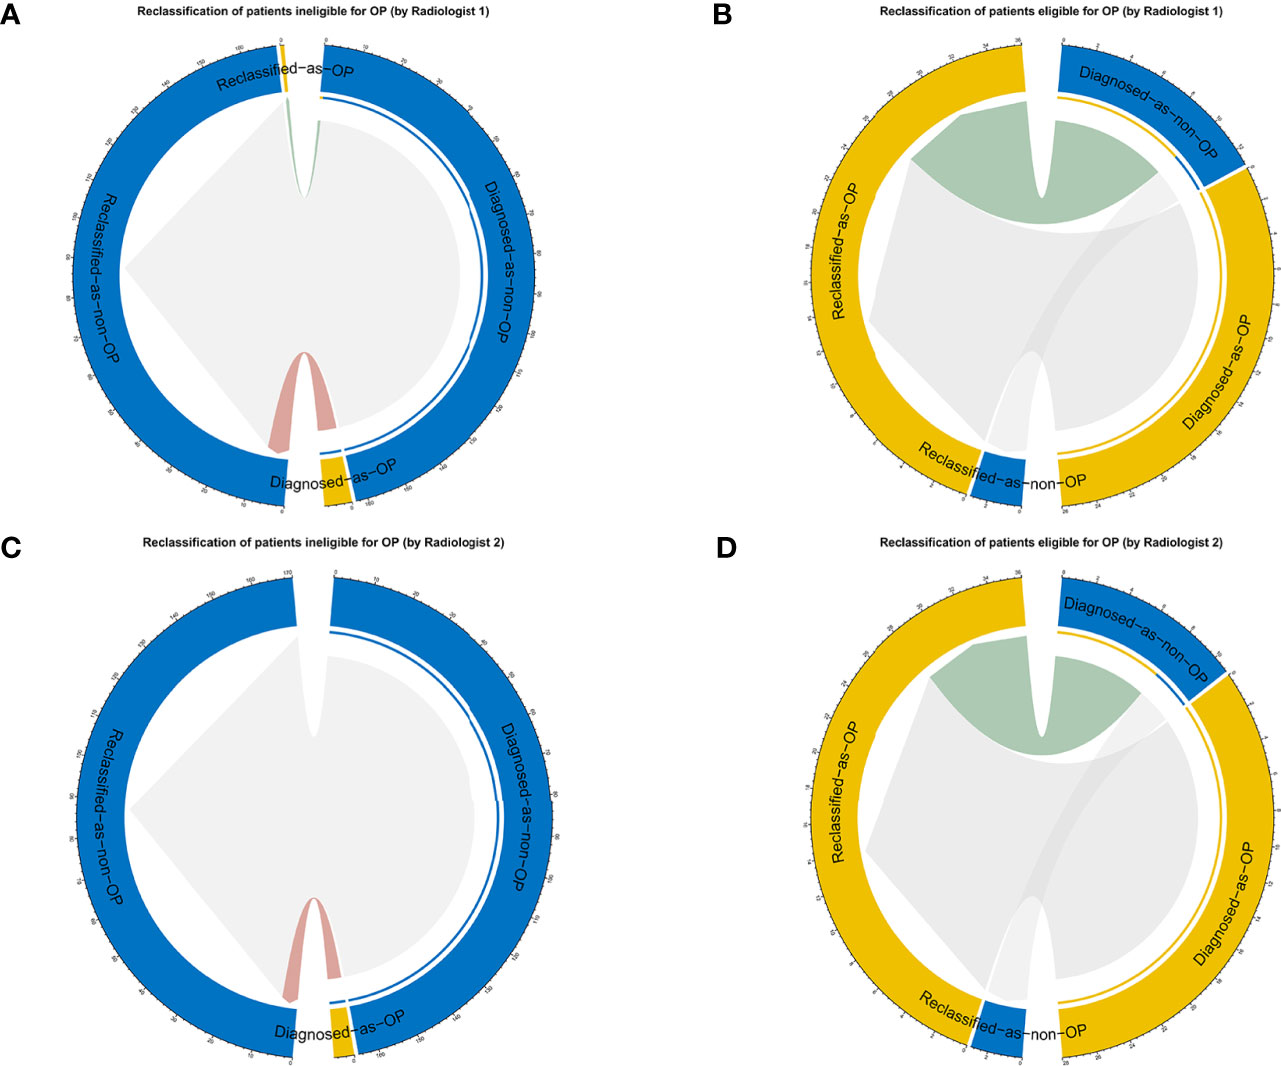
Figure 8 The reclassification results are shown as circle plots. Reclassification of patients for different groups (A, B for radiologist 1, and C, D for radiologist 2). Groups were illustrated according to the molder of the radiologists with the aid of a nomogram. OP, ovarian preservation.
Discussion
In this study, a radiomics nomogram was developed by combining multiparametric MRI radiomics features and clinical information to assess the depth of MI in G1/2-EEC patients to select eligible OPT patients. The radiomics nomogram could aid radiologists in making decisions in selecting eligible OPT patients by assessing MI. NRI and IDI analyses showed a better clinical usefulness in the radiologists with the aid of the nomogram than in the radiologists alone for individually identifying MI in choosing eligible OPT patients.
In addition to the immediate consequences of hot flashes and vaginal atrophy, BSO causes surgical menopause in young women, which results in a number of long-term sequelae, including an increased risk of cardiovascular disease, osteoporosis, hip fracture, and cognitive dysfunction (25, 26). A meta-analysis showed that the relative risk of cardiovascular disease was 2.62 in women who underwent BSO (25). In young women, BSO alone tended to increase the risk of myocardial infarction with a relative risk of 1.6 (27). A prospective, population-based cohort study found that women who underwent prophylactic BSO before the age of 45 had a 67% increase in mortality, mainly in women who had not received estrogen treatment (28). Ovarian conservation had no effect on either cancer-specific or overall survival (6, 7). Therefore, to avoid the adverse consequences of BSO, there is a strong rationale for OPT in young early-stage EC patients.
Early-stage EC patients younger than 45 are recommended to receive OPT. The assessment of the depth of MI may be a challenge when 1) the tumor involves the uterine cornu; 2) the uterine anatomy is distorted by leiomyomas or adenomyosis; 3) a large endometrial tumor distends and thins the myometrium; and 4) the endometrial tumor is relatively isointense to the myometrium on T2WI. In these clinical scenarios, radiologists have difficulty assessing MI properly and should be aware of possible tumor overstaging (29). Under these circumstances, radiomics nomograms may be a particularly useful tool to improve the delineation of tumor margins and to avoid overestimation of tumor extent, as shown in this study.
Recently, a computerized deep-learning model was developed to automatically evaluate the depth of MI in EC patients, with a sensitivity of 66.6% and a specificity of 87.5%. The results showed a better and more time-efficient performance in the deep learning model than the radiologists (14). In contrast, our radiomics nomogram model combined MRI-based radiomics features and the clinical characteristics (tumor size and CA125) to yield a high accuracy in assessing the DMI of early-stage EC patients. The radiomics nomogram could generate a certain possibility of DMI for each patient to help radiologists assess the depth of MI.
Some studies have suggested that MRI-based texture analysis could be helpful in determining the depth of MI in EC patients (13, 30). Ytre-Hauge et al. obtained an accuracy of 78% for DMI detection, which was significantly higher than that of the radiologists reading (accuracy of 70%) in the same population (30). A recent study used MRI radiomics-powered machine learning to help radiologists evaluate the presence of DMI, yielding an accuracy of 86% and an AUC of 0.92 and increasing the radiologists’ performance from 82% to 100% (p = 0.48). However, this study included only 54 patients and extracted features only from T2WI (31).
In our study, the multiparametric MRI radiomics nomogram was generated, which contributed to good diagnostic performance by unraveling more comprehensive information about tumor heterogeneity. The difference between our study and previous studies was that our nomogram was used to offer the radiologists a certain possibility of DMI and gave them a hint of the depth of MI. When radiologists face specific perplexing clinical scenarios, this radiomics nomogram could help them obtain a more confident diagnosis. Furthermore, the reclassification framework was used to provide an outcome prediction analysis of clinical decision-making. The clinical benefits were significantly improved, with IDIs of 0.43 and 0.37 in radiologists 1 and 2, respectively, which indicated that 37–43 out of 100 patients would be reclassified correctly from the radiomics-aided radiologists’ prediction compared to the radiologists alone.
There were some limitations in our study. First, we did not include high-order wavelet features because previous studies suggested that wavelet features were not stable and lacked reasonable clinical interpretation (32). Second, this was a single-center scanner study; therefore, our results should be validated on data from multiple centers and from different scanners prior to clinical implementation. Third, the deep-learning based features were not investigated although some studies of other cancers showed a good performance (33–35). Last, the imbalance of the DMI and SMI datasets was not balanced by using any techniques such as the synthetic minority oversampling technique; however, we tried to select robust and reproducible features with a stable diagnostic performance.
In conclusion, the multiparametric MRI-based radiomics nomogram outperformed the radiologists in assessing the depth of MI in G 1/2-EEC patients younger than 45 years and for selecting eligible OPT patients. It could help radiologists significantly improve the predictive performance of MI status.
Data Availability Statement
The raw data supporting the conclusions of this article will be made available by the authors, without undue reservation.
Ethics Statement
The studies involving human participants were reviewed and approved by the ethics committee of Obstetrics & Gynecology Hospital, Fudan University. The patients/participants provided their written informed consent to participate in this study.
Author Contributions
The study supervisor is JQ. The authors responsible for the study concept, design, and implementation are BY and XM. YL contributed to the data analysis and performed the statistical analysis. SD helped in giving the R code. BY, XM, and GZ contributed to the data acquisition. BY and YL conducted the ROI drawing. BY was the major contributor and contributed to writing the first draft. JQ revised and edited the manuscript. All authors contributed to the article and approved the submitted version.
Funding
This study was supported by the National Natural Science Foundation of China (No. 81971579) and Shanghai Municipal Health Commission (No. ZK2019B01).
Conflict of Interest
Author SD was employed by company GE Healthcare.
The remaining authors declare that the research was conducted in the absence of any commercial or financial relationships that could be construed as a potential conflict of interest.
The reviewer YR declared a shared affiliation with several of the authors BY, XM, YL, GZ, and JQ to the handling editor at the time of the review.
Publisher’s Note
All claims expressed in this article are solely those of the authors and do not necessarily represent those of their affiliated organizations, or those of the publisher, the editors and the reviewers. Any product that may be evaluated in this article, or claim that may be made by its manufacturer, is not guaranteed or endorsed by the publisher.
Supplementary Material
The Supplementary Material for this article can be found online at: https://www.frontiersin.org/articles/10.3389/fonc.2021.730281/full#supplementary-material
References
1. Siegel RL, Miller KD, Fuchs HE, Jemal A. Cancer Statistics, 2021. CA Cancer J Clin (2021) 71:7–33. doi: 10.3322/caac.21654:10.3322/caac.21654
2. Lee NK, Cheung MK, Shin JY, Husain A, Teng NN, Berek JS, et al. Prognostic Factors for Uterine Cancer in Reproductive-Aged Women. Obstet Gynecol (2007) 109:655–62. doi: 10.1097/01.AOG.0000255980.88205.15
3. Moeini A, Machida H, Takiuchi T, Blake EA, Hom MS, Miki T, et al. Association of Nonalcoholic Fatty Liver Disease and Venous Thromboembolism in Women With Endometrial Cancer. Clin Appl Thromb Hemost (2017) 23:1018–27. doi: 10.1177/1076029616665925
4. Matsuo K, Gualtieri MR, Cahoon SS, Jung CE, Paulson RJ, Shoupe D, et al. Surgical Menopause and Increased Risk of Nonalcoholic Fatty Liver Disease in Endometrial Cancer. Menopause (2016) 23:189–96. doi: 10.1097/GME.0000000000000500
5. Matsuo K, Machida H, Shoupe D, Melamed A, Muderspach LI, Roman LD, et al. Ovarian Conservation and Overall Survival in Young Women With Early-Stage Low-Grade Endometrial Cancer. Obstet Gynecol (2016) 128:761–70. doi: 10.1097/AOG.0000000000001647
6. Wright JD, Jorge S, Tergas AI, Hou JY, Burke WM, Huang Y, et al. Utilization and Outcomes of Ovarian Conservation in Premenopausal Women With Endometrial Cancer. Obstet Gynecol (2016) 127:101–8. doi: 10.1097/AOG.0000000000001181
7. Wright JD, Buck AM, Shah M, Burke WM, Schiff PB, Herzog TJ. Safety of Ovarian Preservation in Premenopausal Women With Endometrial Cancer. J Clin Oncol (2009) 27:1214–9. doi: 10.1200/JCO.2008.19.8150
8. Baiocchi G, Clemente AG, Mantoan H, da Costa WL Jr, Bovolim G, Guimaraes APG, et al. Adnexal Involvement in Endometrial Cancer: Prognostic Factors and Implications for Ovarian Preservation. Ann Surg Oncol (2020) 27:2822–6. doi: 10.1245/s10434-020-08261-8
9. Matsuo K, Cripe JC, Kurnit KC, Kaneda M, Garneau AS, Glaser GE, et al. Recurrence, Death, and Secondary Malignancy After Ovarian Conservation for Young Women With Early-Stage Low-Grade Endometrial Cancer. Gynecol Oncol (2019) 155:39–50. doi: 10.1016/j.ygyno.2019.08.007
10. Kinjyo Y, Kudaka W, Ooyama T, Inamine M, Nagai Y, Aoki Y. Ovarian Preservation in Young Women With Endometrial Cancer of Endometrioid Histology. Acta Obstet Gynecol Scand (2015) 94:430–4. doi: 10.1111/aogs.12588
11. Nougaret S, Reinhold C, Alsharif SS, Addley H, Arceneau J, Molinari N, et al. Endometrial Cancer: Combined MR Volumetry and Diffusion-Weighted Imaging for Assessment of Myometrial and Lymphovascular Invasion and Tumor Grade. Radiology (2015) 276:797–808. doi: 10.1148/radiol.15141212
12. Lin G, Ng KK, Chang CJ, Wang JJ, Ho KC, Yen TC, et al. Myometrial Invasion in Endometrial Cancer: Diagnostic Accuracy of Diffusion-Weighted 3.0-T MR Imaging–Initial Experience. Radiology (2009) 250:784–92. doi: 10.1148/radiol.2503080874
13. Ueno Y, Forghani B, Forghani R, Dohan A, Zeng XZ, Chamming's F, et al. Endometrial Carcinoma: MR Imaging-Based Texture Model for Preoperative Risk Stratification-A Preliminary Analysis. Radiology (2017) 284:748–57. doi: 10.1148/radiol.2017161950
14. Chen X, Wang Y, Shen M, Yang B, Zhou Q, Yi Y, et al. Deep Learning for the Determination of Myometrial Invasion Depth and Automatic Lesion Identification in Endometrial Cancer MR Imaging: A Preliminary Study in a Single Institution. Eur Radiol (2020) 30:4985–94. doi: 10.1007/s00330-020-06870-1
15. Todo Y, Watari H, Okamoto K, Hareyama H, Minobe S, Kato H, et al. Tumor Volume Successively Reflects the State of Disease Progression in Endometrial Cancer. Gynecol Oncol (2013) 129:472–7. doi: 10.1016/j.ygyno.2013.02.034
16. Tang XR, Li YQ, Liang SB, Jiang W, Liu F, Ge WX, et al. Development and Validation of a Gene Expression-Based Signature to Predict Distant Metastasis in Locoregionally Advanced Nasopharyngeal Carcinoma: A Retrospective, Multicentre, Cohort Study. Lancet Oncol (2018) 19:382–93. doi: 10.1016/S1470-2045(18)30080-9
17. Zhang Y, Chen W, Yue X, Shen J, Gao C, Pang P, et al. Development of a Novel, Multi-Parametric, MRI-Based Radiomic Nomogram for Differentiating Between Clinically Significant and Insignificant Prostate Cancer. Front Oncol (2020) 10:888. doi: 10.3389/fonc.2020.00888
18. Yan BC, Li Y, Ma FH, Zhang GF, Feng F, Sun MH, et al. Radiologists With MRI-Based Radiomics Aids to Predict the Pelvic Lymph Node Metastasis in Endometrial Cancer: A Multicenter Study. Eur Radiol (2021) 31:411–22. doi: 10.1007/s00330-020-07099-8
19. Xie CY, Hu YH, Ho JW, Han LJ, Yang H, Wen J, et al. Using Genomics Feature Selection Method in Radiomics Pipeline Improves Prognostication Performance in Locally Advanced Esophageal Squamous Cell Carcinoma-A Pilot Study. Cancers (Basel) (2021) 13:2145. doi: 10.3390/cancers13092145
20. Koo TK, Li MY. A Guideline of Selecting and Reporting Intraclass Correlation Coefficients for Reliability Research. J Chiropr Med (2016) 15:155–63. doi: 10.1016/j.jcm.2016.02.012
21. Mukaka MM. Statistics Corner: A Guide to Appropriate Use of Correlation Coefficient in Medical Research. Malawi Med J (2012) 24:69–71.
22. Sahin H, Sarioglu FC, Bagci M, Karadeniz T, Uluer H, Sanci M. Preoperative Magnetic Resonance Volumetry in Predicting Myometrial Invasion, Lymphovascular Space Invasion, and Tumor Grade: Is it Valuable in International Federation of Gynecology and Obstetrics Stage I Endometrial Cancer? Int J Gynecol Cancer (2018) 28:666–74. doi: 10.1097/IGC.0000000000001208
23. Fasmer KE, Bjørnerud A, Ytre-Hauge S, Grüner R, Tangen IL, Werner HM, et al. Preoperative Quantitative Dynamic Contrast-Enhanced MRI and Diffusion-Weighted Imaging Predict Aggressive Disease in Endometrial Cancer. Acta Radiol (2018) 59:1010–7. doi: 10.1177/0284185117740932
24. Modarres-Gilani M, Vaezi M, Shariat M, Zamani N, Nourizadeh R. The Prognostic Role of Preoperative Serum CA125 Levels in Patients With Advanced Endometrial Carcinoma. Cancer Biomark (2017) 20:135–41. doi: 10.3233/CBM-160529
25. Atsma F, Bartelink MLEL, Grobbee DE, van der Schouw YT. Postmenopausal Status and Early Menopause as Independent Risk Factors for Cardiovascular Disease: A Meta-Analysis. Menopause-the J North Am Menopause Society (2006) 13:265–79. doi: 10.1097/01.gme.0000218683.97338.ea
26. Rocca WA, Bower JH, Maraganore DM, Ahlskog JE, Grossardt BR, de Andrade M, et al. Increased Risk of Cognitive Impairment or Dementia in Women Who Underwent Oophorectomy Before Menopause. Neurology (2007) 69:1074–83. doi: 10.1212/01.wnl.0000276984.19542.e6
27. Falkeborn M, Schairer C, Naessen T, Persson I. Risk of Myocardial Infarction After Oophorectomy and Hysterectomy. J Clin Epidemiol (2000) 53:832–7. doi: 10.1016/s0895-4356(00)00187-6
28. Rocca WA, Grossardt BR, de Andrade M, Malkasian GD, Melton LJ. Survival Patterns After Oophorectomy in Premenopausal Women: A Population-Based Cohort Study. Lancet Oncol (2006) 7:821–8. doi: 10.1016/S1470-2045(06)70869-5
29. Nougaret S, Horta M, Sala E, Lakhman Y, Thomassin-Naggara I, Kido A, et al. Endometrial Cancer MRI Staging: Updated Guidelines of the European Society of Urogenital Radiology. Eur Radiol (2019) 29:792–805. doi: 10.1007/s00330-018-5515-y
30. Ytre-Hauge S, Dybvik JA, Lundervold A, Salvesen ØO, Krakstad C, Fasmer KE, et al. Preoperative Tumor Texture Analysis on MRI Predicts High-Risk Disease and Reduced Survival in Endometrial Cancer. J Magn Reson Imaging (2018) 48:1637–47. doi: 10.1002/jmri.26184
31. Stanzione A, Cuocolo R, Del Grosso R, Nardiello A, Romeo V, Travaglino A, et al. Deep Myometrial Infiltration of Endometrial Cancer on MRI: A Radiomics-Powered Machine Learning Pilot Study. Acad Radiol (2021) 28:737–44. doi: 10.1016/j.acra.2020.02.028
32. Fiset S, Welch ML, Weiss J, Pintilie M, Conway JL, Milosevic M, et al. Repeatability and Reproducibility of MRI-Based Radiomic Features in Cervical Cancer. Radiother Oncol (2019) 135:107–14. doi: 10.1016/j.radonc.2019.03.001
33. Liu F, Liu D, Wang K, Xie X, Su L, Kuang M, et al. Deep Learning Radiomics Based on Contrast-Enhanced Ultrasound Might Optimize Curative Treatments for Very-Early or Early-Stage Hepatocellular Carcinoma Patients. Liver Cancer (2020) 9:397–413. doi: 10.1159/000505694
34. Cheng NM, Yao J, Cai J, Ye X, Zhao S, Zhao K, et al. Deep Learning for Fully Automated Prediction of Overall Survival in Patients With Oropharyngeal Cancer Using FDG-PET Imaging. Clin Cancer Res (2021) 27:3948–59. doi: 10.1158/1078-0432
Keywords: radiomics, nomogram, endometrial cancer, myometrial invasion, ovarian preservation
Citation: Yan BC, Ma XL, Li Y, Duan SF, Zhang GF and Qiang JW (2021) MRI-Based Radiomics Nomogram for Selecting Ovarian Preservation Treatment in Patients With Early-Stage Endometrial Cancer. Front. Oncol. 11:730281. doi: 10.3389/fonc.2021.730281
Received: 24 June 2021; Accepted: 17 August 2021;
Published: 09 September 2021.
Edited by:
Sandra Orsulic, UCLA David Geffen School of Medicine, United StatesReviewed by:
Yulan Ren, Fudan University Shanghai Cancer Center, ChinaJiayun Li, Google, United States
Copyright © 2021 Yan, Ma, Li, Duan, Zhang and Qiang. This is an open-access article distributed under the terms of the Creative Commons Attribution License (CC BY). The use, distribution or reproduction in other forums is permitted, provided the original author(s) and the copyright owner(s) are credited and that the original publication in this journal is cited, in accordance with accepted academic practice. No use, distribution or reproduction is permitted which does not comply with these terms.
*Correspondence: Jin Wei Qiang, ZHIuamlud2VpcWlhbmdAMTYzLmNvbQ==
†These authors have contributed equally to this work
 Bi Cong Yan1,2†
 Xiao Liang Ma
 Shao Feng Duan
 Guo Fu Zhang
 Jin Wei Qiang