 Shenbin Xu
 Zefeng Wang1†
 Juan Ye
 Jianmin Zhang
94% of researchers rate our articles as excellent or good
Learn more about the work of our research integrity team to safeguard the quality of each article we publish.
Find out more
ORIGINAL RESEARCH article
Front. Oncol. , 09 September 2021
Sec. Cancer Genetics
Volume 11 - 2021 | https://doi.org/10.3389/fonc.2021.729103
This article is part of the Research Topic RNA Sequencing in Clinical Oncology for Metabolism and Immunity View all 43 articles
Lower-grade glioma (LGG) is characterized by genetic and transcriptional heterogeneity, and a dismal prognosis. Iron metabolism is considered central for glioma tumorigenesis, tumor progression and tumor microenvironment, although key iron metabolism-related genes are unclear. Here we developed and validated an iron metabolism-related gene signature LGG prognosis. RNA-sequence and clinicopathological data from The Cancer Genome Atlas (TCGA) and the Chinese Glioma Genome Atlas (CGGA) were downloaded. Prognostic iron metabolism-related genes were screened and used to construct a risk-score model via differential gene expression analysis, univariate Cox analysis, and the Least Absolute Shrinkage and Selection Operator (LASSO)-regression algorithm. All LGG patients were stratified into high- and low-risk groups, based on the risk score. The prognostic significance of the risk-score model in the TCGA and CGGA cohorts was evaluated with Kaplan-Meier (KM) survival and receiver operating characteristic (ROC) curve analysis. Risk- score distributions in subgroups were stratified by age, gender, the World Health Organization (WHO) grade, isocitrate dehydrogenase 1 (IDH1) mutation status, the O6‐methylguanine‐DNA methyl‐transferase (MGMT) promoter-methylation status, and the 1p/19q co-deletion status. Furthermore, a nomogram model with a risk score was developed, and its predictive performance was validated with the TCGA and CGGA cohorts. Additionally, the gene set enrichment analysis (GSEA) identified signaling pathways and pathological processes enriched in the high-risk group. Finally, immune infiltration and immune checkpoint analysis were utilized to investigate the tumor microenvironment characteristics related to the risk score. We identified a prognostic 15-gene iron metabolism-related signature and constructed a risk-score model. High risk scores were associated with an age of > 40, wild-type IDH1, a WHO grade of III, an unmethylated MGMT promoter, and 1p/19q non-codeletion. ROC analysis indicated that the risk-score model accurately predicted 1-, 3-, and 5-year overall survival rates of LGG patients in the both TCGA and CGGA cohorts. KM analysis showed that the high-risk group had a much lower overall survival than the low-risk group (P < 0.0001). The nomogram model showed a strong ability to predict the overall survival of LGG patients in the TCGA and CGGA cohorts. GSEA analysis indicated that inflammatory responses, tumor-associated pathways, and pathological processes were enriched in high-risk group. Moreover, a high risk score correlated with the infiltration immune cells (dendritic cells, macrophages, CD4+ T cells, and B cells) and expression of immune checkpoint (PD1, PDL1, TIM3, and CD48). Our prognostic model was based on iron metabolism-related genes in LGG, can potentially aid in LGG prognosis, and provides potential targets against gliomas.
Diffuse gliomas represent the most common type of primary tumor originating in the central nervous system. Oligodendrocytomas and astrocytomas, corresponding to World Health Organization (WHO) grade II and grade III tumors, are defined as lower-grade gliomas (LGGs) (1). The median overall survival (OS) time of patients with WHO II and III gliomas is 78.1 months and 37.6 months, respectively (2). Despite advances in diagnostic and treatment methods, LGG may progress into high-grade glioma in some patients, leading to reduced therapeutic responses and a poorer disease prognosis. Therefore, exploring the underlying molecular mechanisms and prognostic indicators is still urgently required for patients with LGG.
Iron, an essential dietary element, participates in both biological and pathological processes. In contrast to normal cells, many tumor cells become dependent on iron in order to grow faster and, thus, are more susceptible to iron depletion. This phenomenon is known as iron addiction (3). Data from previous studies showed that tumor cells can increase intracellular iron levels by modulating expression of the transferrin receptor, ferroportin, and ferritin (4–8). Dysregulation of iron metabolism-related genes promotes tumor cell proliferation, invasion, and metastasis (9). Iron accumulation, as well as iron-catalytic reactive oxygen/nitrogen species and aldehydes, can cause DNA-strand breaks and tumorigenesis (9, 10). Iron also participates in several types of cell death (11), especially ferroptosis (3).
The association between high-grade glioma and iron metabolism has been reported previously. Jaksch-Bogensperger et al. showed that patients with high-grade glioma have higher serum ferritin levels (12). Glioblastoma cancer stem-like cells can absorb iron from the microenvironment more effectively, by upregulating their expression levels of ferritin and transferrin receptor 1 (8). In addition, iron accumulation promotes the proliferation of glioma cells (13). Hypoxia-induced ferritin light chain expression is also involved in the epithelial-mesenchymal transition (EMT) and chemoresistance of high-grade glioma (14). Recently, some therapeutic methods targeting cellular iron and iron-signaling pathways have been tested, including iron chelation, treatment with curcumin or artemisinin, and RNA interference (10). However, the toxicities and side effects of iron chelators limit their applications in treating gliomas (15). Therefore, there is still a need to attain a deeper understanding of iron metabolism in LGGs.
In this study, iron metabolism-related genes were investigated. We performed a comprehensive bioinformatics analyses based on gene-expression levels, DNA methylation, copy-number alteration patterns, and clinical data from The Cancer Genome Atlas (TCGA). By identifying dysregulated iron metabolism-related genes, we constructed a risk-score system of LGG and validated it in the TCGA and Chinese Glioma Genome Atlas (CGGA) datasets. In addition, function analysis and gene set enrichment analysis (GSEA) were performed between the high-risk and low-risk groups to investigate the potential pathways and mechanisms related to iron metabolism. Our results showed that a 15-gene signature could be used as an independent predictor of OS in patients with LGG.
Iron metabolism-related genes were retrieved from gene sets downloaded from the Molecular Signatures Database (MSigDB) version 7.1 (16, 17), including the GO_IRON_ION_BINDING, GO_2_IRON_2_SULFUR_CLUSTER_BINDING, GO_4_IRON_4_SULFUR_CLUSTER_BINDING, GO_IRON_ION_IMPORT, GO_IRON_ION_TRANSPORT, GO_IRON_COORDINATION_ENTITY_TRANSPORT, GO_RESPONSE_TO_IRON_ION, MODULE_540, GO_IRON_ION_HOMEOSTASIS, GO_CELLULAR_IRON_ION_HOMEOSTASIS, GO_HEME_BIOSYNTHETIC_PROCESS, HEME_BIOSYNTHETIC_PROCESS, GO_HEME_METABOLIC_PROCESS, HEME_METABOLIC_PROCESS, HALLMARK_HEME_METABOLISM, and REACTOME_IRON_UPTAKE_AND_TRANSPORT gene sets. We also reviewed the literature and added the previously reported genes (18, 19). After removing overlapping genes, we obtained an iron metabolism-related gene set containing 527 genes.
Gene expression data for 523 LGG samples (TCGA) and 105 normal cerebral cortex samples (GTEx project) were downloaded from a combined set of TCGA, TARGET, and GTEx samples in UCSC Xena (https://tcga.xenahubs.net). Clinical information for patients with LGG was obtained from using the “TCGAbiolinks” package written for R (20–22). Gene expression data and clinicopathological information for 443 patients with LGG were retrieved from CGGA database (http://www.cgga.org.cn/) and were selected as a test set. Data from patients without prognostic information were excluded from our analysis. Ultimately, we obtained a TCGA training set containing 506 patients and a CGGA test set with 420 patients. Ethics committee approval was not required since all the data were available in open-access format.
First, we screened out 402 duplicate iron metabolism-related genes that were identified in both TCGA and CGGA gene expression matrixes. Then, differentially expressed genes (DEGs) between the TCGA-LGG samples and normal cerebral cortex samples were analyzed using the “DESeq2”, “edgeR” and “limma” packages of R software (version 3.6.3) (23–26). The DEGs were filtered using a threshold of adjusted P-values of < 0.05 and an absolute log2-fold change >1. Venn analysis was used to select overlapping DEGs among the three algorithms mentioned above. Eighty-seven iron metabolism-related genes were chosen for downstream analyses. Additionally, functional enrichment analysis of selected DEGs was performed using Metascape (https://metascape.org/gp/index.html#/main/step1) (27).
Univariate Cox proportional hazards regression was performed for the genes selected for the training set using “ezcox” package (28). P < 0.05 was considered to reflect a statistically significant difference. To reduce the overfitting high-dimensional prognostic genes, the Least Absolute Shrinkage and Selection Operator (LASSO)-regression model was performed using the “glmnet” package (29). The expression of identified genes at protein level was studied using the Human Protein Atlas (http://proteinatlas.org). Subsequently, the identified genes were integrated into a risk signature, and a risk-score system was established according to the following formula, based on the normalized gene expression values and their coefficients. The normalized gene expression levels were calculated by TMM algorithm by “edgeR” package.
The risk score was calculated for each patients with LGG in this study, and the distribution and receiver operating characteristic (ROC) curve were plotted using “timeROC” package (30). According to the median risk score in the training set, patients were divided into high- or low- risk groups. Patients were also divided into subgroups according to clinicopathological features, including age, gender, WHO grade, histological type, isocitrate dehydrogenase 1 (IDH1) mutation status, 1p19q codeletion status, and O6‐methylguanine‐DNA methyl‐transferase (MGMT) promoter methylation status. Boxplot were plotted using the “ggpubr” package to identify associations between risk scores and clinical features. In addition, the relationships between risk scores and OS rates in different groups and subgroups were evaluated by Kaplan-Meier survival analysis and log-rank testing.
To evaluate whether the risk score system can serve as an independent predictive index, univariate and multivariate Cox regression analyses were performed with clinicopathological parameters, including the age, gender, WHO grade, IDH1 mutation status, 1p19q codeletion status, and MGMT promoter methylation status. All independent prognostic parameters were used to construct a nomogram to predict the 1-, 3- and 5-year OS probabilities by the ‘rms’ package. Concordance index (C-index), calibration and ROC analyses were used to evaluate the discriminative ability of the nomogram (31).
DEGs between high- and low-risk groups in the training set were calculated using the R packages mentioned above. Then, GSEA (http://software.broadinstitute.org/gsea/index.jsp) was performed to identify hallmarks of the high-risk group compared with the low-risk group.
The TIMER database (http://timer.cistrome.org/) is a comprehensive web tool that provide automatic analysis and visualization of immune cell infiltration of all TCGA tumors (32, 33). The infiltration estimation results generated by the TIMER algorithm consist of 6 specific immune cell subsets, including B cells, CD4+ T cells, CD8+ T cells, macrophages, neutrophils and dendritic cells. We extracted the infiltration estimation results and assessed the different immune cell subsets between high-risk and low-risk groups (34).
All statistical analyses in this study were conducted using R software (version 3.6.3) and GraphPad Prism (version 8.0.2). The log-rank test was used for the Kaplan-Meier survival analysis. Hazard ratios (HRs) and 95% confidence intervals (CIs) were reported where applicable. Student’s t-test and the Kruskal–Wallis test were employed in the two-group comparisons. A two-tailed P value of <0.05 was considered statistically significant without specific annotation.
The data we used were retrieved from open-access databases. The majority of statistical codes are available in File S1.
Based on the MSigDB and a literature review, we selected 527 iron metabolism-related genes for analysis. Four hundred and two genes remained after excluding genes not present in the TCGA-LGG or CGGA-LGG set. According to the criteria for DEG, we identified 7,223 DEGs between 523 TCGA-LGG samples and 105 normal brain cortex samples based on overlapping edgeR, limma, DESeq2 analysis results (Figure 1A). Then, a total of 87 iron metabolism-related genes (50 up-regulated and 37 down-regulated) among the DEGs were selected for further analysis (Figure 1B). Enrichment analyses were performed to explore the functions of the selected genes. These genes were significantly enriched in terms of iron ion binding, iron ion metastasis, and iron ion transport (Figure 1C). Kyoto Encyclopedia of Genes and Genomes (KEGG) enrichment analysis showed that ferroptosis, mineral absorption, the p53 signaling pathway and the AMPK signaling pathway were enriched (Figure 1D).
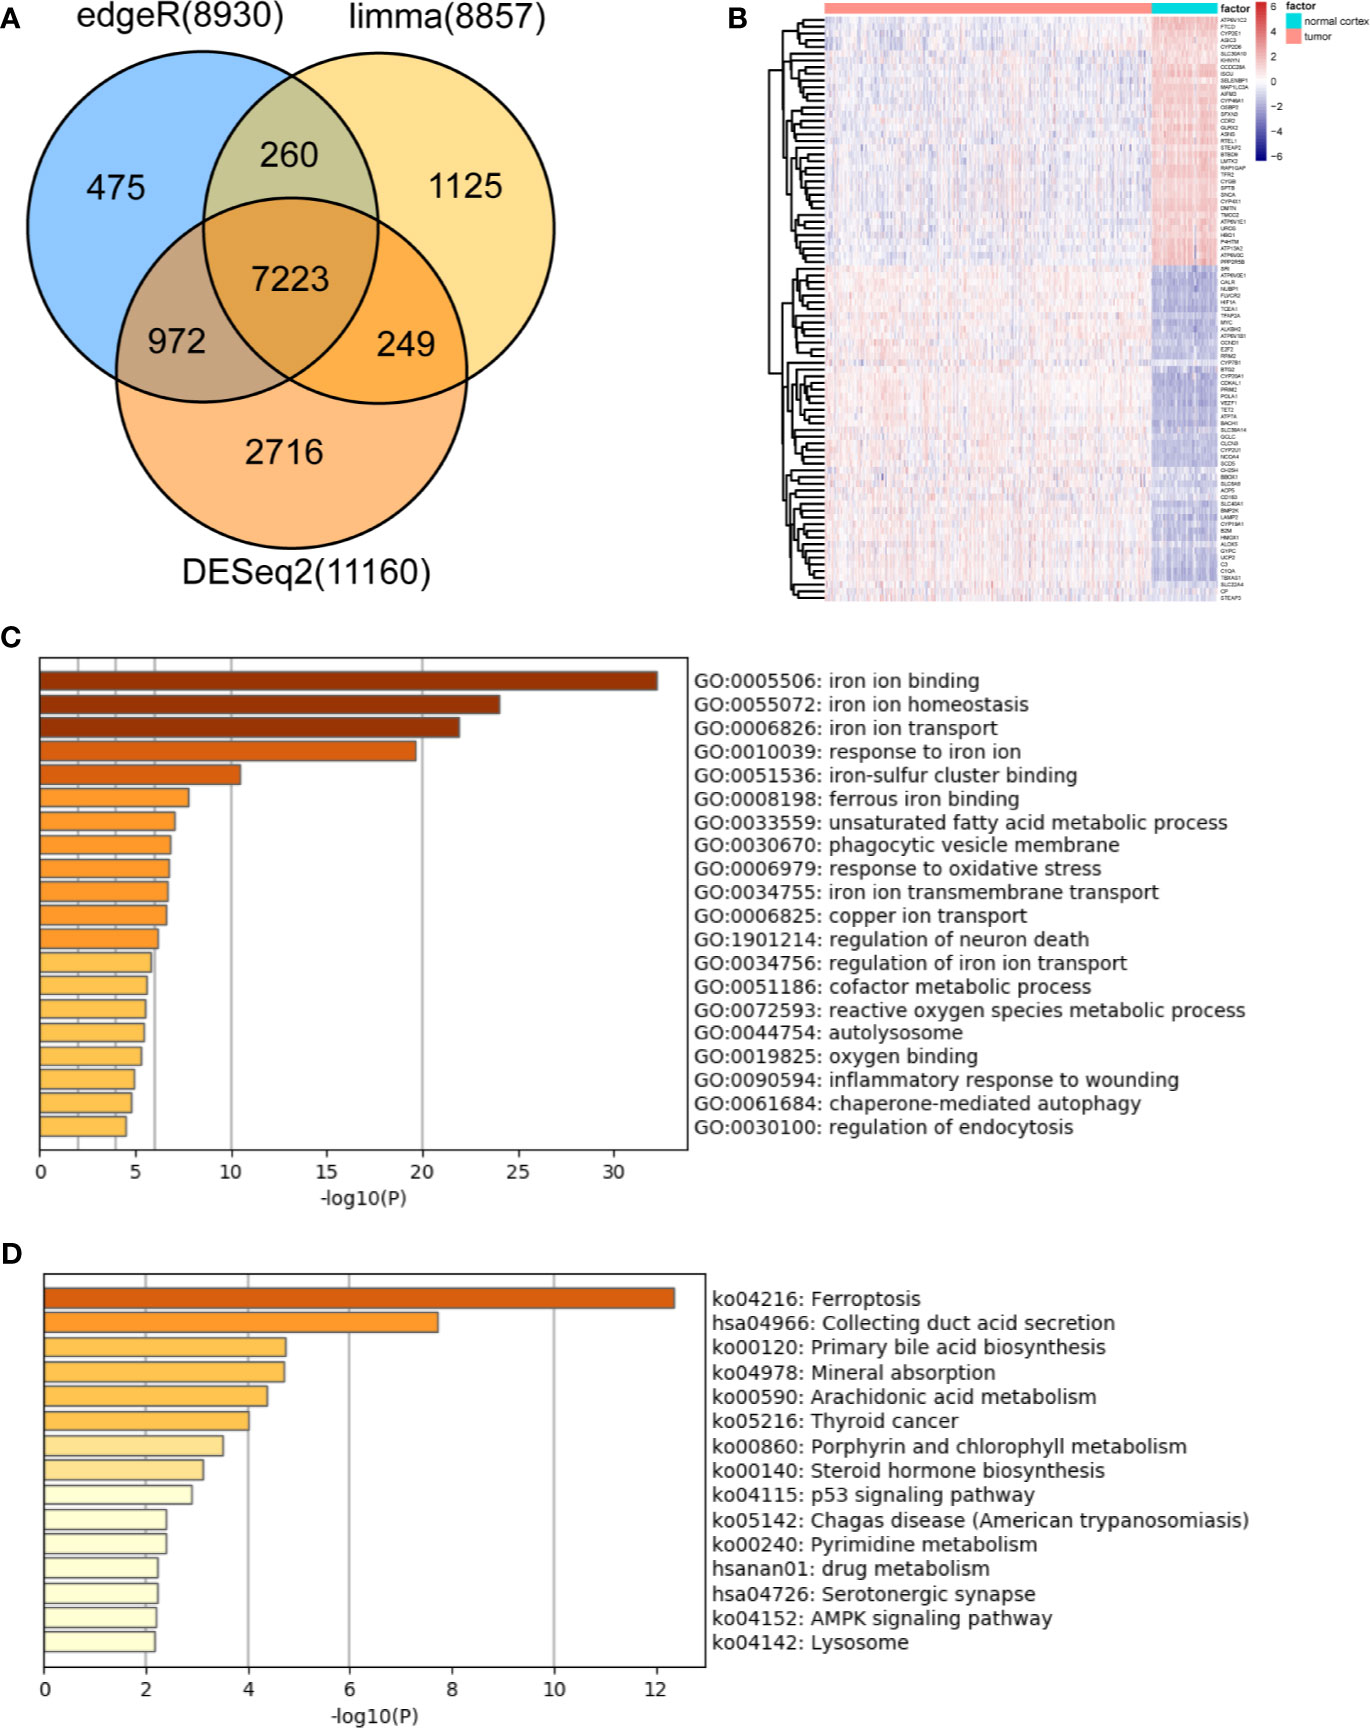
Figure 1 Identification and functional enrichment analysis of dysregulated iron metabolism-related genes between the TCGA-LGG cohort and normal brain cortex samples. (A), Venn diagram representing intersections of DEGs identified using edgeR, limma, and DESeq2 algorithms. (B), Heatmap of the expression levels of 87 DEGs related to iron metabolism. Enriched Gene Ontology terms (C) and KEGG pathways (D) associated with the 87 DEGs.
First, univariate Cox regression was used to investigate the relationship between the expression levels of the selected genes and OS time in the training set. Using cut-off threshold of Cox P < 0.05, 47 genes were identified as potential risk factors related to OS (Table S1). Subsequently, the LASSO regression algorithm was used to refine the gene sets by calculating regression coefficients (Figures 2A, B). In this manner, 15 genes were identified as the most valuable predictive genes, and the risk-score system was established using the formula mentioned above (Table 1).
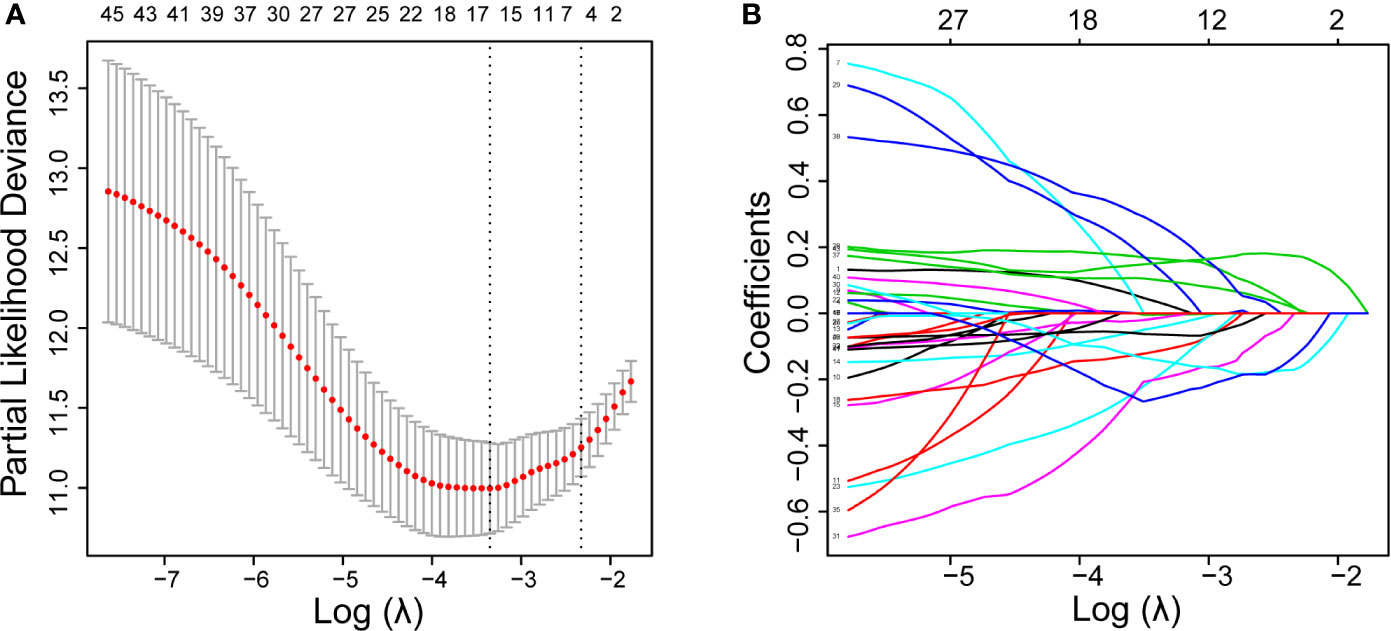
Figure 2 DEGs with univariate Cox regression P-value of < 0.05 are shown. Identification of prognostic signatures in the training set. (A), Cross-validation for tuning parameter screening in the LASSO regression model. (B), Coefficient profiles in the LASSO regression model.
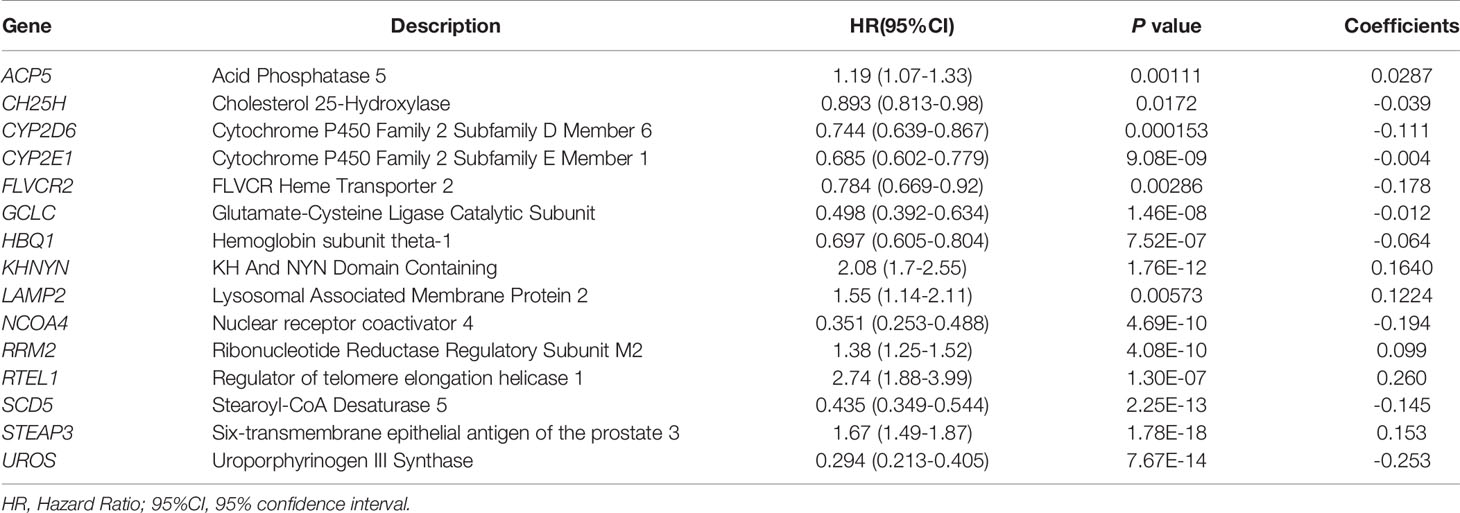
Table 1 Iron metabolism-related genes and their relationship with OS, and their coefficients in LASSO regression model.
We also confirmed the expression level of these identified genes by Immunohistochemical analysis in Human Protein Atlas (HPA). And the results were shown in Figure 3. 6 of these genes were dysregulated in LGG and higher-grade glioma samples. The expressions level of GCLC, NCOA4, UROS were higher in LGG samples, whereas the expression levels of LAMP2, RRM2, STEAP3 were lower in LGG than HGG samples. CH25H and RTEL1 were missing in HPA database. ACP5, CYP2D6, HBQ1, KHNYN, and SCD5 were not detected in glioma samples. However, the expression levels of CYP2E1 and FLVCR2 showed low consistency with RNA expression data.
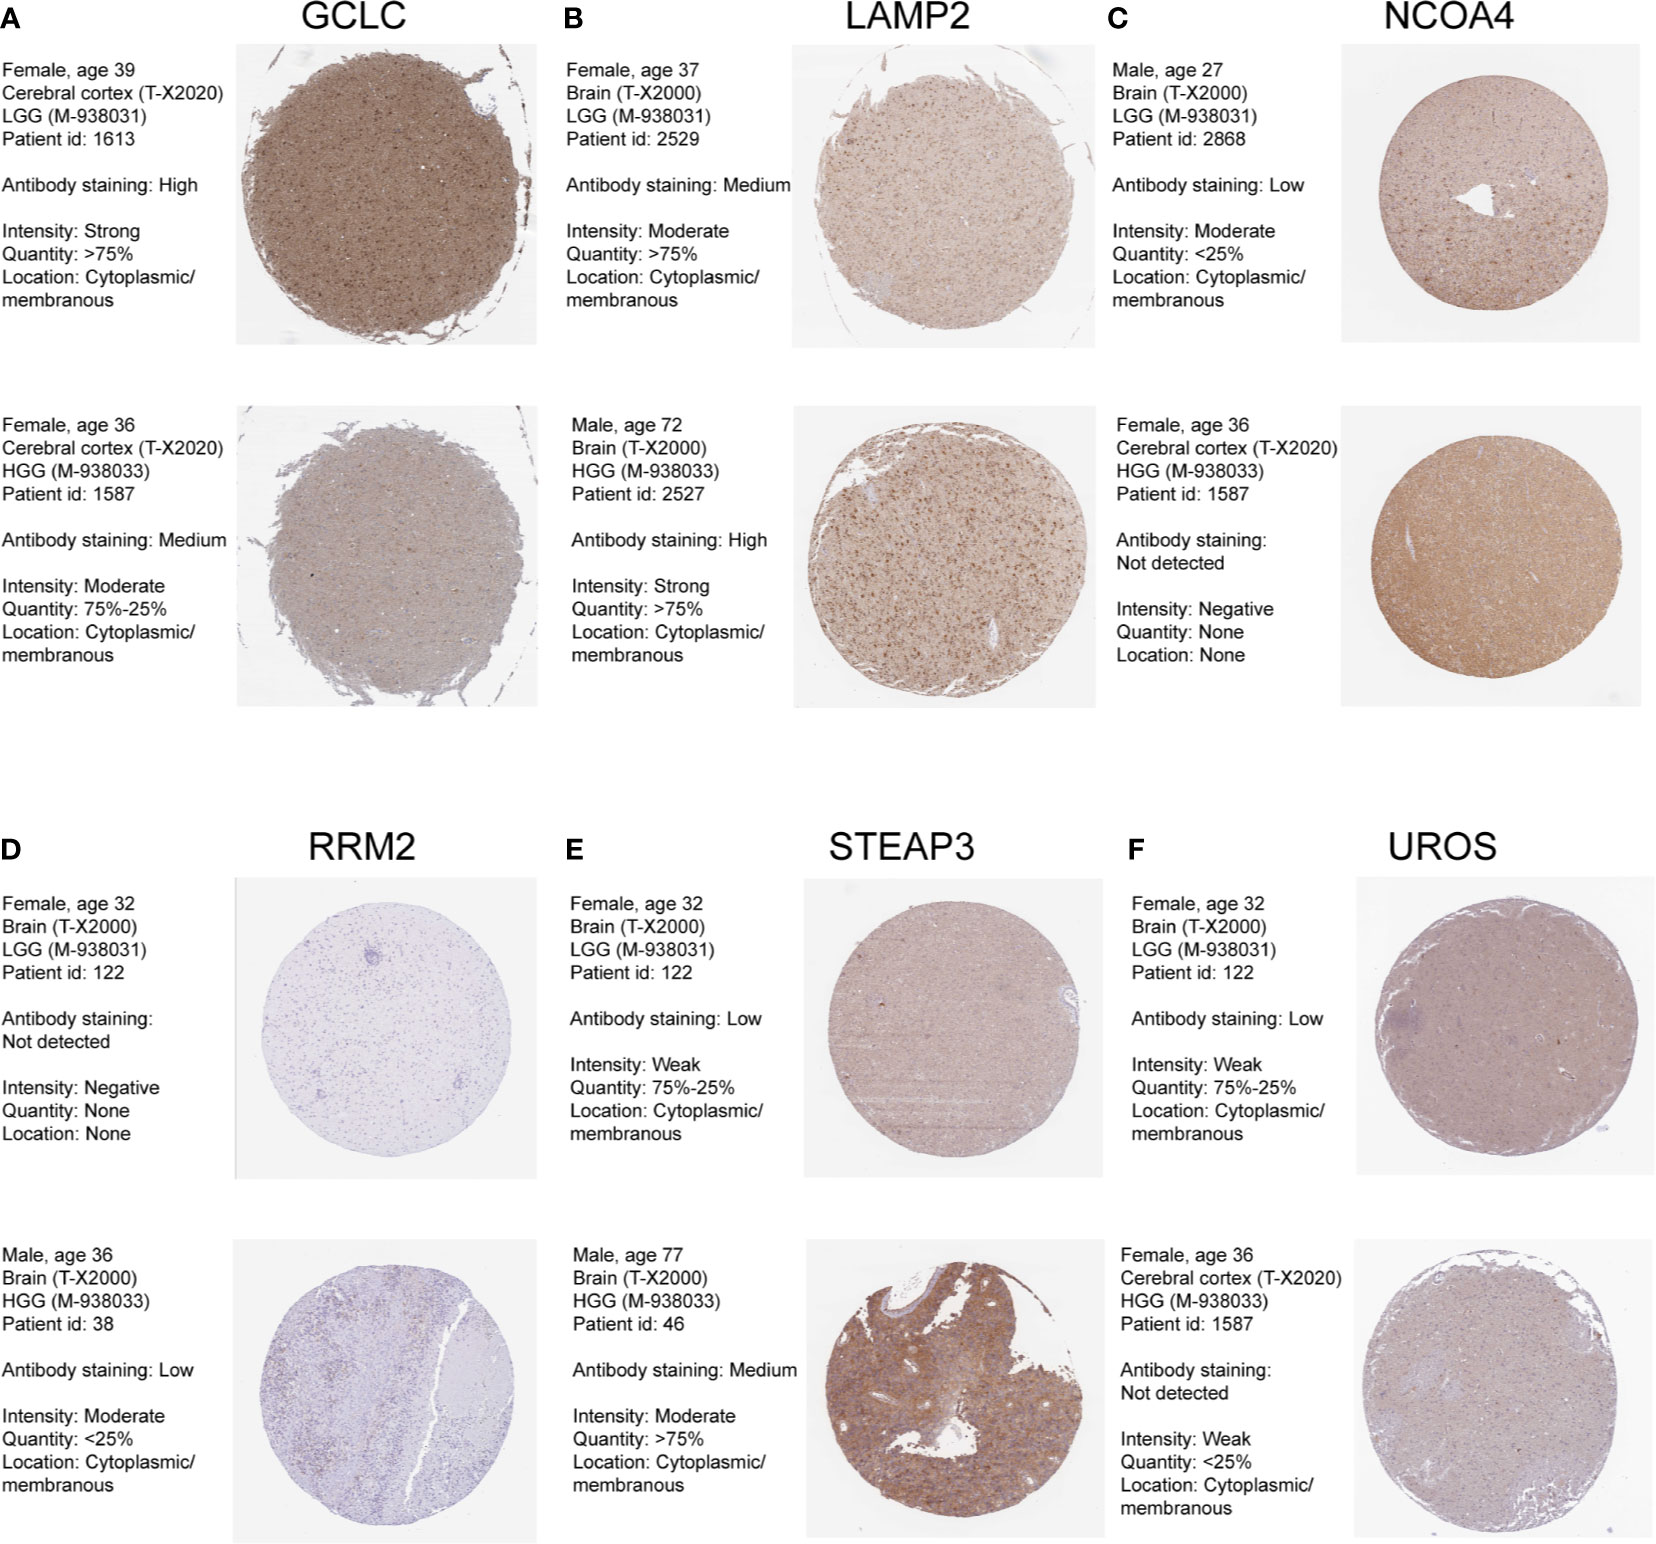
Figure 3 Human Protein Atlas immunohistochemical analysis of LGG and Higher-grade glioma. (A) GCLC; (B) LAMP2; (C) NCOA4; (D) RRM2; (E) STEAP3; (F) UROS.
The risk score for each patient in the training and test sets was calculated based on the expression levels of the selected genes and the regression coefficients. The distribution of risk score in training set was shown in Figure 4A. The median of risk score in training set was defined as threshold, which divided the patients into high-risk and low-risk groups. In addition, the distribution of survival times indicated that a higher risk score may have positively correlated with poorer outcomes (Figure 4A). The corresponding expression levels of the selected genes were determined (Figure 4A). The performance of the ROC in terms of 1-, 3-, and 5-year prognoses was analyzed (Figure 4B). The areas under the time‐dependent ROC curve (AUCs) were 0.892, 0.888, and 0.838, respectively, for the 1-, 3-, and 5-year OS times in the training set. Kaplan–Meier analysis and log-rank testing showed that the high-risk group had a significantly shorter OS time than the low-risk group (P < 0.0001; Figure 4C).
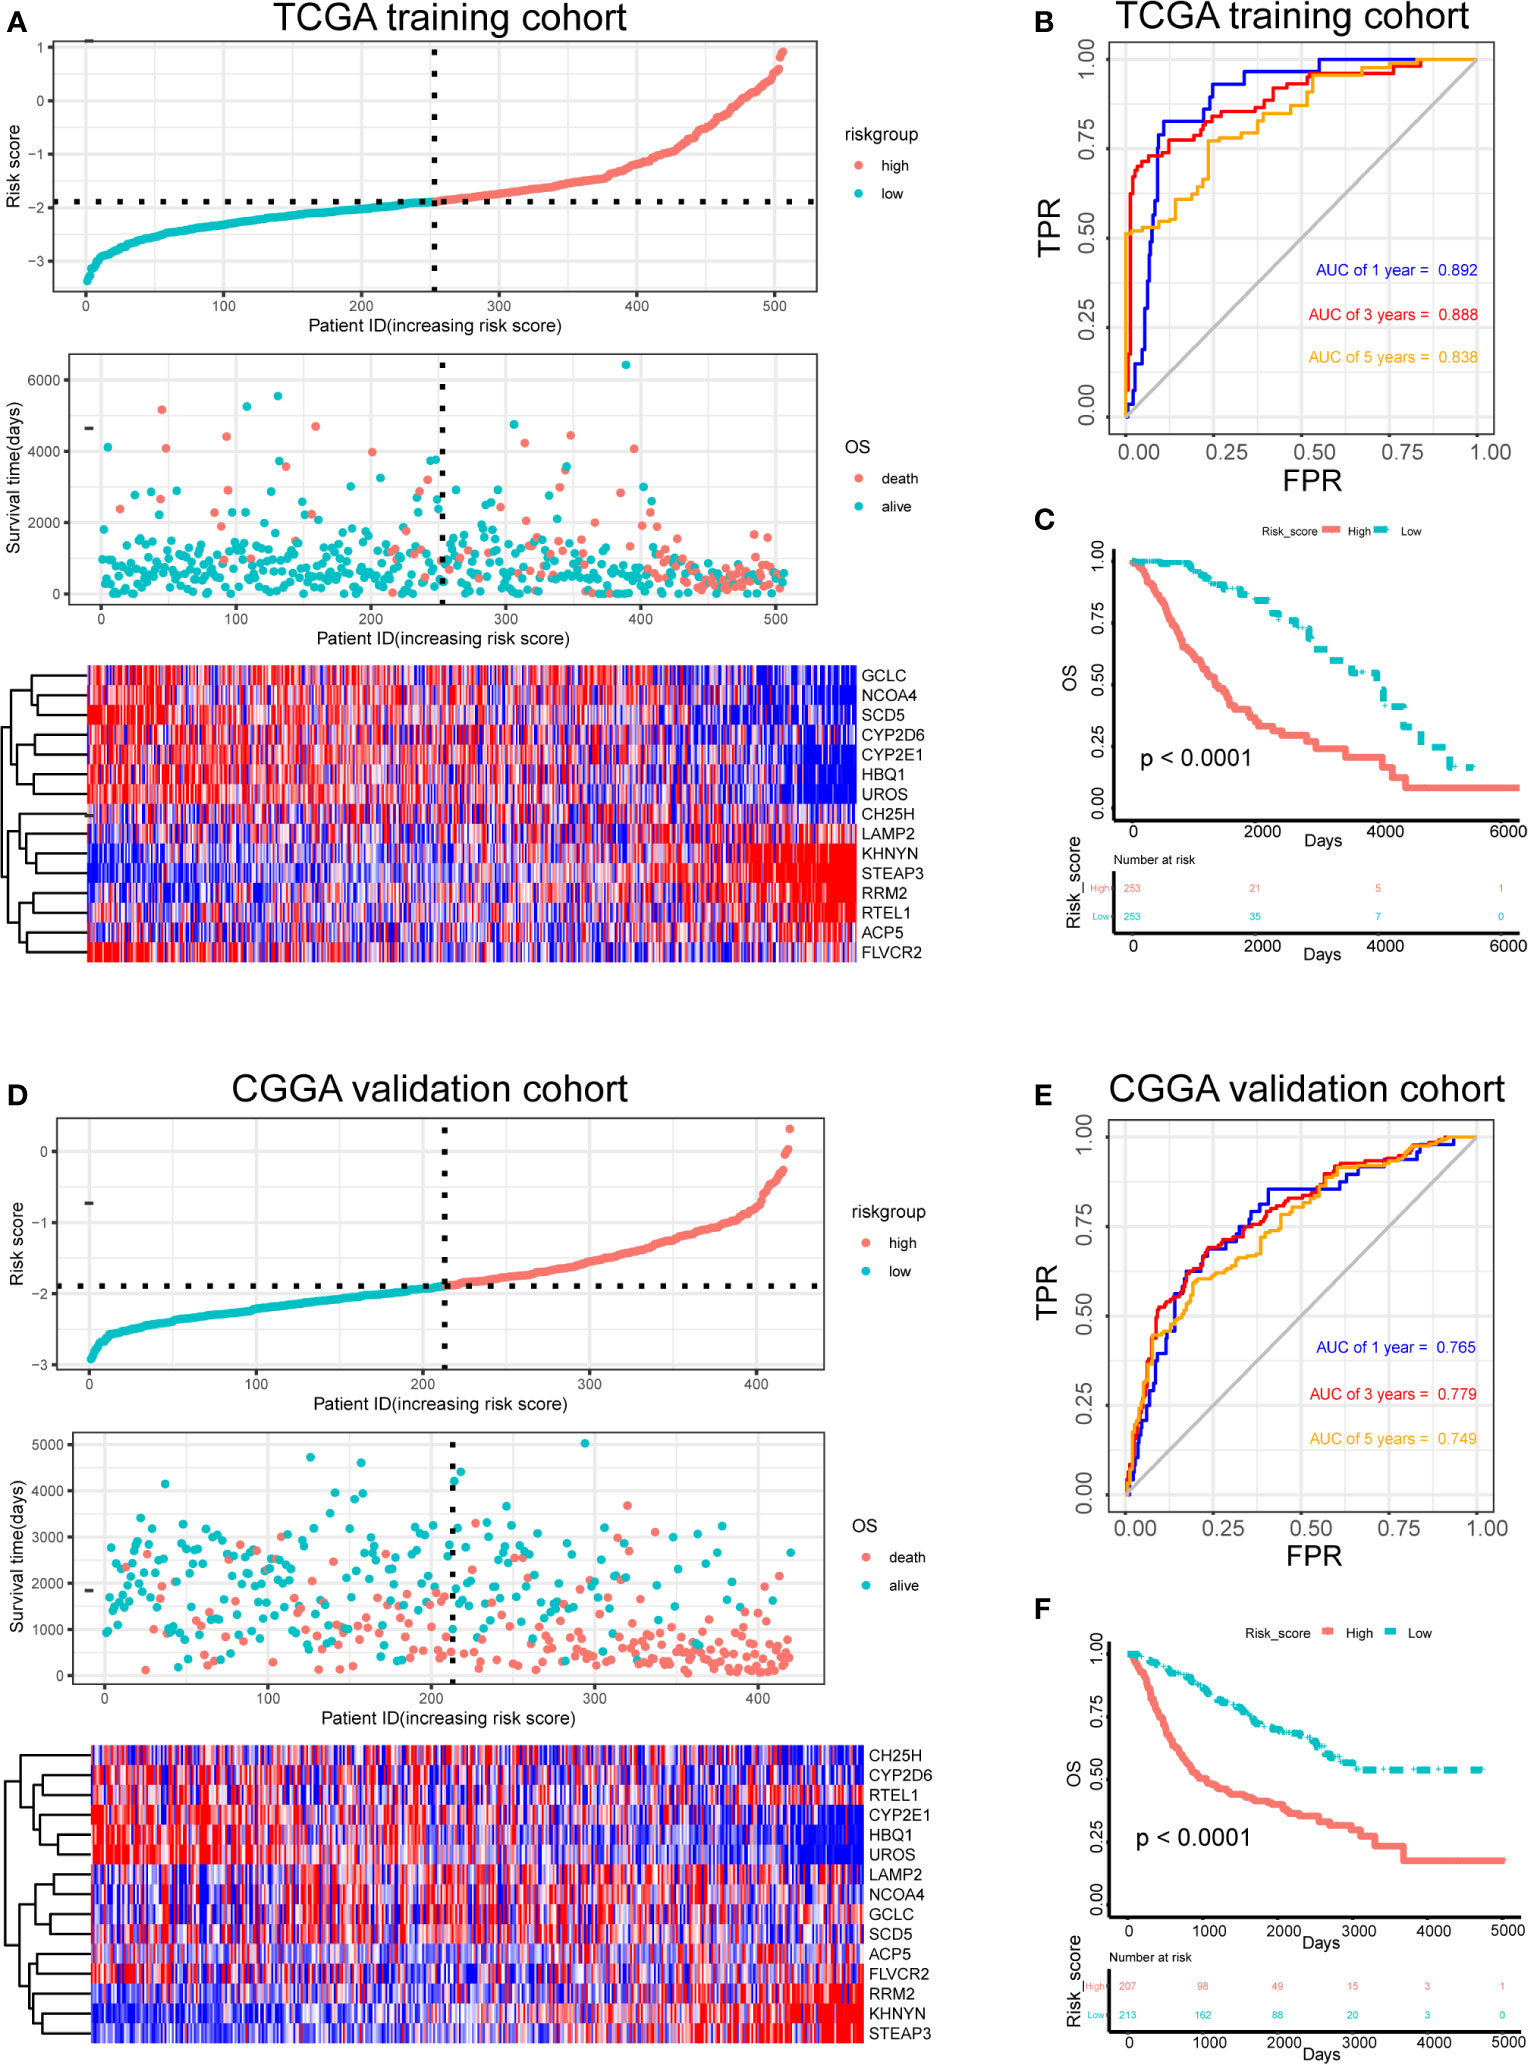
Figure 4 Risk score analysis, survival analysis and prognostic performance of a risk-score model based on differential expression of iron metabolism-related genes in patients with LGG. Risk score and survival time distributions, and heatmaps of gene-expression levels of the iron-metabolism signature in the TCGA (A) and CGGA (D) cohorts. ROC curves and AUC values of the risk score model for predicting the 1-, 3-, and 5-year OS times in the TCGA (B) and CGGA (E) cohorts. Kaplan–Meier survival analysis was performed to estimate the OS times between the high- and low-risk groups in the TCGA (C) and CGGA (F) cohorts.
Furthermore, the robustness of our risk-score model was assessed with the CGGA dataset. The test set was also divided into high-risk and low-risk groups according to the threshold calculated with the training set. The distributions of risk scores, survival times, and gene-expression level are shown in Figure 4D. The AUCs for the 1-, 3-, and 5-year prognoses were 0.765, 0.779, and 0.749, respectively (Figure 4E). Significant differences between two groups were determined via Kaplan–Meier analysis (P < 0.0001), indicating that patients in the high-risk group had a worse OS (Figure 4F). These results showed that our risk score system for determining the prognosis of patients with LGG was robust.
Associations between risk-score and clinical features in the training set were examined. We found that the risk score was significantly lower in groups of patients with age > 40 (P < 0.0001), WHO II LGG (P < 0.0001), oligodendrocytoma (P < 0.0001), IDH1 mutations (P < 0.0001), MGMT promoter hypermethylation (P < 0.0001), and 1p/19q co-deletion (P < 0.0001) (Figures 5A–F). However, no difference was found in the risk scores between males and females (data not shown). In both astrocytoma and oligodendrocytoma group, risk score was significantly lower in WHO II group (Figures 5G, H). We also validate the prediction efficiency with different subgroups. Kaplan–Meier analysis showed that high-risk patients in all subgroups had a worse OS (Figure S1). Besides, the risk score was significantly higher in GBM group compared with LGG group (Figure S2).
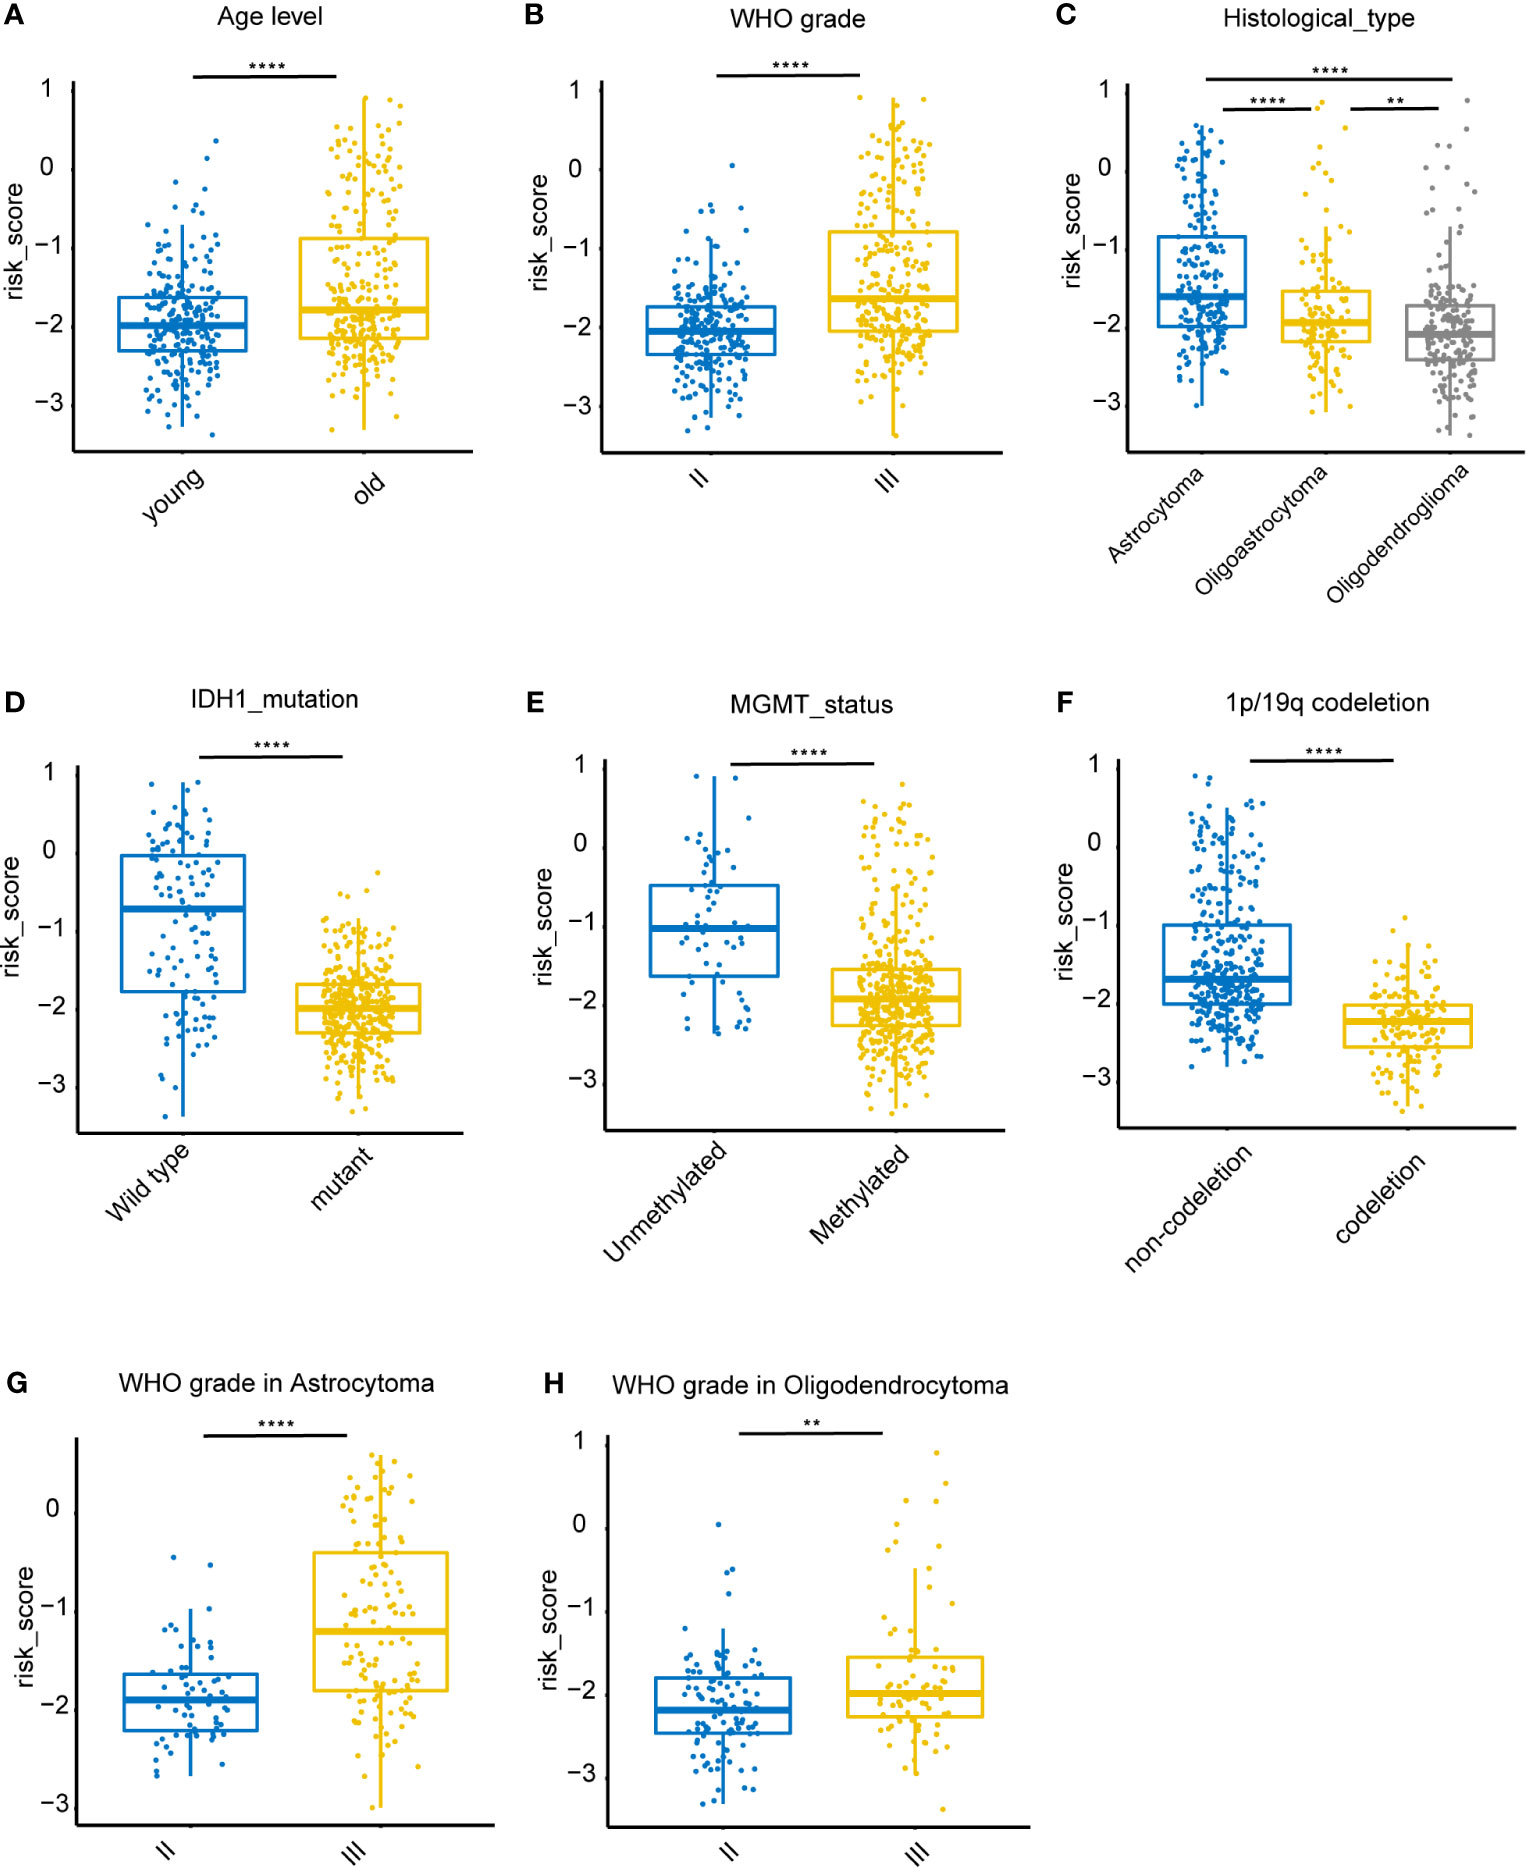
Figure 5 Association between clinicopathologic features and the iron metabolism based risk score in the TCGA dataset. (A–F), Risk-score distributions showed statistically significant differences in LGG patients stratified by age, WHO grade, pathological types, IDH1 mutation status, MGMT promoter methylation status, and 1p/19q co-deletion status. (G), Distribution of risk scores between WHO II and WHO III grade in astrocytoma patients. (H), Distribution of risk scores between WHO II and WHO III grade in oligodendrocytoma patients. **P < 0.005, ****P < 0.0001, ns, not significant.
To determine whether the risk score was an independent risk factor for OS in patients with LGG, the potential predictors (age group, gender, WHO grade, IDH1 mutation status, MGMT promoter status, 1p/19q status and risk level) were analyzed by univariate Cox regression with the training set (Table 2). The individual risk factors associated with a Cox P value of < 0.05 were further analyzed by multivariate Cox regression (Table 2). The analysis indicated that the high-risk group had significantly lower OS (HR = 2.656, 95% CI = 1.51-4.491, P = 0.000268). The age group, WHO grade, IDH mutant status, MGMT promoter status and risk level were considered as independent risk factors for OS, and were integrated into the nomogram model (Figure 6A). The C-index of the nomogram model was 0.833 (95% CI = 0.800-0.867). Subsequently, we calculated the score of each patient according to the nomogram, and the prediction ability and agreement of the nomogram was evaluated by ROC analysis and a calibration curve. In the TCGA cohort, the AUCs of the nomograms in terms of 1-, 3-, and 5-year OS rates were 0.875, 0.892, and 0.835, respectively (Figure 6B). The calibration plots showed excellent agreement between the 1-, 3-, and 5-year OS rates, when comparing the nomogram model and the ideal model (Figures 6D–F). Moreover, we validated the efficiency of our nomogram model with the CGGA test set. The AUCs for the 1-, 3-, and 5-year OS rates with the model were 0.722, 0.746, 0.701, respectively (Figure 6C). The results of the calibration curves showed good agreement between the predicted OS rates and the probabilities of the 1-, 3-, and 5-year OS rates with the test set (Figures 6G–I).
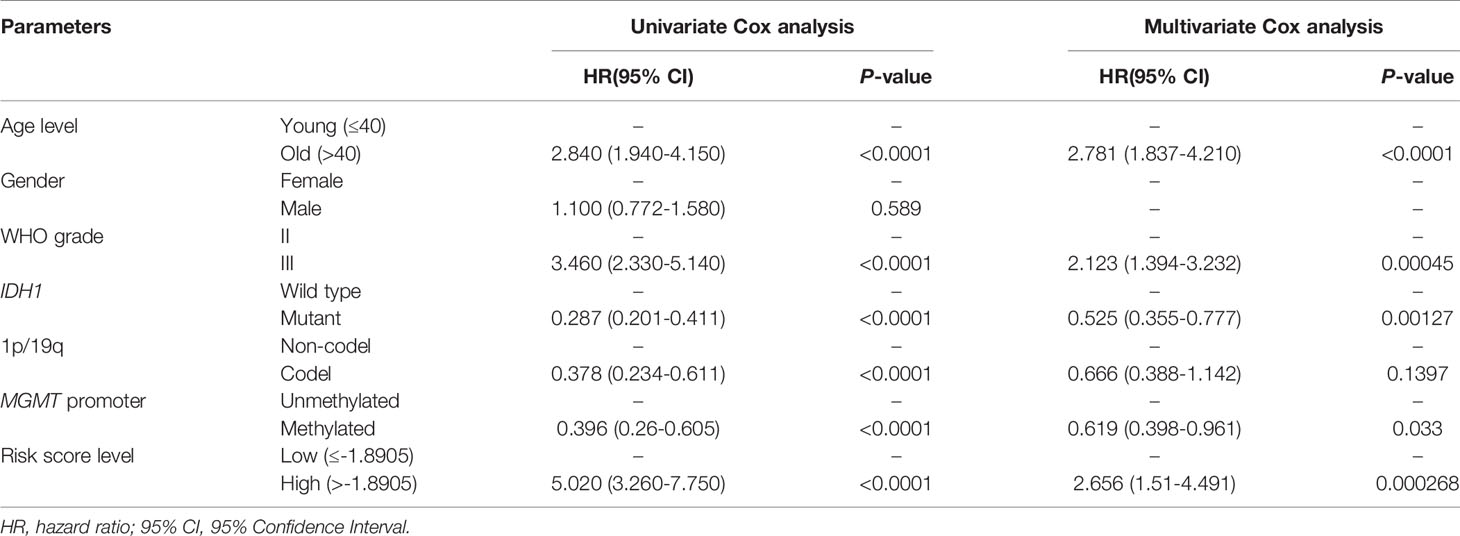
Table 2 Univariate and multivariate Cox analysis of OS in TCGA-LGG dataset.
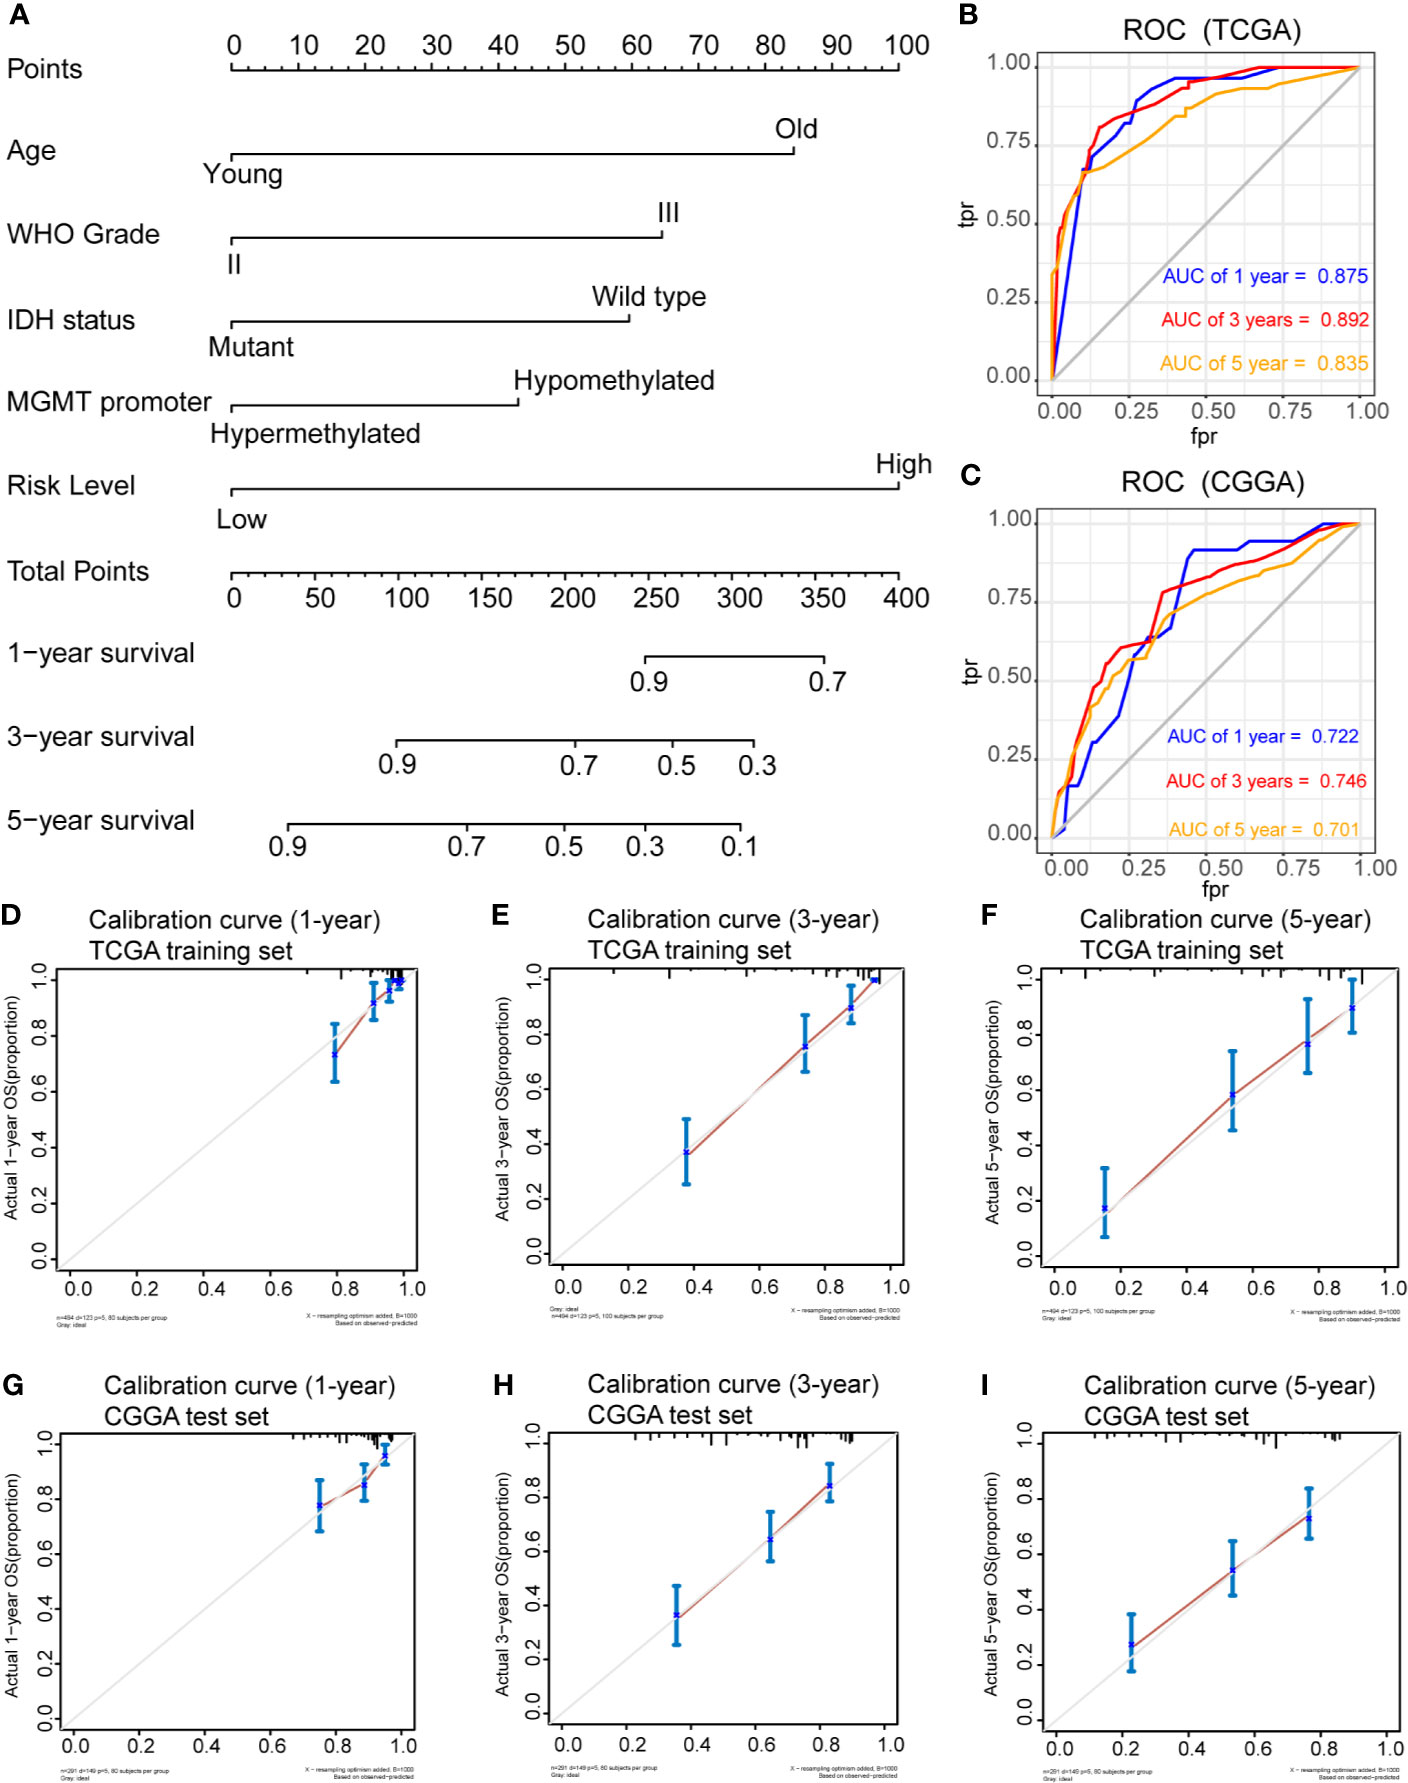
Figure 6 Prognostic nomogram for the 1-, 3-, and 5-year OS times of LGG patients. (A), Independent risk factors screened by multivariate Cox regression in the TCGA cohort were integrated into the nomogram model. ROC curves and AUC values of the nomogram for predicting 1-, 3-, and 5-year OS in the TCGA (B) and CGGA (C) cohorts. Calibration curves of the nomogram for predicting 1-, 3-, and 5-year OS in the TCGA (D–F) and CGGA (G–I) cohorts.
To clarify the potential impact of the expression levels of the selected genes on the LGG transcriptomic profile, GSEA analysis was performed with the high-risk and low-risk groups of the training set. GSEA revealed that several pathways, such as those related to inflammatory response, IL6/JAK/STAT3 signaling, IL2/STAT5 signaling, glycolysis, apoptosis, and the EMT, were enriched in the high-risk group (Figures 7A–F). These findings suggest potential roles for iron metabolism-related genes in the progression, metabolism, tumor microenvironment and immune responses of LGG.
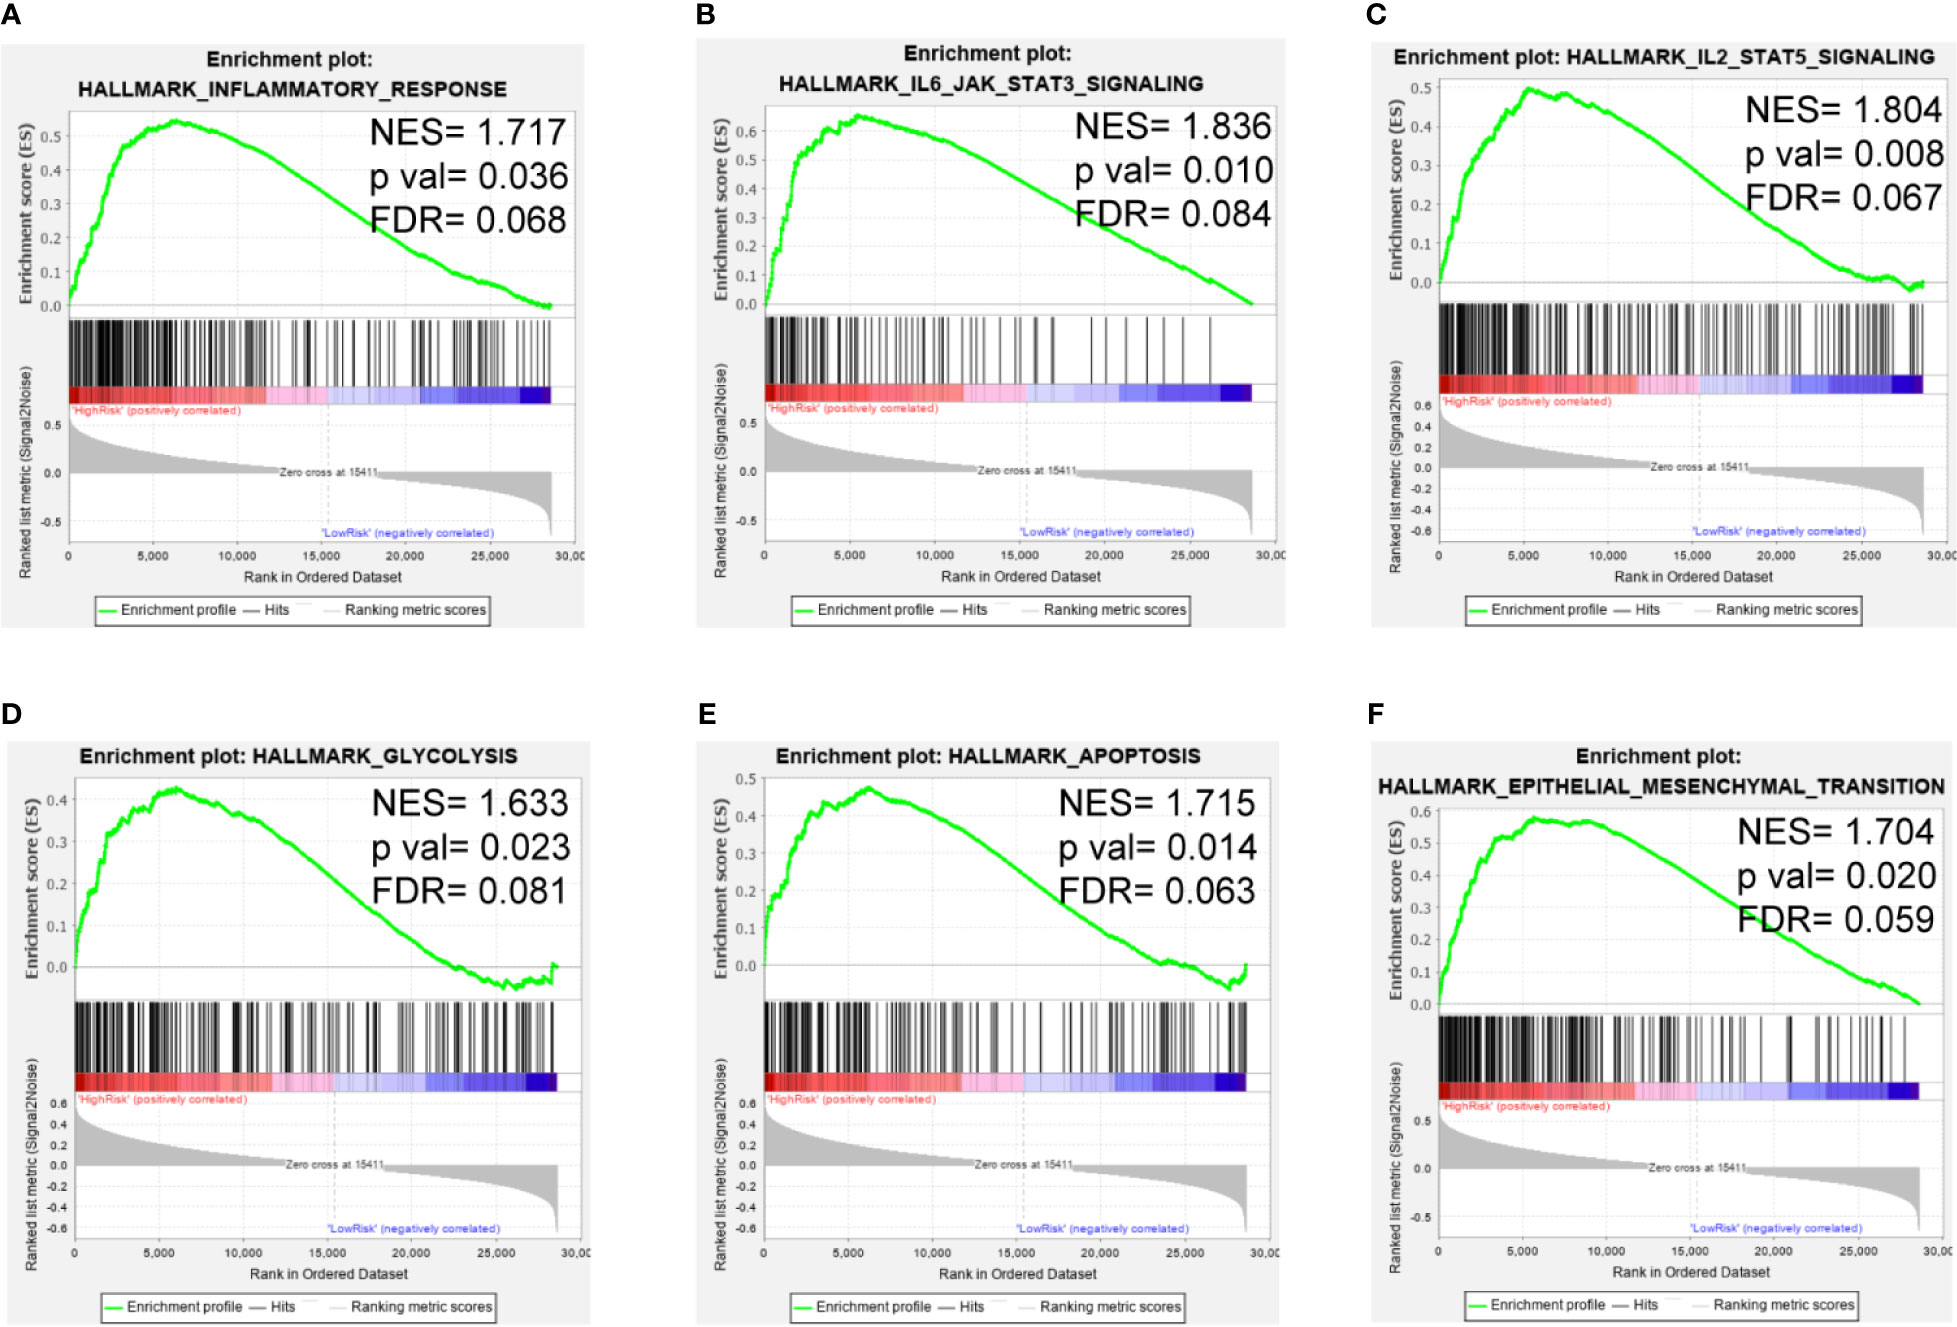
Figure 7 GSEA of the iron metabolism-related gene signature in the TCGA cohort. (A–F), inflammatory response, IL6/JAK/STAT3 signaling pathway, IL2/STAT5 signaling pathway, glycolysis, apoptosis and the EMT were enriched in the high-risk group.
Next, the correlation between this prognostic model and the infiltration of immune cells for patients in the TCGA-LGG cohort were calculated. The proportion of different infiltrating immune cells were retrieved from the TIMER database. The results indicated that the risk score positively correlated with infiltrating immune cells, including B cells, CD4+ T cells, CD8+T cells, neutrophils, macrophages and dendritic cells (Figure 8A). The high-risk group showed more infiltrating immune cells, especially dendritic cells and macrophages (P < 0.0001; Figure 8B). Additionally, we assessed the relationship between risk-score model and immune checkpoint proteins (PD1, PDL1, CTLA4, LAG-3, TIM3, TIGIT and CD48). The expression levels of PD1, PDL1, CTLA4, TIM3, and CD48 positively correlated with the risk score(P < 0.001; Figure 8C). In addition, the expression levels of PD1, PDL1, and TIM3 were higher in high-risk group of TCGA-LGG cohort than in the low-risk group (P < 0.0001; Figure 8D).
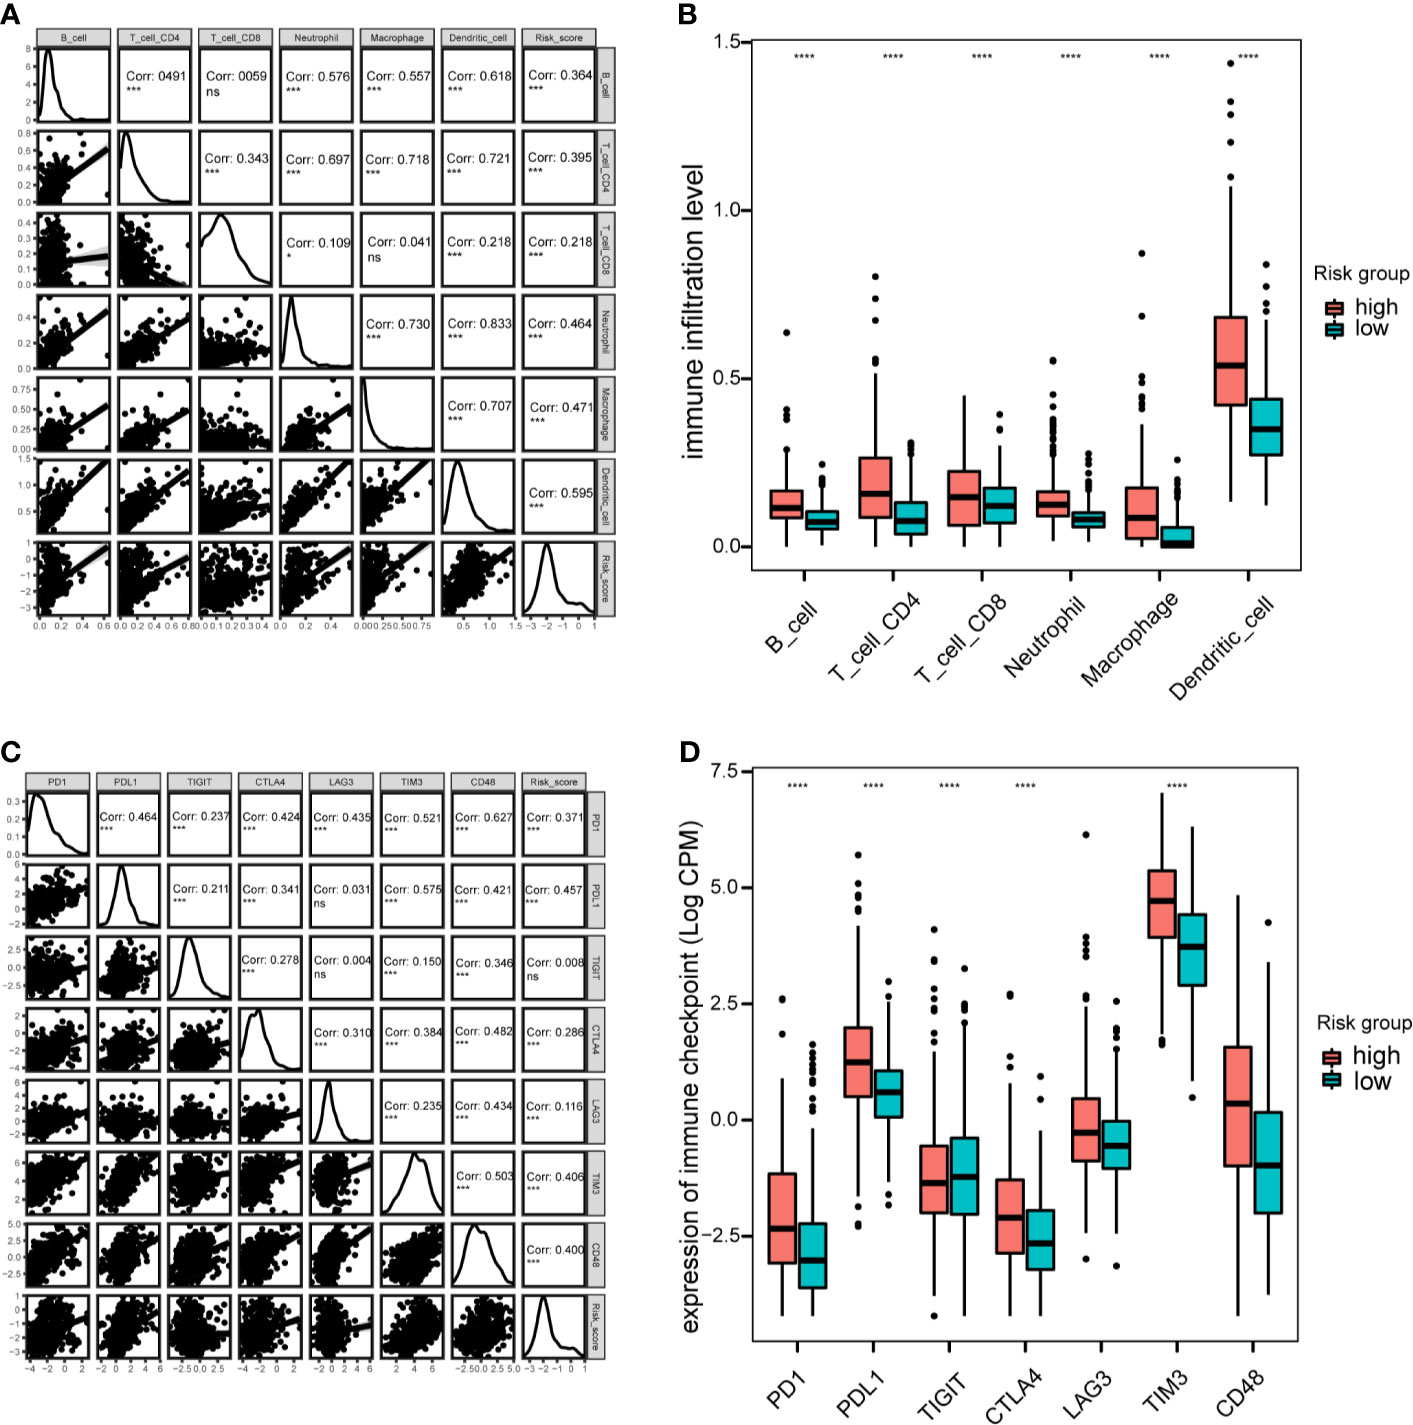
Figure 8 Immune cell infiltration and immune checkpoint analysis in the TCGA cohort. (A), Correlation between immune cell infiltration and risk scores. (B), Boxplot indicating the levels of immune cell infiltration in high-risk and low-risk LGG patients. (C), Correlation matrix of seven immune checkpoint proteins and associated risk scores. (D), Expression levels of immune checkpoint proteins in high-risk and low-risk LGG patients. *P < 0.05, ***P < 0.001, ****P < 0.0001, ns, not significant.
LGG is a heterogeneous disease, especially in terms of tumorigenesis, its molecular characteristics, therapeutic responses and clinical outcomes (2, 35). Currently, recurrence or malignant progression is still inevitable, even after treatment with surgical resection, radiotherapy, chemotherapy and immunotherapy. Recently, iron metabolism was found to participate in glioma tumorigenesis, progression, and the tumor microenvironment (14, 36). GBM cancer stem-like cells uptake much more iron than non stem-like cells (37). However, the non stem-like cells have higher free iron ion level, which reduces cell viability and growth (37). Iron metabolism also recently became a therapeutic target and a potential prognostic marker of glioma (36, 38).
In this study, we used gene expression data and clinicopathological information from open-access database. Initially, we selected 87 iron metabolism-related DEGs. Among these, 15 genes were identified as potential prognostic markers by univariate Cox analysis and LASSO regression analysis, and these genes were used to construct a prognostic model. Among them, the expression levels of six genes (RTEL1, KHNYN, STEAP3, LAMP2, RRM2, and ACP5) negatively correlated with OS, whereas the expression levels of nine genes (CYP2E1, GCLC, CH25H, HBQ1, CYP2D6, SCD5, FLVCR2, NCOA4, and UROS) positively correlated with OS. This model was validated effective and stable with different patient cohorts, and verified as an independent predictive marker by multivariate Cox regression analysis. In addition, patients with wild type IDH1, MGMT hypomethylation, 1p/19q non-codeletion status, or a higher WHO grade had significantly higher risk scores. The higher grade gliomas contained higher proportion of stem like cells, which affected iron uptake and free iron ion level (37). Liu et al. proposed that ferritin light chain may be a upstream regulator of MGMT promoter methylation process (14). However, Kingsbury et al. reported that IDH1 mutation lead to higher level of D-2-hydroxyglutarate (2HG) production, which affects the iron sensing mechanisms and promotes tumor progression (39). Variants of RTEL1 is associated with molecular subtype in IDH wild-type gliomas (32386320, 31842352). These may also result in iron metabolism dysregulation, but the underlying mechanisms still need to be further investigated.
Some data have shown that iron metabolism-related genes are involved in glioma pathological processes. RTEL1, an ATP-dependent DNA helicase, was reported as a risk gene for glioma (40). Some RTEL1 variants may lead to a higher risk for glioma development (41). STEAP3, which encodes metalloreductase, is considered highly expressed in glioblastoma, and knocking down STEAP3 suppresses glioma cell proliferation and metastasis (42). It was also reported that STEAP3 drives EMT progression through STAT3/FoxM1 signaling pathway (42). LAMP2 was found to be overexpressed in the perinecrotic areas of gliomas (43). Valdor et al. reported that LAMP2 participated in activating chaperone-mediated autophagy in a glioma model (44). Sorafenib combined with lapatinib increased the level of LC3-GFP vesicles and reduced the level of LAMP2 (45). RRM2 encodes the M2 subunit of ribonucleotide reductase. RRM2 was reported to promote glioma proliferation and progression through ERK1/2- and AKT- signaling pathways (46, 47). RRM2 expression induced by BRCA1, traditionally regarded as tumor suppressor, promotes tumorigenicity in GBM cells (48).
Additionally, ACP5, which encodes a metalloprotein enzyme, has been reported to promote tumor metastasis and recurrence in many cancers, like hepatocellular carcinoma and breast cancer (49, 50). CYP2E1 encodes a membrane protein and is a member of the cytochrome P450 complex. CYP2E1 RsaI variant has been associated with glioma (51). Bae et al. reported that inhibiting CYP2E1 activity reduced apoptosis in glioma cells and prevented the degradation of p53 (52, 53). CYP2D6 encodes an important member of the cytochrome P450 family. Elexpuru-Camiruaga et al. reported that the CYP2D6 genotype correlated with the susceptibility to astrocytoma and meningioma (54). In addition, a non-functional CYP2D6 variant was previously associated with higher recurrence rates in a breast cancer cohort (55). GCLC encodes catalytic subunits of glutamate-cysteine ligase, which mainly participates in glutathione synthesis and ferroptosis. Previous data showed that intratumoral thymidine from necrotic cells inhibited GCLC activity (56) and that GCLC expression was upregulated in IDH1-mutated compared to IDH1 wild-type glioma (57). Furthermore, Yu et al. confirmed that triptolide induced GCLC degradation drove cytotoxicity due to reactive oxygen species (ROS) in IDH1-mutated glioma (58). The CH25H enzyme belongs to the oxidoreductase family. Previous findings showed that elevated CH25H expression promoted chemotactic monocyte recruitment of glioma cells (59). NCOA4 encodes a receptor that plays important roles in ferritinophagy and iron storage. Liu et al. also identified NCOA4 as a prognostic factor in glioma (60). COPZ1 knockdown increased the expression level of NCOA4, which elevated iron levels and reactive oxygen species, resulting ferroptosis and reduced growth of GBM cells (61). Moreover, Pinton et al. reported that NCOA4 is overexpressed in bone marrow-derived macrophages from glioma lesions (62). UROS, an enzyme associated with congenital erythropoietic porphyria, participates in the heme biosynthesis pathway. Nawaz et al. demonstrated that the expression level of miR-4484, a tumor suppressor, positively correlated with UROS expression, which is considered the host gene of miR-4484 (63).
Some genes, like KHNYN, HBQ1, SCD5 and FLVCR2, may play roles in tumorigenesis, metabolism or tumor therapy (64–68). However, the specific relationships between these genes and glioma still require further exploration.
Furthermore, we constructed a prognostic nomogram model based on iron metabolism-related genes for predicting the OS of patients with LGG. The risk score, WHO grade, and 1p/19q co-deletion status were integrated into the nomogram model. Calibration plots and ROC analysis illustrated the reliable predictive ability of the nomogram for OS with the TCGA and CGGA cohorts. This nomogram model could be used for determining patients’ prognoses and scheduling follow-up plans.
Moreover, GSEA showed that pathways associated with immune responses and tumor progression were enriched in the high-risk group. Yao et al. confirmed that activation of the IL-6/JAK/STAT3 signaling pathway led to poor outcomes in patients with glioma (69, 70). STAT5 was also found to promote glioma cell invasion (71). Both pathways are related to tumor-associated immune cells and regulate immunotherapeutic responses (72). Taga et al. reported that co-expression of genes related to the extracellular matrix, iron metabolism, and macrophages was associated with treatment outcomes in patients with glioma (36). mTOR complex 2 can control iron metabolism by regulating acetylation of iron-related genes promoter, promoting tumor cell survival (73). Previous reports showed that iron chelator therapy inhibited EMT in many cancers (74, 75). Both Dp44mT and bovine lactoferrin, as iron chelators, suppress growth, migration, and EMT process of glioma by inhibiting IL-6/STAT3 signaling pathway (38, 76). Iron complexes could suppress glioma cells proliferation associated with P53 and 4E binding protein 1 (77). Additionally, iron and copper complexes with antioxidant effects also inhibit EMT in glioma cells (78).
Immune cell infiltration analysis showed that the risk score positively correlated with the infiltration levels of immune cells, in accordance with previous data showing that higher numbers of glioblastoma-associated myeloid cells were associated with poor outcomes in GBM (79). Similarly, previous evidence suggested that M2 tumor-associated macrophages exhibited an iron-release phenotype and drove immune tolerance (9). Glioma cells could exploit monocytes as iron-string macrophages (80), and iron-related genes were overexpressed in macrophages (62). However, heme and iron can drive TAM into an proinflammatory phenotype, and iron nanoparticles are considered as promising anti-tumor agents (81). Additionally, neutrophils infiltration were induced during tumor progression(chronic ischemia, hypoxia…), resulting tumor ferroptosis and poor survival (82). Moreover, iron can modulate T cell phenotypes (83). Based on immune checkpoint analysis, our risk score also positively correlated with the expression levels of immune checkpoints proteins, like PD1, PDL1, CTLA4, and TIM3. These findings indicate that iron metabolism-related genes may predict or influence immunotherapeutic effects in patients with LGG.
In conclusion, we developed and validated a risk score system based on iron metabolism-related genes from TCGA and CGGA datasets for prognosis and risk stratification. A nomogram model for 1-, 3-, and 5-year OS rate predictions was constructed and showed good predictive accuracy. The selected genes can potentially be targeted to understand the pathological mechanisms of LGG. Additionally, GSEA, tumor immune infiltration, and immune checkpoint analyses showed that iron metabolism may be involved in tumorigenesis, progression, the tumor microenvironment and immune tolerance. These results suggest promising therapeutic targets for LGG. However, large scale, prospective studies are still required to validate our model in the future.
Publicly available datasets were analyzed in this study. This data can be found here: https://tcga.xenahubs.net. http://www.cgga.org.cn/. Molecular Signatures Database.
XS, ZW, and JY drafted the manuscript. JZ reviewed and modified the manuscript. XS, JY, and SM revised the manuscript. All authors contributed to the article and approved the submitted version.
This work was funded by National Natural Science Foundation of China (81701144 and 81870916).
The authors declare that the research was conducted in the absence of any commercial or financial relationships that could be construed as a potential conflict of interest.
All claims expressed in this article are solely those of the authors and do not necessarily represent those of their affiliated organizations, or those of the publisher, the editors and the reviewers. Any product that may be evaluated in this article, or claim that may be made by its manufacturer, is not guaranteed or endorsed by the publisher.
The Supplementary Material for this article can be found online at: https://www.frontiersin.org/articles/10.3389/fonc.2021.729103/full#supplementary-material
Supplementary Figure 1 | (A–O), Kaplan–Meier survival analysis of the risk signature in LGG patients stratified by the age, gender, WHO grade, pathological subtypes, IDH1 mutation status, MGMT promoter methylation status, and 1p19q codeletion status.
Supplementary Figure 2 | Distribution of risk scores between LGG and GBM. ****P < 0.0001.
1. Louis DN, Perry A, Reifenberger G, von Deimling A, Figarella-Branger D, Cavenee WK, et al. The 2016 World Health Organization Classification of Tumors of the Central Nervous System: A Summary. Acta Neuropathol (2016) 131:803–20. doi: 10.1007/s00401-016-1545-1
2. Jiang T, Mao Y, Ma W, Mao Q, You Y, Yang X, et al. CGCG Clinical Practice Guidelines for the Management of Adult Diffuse Gliomas. Cancer Lett (2016) 375:263–73. doi: 10.1016/j.canlet.2016.01.024
3. Manz DH, Blanchette NL, Paul BT, Torti FM, Torti SV. Iron and Cancer: Recent Insights. Ann N Y Acad Sci (2016) 1368:149–61. doi: 10.1111/nyas.13008
4. Habashy HO, Powe DG, Staka CM, Rakha EA, Ball G, Green AR, et al. Transferrin Receptor (CD71) Is a Marker of Poor Prognosis in Breast Cancer and can Predict Response to Tamoxifen. Breast Cancer Res Treat (2010) 119:283–93. doi: 10.1007/s10549-009-0345-x
5. Jeong DE, Song HJ, Lim S, Lee SJ, Lim JE, Nam DH, et al. Repurposing the Anti-Malarial Drug Artesunate as a Novel Therapeutic Agent for Metastatic Renal Cell Carcinoma Due to Its Attenuation of Tumor Growth, Metastasis, and Angiogenesis. Oncotarget (2015) 6:33046–64. doi: 10.18632/oncotarget.5422
6. Whitney JF, Clark JM, Griffin TW, Gautam S, Leslie KO. Transferrin Receptor Expression in Nonsmall Cell Lung Cancer. Histopathologic and Clinical Correlates. Cancer (1995) 76:20–5. doi: 10.1002/1097-0142(19950701)76:1<20::aid-cncr2820760104>3.0.co;2-3
7. Zhang S, Chen Y, Guo W, Yuan L, Zhang D, Xu Y, et al. Disordered Hepcidin-Ferroportin Signaling Promotes Breast Cancer Growth. Cell Signal (2014) 26:2539–50. doi: 10.1016/j.cellsig.2014.07.029
8. Schonberg DL, Miller TE, Wu Q, Flavahan WA, Das NK, Hale JS, et al. Preferential Iron Trafficking Characterizes Glioblastoma Stem-Like Cells. Cancer Cell (2015) 28:441–55. doi: 10.1016/j.ccell.2015.09.002
9. Jung M, Mertens C, Tomat E, Brune B. Iron as a Central Player and Promising Target in Cancer Progression. Int J Mol Sci (2019) 20(2):273. doi: 10.3390/ijms20020273
10. Legendre C, Garcion E. Iron Metabolism: A Double-Edged Sword in the Resistance of Glioblastoma to Therapies. Trends Endocrinol Metab (2015) 26:322–31. doi: 10.1016/j.tem.2015.03.008
11. Dixon SJ, Stockwell BR. The Role of Iron and Reactive Oxygen Species in Cell Death. Nat Chem Biol (2014) 10:9–17. doi: 10.1038/nchembio.1416
12. Jaksch-Bogensperger H, Spiegl-Kreinecker S, Arosio P, Eckl P, Golaszewski S, Ebner Y, et al. Ferritin in Glioblastoma. Br J Cancer (2020) 122:1441–4. doi: 10.1038/s41416-020-0808-8
13. Chirasani SR, Markovic DS, Synowitz M, Eichler SA, Wisniewski P, Kaminska B, et al. Transferrin-Receptor-Mediated Iron Accumulation Controls Proliferation and Glutamate Release in Glioma Cells. J Mol Med (Berl) (2009) 87:153–67. doi: 10.1007/s00109-008-0414-3
14. Liu J, Gao L, Zhan N, Xu P, Yang J, Yuan F, et al. Hypoxia Induced Ferritin Light Chain (FTL) Promoted Epithelia Mesenchymal Transition and Chemoresistance of Glioma. J Exp Clin Cancer Res (2020) 39:137. doi: 10.1186/s13046-020-01641-8
15. Blatt J. Deferoxamine in Children With Recurrent Neuroblastoma. Anticancer Res (1994) 14:2109–12.
16. Subramanian A, Tamayo P, Mootha VK, Mukherjee S, Ebert BL, Gillette MA, et al. Gene Set Enrichment Analysis: A Knowledge-Based Approach for Interpreting Genome-Wide Expression Profiles. Proc Natl Acad Sci U S A (2005) 102:15545–50. doi: 10.1073/pnas.0506580102
17. Liberzon A, Birger C, Thorvaldsdottir H, Ghandi M, Mesirov JP, Tamayo P. The Molecular Signatures Database (MSigDB) Hallmark Gene Set Collection. Cell Syst (2015) 1:417–25. doi: 10.1016/j.cels.2015.12.004
18. Zhang S, Chang W, Wu H, Wang YH, Gong YW, Zhao YL, et al. Pan-Cancer Analysis of Iron Metabolic Landscape Across the Cancer Genome Atlas. J Cell Physiol (2020) 235:1013–24. doi: 10.1002/jcp.29017
19. Mou Y, Zhang Y, Wu J, Hu B, Zhang C, Duan C, et al. The Landscape of Iron Metabolism-Related and Methylated Genes in the Prognosis Prediction of Clear Cell Renal Cell Carcinoma. Front Oncol (2020) 10:788. doi: 10.3389/fonc.2020.00788
20. Colaprico A, Silva TC, Olsen C, Garofano L, Cava C, Garolini D, et al. TCGAbiolinks: An R/Bioconductor Package for Integrative Analysis of TCGA Data. Nucleic Acids Res (2016) 44:e71. doi: 10.1093/nar/gkv1507
21. Mounir M, Lucchetta M, Silva TC, Olsen C, Bontempi G, Chen X, et al. New Functionalities in the TCGAbiolinks Package for the Study and Integration of Cancer Data From GDC and GTEx. PloS Comput Biol (2019) 15:e1006701. doi: 10.1371/journal.pcbi.1006701
22. Silva TC, Colaprico A, Olsen C, D'Angelo F, Bontempi G, Ceccarelli M, et al. TCGA Workflow: Analyze Cancer Genomics and Epigenomics Data Using Bioconductor Packages. F1000Res (2016) 5:1542. doi: 10.12688/f1000research.8923.2
23. Love MI, Huber W, Anders S. Moderated Estimation of Fold Change and Dispersion for RNA-Seq Data With Deseq2. Genome Biol (2014) 15:550. doi: 10.1186/s13059-014-0550-8
24. Robinson MD, McCarthy DJ, Smyth GK. Edger: A Bioconductor Package for Differential Expression Analysis of Digital Gene Expression Data. Bioinformatics (2010) 26:139–40. doi: 10.1093/bioinformatics/btp616
25. McCarthy DJ, Chen Y, Smyth GK. Differential Expression Analysis of Multifactor RNA-Seq Experiments With Respect to Biological Variation. Nucleic Acids Res (2012) 40:4288–97. doi: 10.1093/nar/gks042
26. Ritchie ME, Phipson B, Wu D, Hu Y, Law CW, Shi W, et al. Limma Powers Differential Expression Analyses for RNA-Sequencing and Microarray Studies. Nucleic Acids Res (2015) 43:e47. doi: 10.1093/nar/gkv007
27. Zhou Y, Zhou B, Pache L, Chang M, Khodabakhshi AH, Tanaseichuk O, et al. Metascape Provides a Biologist-Oriented Resource for the Analysis of Systems-Level Datasets. Nat Commun (2019) 10:1523. doi: 10.1038/s41467-019-09234-6
28. Wang S, Zhang J, He Z, Wu K, Liu XS. The Predictive Power of Tumor Mutational Burden in Lung Cancer Immunotherapy Response Is Influenced by Patients' Sex. Int J Cancer (2019) 145:2840–9. doi: 10.1002/ijc.32327
29. Friedman J, Hastie T, Tibshirani R. Regularization Paths for Generalized Linear Models via Coordinate Descent. J Stat Softw (2010) 33:1–22. doi: 10.18637/jss.v033.i01
30. Blanche P, Dartigues JF, Jacqmin-Gadda H. Estimating and Comparing Time-Dependent Areas Under Receiver Operating Characteristic Curves for Censored Event Times With Competing Risks. Stat Med (2013) 32:5381–97. doi: 10.1002/sim.5958
31. Alba AC, Agoritsas T, Walsh M, Hanna S, Iorio A, Devereaux PJ, et al. Discrimination and Calibration of Clinical Prediction Models: Users' Guides to the Medical Literature. JAMA (2017) 318:1377–84. doi: 10.1001/jama.2017.12126
32. Li T, Fu J, Zeng Z, Cohen D, Li J, Chen Q, et al. TIMER2.0 for Analysis of Tumor-Infiltrating Immune Cells. Nucleic Acids Res (2020) 48:W509–14. doi: 10.1093/nar/gkaa407
33. Sturm G, Finotello F, Petitprez F, Zhang JD, Baumbach J, Fridman WH, et al. Comprehensive Evaluation of Transcriptome-Based Cell-Type Quantification Methods for Immuno-Oncology. Bioinformatics (2019) 35:i436–45. doi: 10.1093/bioinformatics/btz363
34. Newman AM, Liu CL, Green MR, Gentles AJ, Feng W, Xu Y, et al. Robust Enumeration of Cell Subsets From Tissue Expression Profiles. Nat Methods (2015) 12:453–7. doi: 10.1038/nmeth.3337
35. Bauchet L, Ostrom QT. Epidemiology and Molecular Epidemiology. Neurosurg Clin N Am (2019) 30:1–16. doi: 10.1016/j.nec.2018.08.010
36. Taga T, Tabu K. Glioma Progression and Recurrence Involving Maintenance and Expansion Strategies of Glioma Stem Cells by Organizing Self-Advantageous Niche Microenvironments. Inflamm Regener (2020) 40:33. doi: 10.1186/s41232-020-00142-7
37. Park KJ, Kim J, Testoff T, Adams J, Poklar M, Zborowski M, et al. Quantitative Characterization of the Regulation of Iron Metabolism in Glioblastoma Stem-Like Cells Using Magnetophoresis. Biotechnol Bioeng (2019) 116:1644–55. doi: 10.1002/bit.26973
38. Zhou J, Jiang Y, Zhao J, Zhang H, Fu J, Luo P, et al. Dp44mT, an Iron Chelator, Suppresses Growth and Induces Apoptosis via RORA-Mediated NDRG2-IL6/JAK2/STAT3 Signaling in Glioma. Cell Oncol (Dordr) (2020) 43:461–75. doi: 10.1007/s13402-020-00502-y
39. Kingsbury JM, Shamaprasad N, Billmyre RB, Heitman J, Cardenas ME. Cancer-Associated Isocitrate Dehydrogenase Mutations Induce Mitochondrial DNA Instability. Hum Mol Genet (2016) 25:3524–38. doi: 10.1093/hmg/ddw195
40. Ghasimi S, Wibom C, Dahlin AM, Brannstrom T, Golovleva I, Andersson U, et al. Genetic Risk Variants in the CDKN2A/B, RTEL1 and EGFR Genes Are Associated With Somatic Biomarkers in Glioma. J Neurooncol (2016) 127:483–92. doi: 10.1007/s11060-016-2066-4
41. Adel Fahmideh M, Lavebratt C, Schuz J, Roosli M, Tynes T, Grotzer MA, et al. CCDC26, CDKN2BAS, RTEL1 and TERT Polymorphisms in Pediatric Brain Tumor Susceptibility. Carcinogenesis (2015) 36:876–82. doi: 10.1093/carcin/bgv074
42. Han M, Xu R, Wang S, Yang N, Ni S, Zhang Q, et al. Six-Transmembrane Epithelial Antigen of Prostate 3 Predicts Poor Prognosis and Promotes Glioblastoma Growth and Invasion. Neoplasia (2018) 20:543–54. doi: 10.1016/j.neo.2018.04.002
43. Jennewein L, Ronellenfitsch MW, Antonietti P, Ilina EI, Jung J, Stadel D, et al. Diagnostic and Clinical Relevance of the Autophago-Lysosomal Network in Human Gliomas. Oncotarget (2016) 7:20016–32. doi: 10.18632/oncotarget.7910
44. Valdor R, Garcia-Bernal D, Riquelme D, Martinez CM, Moraleda JM, Cuervo AM, et al. Glioblastoma Ablates Pericytes Antitumor Immune Function Through Aberrant Up-Regulation of Chaperone-Mediated Autophagy. Proc Natl Acad Sci U S A. (2019) 116:20655–65. doi: 10.1073/pnas.1903542116
45. Hamed HA, Tavallai S, Grant S, Poklepovic A, Dent P. Sorafenib/regorafenib and Lapatinib Interact to Kill CNS Tumor Cells. J Cell Physiol (2015) 230:131–9. doi: 10.1002/jcp.24689
46. Li C, Zheng J, Chen S, Huang B, Li G, Feng Z, et al. RRM2 Promotes the Progression of Human Glioblastoma. J Cell Physiol (2018) 233:6759–67. doi: 10.1002/jcp.26529
47. Sun H, Yang B, Zhang H, Song J, Zhang Y, Xing J, et al. RRM2 Is a Potential Prognostic Biomarker With Functional Significance in Glioma. Int J Biol Sci (2019) 15:533–43. doi: 10.7150/ijbs.30114
48. Rasmussen RD, Gajjar MK, Tuckova L, Jensen KE, Maya-Mendoza A, Holst CB, et al. BRCA1-Regulated RRM2 Expression Protects Glioblastoma Cells From Endogenous Replication Stress and Promotes Tumorigenicity. Nat Commun (2016) 7:13398. doi: 10.1038/ncomms13398
49. Reithmeier A, Panizza E, Krumpel M, Orre LM, Branca RMM, Lehtio J, et al. Tartrate-Resistant Acid Phosphatase (TRAP/ACP5) Promotes Metastasis-Related Properties via TGFbeta2/TbetaR and CD44 in MDA-MB-231 Breast Cancer Cells. BMC Cancer (2017) 17:650. doi: 10.1186/s12885-017-3616-7
50. Xia L, Huang W, Tian D, Chen Z, Zhang L, Li Y, et al. ACP5, a Direct Transcriptional Target of FoxM1, Promotes Tumor Metastasis and Indicates Poor Prognosis in Hepatocellular Carcinoma. Oncogene (2014) 33:1395–406. doi: 10.1038/onc.2013.90
51. De Roos AJ, Rothman N, Inskip PD, Linet MS, Shapiro WR, Selker RG, et al. Genetic Polymorphisms in GSTM1, -P1, -T1, and CYP2E1 and the Risk of Adult Brain Tumors. Cancer Epidemiol Biomarkers Prev (2003) 12:14–22.
52. Bae MA, Pie JE, Song BJ. Acetaminophen Induces Apoptosis of C6 Glioma Cells by Activating the C-Jun NH(2)-Terminal Protein Kinase-Related Cell Death Pathway. Mol Pharmacol (2001) 60:847–56.
53. Lee YS, Wan J, Kim BJ, Bae MA, Song BJ. Ubiquitin-Dependent Degradation of P53 Protein Despite Phosphorylation at Its N Terminus by Acetaminophen. J Pharmacol Exp Ther (2006) 317:202–8. doi: 10.1124/jpet.105.096719
54. Elexpuru-Camiruaga J, Buxton N, Kandula V, Dias PS, Campbell D, McIntosh J, et al. Susceptibility to Astrocytoma and Meningioma: Influence of Allelism at Glutathione S-Transferase (GSTT1 and GSTM1) and Cytochrome P-450 (CYP2D6) Loci. Cancer Res (1995) 55:4237–9.
55. Brauch H, Schroth W, Eichelbaum M, Schwab M, Harbeck N, in cooperation with the A.G.O.T.C. Clinical Relevance of CYP2D6 Genetics for Tamoxifen Response in Breast Cancer. Breast Care (Basel) (2008) 3:43–50. doi: 10.1159/000114642
56. Backos DS, Fritz KS, McArthur DG, Kepa JK, Donson AM, Petersen DR, et al. Glycation of Glutamate Cysteine Ligase by 2-Deoxy-D-Ribose and Its Potential Impact on Chemoresistance in Glioblastoma. Neurochem Res (2013) 38:1838–49. doi: 10.1007/s11064-013-1090-4
57. Fack F, Tardito S, Hochart G, Oudin A, Zheng L, Fritah S, et al. Altered Metabolic Landscape in IDH-Mutant Gliomas Affects Phospholipid, Energy, and Oxidative Stress Pathways. EMBO Mol Med (2017) 9:1681–95. doi: 10.15252/emmm.201707729
58. Yu D, Liu Y, Zhou Y, Ruiz-Rodado V, Larion M, Xu G, et al. Triptolide Suppresses IDH1-Mutated Malignancy via Nrf2-Driven Glutathione Metabolism. Proc Natl Acad Sci U S A (2020) 117:9964–72. doi: 10.1073/pnas.1913633117
59. Eibinger G, Fauler G, Bernhart E, Frank S, Hammer A, Wintersperger A, et al. On the Role of 25-Hydroxycholesterol Synthesis by Glioblastoma Cell Lines. Implications for Chemotactic Monocyte Recruitment. Exp Cell Res (2013) 319:1828–38. doi: 10.1016/j.yexcr.2013.03.025
60. Liu HJ, Hu HM, Li GZ, Zhang Y, Wu F, Liu X, et al. Ferroptosis-Related Gene Signature Predicts Glioma Cell Death and Glioma Patient Progression. Front Cell Dev Biol (2020) 8:538. doi: 10.3389/fcell.2020.00538
61. Zhang Y, Kong Y, Ma Y, Ni S, Wikerholmen T, Xi K, et al. Loss of COPZ1 Induces NCOA4 Mediated Autophagy and Ferroptosis in Glioblastoma Cell Lines. Oncogene (2021) 40:1425–39. doi: 10.1038/s41388-020-01622-3
62. Pinton L, Masetto E, Vettore M, Solito S, Magri S, D'Andolfi M, et al. The Immune Suppressive Microenvironment of Human Gliomas Depends on the Accumulation of Bone Marrow-Derived Macrophages in the Center of the Lesion. J Immunother Cancer (2019) 7:58. doi: 10.1186/s40425-019-0536-x
63. Nawaz Z, Patil V, Thinagararjan S, Rao SA, Hegde AS, Arivazhagan A, et al. Impact of Somatic Copy Number Alterations on the Glioblastoma Mirnome: miR-4484 Is a Genomically Deleted Tumour Suppressor. Mol Oncol (2017) 11:927–44. doi: 10.1002/1878-0261.12060
64. Trus I, Berube N, Jiang P, Rak J, Gerdts V, Karniychuk U. Zika Virus With Increased CpG Dinucleotide Frequencies Shows Oncolytic Activity in Glioblastoma Stem Cells. Viruses (2020) 12(5):579. doi: 10.3390/v12050579
65. Borgan E, Lindholm EM, Moestue S, Maelandsmo GM, Lingjaerde OC, Gribbestad IS, et al. Subtype-Specific Response to Bevacizumab Is Reflected in the Metabolome and Transcriptome of Breast Cancer Xenografts. Mol Oncol (2013) 7:130–42. doi: 10.1016/j.molonc.2012.10.005
66. Bellenghi M, Puglisi R, Pedini F, De Feo A, Felicetti F, Bottero L, et al. SCD5-Induced Oleic Acid Production Reduces Melanoma Malignancy by Intracellular Retention of SPARC and Cathepsin B. J Pathol (2015) 236:315–25. doi: 10.1002/path.4535
67. Russo V, Roperto F, Taulescu M, De Falco F, Urraro C, Corrado F, et al. Expression of the Feline Leukemia Virus Subgroup C Receptors in Normal and Neoplastic Urothelium of the Urinary Bladder of Cattle Associated With Bovine Papillomavirus Infection. Vet Microbiol (2019) 229:147–52. doi: 10.1016/j.vetmic.2018.12.024
68. Fan X, Lu HT, Hou L, Zhang L, Yang BY, Chen WM, et al. A Comprehensive Analysis of Potential Prognostic Biomarkers for MYCN-Amplified Neuroblastoma. Zhongguo Dang Dai Er Ke Za Zhi (2020) 22(3):262–8. doi: 10.7499/j.issn.1008-8830.2020.03.015
69. Yao Y, Ye H, Qi Z, Mo L, Yue Q, Baral A, et al. B7-H4(B7x)-Mediated Cross-Talk Between Glioma-Initiating Cells and Macrophages via the IL6/JAK/STAT3 Pathway Lead to Poor Prognosis in Glioma Patients. Clin Cancer Res (2016) 22:2778–90. doi: 10.1158/1078-0432.CCR-15-0858
70. Brantley EC, Benveniste EN. Signal Transducer and Activator of Transcription-3: A Molecular Hub for Signaling Pathways in Gliomas. Mol Cancer Res (2008) 6:675–84. doi: 10.1158/1541-7786.MCR-07-2180
71. Cao S, Wang C, Zheng Q, Qiao Y, Xu K, Jiang T, et al. STAT5 Regulates Glioma Cell Invasion by Pathways Dependent and Independent of STAT5 DNA Binding. Neurosci Lett (2011) 487:228–33. doi: 10.1016/j.neulet.2010.10.028
72. Verdeil G, Lawrence T, Schmitt-Verhulst AM, Auphan-Anezin N. Targeting STAT3 and STAT5 in Tumor-Associated Immune Cells to Improve Immunotherapy. Cancers (Basel). (2019) 11(12):1832. doi: 10.3390/cancers11121832
73. Masui K, Harachi M, Ikegami S, Yang H, Onizuka H, Yong WH, et al. Mtorc2 Links Growth Factor Signaling With Epigenetic Regulation of Iron Metabolism in Glioblastoma. J Biol Chem (2019) 294:19740–51. doi: 10.1074/jbc.RA119.011519
74. Lane DJ, Mills TM, Shafie NH, Merlot AM, Saleh Moussa R, Kalinowski DS, et al. Expanding Horizons in Iron Chelation and the Treatment of Cancer: Role of Iron in the Regulation of ER Stress and the Epithelial-Mesenchymal Transition. Biochim Biophys Acta (2014) 1845:166–81. doi: 10.1016/j.bbcan.2014.01.005
75. Richardson A, Kovacevic Z, Richardson DR. Iron Chelation: Inhibition of Key Signaling Pathways in the Induction of the Epithelial Mesenchymal Transition in Pancreatic Cancer and Other Tumors. Crit Rev Oncog (2013) 18:409–34. doi: 10.1615/critrevoncog.2013007921
76. Cutone A, Colella B, Pagliaro A, Rosa L, Lepanto MS, Bonaccorsi di Patti MC, et al. Native and Iron-Saturated Bovine Lactoferrin Differently Hinder Migration in a Model of Human Glioblastoma by Reverting Epithelial-to-Mesenchymal Transition-Like Process and Inhibiting Interleukin-6/STAT3 Axis. Cell Signal (2020) 65:109461. doi: 10.1016/j.cellsig.2019.109461
77. Zhu H, Dai C, He L, Xu A, Chen T. Iron (II) Polypyridyl Complexes as Antiglioblastoma Agents to Overcome the Blood-Brain Barrier and Inhibit Cell Proliferation by Regulating P53 and 4E-BP1 Pathways. Front Pharmacol (2019) 10:946. doi: 10.3389/fphar.2019.00946
78. Guerreiro JF, Gomes MAGB, Pagliari F, Jansen J, Marafioti MG, Nistico C, et al. Iron and Copper Complexes With Antioxidant Activity as Inhibitors of the Metastatic Potential of Glioma Cells. RSC Adv (2020) 10:12699–710. doi: 10.1039/D0RA00166J
79. Gabrusiewicz K, Rodriguez B, Wei J, Hashimoto Y, Healy LM, Maiti SN, et al. Glioblastoma-Infiltrated Innate Immune Cells Resemble M0 Macrophage Phenotype. JCI Insight (2016) 1(2):e85841. doi: 10.1172/jci.insight.85841
80. Tabu K, Muramatsu N, Mangani C, Wu M, Zhang R, Kimura T, et al. A Synthetic Polymer Scaffold Reveals the Self-Maintenance Strategies of Rat Glioma Stem Cells by Organization of the Advantageous Niche. Stem Cells (2016) 34:1151–62. doi: 10.1002/stem.2299
81. Costa da Silva M, Breckwoldt MO, Vinchi F, Correia MP, Stojanovic A, Thielmann CM, et al. Iron Induces Anti-Tumor Activity in Tumor-Associated Macrophages. Front Immunol (2017) 8:1479. doi: 10.3389/fimmu.2017.01479
82. Yee PP, Wei Y, Kim SY, Lu T, Chih SY, Lawson C, et al. Neutrophil-Induced Ferroptosis Promotes Tumor Necrosis in Glioblastoma Progression. Nat Commun (2020) 11:5424. doi: 10.1038/s41467-020-19193-y
Keywords: iron metabolism, lower-grade glioma, prognosis, tumor microenvironment, bioinformatics
Citation: Xu S, Wang Z, Ye J, Mei S and Zhang J (2021) Identification of Iron Metabolism-Related Genes as Prognostic Indicators for Lower-Grade Glioma. Front. Oncol. 11:729103. doi: 10.3389/fonc.2021.729103
Received: 22 June 2021; Accepted: 23 August 2021;
Published: 09 September 2021.
Edited by:
Ye Wang, Qingdao University Medical College, ChinaReviewed by:
Arsheed A. Ganaie, University of Minnesota Twin Cities, United StatesCopyright © 2021 Xu, Wang, Ye, Mei and Zhang. This is an open-access article distributed under the terms of the Creative Commons Attribution License (CC BY). The use, distribution or reproduction in other forums is permitted, provided the original author(s) and the copyright owner(s) are credited and that the original publication in this journal is cited, in accordance with accepted academic practice. No use, distribution or reproduction is permitted which does not comply with these terms.
*Correspondence: Jianmin Zhang, emptMTM1QHpqdS5lZHUuY24=
†These authors have contributed equally to the work
Disclaimer: All claims expressed in this article are solely those of the authors and do not necessarily represent those of their affiliated organizations, or those of the publisher, the editors and the reviewers. Any product that may be evaluated in this article or claim that may be made by its manufacturer is not guaranteed or endorsed by the publisher.
Research integrity at Frontiers
Learn more about the work of our research integrity team to safeguard the quality of each article we publish.