
94% of researchers rate our articles as excellent or good
Learn more about the work of our research integrity team to safeguard the quality of each article we publish.
Find out more
ORIGINAL RESEARCH article
Front. Oncol., 01 March 2022
Sec. Cancer Genetics
Volume 11 - 2021 | https://doi.org/10.3389/fonc.2021.726018
This article is part of the Research TopicRNA Sequencing in Clinical Oncology for Metabolism and ImmunityView all 43 articles
N6-methyladenosine (m6A) RNA methylation is dynamically and reversibly regulated by methyltransferases, binding proteins, and demethylases. The restoration of m6A to adenosine could result in demethylation modifications. Abnormalities in m6A epigenetic modifications in cancer are of increasing interest in recent years. According to the progression and prognostic performance of m6A epigenetic modifications in gastric adenocarcinoma (STAD), this study comprehensively analyzed the m6A modification patterns of gastric adenocarcinoma specimens in The Cancer Genome Atlas (TCGA) database based on 20 m6A regulators. Here, we found that 20 m6A RNA methylation regulators were high-expressed in gastric adenocarcinoma. m6A RNA methylation regulators were closely associated with pT staging of gastric cancer. Based on such findings, we developed a prognostic model using four m6A RNA methylation regulators (IGF2BP1, RBM15, FTO, ALKBH5), and the FTO was confirmed as an independent prognostic marker.
The incidence of digestive diseases is increasing with the changes of modern diet (1). Stomach adenocarcinoma (STAD) is a common malignant digestive system tumor (2). Despite some progresses in STAD treatment in recent years, STAD remains the second leading cause of cancer death-related (3). Statistics have shown that more than 700,000 deaths from STAD have occurred annually all over the world (4). Such a high mortality rate is attributed to the specific biological features of the disease, such as a lack of efficient clinical diagnostic indicators, unclear clinical presentation, and high invasion and metastasis degrees (5), which also point to the necessity of identifying effective biomarkers and their potential molecular mechanisms in STAD (6). The completion of the Human Genome Project (HGP) and parallel development of next-generation sequencing (NGS) have been accompanied with increasing technological advances (7). Many major oncology research programs have been launched, the most famous of which are The Cancer Genome Atlas (TCGA) (8) and Genotype-Tissue Expression (GTEx) (9). The aim of these two programs is to map the genome of human tumors through large-scale high-throughput genome sequencing and microarray technology to find new solutions for cancer treatment through exploring tumor development and potential molecular mechanisms.
Epigenetics, which becomes a popular research area in recent years, is defined as DNA sequence invariance but genetic alteration of gene expression (10). Earlier studies found that epigenetic studies focused on DNA and histone modifications (11). Some scholars believed that mRNAs only play a role in information transfer (12). However, with the rapid development of high-throughput sequencing technology, studies have increasingly found that mRNAs, for example, N6-methyladenosine (m6A), N1-methyladenosine (m1A) and pseudo uridine methylation (13), undergo various modifications during 5'-capping and 3'-tailing 4-6 under exon splicing (14). These above modifications can exert certain effects on the splicing, nucleation, stabilization, and translation of mRNA, which further affects the mRNA metabolic process and regulates gene expression (15). Up to now, 171 RNA modifications have been identified (16), and m6A as an important modifier is the most abundant in a variety of eukaryotic mRNAs and long-stranded noncoding RNAs (LncRNAs) (13). RNA m6A can be imprinted by methyltransferases, preferentially recognized and delivered by reader proteins, and cleared by RNA methylases, suggesting that m6A methylation epigenetically mediates the expression of a large number of genes, thereby playing multiple roles in regulating biological processes (17).
Previous studies have shown that multiple proteins are involved in the regulation of m6A. For example, METTL3, METTL14 can act as compilers (18); YTHDF1, YTHDF2, YTHDF3 can act as readers (13); FTO, ALKBH5 can act as erasers (19). Recent studies have reported the association of m6A regulators with cancer. The diagnostic, progressive, and prognostic performance of m6A-methylated RNA regulators in lung adenocarcinoma has been confirmed (20). Moreover, m6A modification-mediated CBX8 induction could regulate the stemness and chemosensitivity of colon cancer through upregulation of LGR5 (21).
Only 13 m6A RNAs had been analyzed in earlier studies, currently new research has identified 7 m6A RNAs. In the present study, we analyzed the differential expression of 20 m6A RNA regulators in STAD through TCGA and GTEx databases, and found that the expression of m6A RNA methylation regulator FTO played an important role in the progression of STAD and was considered as an effective prognostic factor.
Data from 375 gastric adenocarcinomas (STAD) tumor samples were downloaded from The Cancer Genome Atlas (TCGA, https://portal.gdc.cancer.gov/) website and Genotype-Tissue Expression (GTEx, https://gtexportal.org/) website to acquire 361 cases of normal tissues.
The collected data were normalized and 361 normal lung tissues from GTEx were imported into the STAD TCGA data set to increase the number of normal groups. Differential analysis on 20 m6A RNA methylation genes from normal and tumor tissues was performed using the Wilcox test. 20 m6A RNA methylation genes, namely, HNRNPA2B1, VIRMA, METTL3, WTAPR, HNRNPA2B1, METTL14, BM15, RBM15B, ZC3H13, YTHDC1, YTHDF3, YTHDF1, YTHDF2, HNRNPC, IGF2BP1, IGF2BP2, IGF2BP3, RBMX, FTO, ALKBH5, were introduced in the current study. Correlations between genes were analyzed with the corrlot package.
Samples were divided into high- and low- expression groups based on median FTO expression value. FTO biological functions were analyzed using gene enrichment analysis (GSEA) (http://software.broadinstitute.org/gsea/index.jsp). The Kyoto Encyclopedia of Genes and Genomes (KEGG) pathway, Gene Ontology (GO), and Hallmarkgene signature gene collections were used for analysis, and annotation was performed using the "clusterProfiler" package.
The Consensusclusterplus package was used for consistency analysis. The maximum number of clusters was 6. 80% of the total samples, which were extracted by 100 repetitions. The clustering heat map was plotted by pheatmap package. Kaplan-Meier analysis and corresponding analysis were then applied to analyze the differences between clusters.
Overlapping DEGs and DMGs were filter by LASSO regression pipeline to narrow down the target genes. Genes associated with survival were screened by univariate Cox analysis, and risk characteristics for the Cox regression model were analyzed using the glmnet package and the survivor package with the following risk equation:
Based on the median score, STAD patients in the TCGA database were divided into two subgroups low-risk and high-risk groups. Kaplan-Meier survival curve analysis was used to compare the OS times of the two groups, and the prediction of the genetic markers was evaluated by time-related ROC.
Cox regression analysis was performed using the Survival package, and forestplots were generated with the forestplot package to show P values, HRs, and 95% CIs for each variable. Based on the results of multivariate Cox proportional risk analysis, column line plots were developed using the rms package to predict 1-, 3-, and 5-year survival rates. Column line plots provided a graphical representation of these factors, allowing the prognostic risk of individual patients to be calculated by the points associated with each risk factor.
To further understand the important biological functions of m6A RNA methylation regulators in tumorigenesis and development. We compared the expression levels of 20 m6A RNA methylation regulators in 375 STAD tissues and 32 normal tissues from the TCGA database. The results showed that compared to normal tissues, in STAD patients the expression of HNRNPA2B1, VIRMA, METTL3, WTAPR, HNRNPA2B1, METTL14, BM15, RBM15B, ZC3H13, YTHDC1, YTHDF3, YTHDF1, YTHDF2, HNRNPC, IGF2BP1 IGF2BP2, IGF2BP3, RBMX, FTO, and ALKBH5 was significantly up-regulated (Figure 1A). In addition, we analyzed the correlation between 20 m6A RNA methylation regulators through conducting Pearson's test, and the analysis revealed a positive correlation between the 20 m6A RNA methylation regulators, with VIRMA and YTHDF3 showing the most significant correlation (Figure 1B). This suggested when VIRMA was up-regulated, the YTHDF3F gene was most likely to be upregulated.
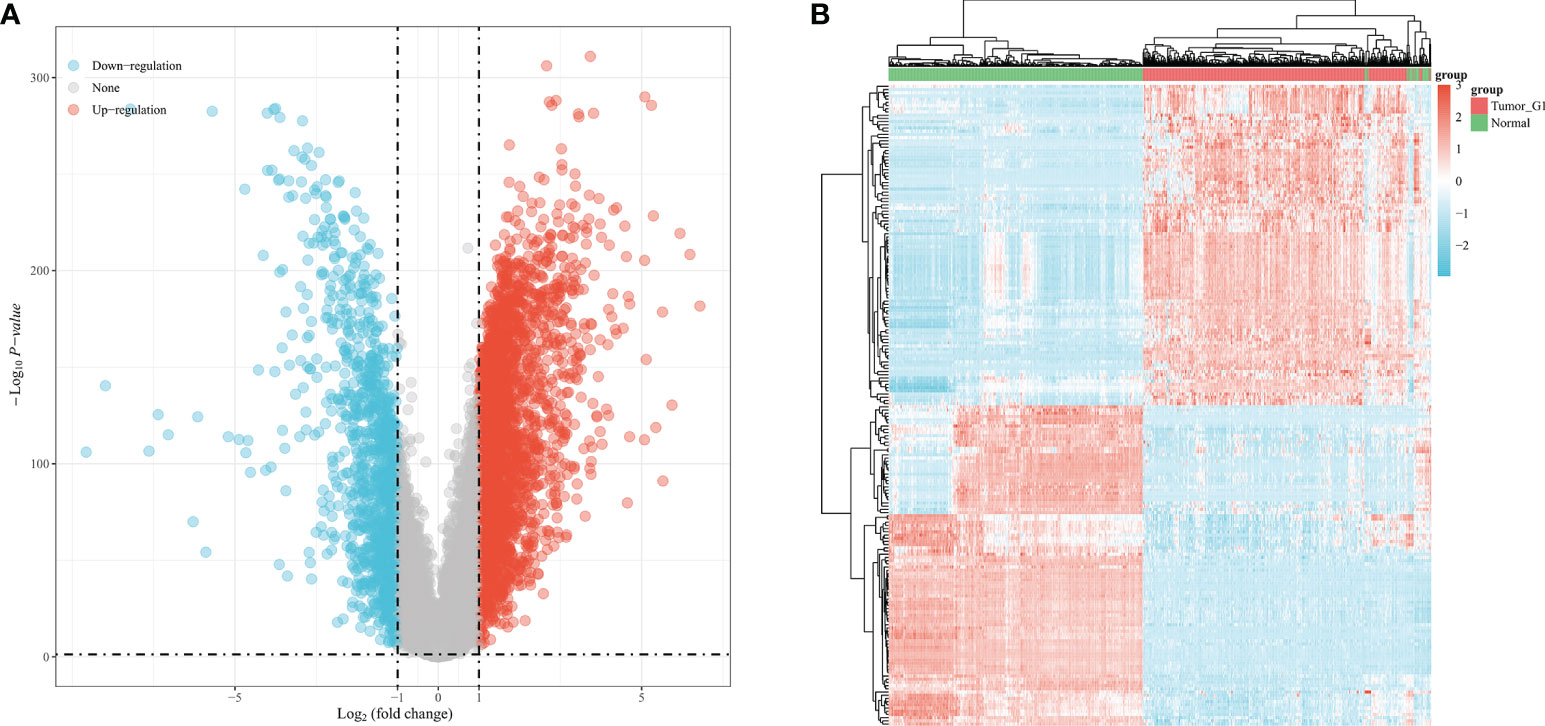
Figure 1 Expression levels of m6A RNA methylation regulators in TCGA database. (A) Expression levels of 20 m6A RNA methylation regulators in 375 STAD tissues and 32 normal tissues of the TCGA database. (B) Pearson's test for the correlation between the expression levels of 20 m6A RNA methylation regulators.
To better understand the relationship between m6A RNA methylation regulators and clinical characteristics of STAD patients, we extracted 32 normal samples from the TCGA database and employed the ConsensusClusterPlus package to subclassify 343 STAD samples. Based on the similarity shown by the expression levels of m6A regulators and the ratio of fuzzy clustering metrics, the optimal clustering stability was defined from k = 2 to 6 when k = 3 (Figure 2). Subsequently, 375 STAD patients were divided into 3 subgroups, namely, cluster1 (n = 97), cluster2 (n = 143) and cluster3 (n = 135), according to the expression levels of m6A regulators. Next, we analyzed the clinical characteristics and survival of the 3 subgroups. First, we examined the differences between gender, race, pT stage, pN stage, pM stage, pTNM stage, and Grade in the 3 subgroups of patients with sub STAD. After comparing cluster1, cluster2, and cluster3, we found that there was a difference in pT staging between them as well as a difference in pN staging between cluster2 and cluster3, while other clinical data were not significant (Figure 3).
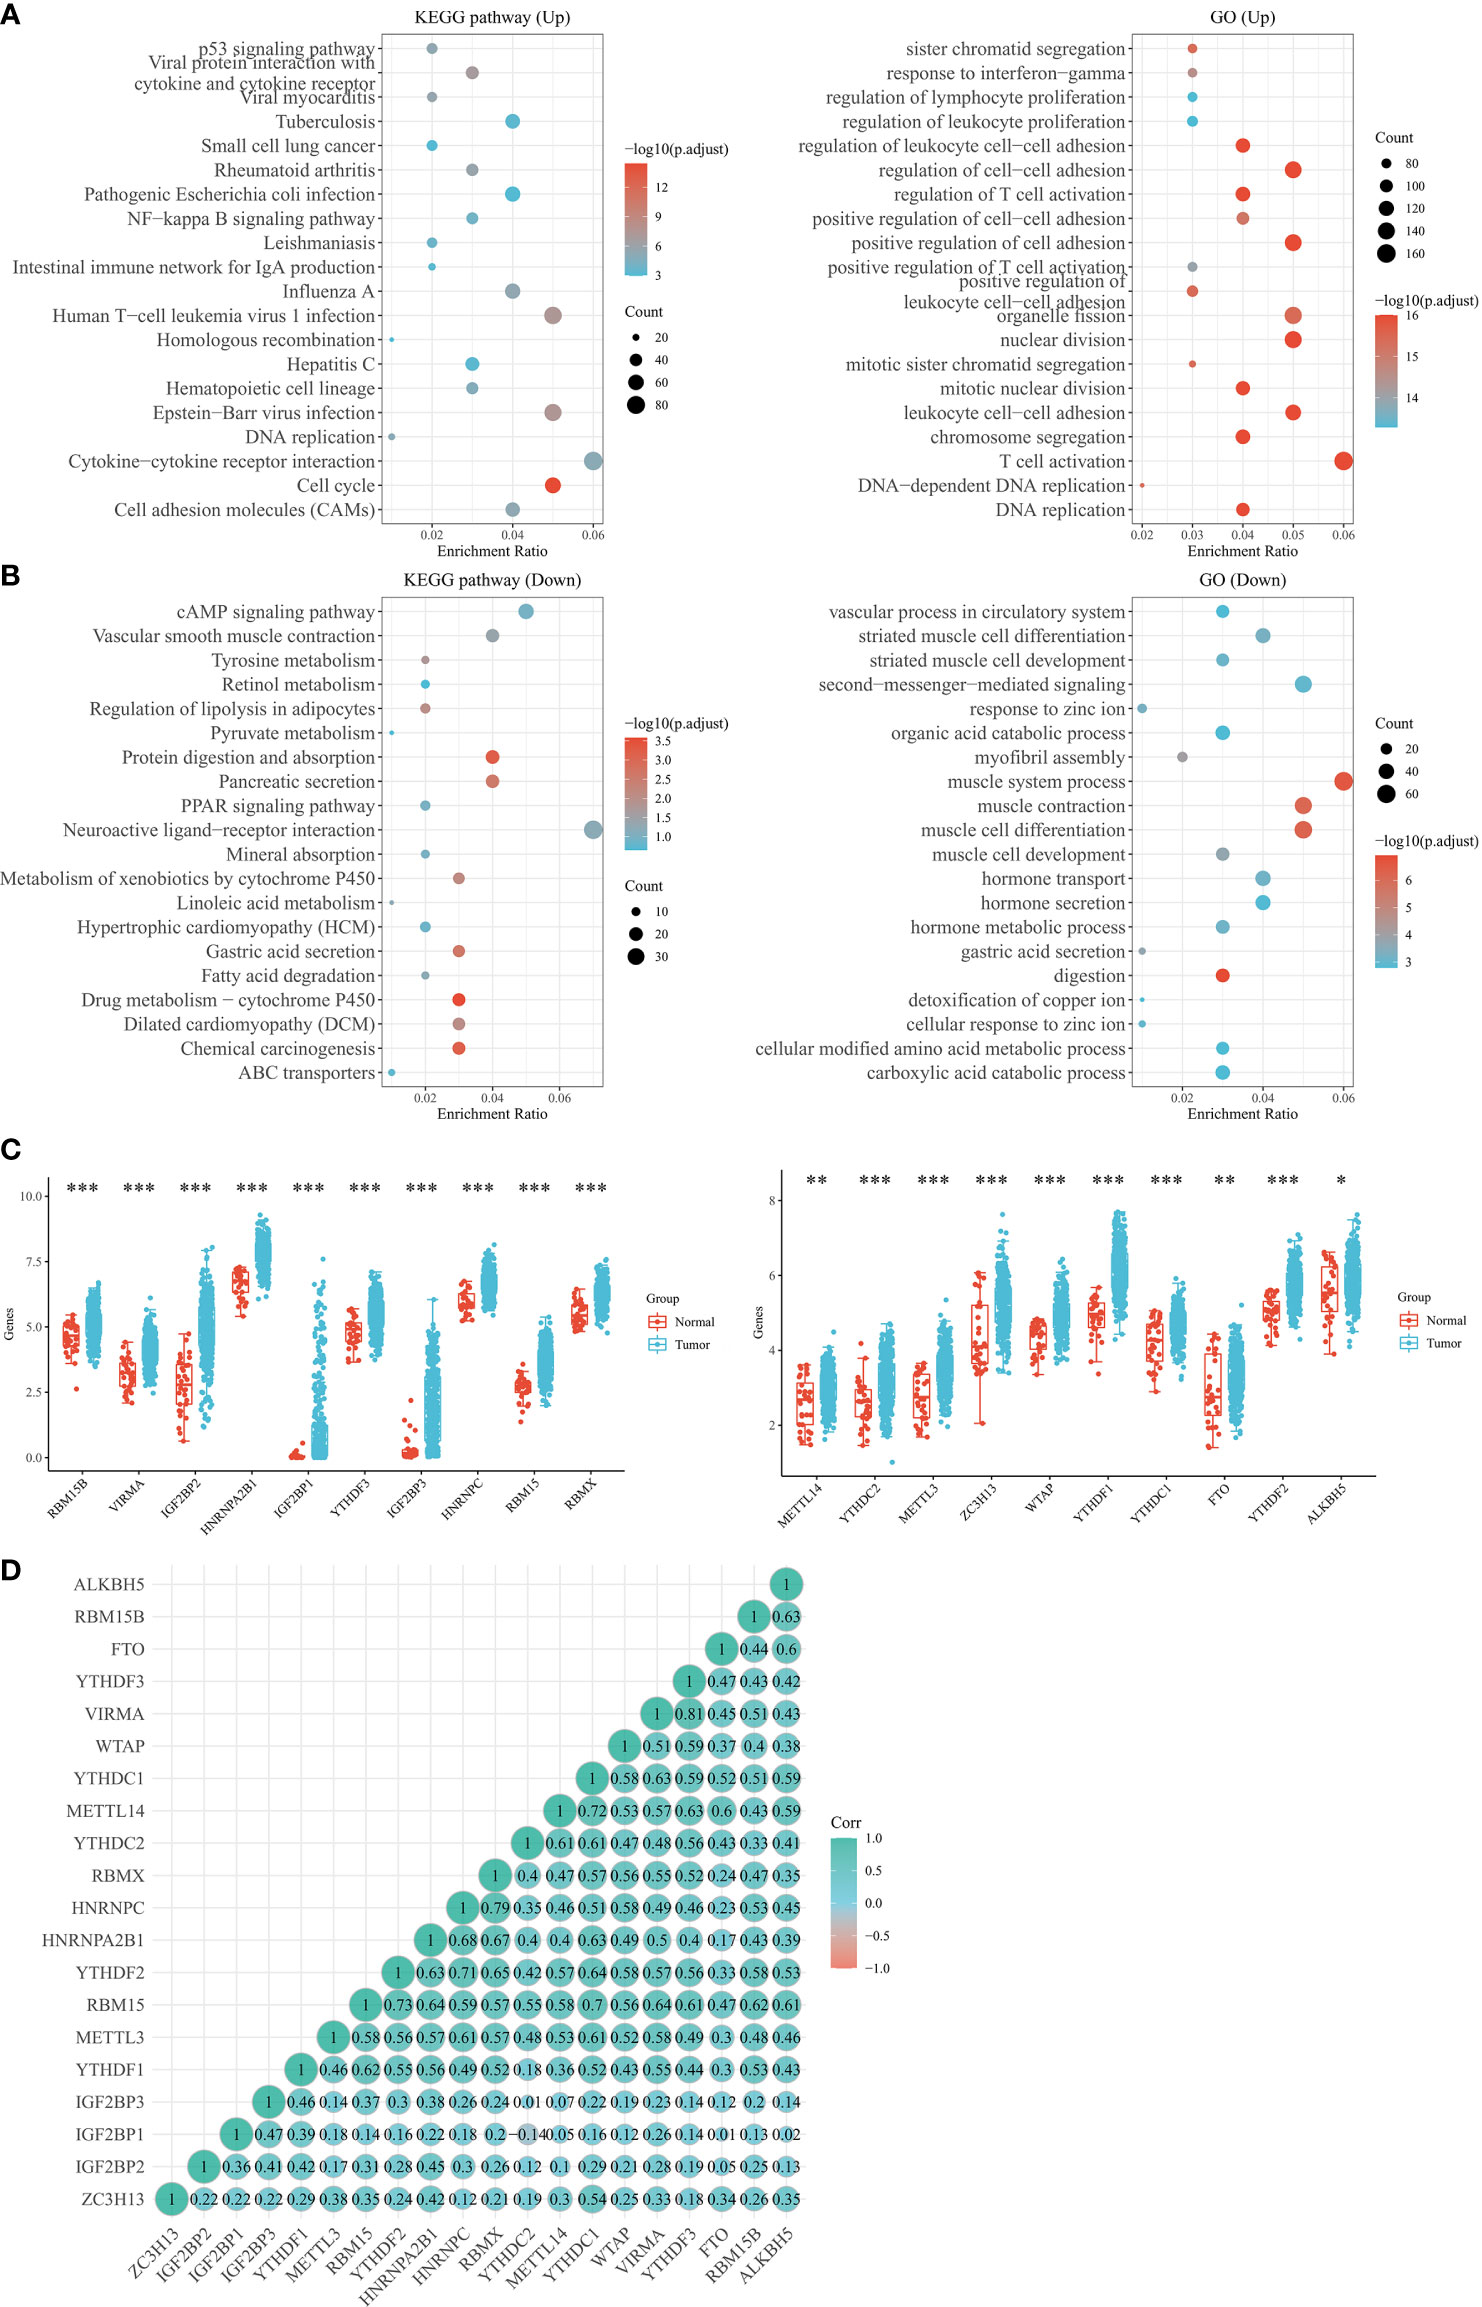
Figure 2 TCGA database using 20 m6A RNA methylation-associated genes to divide the samples into 3 subgroups. (A) The STAD cohort was separated into three clusters when k = 3. (B) CDF curves for k=2~6. (C) Relative amount of change in area under the CDF curve for consensus clustering when k=2~6. (D) The distribution of each sample when k is in the range of 2 ~ 6. CDF, cumulative distribution function. *p < 0.05; **P < 0.01; ***P < 0.001.
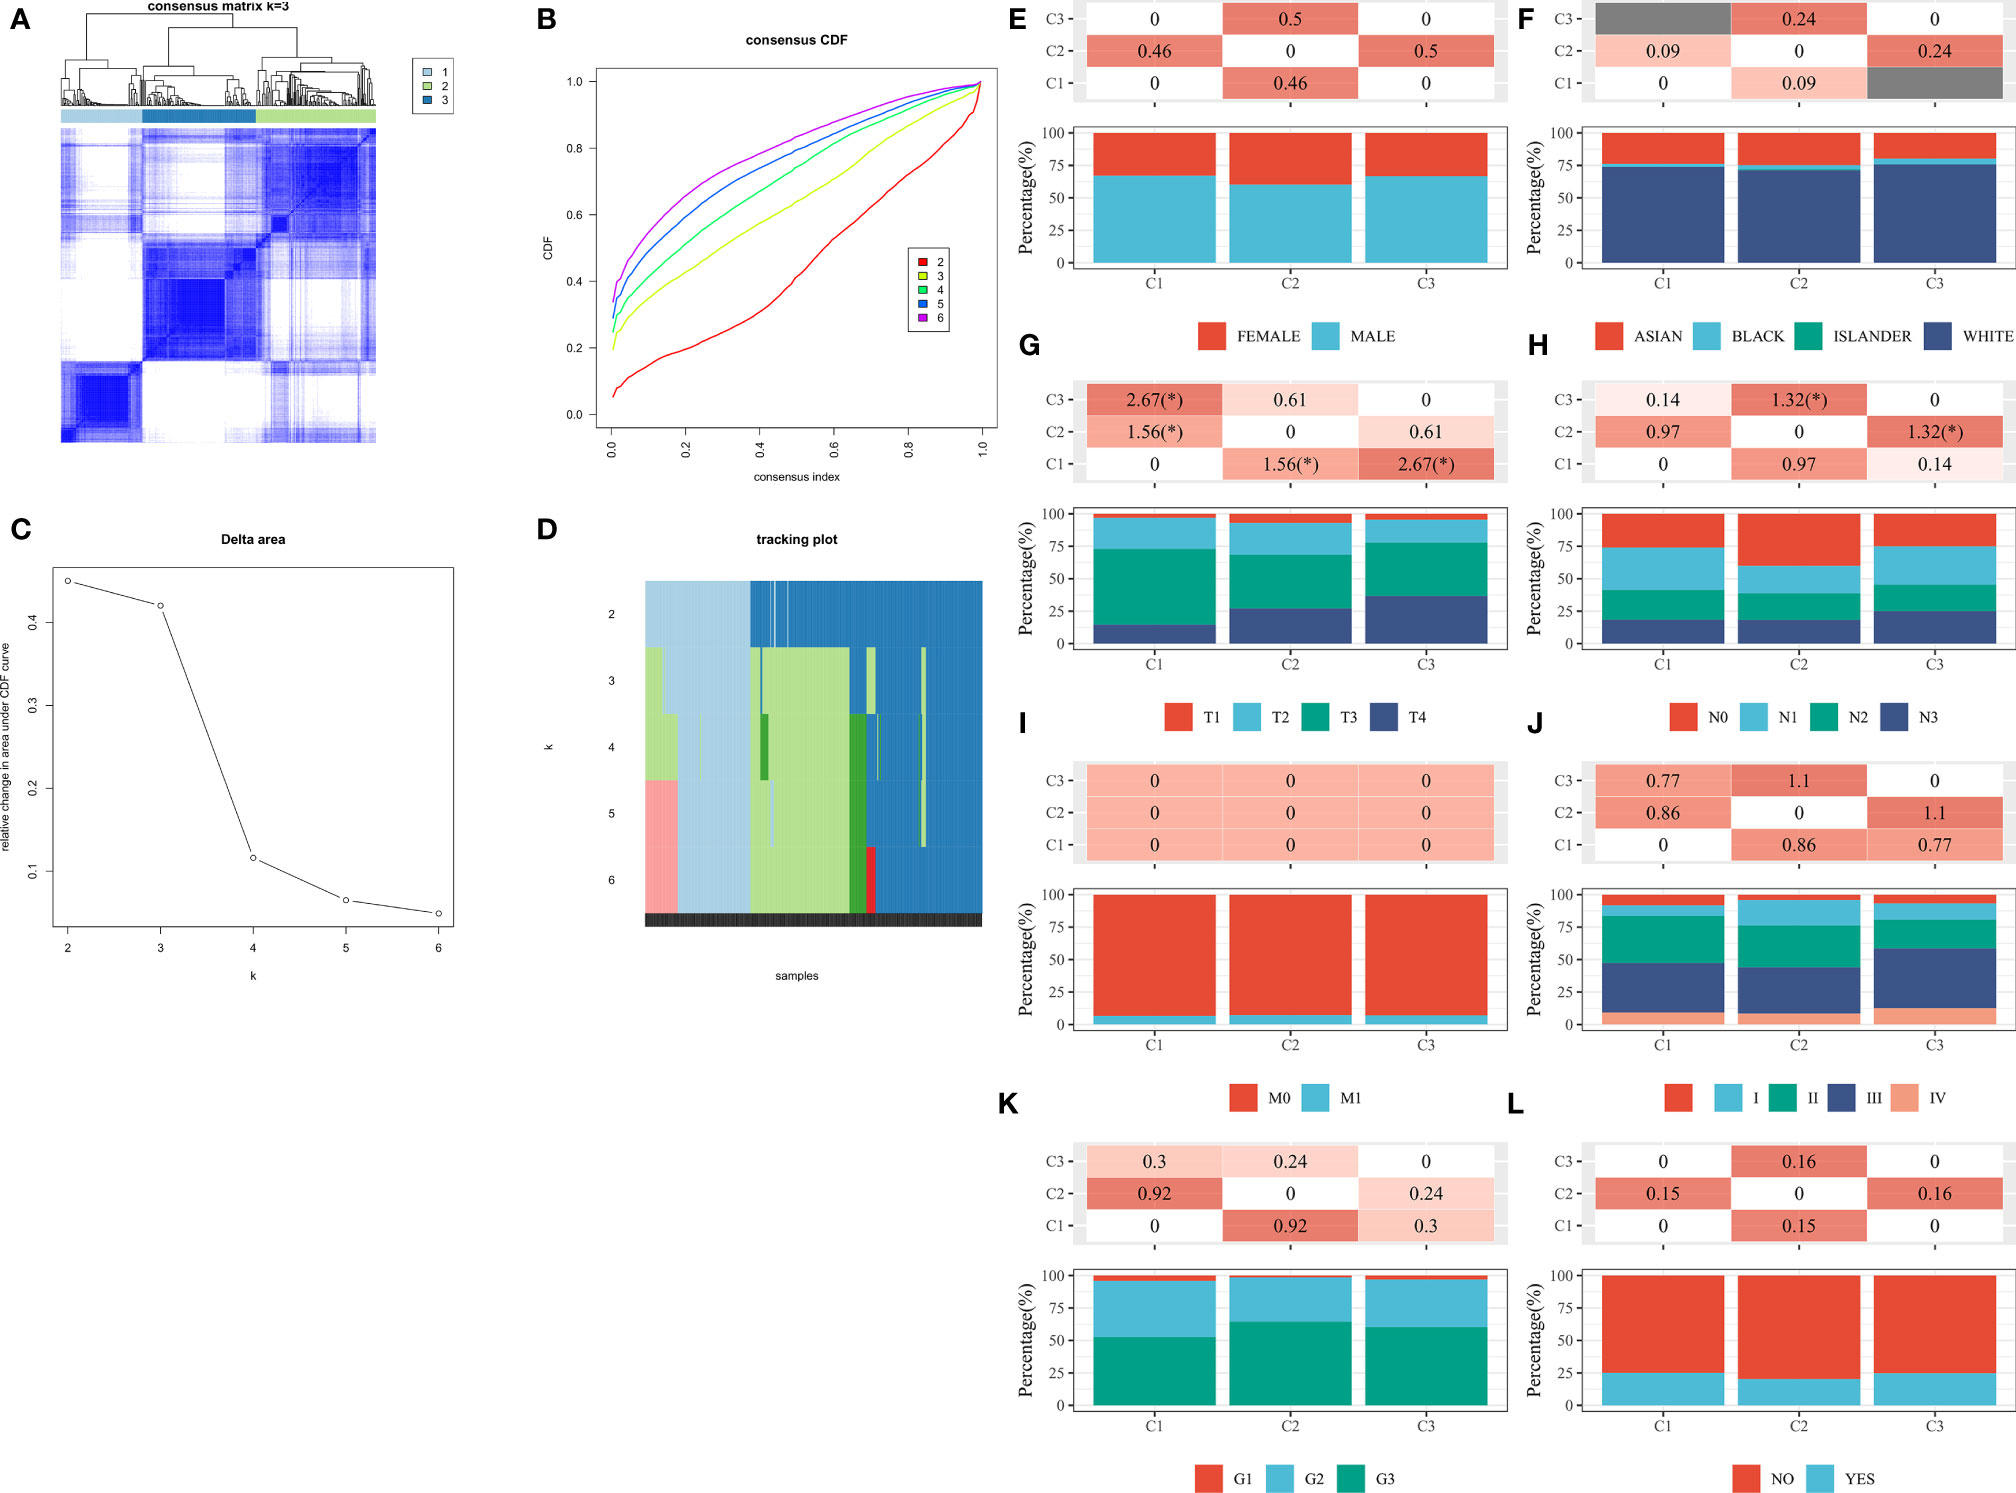
Figure 3 Consensus clustering of m6A RNA methylation regulators to analyze the characteristics and survival of STAD patients. (A) The STAD cohort was separated into three clusters when k = 3. (B) CDF curves for k=2~6. (C) Relative amount of change in area under the CDF curve for consensus clustering when k=2~6. (D) The distribution of each sample when k is in the range of 2 ~ 6. (E) Comparison of gender differences among the 3 subgroups. (F) Comparison of race differences among the 3 subgroups. (G) Comparison of T-stage differences among the 3 subgroups. (H) Comparison of N-stage differences among the 3 subgroups. (I) Comparison of M-stage differences among the 3 subgroups. (J) Comparison of clinical staging differences among the 3 subgroups. (K) Comparison of differences in differentiation in 3 subgroups. (L) Comparison of differences in lymphatic metastasis among the 3 subgroups. Note: CDF, cumulative distribution function. *P < 0.05, **P < 0.01, ***P < 0.001.
The LASSO Cox regression model was applied to construct prognostic features to analyze the expression levels of m6A RNA methylation regulators (Figures 4A, B). According to the minimal criterion, four regulators, IGF2BP1, RBM15, FTO, and ALKBH5, were selected to construct the prognostic model. The risk score for each STAD patient was calculated with the following formula: risk score = (0.0355)*IGF2BP1 + (-0.2487)*RBM15 + (0.4701)*FTO + (-0.2246)*ALKBH5. Based on the median risk score, the STAD cohort was divided into low-risk group and high-risk group (Figure 4C). Kaplan-Meier survival analysis demonstrated that patients in the high-risk group had significantly higher OS than those in the low-risk group (P=0.007, Figure 4D). In addition, the sensitivity and specificity of this model for predicting patients' OS period were verified by ROC curves. Here, the risk model showed a better accuracy in predicting survival at 1 year (AUC=0.743), 3 years (AUC=0.743), and 5 years (AUC=0.874) after surgery (Figure 4E). This suggested that the model was accurate in predicting the prognostic survival of STAD patients.
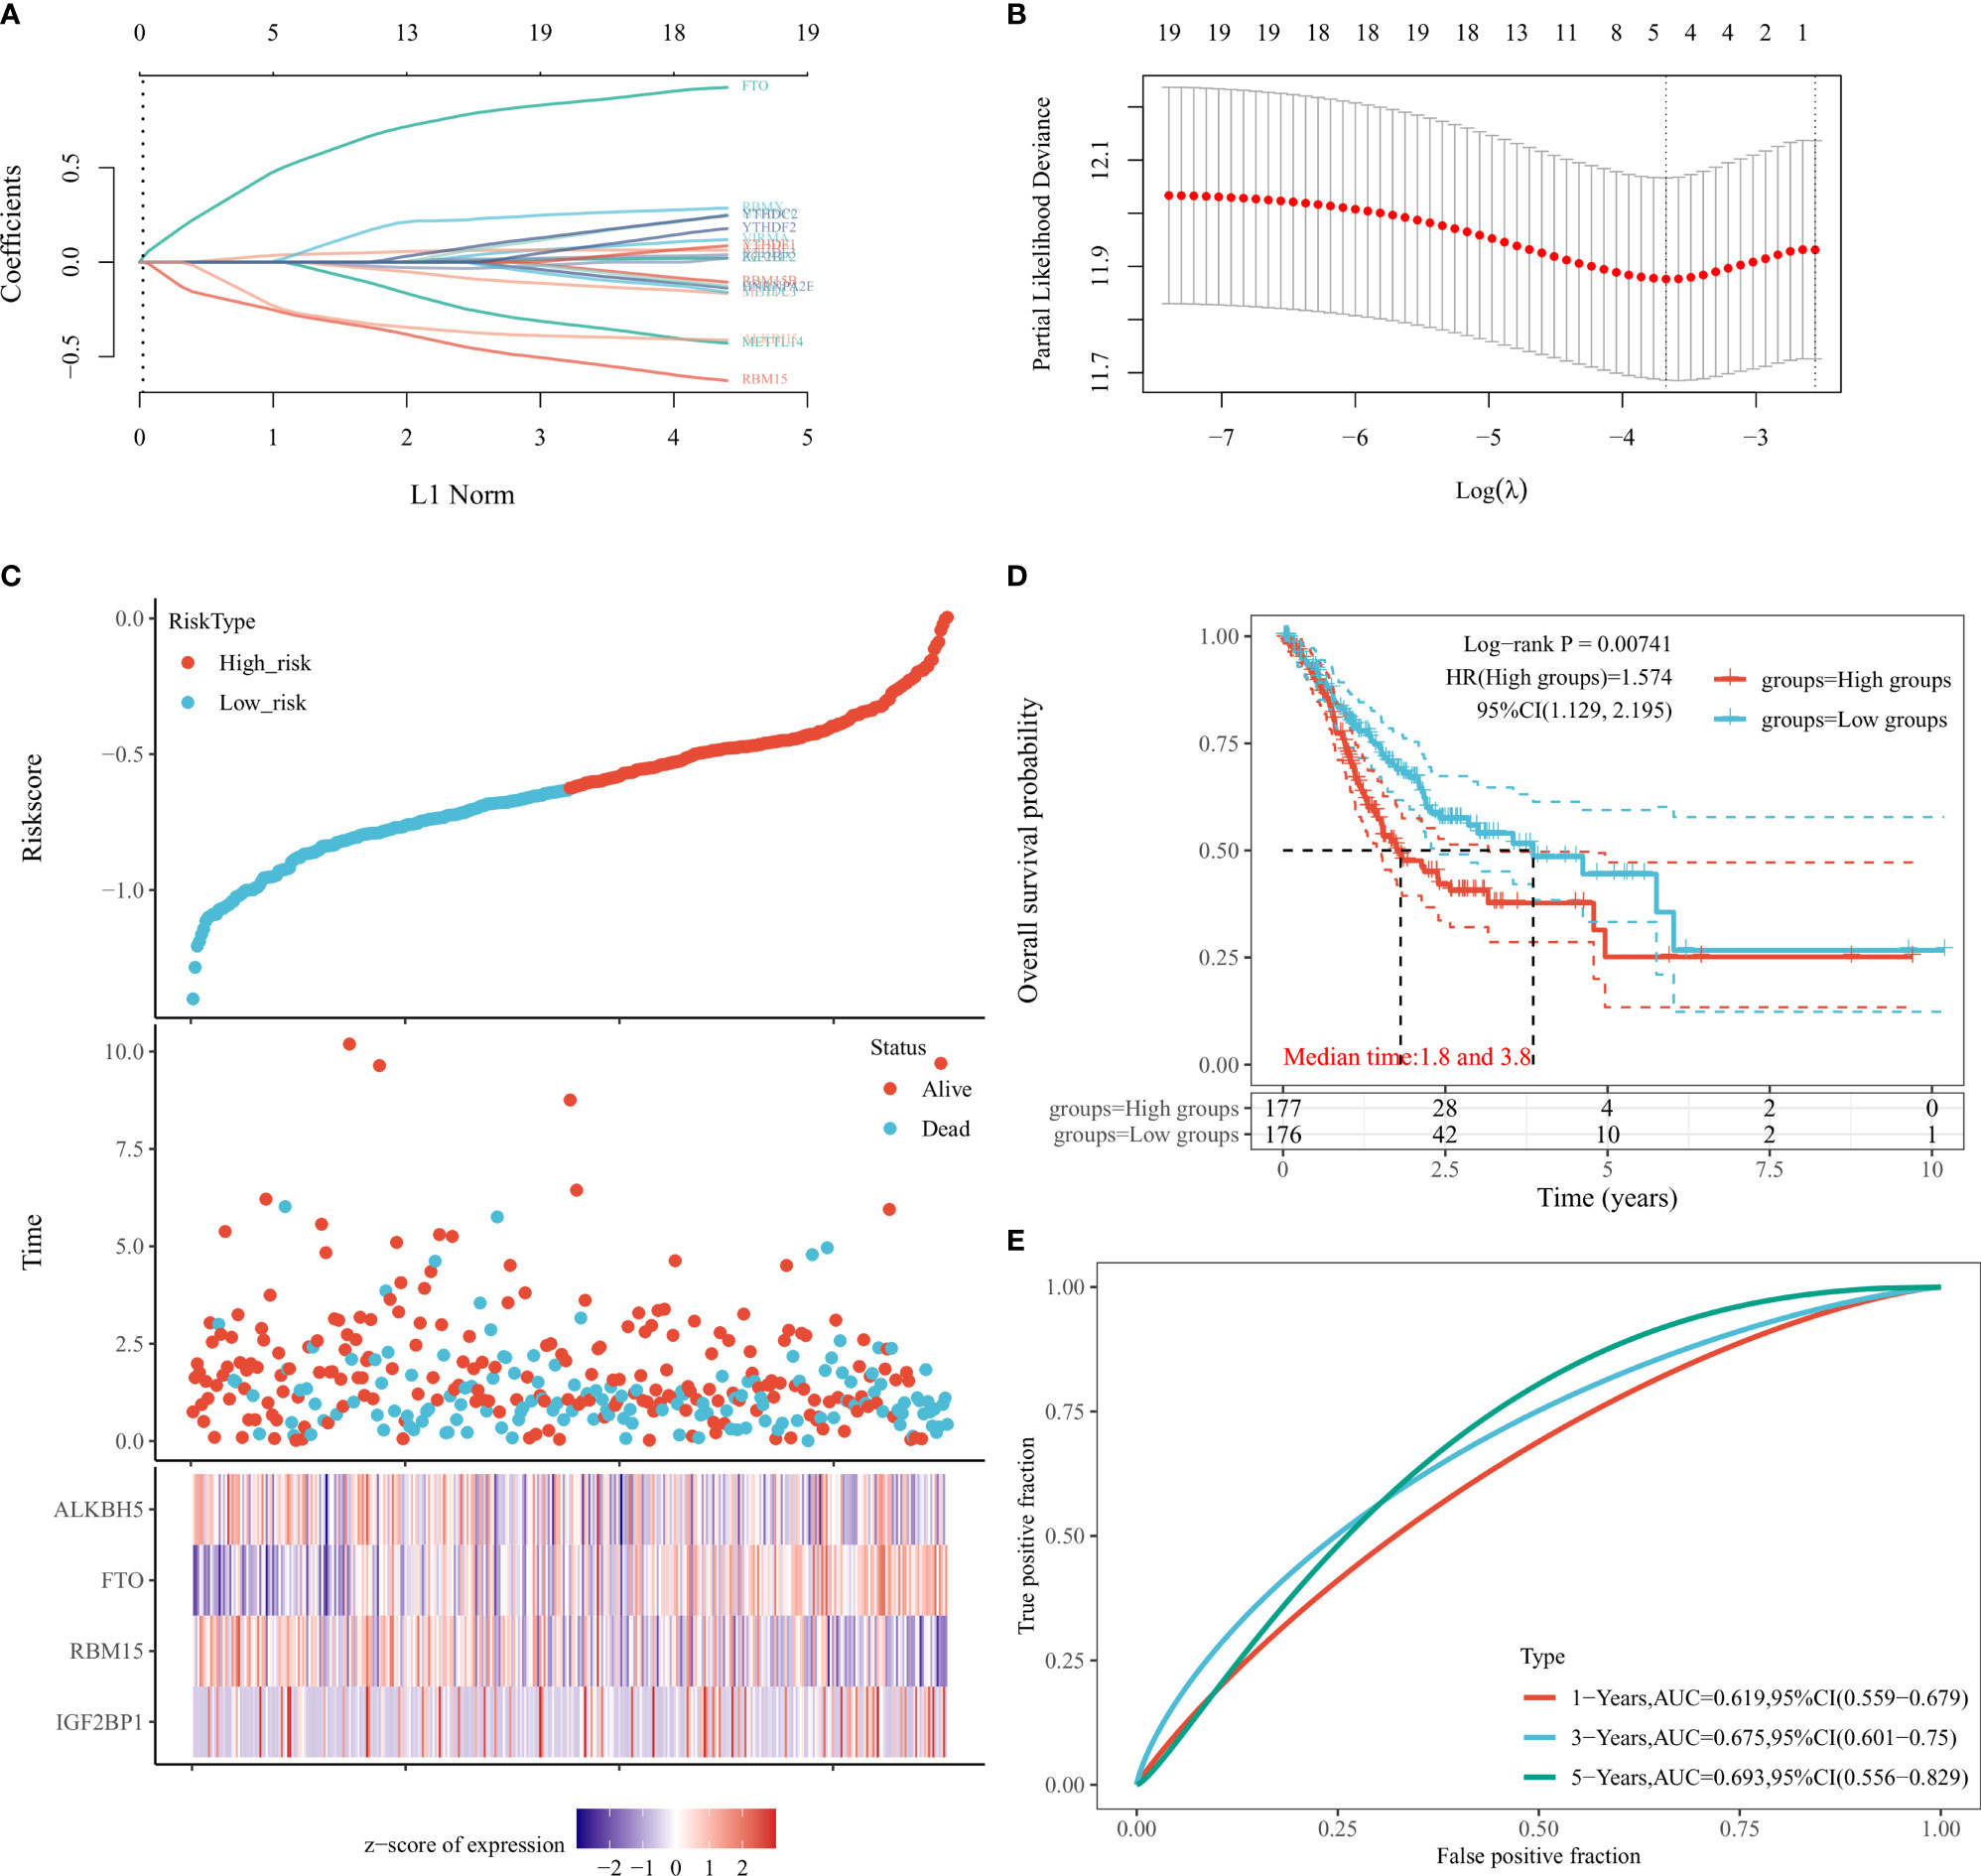
Figure 4 Relationship between m6A RNA methylation regulators and prognosis of STAD patients by constructing LASSO models in TCGA database. (A, B) Relationship between the solution path of LASSO model and cross-validation mean square error (CV MSE) and model size. (C) Risk assessment subgroups of STAD patients and the expression levels of IGF2BP1, RBM15, FTO, and ALKBH5 within the subgroups. (D) Kaplan-Meier curves of STAD patients in the high-risk and low-risk groups according to risk scores. (E) ROC curves to validate the LASSO model for 1-, 3-, and 5-year prediction efficiency.
We analyzed whether IGF2BP1, RBM15, FTO, and ALKBH5 genes were independent prognostic factors for STAD. Cox regression analysis, and univariate and multivariate Cox regression analysis revealed that FTO (HR: 2.337, 95% CI (1.595-3.423), P<0.001) may be an independent prognostic factor for STAD (Figures 5A, B). To develop a clinically applicable method predictive of patients’ survival, we used Nomogram plots to construct a prediction model, and Nomogram plots were developed to predict 1-, 3-, and 5-year OS rates using the Cox regression algorithm (Figure 5C). It was found that the calibration plots of 1, 3, and 5-year OS rates were all highly predictive when compared to the ideal model in the whole cohort (Figure 5D).
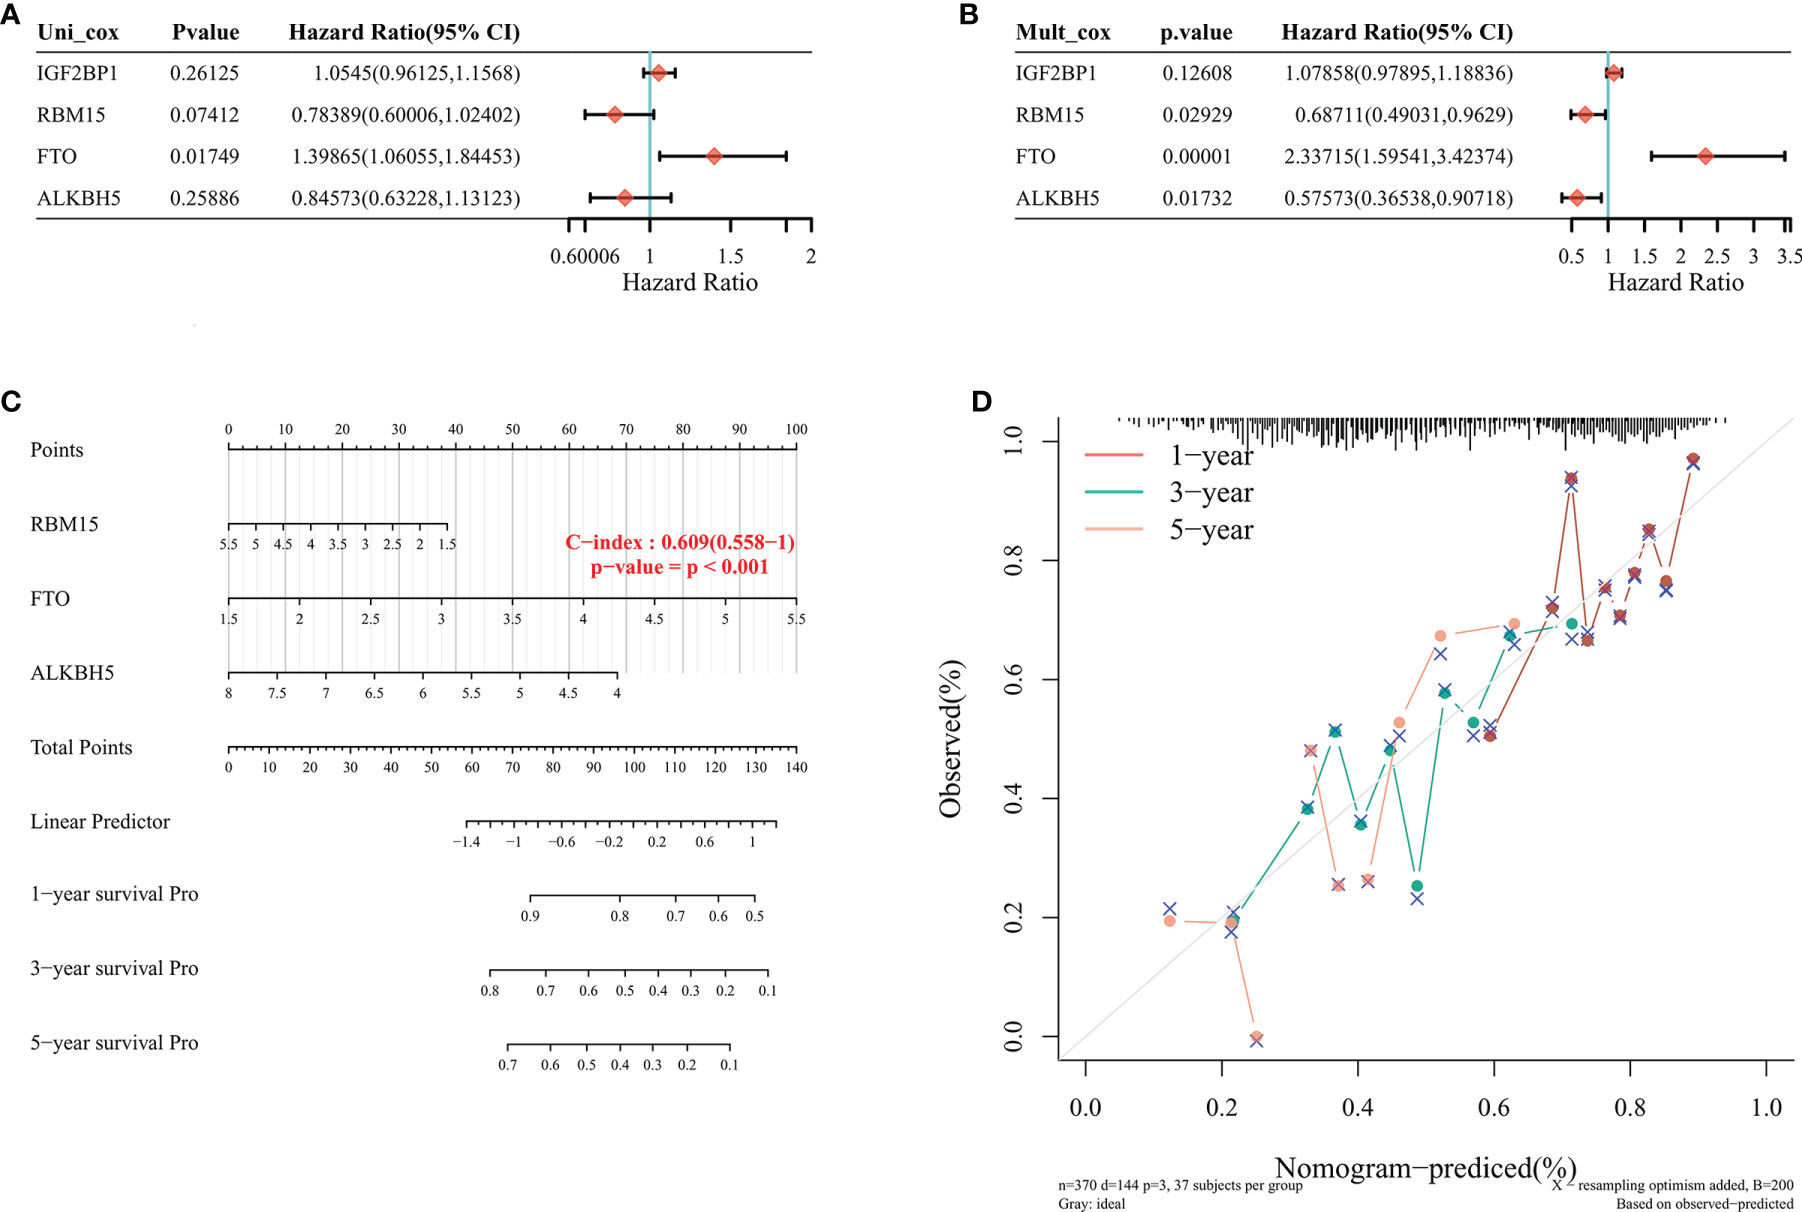
Figure 5 Nomogram plot construction in TCGA database. (A, B) Univariate and multifactorial cox analysis of p-value, risk factor HR, and confidence interval for 4-m6A RNA methylation regulator expression and clinical characteristics. (C) Columnar plots to predict 1-year, 3-year, and 5-year overall survival of STAD patients (D) Calibration curves of the overall survival line plot model in the discovery group. The diagonal dashed line indicates the ideal column line plot, the blue, red, and orange lines indicate the observed 1-year, 3-year, and 5-year column line plots.
In the above study, FTO was identified as an independent prognostic factor for STAD. To further understand the significance of FTO in STAD, we performed GSEA analysis and divided the patients into high- and low-expression groups based on the expression of FTO in STAD to observe the signaling enrichment of GO, KEGG, and markers in both groups. The 10 most enriched signaling pathways were ranked according to NES scores, and we selected the 10 most enriched signaling pathways for presentation (Tables 1–3).
We combined TCGA and GTEx databases to further compare the expression of FTO in different cancers, and found that FTO was expressed in 25 tumors, including in ACC, BRCA, CHOL, COAD, READ, DLBC, ESCA, GBM, HNSC, KICH, KIRC, KIRP, LAML, LGG, LIHC, LUAD, LUSC, MESO, OV, PAAD, PCPG, PRAD, READ, SKCM, STAD, STES, TGCT, THCA, UCEC, and showed a low expression in CESC (Figure 6A). In addition, the relationship between FTO expression and pan-cancer survival was analyzed based on TCGA database data. After plotting forest plots, we found that FTO expression was correlated with BLCA, KIRC, and STAD (Figure 6B), suggesting that FTO may have certain potential diagnostic or prognostic significance also in other tumors.
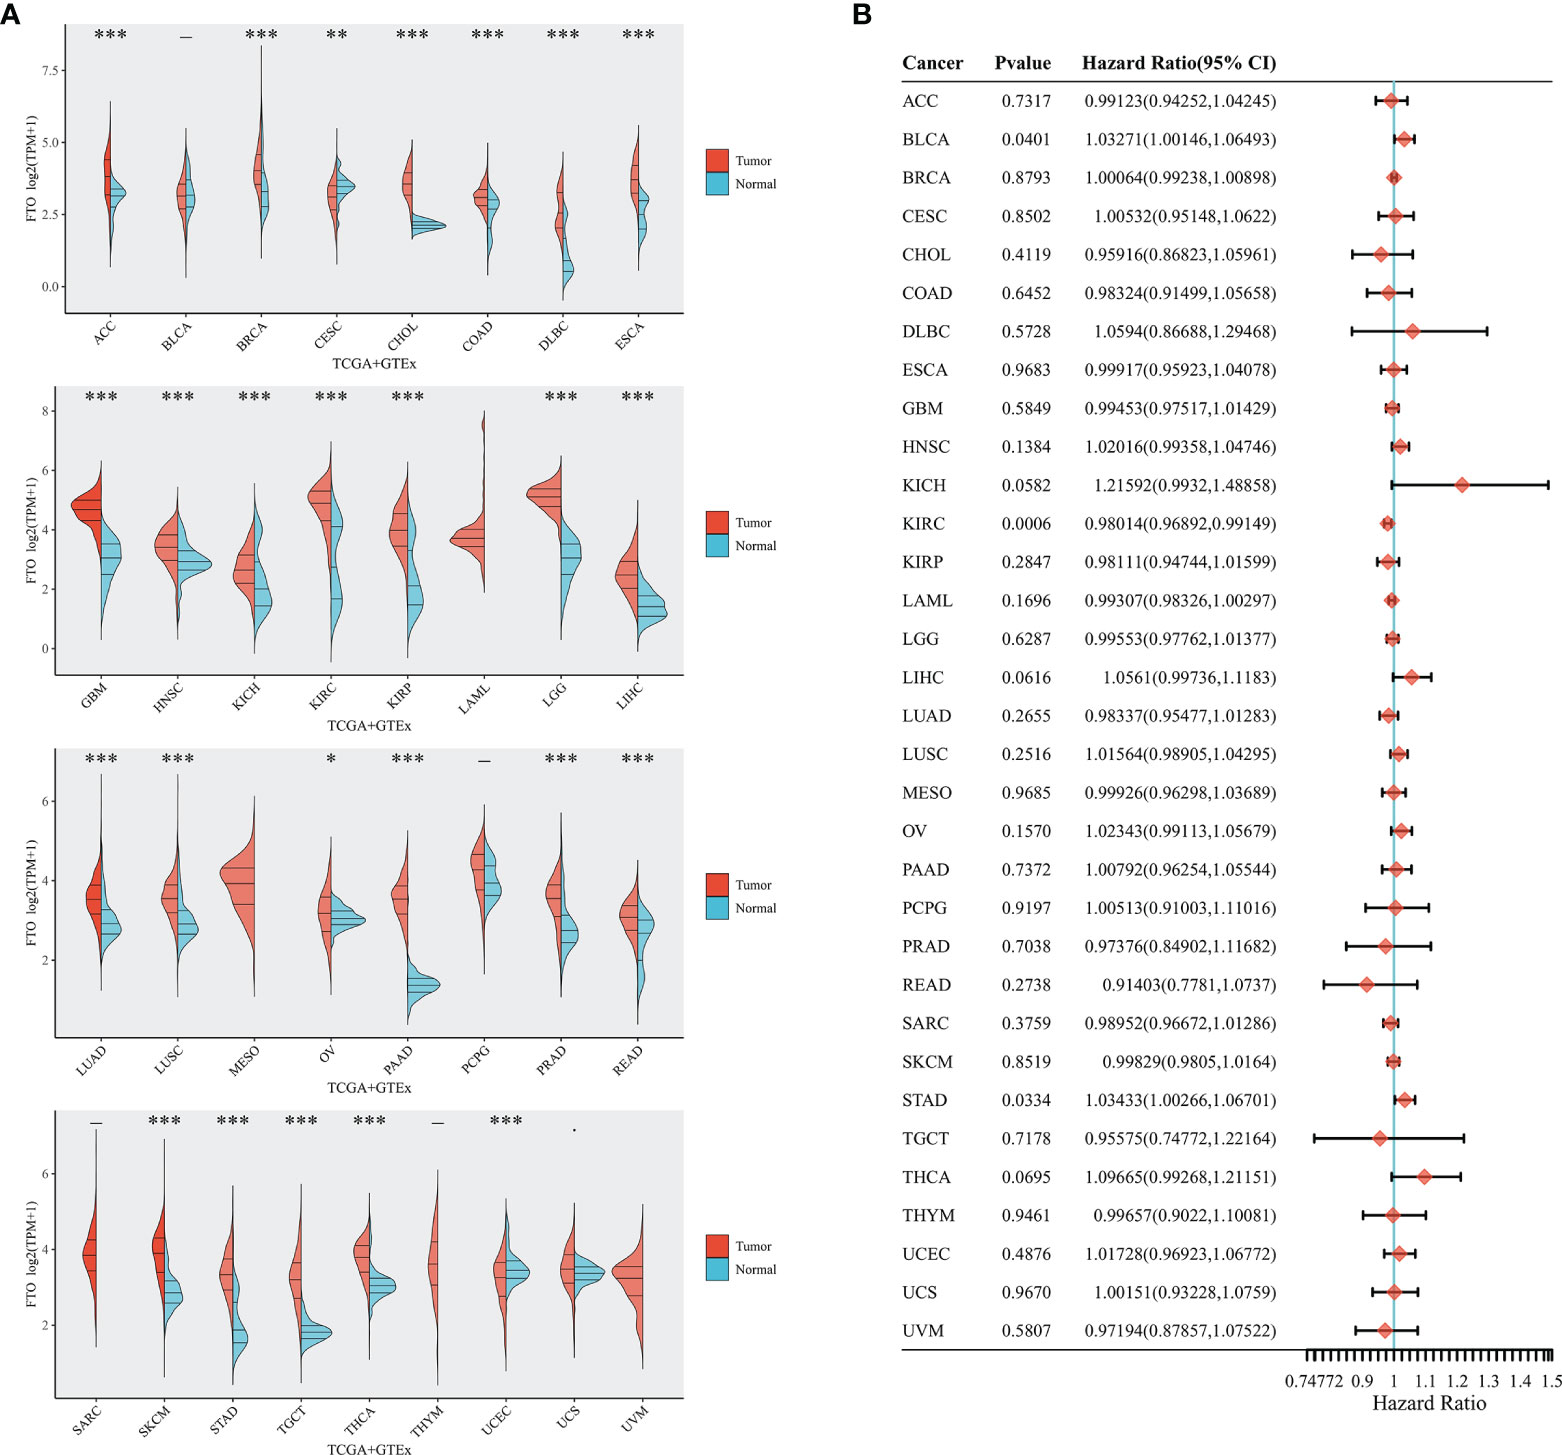
Figure 6 Expression of FTO in the pan-cancer and prognosis. (A) Expression level of FTO in pan-cancer in TCGA+GTEx database. (B) Prognosis of FTO expression level in pan-cancer in TCGA database. The tumor abbreviations are annotated in Table S1. *p < 0.05; **P < 0.01; ***P < 0.001.
Gastrointestinal tract tumors are currently one of the most common malignancies in clinical practice. STAD is the fifth most common malignancy in the world and a serious threat to human health (22). At present, the pathogenetic factors of STAD were not clear. However, scholars have found that environmental factors, daily diet, H. pylori infection, and genetic inheritance can all lead to development of STAD (23, 24). Currently, the preferred treatment option for STAD is surgery combined with adjuvant chemotherapy, radiotherapy, targeted therapy, and immunosuppressive agents (25). Although the mortality rate of STAD is showing a decreasing trend, the 5-year survival of patients with advanced STAD is still below 30% (5). Targeted drug therapy has a positive effect on prolonging patient's survival time, long-term use of drug will result in drug resistance (26), which has now become one of urgent problems to be resolved in clinical practice. For this reason, further investigation of the molecular mechanisms of STAD pathogenesis and search of new therapeutic targets should be addressed.
DNA methylation is currently one of the most important mechanisms in tumor studies (27). m6A methylation is by far the most common form of mRNA modification and plays an important role in tumor development through post-transcriptional regulation (28). Recent studies indicated that dysregulation of m6A methylation regulatory proteins can induce downstream RNA metabolism disorders (29). Guo et al. (30) found that RNA demethylase ALKBH5 inhibits pancreatic cancer progression through post-transcriptional activation of PER1 in m6A-YTHDF2-dependent manner, and Zhang et al. (31) showed that YTHDF2 supresses pancreatic cancer progression through m6A RNA methylation regulating OCT4 expression to promote hepatocellular carcinoma stem cell phenotype and tumor metastasis. However, not all m6A modifiers of m6A modification are in a suppressed statues in tumors. Shen et al. (32) found that ALKBH5 expression deficiency is a poor prognostic indicator to acute myeloid leukemia. Zhang et al. demonstrated that ALKBH5 expression is up-regulated in gliomas, and this can promote glioma development and progression through up-regulating ALKBH5-mediated FOXM1 (33). These findings indicated that the regulation of m6A methylation modification levels is highly complex. Moreover, current studies on m6A methylation modifiers were mainly focused on oncogenic pathways and have not explored m6A regulators in depth.
In the current study, through comprehensive analyses, we found that m6A RNA methylation regulators were involved in the development of STAD, and that m6A RNA methylation regulators were associated with STAD pathological features. In addition, for a better analysis of m6A RNA methylation regulators, we applied consensus clustering, a more efficient clustering method allowing a better assessment of cluster stability through performing multiple iterations of the clustering method. In this study, we divided the STAD samples into 3 subgroups (cluster1, cluster2, and cluster3) by consensus clustering. The analytical results showed that subgroup levels were correlated with pT, and pN staging. Finally, through building a prognostic model, we developed a prognostic genetic marker (FTO), which could classify the OS of STAD patients into low- and high-risk subgroups. Cox regression analysis showed that FTO notation can be used as a potential independent prognostic marker and a predictor of clinicopathological parameters.
FTO, a nuclear protein of the AlkB-related superfamily of non-heme iron and 2-oxoglutarate-dependent oxygenases, is an important demethylase (34). Existing studies showed a strong correlation between FTO in humans and body mass index (35), obesity risk (36), and type 2 diabetes (37). FTO consumption could increase total m6A levels in polyadenylated RNAs (38). m6A is oxidized by FTO and N6-hydroxymethyladenosine (Hm6A), and N6-formyladenosine (F6A) are produced during the oxidation process (39). The potential functions of the intermediates produced during this oxidation process remains unclear. To further clarify the mechanisms of FTO in STAD, we found that FTO was involved in cellular oxidation, epithelial-mesenchymal transition, and other functions by conducting single gene enrichment analysis. Earlier studies showed that FTO is not only expressed in STAD, but also in acute myeloid leukemia (40), cervical squamous carcinoma (41), and glioblastoma (42), indicating that FTO may be involved in the development of other tumors. To further determine the expression of FTO in other tumors, the expression of FTO in 32 tumors was analyzed based on the TCGA database and the GTEx database. Here, we found that FTO was high-expressed in a majority of tumors and was considered as a risk factor for STAD patients in prognostic analysis. This indicated that FTO could be expected to be an independent prognostic and potential therapeutic target for STAD. The above study showed the significance of FTO in STAD, which provided new evidence for the pathogenesis and potential targets of tumors and new ideas for tumor gene-targeting therapy. However, this study still had some limitations, as this study did not carry out experimental validation, and the conclusions obtained through bioinformatics analysis should be further confirmed in vivo and in vitro. Therefore, in later studies, we plan to conduct clinical trials and basic experiments to verify the the findings of this study.
In conclusion, our results systematically demonstrated the expression, potential function, and prognostic value of the m6A RNA methylation regulator FTO in STAD, contributing to tumor gene-targeting therapy and clinical prognosis study.
The original contributions presented in the study are included in the article/Supplementary Material. Further inquiries can be directed to the corresponding author.
All authors listed have made a substantial, direct, and intellectual contribution to the work and approved it for publication.
This work was supported by Natural Science of Ningbo Foundation (2015A610223), Key Research And Development Project For Science And Technology Innovation of Xuzhou City (KC20094), Xuzhou key clinical physician training program (2020) and Ningbo Clinical Medicine Research Center Project (grant no. 2019A21003)
The authors declare that the research was conducted in the absence of any commercial or financial relationships that could be construed as a potential conflict of interest.
All claims expressed in this article are solely those of the authors and do not necessarily represent those of their affiliated organizations, or those of the publisher, the editors and the reviewers. Any product that may be evaluated in this article, or claim that may be made by its manufacturer, is not guaranteed or endorsed by the publisher.
The Supplementary Material for this article can be found online at: https://www.frontiersin.org/articles/10.3389/fonc.2021.726018/full#supplementary-material
1. Dignass A, Allez M, Danese S, Marteau P. Digestive Diseases. Introduction. Dig Dis (2014) 32(Suppl1):1. doi: 10.1159/000367977
2. Hoshi H. Management of Gastric Adenocarcinoma for General Surgeons. Surg Clin North Am (2020) 100(3):523–34. doi: 10.1016/j.suc.2020.02.004
3. Miyazawa M, Matsuda M, Yano M, Hara Y, Arihara F, Horita Y, et al. Gastric Adenocarcinoma of the Fundic Gland (Chief Cell-Predominant Type): A Review of Endoscopic and Clinicopathological Features. World J Gastroenterol (2016) 22(48):10523–31. doi: 10.3748/wjg.v22.i48.10523
4. Bray F, Ferlay J, Soerjomataram I, Siegel RL, Torre LA, Jemal A. Global Cancer Statistics 2018: GLOBOCAN Estimates of Incidence and Mortality Worldwide for 36 Cancers in 185 Countries. CA Cancer J Clin (2018) 68(6):394–424. doi: 10.3322/caac.21492
5. Rima FA, Hussain M, Dewan RK, Haque MN, Sultana T, Chowdhury F, et al. Clinicopathologic Features of Gastric and Gastrooesophageal Junction Adenocarcinoma. Mymensingh Med J (2020) 29(1):195–201.
6. Wang H, Shen L, Li Y, Lv J. Integrated Characterisation of Cancer Genes Identifies Key Molecular Biomarkers in Stomach Adenocarcinoma. J Clin Pathol (2020) 73(9):579–86. doi: 10.1136/jclinpath-2019-206400
7. Gibbs RA. The Human Genome Project Changed Everything. Nat Rev Genet (2020) 21(10):575–6. doi: 10.1038/s41576-020-0275-3
8. Wang Z, Jensen MA, Zenklusen JC. A Practical Guide to The Cancer Genome Atlas (TCGA). Methods Mol Biol (2016) 1418:111–41. doi: 10.1007/978-1-4939-3578-9_6
9. Kassam I, Wu Y, Yang J, Visscher PM, McRae AF. Tissue-Specific Sex Differences in Human Gene Expression. Hum Mol Genet (2019) 28(17):2976–86. doi: 10.1093/hmg/ddz090
10. Anteneh H, Fang J, Song J. Structural Basis for Impairment of DNA Methylation by the DNMT3A R882H Mutation. Nat Commun (2020) 11(1):2294. doi: 10.1038/s41467-020-16213-9
11. Cedar H, Bergman Y. Linking DNA Methylation and Histone Modification: Patterns and Paradigms. Nat Rev Genet (2009) 10(5):295–304. doi: 10.1038/nrg2540
12. Lei S, Zhang X, Li J, Gao Y, Wu J, Duan X, et al. Current Progress in Messenger RNA-Based Gene Therapy. J BioMed Nanotechnol (2020) 16(7):1018–44. doi: 10.1166/jbn.2020.2961
13. Gan H, Hong L, Yang F, Liu D, Jin L, Zheng Q. [Progress in Epigenetic Modification of mRNA and the Function of M6a Modification]. Sheng Wu Gong Cheng Xue Bao (2019) 35(5):775–83. doi: 10.13345/j.cjb.180416
14. Zhao BS, Roundtree IA, He C. Post-Transcriptional Gene Regulation by mRNA Modifications. Nat Rev Mol Cell Biol (2017) 18(1):31–42. doi: 10.1038/nrm.2016.132
15. Weng Y, Li C, Yang T, Hu B, Zhang M, Guo S, et al. The Challenge and Prospect of mRNA Therapeutics Landscape. Biotechnol Adv (2020) 40:107534. doi: 10.1016/j.biotechadv.2020.107534
16. Motorin Y, Helm M. RNA Nucleotide Methylation. Wiley Interdiscip Rev RNA (2011) 2(5):611–31. doi: 10.1002/wrna.79
17. Sun T, Wu R, Ming L. The Role of M6a RNA Methylation in Cancer. BioMed Pharmacother (2019) 112:108613. doi: 10.1016/j.biopha.2019.108613
18. Ma Z, Ji J. N6-Methyladenosine (M6a) RNA Modification in Cancer Stem Cells. Stem Cells (2020). doi: 10.1002/stem.3279
19. Zhang H, Shi X, Huang T, Zhao X, Chen W, Gu N, et al. Dynamic Landscape and Evolution of M6a Methylation in Human. Nucleic Acids Res (2020) 48(11):6251–64. doi: 10.1093/nar/gkaa347
20. Zhang Y, Liu X, Liu L, Li J, Hu Q, Sun R. Expression and Prognostic Significance of M6a-Related Genes in Lung Adenocarcinoma. Med Sci Monit (2020) 26:e919644. doi: 10.12659/MSM.919644
21. Zhang Y, Kang M, Zhang B, Meng F, Song J, Kaneko H, et al. M(6)A Modification-Mediated CBX8 Induction Regulates Stemness and Chemosensitivity of Colon Cancer. via upregulation LGR5. Mol Cancer (2019) 18(1):185. doi: 10.1186/s12943-019-1116-x
22. Li Z, Wang Y, Ji J. Prognostic and Influential Factors of Gastric Stump Cancer. Zhonghua Wei Chang Wai Ke Za Zhi (2018) 21(5):491–7.
23. Abdi E, Latifi-Navid S, Zahri S, Yazdanbod A, Pourfarzi F. Risk Factors Predisposing to Cardia Gastric Adenocarcinoma: Insights and New Perspectives. Cancer Med (2019) 8(13):6114–26. doi: 10.1002/cam4.2497
24. Shao D, Vogtmann E, Liu A, Qin J, Chen W, Abnet CC, et al. Microbial Characterization of Esophageal Squamous Cell Carcinoma and Gastric Cardia Adenocarcinoma From a High-Risk Region of China. Cancer (2019) 125(22):3993–4002. doi: 10.1002/cncr.32403
25. Lin D, Khan U, Goetze TO, Reizine N, Goodman KA, Shah MA, et al. Gastroesophageal Junction Adenocarcinoma: Is There an Optimal Management? Am Soc Clin Oncol Educ Book (2019) 39:e88–95. doi: 10.1200/EDBK_236827
26. Al-Abdulla R, Perez-Silva L, Lozano E, Macias RIR, Herraez E, Abad M, et al. Sensitizing Gastric Adenocarcinoma to Chemotherapy by Pharmacological Manipulation of Drug Transporters. Biochem Pharmacol (2020) 171:113682. doi: 10.1016/j.bcp.2019.113682
27. Moore LD, Le T, Fan G. DNA Methylation and its Basic Function. Neuropsychopharmacology (2013) 38(1):23–38. doi: 10.1038/npp.2012.112
28. Zafon C, Gil J, Perez-Gonzalez B, Jorda M. DNA Methylation in Thyroid Cancer. Endocr Relat Cancer (2019) 26(7):R415–39. doi: 10.1530/ERC-19-0093
29. Chen M, Wong CM. The Emerging Roles of N6-Methyladenosine (M6a) Deregulation in Liver Carcinogenesis. Mol Cancer (2020) 19(1):44. doi: 10.1186/s12943-020-01172-y
30. Guo X, Li K, Jiang W, Hu Y, Xiao W, Huang Y, et al. RNA Demethylase ALKBH5 Prevents Pancreatic Cancer Progression by Posttranscriptional Activation of PER1 in an M6a-YTHDF2-Dependent Manner. Mol Cancer (2020) 19(1):91. doi: 10.1186/s12943-020-01158-w
31. Zhang C, Huang S, Zhuang H, Ruan S, Zhou Z, Huang K, et al. YTHDF2 Promotes the Liver Cancer Stem Cell Phenotype and Cancer Metastasis by Regulating OCT4 Expression via M6a RNA Methylation. Oncogene (2020) 39(23):4507–18. doi: 10.1038/s41388-020-1303-7
32. Shen C, Sheng Y, Zhu AC, Robinson S, Jiang X, Dong L, et al. RNA Demethylase ALKBH5 Selectively Promotes Tumorigenesis and Cancer Stem Cell Self-Renewal in Acute Myeloid Leukemia. Cell Stem Cell (2020) 27(1):64–80.e69. doi: 10.1016/j.stem.2020.04.009
33. Zhang S, Zhao BS, Zhou A, Lin K, Zheng S, Lu Z, et al. M(6)A Demethylase ALKBH5 Maintains Tumorigenicity of Glioblastoma Stem-Like Cells by Sustaining FOXM1 Expression and Cell Proliferation Program. Cancer Cell (2017) 31(4):591–606.e596. doi: 10.1016/j.ccell.2017.02.013
34. Li J, Zhu L, Shi Y, Liu J, Lin L, Chen X. M6a Demethylase FTO Promotes Hepatocellular Carcinoma Tumorigenesis via Mediating PKM2 Demethylation. Am J Transl Res (2019) 11(9):6084–92.
35. Zhang M, Zhang Y, Ma J, Guo F, Cao Q, Zhang Y, et al. The Demethylase Activity of FTO (Fat Mass and Obesity Associated Protein) Is Required for Preadipocyte Differentiation. PloS One (2015) 10(7):e0133788. doi: 10.1371/journal.pone.0133788
36. Chen J, Du B. Novel Positioning From Obesity to Cancer: FTO, an M(6)A RNA Demethylase, Regulates Tumour Progression. J Cancer Res Clin Oncol (2019) 145(1):19–29. doi: 10.1007/s00432-018-2796-0
37. Yang Y, Shen F, Huang W, Qin S, Huang JT, Sergi C, et al. Glucose Is Involved in the Dynamic Regulation of M6a in Patients With Type 2 Diabetes. J Clin Endocrinol Metab (2019) 104(3):665–73. doi: 10.1210/jc.2018-00619
38. Bartosovic M, Molares HC, Gregorova P, Hrossova D, Kudla G, Vanacova S. N6-Methyladenosine Demethylase FTO Targets pre-mRNAs and Regulates Alternative Splicing and 3'-End Processing. Nucleic Acids Res (2017) 45(19):11356–70. doi: 10.1093/nar/gkx778
39. Shen L, Song CX, He C, Zhang Y. Mechanism and Function of Oxidative Reversal of DNA and RNA Methylation. Annu Rev Biochem (2014) 83:585–614. doi: 10.1146/annurev-biochem-060713-035513
40. Huang Y, Su R, Sheng Y, Dong L, Dong Z, Xu H, et al. Small-Molecule Targeting of Oncogenic FTO Demethylase in Acute Myeloid Leukemia. Cancer Cell (2019) 35(4):677–91.e610. doi: 10.1016/j.ccell.2019.03.006
41. Zou D, Dong L, Li C, Yin Z, Rao S, Zhou Q. The M(6)A Eraser FTO Facilitates Proliferation and Migration of Human Cervical Cancer Cells. Cancer Cell Int (2019) 19:321. doi: 10.1186/s12935-019-1045-1
Keywords: N6-methyladenosine (m6A), pan-cancer, gastric adenocarcinoma, risk score, Cox regression, TCGA, FTO
Citation: Zhao Y, Yan X, Wang Y, Zhou J and Yu Y (2022) N6-Methyladenosine Regulators Promote Malignant Progression of Gastric Adenocarcinoma. Front. Oncol. 11:726018. doi: 10.3389/fonc.2021.726018
Received: 16 June 2021; Accepted: 23 December 2021;
Published: 01 March 2022.
Edited by:
Ye Wang, The Second Affiliated Hospital of Medical College of Qingdao University, Qingdao, ChinaReviewed by:
Show-Mei Chuang, National Chung Hsing University, TaiwanCopyright © 2022 Zhao, Yan, Wang, Zhou and Yu. This is an open-access article distributed under the terms of the Creative Commons Attribution License (CC BY). The use, distribution or reproduction in other forums is permitted, provided the original author(s) and the copyright owner(s) are credited and that the original publication in this journal is cited, in accordance with accepted academic practice. No use, distribution or reproduction is permitted which does not comply with these terms.
*Correspondence: Yang Yu, b25jbzQwMzYyNzQzN0AxNjMuY29t
Disclaimer: All claims expressed in this article are solely those of the authors and do not necessarily represent those of their affiliated organizations, or those of the publisher, the editors and the reviewers. Any product that may be evaluated in this article or claim that may be made by its manufacturer is not guaranteed or endorsed by the publisher.
Research integrity at Frontiers

Learn more about the work of our research integrity team to safeguard the quality of each article we publish.