
94% of researchers rate our articles as excellent or good
Learn more about the work of our research integrity team to safeguard the quality of each article we publish.
Find out more
ORIGINAL RESEARCH article
Front. Oncol. , 10 September 2021
Sec. Cancer Imaging and Image-directed Interventions
Volume 11 - 2021 | https://doi.org/10.3389/fonc.2021.725922
This article is part of the Research Topic Computational Radiomics for Cancer Characterization View all 36 articles
 Shuxian Niu1†Xiaoyu Wang2†Nannan Zhao2†Guanyu Liu2Yangyang Kan2Yue Dong2E-Nuo Cui3
 Yahong Luo2Tao Yu2*
 Xiran Jiang1*
Objectives: This study aims to evaluate digital mammography (DM), digital breast tomosynthesis (DBT), dynamic contrast-enhanced (DCE), and diffusion-weighted (DW) MRI, individually and combined, for the values in the diagnosis of breast cancer, and propose a visualized clinical-radiomics nomogram for potential clinical uses.
Methods: A total of 120 patients were enrolled between September 2017 and July 2018, all underwent preoperative DM, DBT, DCE, and DWI scans. Radiomics features were extracted and selected using the least absolute shrinkage and selection operator (LASSO) regression. A radiomics nomogram was constructed integrating the radiomics signature and important clinical predictors, and assessed with the receiver operating characteristic (ROC) curve, calibration curve, and decision curve analysis (DCA).
Results: The radiomics signature derived from DBT plus DM generated a lower area under the ROC curve (AUC) and sensitivity, but a higher specificity compared with that from DCE plus DWI. The nomogram integrating the combined radiomics signature, age, and menstruation status achieved the best diagnostic performance in the training (AUCs, nomogram vs. combined radiomics signature vs. clinical model, 0.975 vs. 0.964 vs. 0.782) and validation (AUCs, nomogram vs. combined radiomics signature vs. clinical model, 0.983 vs. 0.978 vs. 0.680) cohorts. DCA confirmed the potential clinical usefulness of the nomogram.
Conclusions: The DBT plus DM provided a lower AUC and sensitivity, but a higher specificity than DCE plus DWI for detecting breast cancer. The proposed clinical-radiomics nomogram has diagnostic advantages over each modality, and can be considered as an efficient tool for breast cancer screening.
Breast cancer has been a major concern and the second leading cause of cancer death among women (1). The prevalence of breast cancer has increased in the recent years, mainly due to the implementation of an early screening mammography (2). Although there is still no effective way to prevent breast cancer, studies have shown that early detection and treatment can increase the chance of full recovery for the patients (3).
Digital mammography (DM) using 2D technique, as a widely used tool for detecting breast cancer, has a serious limitation that the visibility of lesions may be decreased since they are frequently obscured by dense fibroglandular and other normal tissues within the breast (4), which often leads to a missed diagnosis or misdiagnosis (5). To address this issue, digital breast tomosynthesis (DBT) rotates the X-ray tubes in a limited angle, thus allowing an improved identification of anomalies obscured by normal tissues (6, 7). Therefore, the DBT is commonly considered to be capable of decreasing the recall rates and increasing the detection rates for breast cancer compared with DM (8). Magnetic resonance imaging (MRI), as another popular tool for breast screening, has been demonstrated to be very sensitive in detecting breast cancer (9). While, the relative low specificity of MRI screening may lead to a high rate of overtreatment (10). Besides, the high examination fees of MRI also hinder the clinical application in early breast screening.
In the clinical practice, the diagnosis of breast cancer based on DM, DBT, or MRI mainly relies on visual inspections of the morphological changes of breast lesions, including size, shape, and gray level changes, and, thus, require experienced clinicians to make decisions. Previous reports have compared the diagnostic capabilities of DM with DBT (11, 12) and mammography with MRI (13, 14), all based on subjective visual examinations and the lack of quantified assessments. Recently, the radiomics-based computer aided diagnosis (CAD) has received increasing attention due to its quantitative advantages (15, 16). By using automated data characterization algorithms, the radiomics can extract and select discriminative and quantified features from a region of interest, which were shown to reflect biological information regarding the tumor and were highly correlated with disease status (17). Subsequent analysis, including statistics, machine learning classifiers, and nomogram can give associations between imaging features and the underlying pathophysiology (18). Radiomics-based studies on breast cancer have been proposed for predicting the axillary lymph node metastasis (19–23), molecular subtypes (24–28), tumor grades (29–31), and treatment responses (32–37). Some recent studies also conducted a radiomics-based quantified analysis for the diagnosis of breast cancer based on DM (38, 39), DBT (40, 41), and MRI (42, 43) separately, and demonstrated improvements of the diagnostic performance using radiomics compared with visual examinations by radiologists. A recent effort evaluated T2W, DCE, and DWI separately and in combination, but ignored the clinical values of mammography screening, and lack of correlating their findings with clinical evaluation, which may limit the clinical applicability (44).
To our knowledge, direct and quantified comparisons among MD, DBT, and MRI have not been reported. Therefore, the present study aims to widen the understanding of mammography and MRI in breast cancer screening by directly and quantitatively comparing the diagnostic efficiency of each modality individually and in combination. Besides, this study aims to propose a visualized clinical-radiomics nomogram based on the optimal imaging combination and important clinical factors for early assessment of suspected breast lesions.
This retrospective analysis of breast DM, DBT, and MRI data was approved by the Institutional Research Ethics Board of our institute (Approval No. 2013010). The informed consent requirement was waived. A total of 120 patients [mean age ± standard deviation (SD), 48.81 ± 10.83] were enrolled between September 2017 and July 2018 in our hospital. The number of the patients harboring pathologically confirmed benign or malignant lesions were 50 and 70, respectively. Inclusion criteria were as follows: (i) older than 18 years; (ii) underwent DM, DBT, and MRI screening before surgery; and (iii) underwent surgical resection with pathological confirmation. Exclusion criteria were: (i) combined with other tumor diseases; (ii) during menstruation, pregnancy, or lactation periods; (iii) history of breast surgery, radiotherapy, or chemotherapy, as well as breast implants; and (iv) having artifacts in the images. All patients were randomly divided into training and validation cohorts at a 2:1 ratio using stratified sampling. Clinical factors including age, family history of breast cancer, history of biopsy, and menstruation status were obtained from the electronic medical record system of our hospital.
Preoperative DM and DBT examinations were performed by a radiographer with 10 years of work experience using a DBT scanner (Hologic Selenia Dimensions, Hologic, USA). The obtained images of the compressed breast were reconstructed with a 1-mm intersection spacing to give a three-dimensional view of the tissue, slice by slice, and suitably spaced. The number of the slices depends on the compressed breast thickness. The following parameters were used to perform the DBT scanning: The voltage range of the X-ray tubes: 20.0–49.0 kV (step: 1.0 kV), nominal power: 3.0 kW, current time range: 300–400 mAs, scanning time < 4.0 s, reconstruction time: 2.0–5.0 s, and pixel size: 70 μm. The obtained DBT images were interpreted on a Hologic breast computer-aided diagnosis (CAD) workstation (SecureViewDx; Hologic) equipped with two 5-megapixel monitors.
Preoperative MRI scans were performed using a 1.5-T MRI scanner (HDx, GE Healthcare). The axial diffusion-weighted imaging was used with the following parameters: the b-value: 800 s/mm2, repetition time (TR)/echo time (TE)/inversion time (TI): 5,000 ms/64 ms/0 ms, flip angle: 90°, slice thickness: 6 mm, slice gap: 7.5 mm, field of view: 240 mm, matrix size: 128 × 128. The axially vibrant sequence (a 3D T1-weighted imaging technique covering bilateral breasts conventional scans or dynamic enhanced scans to obtain axial or sagittal images with high signal-to-noise ratio and high resolution) with the following parameters: TR/TE/TI: 6.2 ms/3.0 ms/13 ms; flip angle: 10°; slice thickness: 3.2 mm; slice gap: 3.2 mm, 48 slices per volume; field of view: 360 mm; matrix size: 350 × 350. The contrast agent was injected intravenously (0.1 mmol/kg of Gd-DTPA-MBA, Omniscan, GE Healthcare), followed by a 20-mL saline flush, both at the rate of 3 ml/s. After the intravenous injection, continuous non-interval scans were performed in eight phases, with a scan time for each phase of 43 seconds. All scanned images were stored in the Picture Archiving and Communication System (PACS) in our hospital in a Digital Imaging and Communications in Medicine (DICOM) format. The details about their scan parameters are shown in Supplementary Tables S1, S2.
Regions of interest (ROIs) were manually segmented slice by slice for each patient using the ITK-SNAP software (version 3.6.0) by a radiologist with 12 years of working experience according to the breast imaging reporting and data system (BI-RADS). The radiologist was blinded to the pathological results for the patients. The ROIs included the breast lesions and edges, exporting as a compressed package in an NII format for further analysis.
Radiomics features including 18 first-order statistical, 13 shape-based, and 74 textual features were extracted based on the segmented ROIs using the Pyradiomics package in Python 3.6 (https://pyradiomics.readthedocs.io/en/). The texture feature category consists of the gray level cooccurence matrix (GLCM), gray level run length matrix (GLRLM), gray level size zone matrix (GLSZM), neighboring gray tone difference matrix (NGTDM), and gray level dependence matrix (GLDM) features. The first-order and texture features were also calculated from the original images that were filtered with eight types of filters: logarithm, square, gradient, exponential, laplacian of Gaussian, wavelet, and localbinarypattern2D (45). Detailed descriptions of the features and calculation protocols can be found in a previous report (46).
To obtain reliable and discriminative features, 30 patients were randomly selected to perform the intraclass correlation coefficient (ICC) analysis (47), 15 from the training group and 15 from the validation group. The ROIs were double-blind segmented by another radiologist with 8 years of working experience. Features with ICC > 0.75 were retained, then further selected by the Mann-Whitney U test. Features with P < 0.05 were considered significant variables between the benign and malignant groups. Finally, the least absolute shrinkage and selection operator (LASSO) logistic regression was used to identify the most discriminative features with a 10-fold cross-validation for selecting the parameter lambda using the “glmnet” package in R language v3.6 (available from URL: https://www.r-project.org) (48).
The radiomics signature formula was calculated for each patient by a linear combination of the selected features weighted by the respective LASSO coefficients. The logistic regression was used to identify the discriminative clinical predictors. A clinical model was established using the multivariate logistic regression with the Akaike’s Information Criterion (AIC) as the stopping rule (49). A radiomics nomogram for differentiating benign and malignant lesions was constructed incorporating the radiomics signature and the most important clinical factors using the “rms” package in R v.3.6.
The Mann-Whitney U-test, t-test, Chi-Square test, and Shapiro-Wilk test were performed on continuous and discrete variables, respectively. All hypothesis tests were two-sided. The ROC curve analysis was performed to evaluate the diagnostic performance of each model, with the area under the ROC curve (AUC), accuracy, sensitivity, and specificity calculated as comparison metrics. The optimal cutoff value was obtained on the ROC curve with the maximum Youden index (50). ROC curves were evaluated with the DeLong test using the “pROC” package in R. Calibration curves were plotted to assess the calibration of the model-predicted results with truth values. The decision curve analysis (DCA) (51) was performed using the “rmda” package to assess the potential clinical usefulness of the models.
The clinical characteristics of the patients were statistically analyzed and shown in Table 1. The age and menstruation status were significantly different between the benign and malignant groups (P < 0.05). No statistical difference was observed in the types of family history and history of biopsy. A clinical model was built integrating the age and menstruation status for detecting malignant lesions.
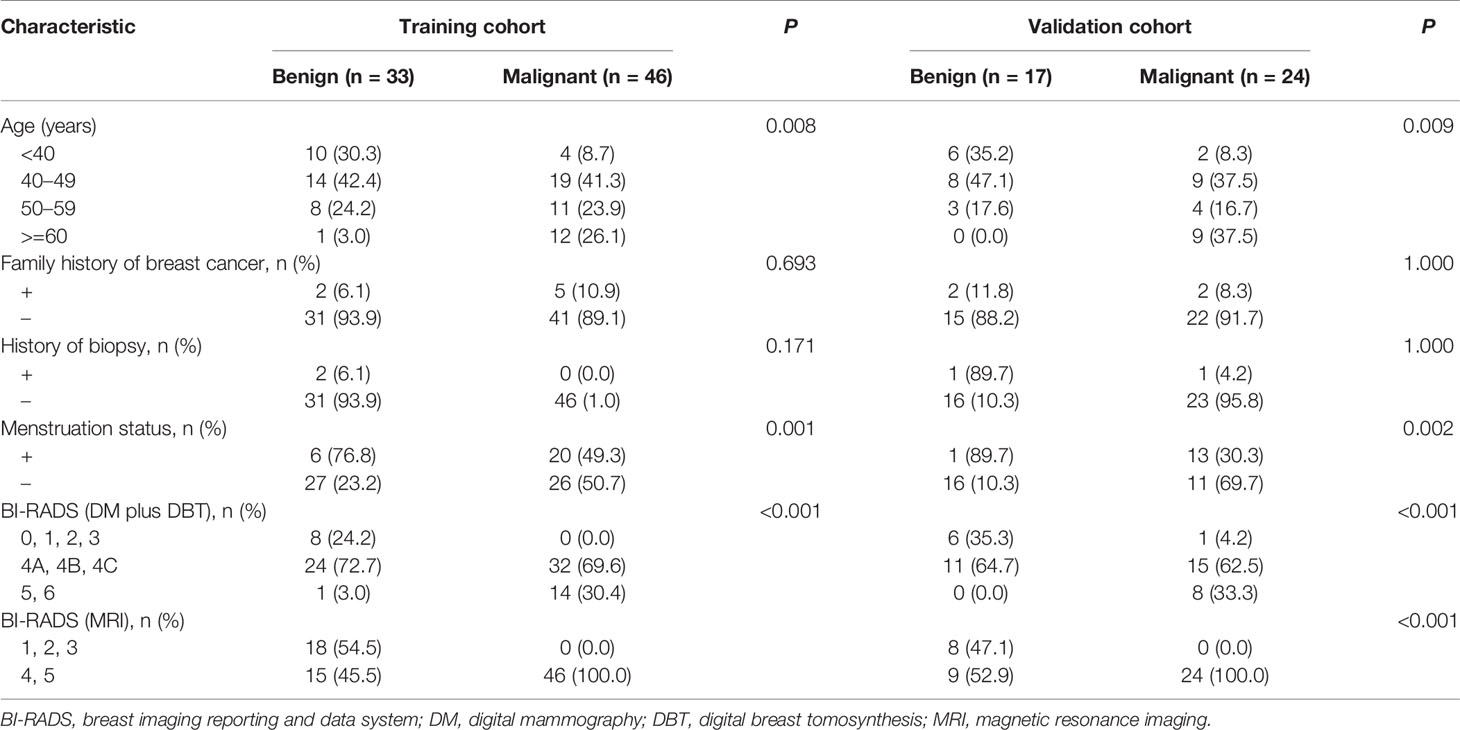
Table 1 >Statistical analysis results of clinical characteristics.
Diagnostic performance of the radiomics signature derived from the DM, DBT, DCE, and DWI individually and in combination were assessed (Table 2). Figure 1 shows the ROC curves of each radiomics signature. The results indicated that the DCE generated the highest AUCs and sensitivities among the four modalities, but had relatively low specificities. The diagnostic performance of DWI plus DCE was significantly higher than DM plus DBT in terms of sensitivity. Besides, the DWI plus DCE yielded the highest positive predictive values (PPV) and the lowest misdiagnosis rates.
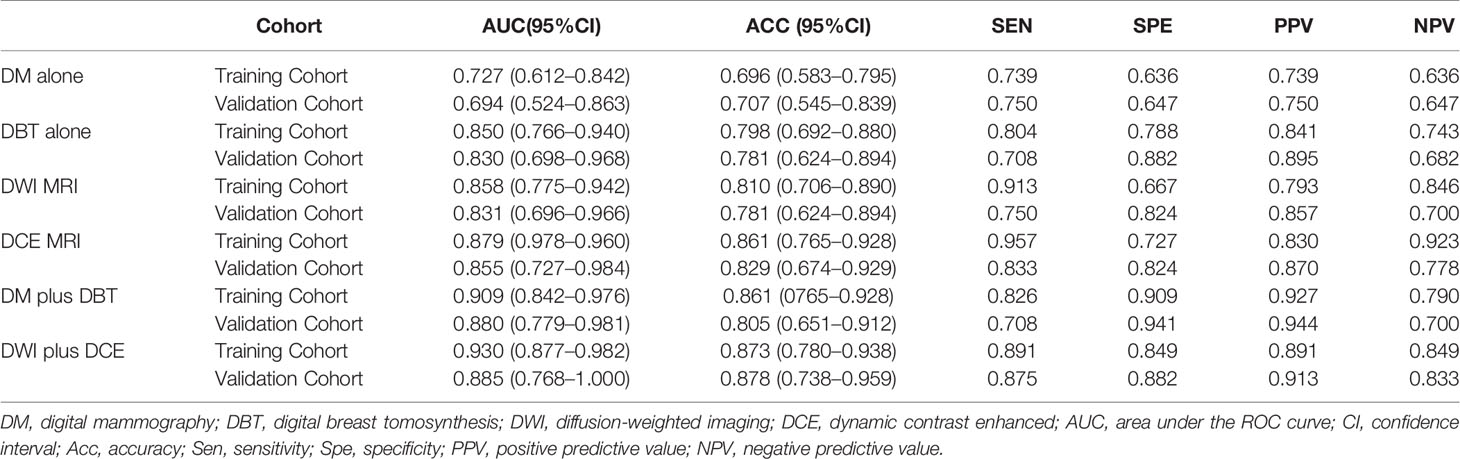
Table 2 Diagnostic performance of each modality used alone and in combination.
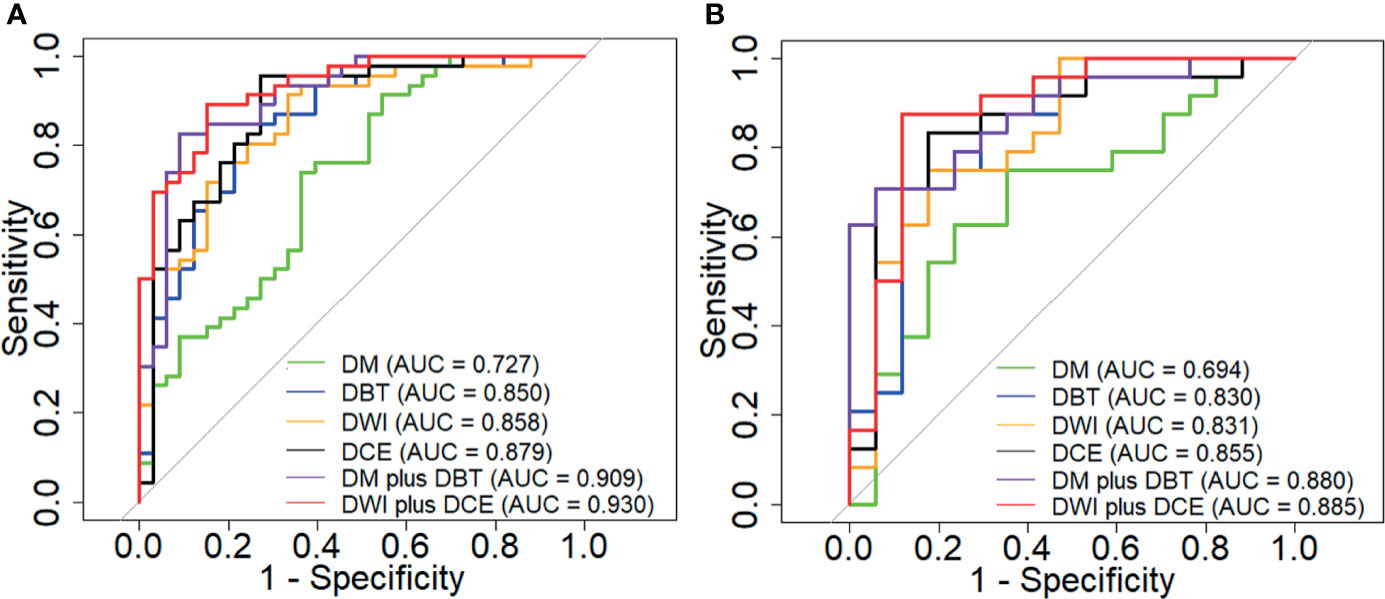
Figure 1 ROC curves of the DM, DBT, DCE MRI and DWI MRI used individually and in comibination in the training (A) and validation (B) cohort.
Radiomics features selected from the four modalities were combined and further selected to generate a combined feature set consisting of seven features, three from DBT, two from DCE, and two from DWI. Diagnostic performance of each feature was evaluated and is listed in Table 3. The combined radiomics signature (combined Rad score, Supplementary S3.) integrating the seven features and their corresponding LASSO coefficients was built and shown as follows:
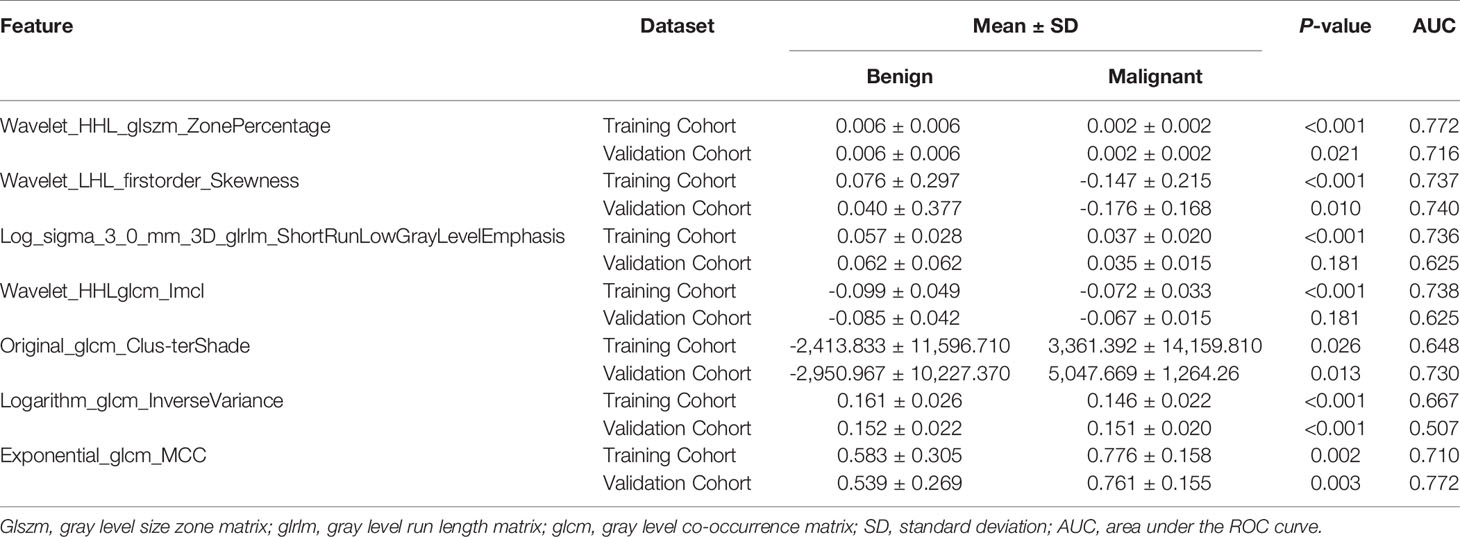
Table 3 Diagnostic performance of the selected features for the diagnosis of breast lesions.
A radiomics nomogram was constructed integrating the combined Rad score with the age and menstruation status (Figure 2A). The risk of being a malignant lesion can be read off the scale in the last row by vertically drawing a line from the total points. Calibration curves are shown in Figures 2B, C, indicating acceptable agreements between the nomogram-estimated probabilities and actual outcomes of the lesions. The 45-degree blue line and the red dotted line represent an ideal diagnosis and the performance of our nomogram, respectively. As the red dotted line is closer to the blue line represents a better diagnostic performance. Figures 2D, E show that the nomogram exhibited better diagnostic capabilities compared with the combined Rad score or the clinical model alone (AUCs in the training cohort, nomogram vs. combined Rad score vs. clinical model, 0.975 vs. 0.964 vs. 0.782; AUCs in the validation cohort, nomogram vs. combined Rad score vs. clinical model, 0.978 vs. 0.983 vs. 0.690). The diagnostic performance of the combined Rad score, clinical model and nomogram are shown in Table 4.
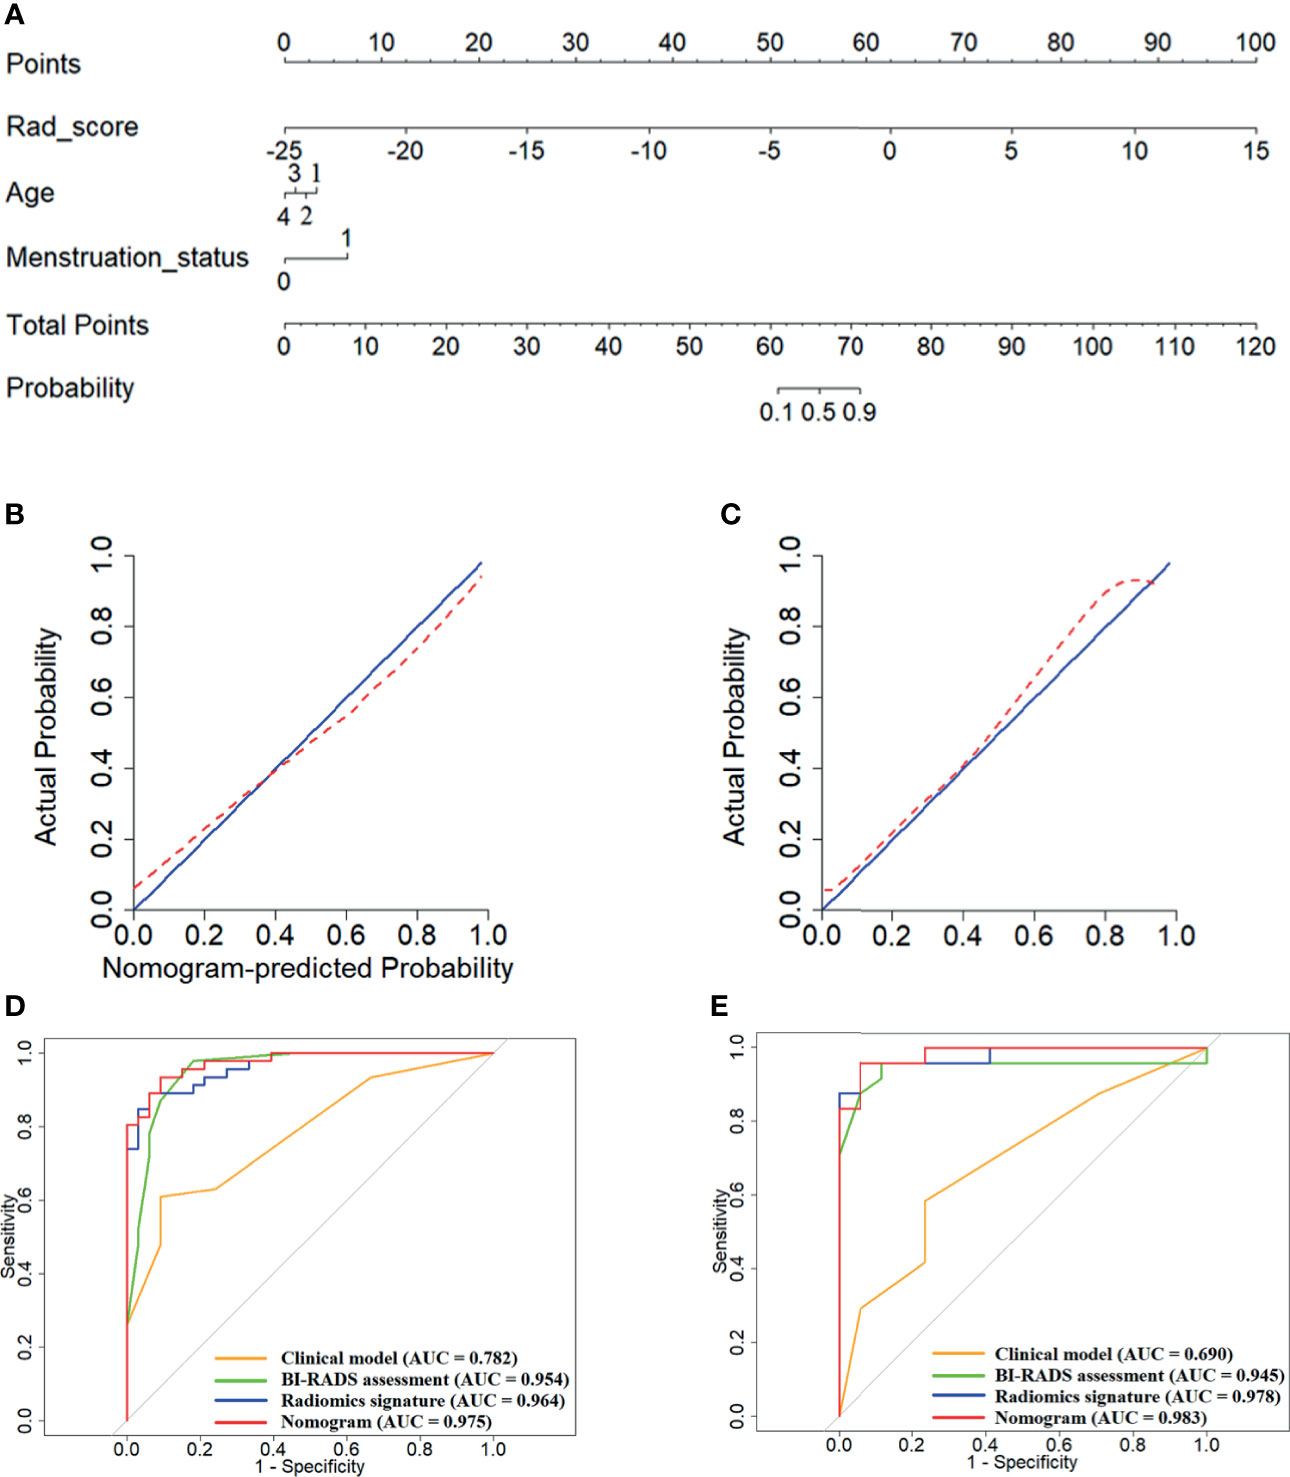
Figure 2 Development and validation of the nomogram model integrating the combined Rad score, age and menstruation status. (A) Construction of the nomogram; (B, C), Calibration curves of the nomogram in the training (B) and validation (C) cohort; (D, E), ROC curves of the nomogram, combined Rad score and clinical model in the training (D) and validation (E) cohort.
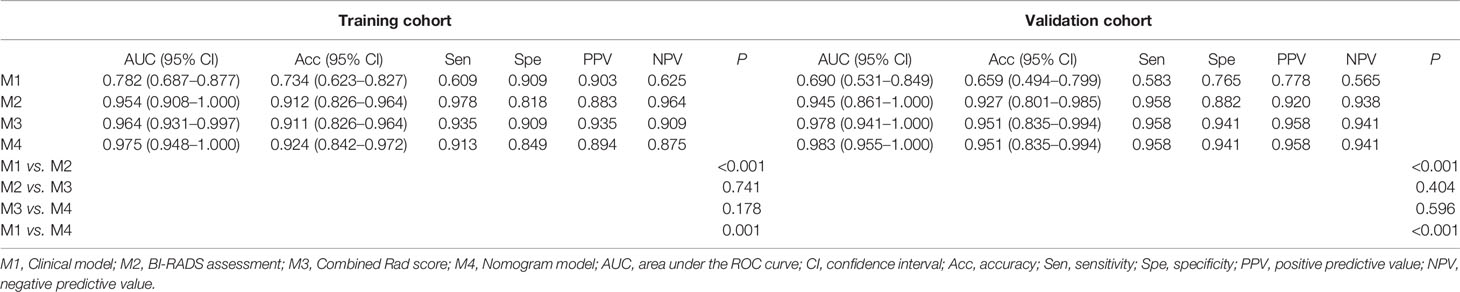
Table 4 Comparison of the clinical model, BI-RADS assessment, combined Rad score, and nomogram.
Figure 3 shows the results of the decision curve analysis for each model. The nomogram exhibited a greater net benefit compared with the combined Rad score or the clinical model. When the threshold probability of the patient was between 0.44 and 0.68, or over 0.78, a greater benefit can be obtained by using the nomogram, indicating a good potential in clinical applications.

Figure 3 Showed results of the decision curve analysis for each model. The nomogram exhibited greater net benefit compared with the combined Rad score or the clinical model. When the threshold probability of the patient was between 0.44 and 0.68, or over 0.78, greater benefit can be obtained by using the nomogram, indicating good potential in clinical applications.
Prior to this study, there have been researches evaluating the diagnostic capabilities of DM (32, 38, 39), DBT (40, 41), MRI (42–44) separately for detecting breast cancer, all based on subjective visual examinations, and lack of direct and quantitative comparisons of different modalities. On the contrary, this study performed comprehensive radiomics analyses to quantitatively assess the diagnostic performance of different modalities separately and in combination. We found that the radiomics signature derived from DM always showed the worst diagnostic performance in terms of AUC, sensitivity, and specificity compared with the other individual modalities. This may be explainable since the DM only obtains one image, which may lead to overlapping glands, and, hence, is not sufficient to analyze the distribution of dense and adipose tissues (52). The result was in accordance with previous studies that also showed the DM-based diagnosis often leads to high false negative and false positive rates due to the fact that the lesions may be obscured or hidden by the overlapping fibroglandular tissues (5, 53). The addition of DBT to DM can significantly improve the diagnostic AUC, accuracy, specificity, PPV, and NPV, and generate a similar sensitivity compared with the DM alone. This was in line with some previous reports that also indicated that breast DBT can lead to improvements in AUC and specificity by visual assessments (54, 55). This may be because the DBT can improve the lesion visibility by providing thin section tomographic images and reducing the overlap of breast tissues, and, hence, represents a clearer edge, shape, and structure of the lesion. The addition of DBT to DM did not improve the diagnostic sensitivity by visual assessments compared with DM alone as reported in an earlier study (14). The discordance may be because they performed the research with a cancer-only population. The DCE plus DWI yielded higher AUCs and sensitivities, but lower specificities than the DM plus DBT. The result was partially in line with a previous literature that also indicated that the MRI was superior to the X-ray technology in the diagnostic AUC and sensitivity, but weaker in the specificity (14, 56).
The DBT showed a similar diagnostic AUC, slightly increased specificity, and lower sensitivity compared with DCE or DWI, which was in line with a previous research that also demonstrated the inferiority of breast DBT in the sensitivity compared with MRI by visual examinations (14, 53, 57). This may be explained since the DCE can reflect the neoangiogenesis within the tumor that is associated with the growth and progression of the malignant tumor (58). While, the DWI can represent tissue microenvironments and membrane integrities through depicting the diffusivity of the tissues (59). Therefore, the MRI tends to be more sensitive than DBT or DM on tumors with higher malignant degrees. The DCE yielded higher AUC, accuracy, sensitivity, and specificity compared with DWI, which may be due to the higher resolution and the use of a contrast agent in DCE (44). We found that the addition of DBT to MRI (DBT plus DCE plus DWI) can increase the AUC and sensitivity compared with MRI alone (DCE plus DWI). This indicated that the DBT and MRI are complementary, their combination can significantly improve the predictive capabilities. While, our results were inconsistent with a previous report that showed no improvement in the diagnostic sensitivity by combing DM, DBT, DCE, and ultrasound (60). Since they involved ultrasound, direct comparisons between our study and their work was impossible.
In the clinical practice, although integrating MRI with X-rays allows the radiologists to give judgments more easily, the diagnosis still relies on subjective experiences. We selected a total of seven quantitative features as the most important predictors, three from DBT, two from DCE, and two from DWI. There were one original and six transformed features. The developed combined Rad score integrating these features significantly improved the diagnostic performance compared with any modality alone. The Original_glcm_ClusterShade feature measures the skewness and the uniformity of the gray level co-occurrence matrix within the tumor. A higher value of this feature implies a greater asymmetry about the mean and a greater heterogeneity of the lesion. We found that this feature was bigger in the malignant lesions than in the benign lesions, which suggests that a tumor with more asymmetry and complexity in the tumor texture tends to be malignant. Among the six transformed features, one belonged to the first-order and five belonged to the textural feature class. The first-order feature describes the distribution of voxel intensities in the image region. While, the textural feature quantifies the complexity of a tumor and the thickness of the texture. Our findings suggest that the tumor heterogeneity may be closely related to breast cancer, since textural features in the medical image often reflect tumor heterogeneities. The results were partially in line with previous studies that also highlighted the correlations between the textural features and breast cancer (61, 62). Our findings may explain that the proposed combined Rad score can significantly improve the diagnostic performance with regard to AUC and sensitivity than visual assessments, since most of the identified features (6 of 7) were derived from the transformed images that were generated by filtering the original images with various filters, and, thus, can hardly be understood by human.
A clinical model was built integrating age and menstruation status, and showed a lower AUC, sensitivity, and specificity than the combined Rad score. The nomogram incorporating the combined Rad score with the age and menstruation status achieved the best overall diagnostic performance compared with the combined Rad score, clinical model, and BI-RADS assessment. Decision curves demonstrated a better clinical usefulness of the nomogram with more net benefits across the majority of the range of threshold probabilities. Therefore, we suggest that our nomogram may be considered as an effective tool that can assist in decision making for the diagnosis of breast cancer. To use our nomogram, radiologists need to manually segment lesions on the DBT and MRI images for each patient, then calculate the probability of being benign or malignant. After that, clinicians can incorporate the nomogram-predicted probabilities with other clinical information to give a comprehensive decision on further examinations and treatments.
This study has limitations. First, this retrospective study had a relatively small sample size, which may cause inherent bias. Second, all data were obtained from a single hospital. Further multi-center trials are warranted to confirm the present findings. Third, our radiomic methods rely on manual segmentations of the ROIs, which were subjective and time-consuming. Future studies are needed to explore deep learning-based automatic segmentation methods on breast data.
Our results showed that the DBT performed similar to DCE and DWI in terms of AUC and sensitivity, but better in specificity for detecting malignant lesions. The DBT plus DM can provide a lower AUC and sensitivity, but a higher specificity compared with DCE plus DWI. The proposed nomogram achieved the best diagnostic performance, and may help clinicians make precise decisions regarding treatments.
The original contributions presented in the study are included in the article/Supplementary Material. Further inquiries can be directed to the corresponding authors.
All analyses of human data conducted in this study were reviewed and approved by the Institutional Review Board of the Cancer Hospital of China Medical University and in accordance with the ethical standards of the institutional and/or national research committee. Written informed consent for participation was not required for this study in accordance with the national legislation and the institutional requirements.
XJ and SN contributed to the study concepts and manuscript preparation. SN and XW contributed to the study design. NZ and GL contributed to the data acquisition. SN and NZ contributed to the quality control of the data and algorithms. XJ and XW contributed to the data analysis and interpretation. YL and E-NC contributed to the statistical analysis. XJ, YD and YK contributed to the manuscript review. All authors contributed to the article and approved the submitted version.
The study was funded by the Key Program of Ministry of Science and Technology of China (2017YFC1309100), Climbing Fund of National Cancer Center (NCC201806B011), Shenyang Municipal Science and Technology Project (F16-206-9-23), National Natural Science Foundation of China (81872363), Support program of youth science and technology innovation talents of Shenyang City (RC180269), Major Technology Plan Project of Shenyang (17-230-9-07), Supporting Fund for Big data in Health Care (HMB201903101), Special foundation for the central government guides the development of local science and technology of Liaoning Province (2018416029), China National Natural Science Foundation (31770147), and Medical-Engineering Joint Fund for Cancer Hospital of China Medical University and Dalian University of technology (LD202029).
The authors declare that the research was conducted in the absence of any commercial or financial relationships that could be construed as a potential conflict of interest.
All claims expressed in this article are solely those of the authors and do not necessarily represent those of their affiliated organizations, or those of the publisher, the editors and the reviewers. Any product that may be evaluated in this article, or claim that may be made by its manufacturer, is not guaranteed or endorsed by the publisher.
The Supplementary Material for this article can be found online at: https://www.frontiersin.org/articles/10.3389/fonc.2021.725922/full#supplementary-material
1. McGuire A, Brown JA, Malone C, McLaughlin R, Kerin MJ. Effects of Age on the Detection and Management of Breast Cancer. Cancers (Basel) (2015) 7:908–29. doi: 10.3390/cancers7020815
2. Valdora F, Houssami N, Rossi F, Calabrese M, Tagliafico AS. Rapid Review: Radiomics and Breast Cancer. Breast Cancer Res Treat (2018) 169:217–29. doi: 10.1007/s10549-018-4675-4
3. Xie WY, Li YS, Ma YD. Breast Mass Classification in Digital Mammography Based on Extreme Learning Machine. Neurocomputing (2016) 173:930–41. doi: 10.1016/j.neucom.2015.08.048
4. Michell MJ. Breast Screening Review–A Radiologist’s Perspective. Br J Radiol (2012) 85:845–7. doi: 10.1259/bjr/21332901
5. Fischer U, Baum F, Obenauer S, Luftner-Nagel S, von Heyden D, Vosshenrich R, et al. Comparative Study in Patients With Microcalcifications: Full-Field Digital Mammography vs Screen-Film Mammography. Eur Radiol (2002) 12:2679–83. doi: 10.1007/s00330-002-1354-x
6. Niklason LT, Kopans DB, Hamberg LM. Digital Breast Imaging: Tomosynthesis and Digital Subtraction Mammography. Breast Dis (1998) 10:151–64. doi: 10.3233/BD-1998-103-415
7. Kopans DB. Digital Breast Tomosynthesis from Concept to Clinical Care. AJR Am J Roentgenol (2014) 202:299–308. doi: 10.2214/AJR.13.11520
8. Gilbert FJ, Tucker L, Young KC. Digital Breast Tomosynthesis (DBT): A Review of the Evidence for Use as a Screening Tool. Clin Radiol (2016) 71:141–50. doi: 10.1016/j.crad.2015.11.008
9. Orel SG, Schnall MD. MR Imaging of the Breast for the Detection, Diagnosis, and Staging of Breast Cancer. Radiology (2001) 220:13–30. doi: 10.1148/radiology.220.1.r01jl3113
10. Fischer U, Kopka L, Grabbe E. Breast Carcinoma: Effect of Preoperative Contrast-Enhanced MR Imaging on the Therapeutic Approach. Radiology (1999) 213:881–8. doi: 10.1148/radiology.213.3.r99dc01881
11. Friedewald SM, Rafferty EA, Rose SL, Durand MA, Plecha DM, Greenberg JS, et al. Breast Cancer Screening Using Tomosynthesis in Combination With Digital Mammography. JAMA (2014) 311:2499–507. doi: 10.1001/jama.2014.6095
12. Lee CI, Cevik M, Alagoz O, Sprague BL, Tosteson AN, Miglioretti DL, et al. Comparative Effectiveness of Combined Digital Mammography and Tomosynthesis Screening for Women With Dense Breasts. Radiology (2015) 274:772–80. doi: 10.1148/radiol.14141237
13. Tang W, Hu FX, Zhu H, Wang QF, Gu YJ, Peng WJ. Digital Breast Tomosynthesis Plus Mammography, Magnetic Resonance Imaging Plus Mammography and Mammography Alone: A Comparison of Diagnostic Performance in Symptomatic Women. Clin Hemorheol Microcirc (2017) 66:105–16. doi: 10.3233/CH-16242
14. Kim WH, Chang JM, Moon HG, Yi A, Koo HR, Gweon HM, et al. Comparison of the Diagnostic Performance of Digital Breast Tomosynthesis and Magnetic Resonance Imaging Added to Digital Mammography in Women With Known Breast Cancers. Eur Radiol (2016) 26:1556–64. doi: 10.1007/s00330-015-3998-3
15. Aerts HJ, Velazquez ER, Leijenaar RT, Parmar C, Grossmann P, Carvalho S, et al. Decoding Tumour Phenotype by Noninvasive Imaging Using a Quantitative Radiomics Approach. Nat Commun (2014) 5:4006. doi: 10.1038/ncomms5006
16. Brem RF. Clinical Versus Research Approach to Breast Cancer Detection With CAD: Where Are We Now? AJR Am J Roentgenol (2007) 188:234–5. doi: 10.2214/AJR.06.1449
17. Zhou M, Scott J, Chaudhury B. Radiomics in Brain Tumor: Image Assessment, Quantitative Feature Descriptors, and Machine-Learning Approaches. AJNR Am J Neuroradiol (2017) 39:208–16. doi: 10.3174/ajnr.A5391
18. Parmar C, Grossmann P, Bussink J, Lambin P, Aerts HJWL. Machine Learning Methods for Quantitative Radiomic Biomarkers. Sci Rep (2015) 5:13087. doi: 10.1038/srep13087
19. Chai R, Ma H, Xu M, Arefan D, Cui X, Liu Y, et al. Differentiating Axillary Lymph Node Metastasis in Invasive Breast Cancer Patients: A Comparison of Radiomic Signatures From Multiparametric Breast MR Sequences. J Magn Reson Imaging (2019) 50:1125–32. doi: 10.1002/jmri.26701
20. Cui X, Wang N, Zhao Y, Chen S, Li S, Xu M, et al. Preoperative Prediction of Axillary Lymph Node Metastasis in Breast Cancer Using Radiomics Features of DCE-MRI. Sci Rep (2019) 9:2240. doi: 10.1038/s41598-019-38502-0
21. Dong Y, Feng Q, Yang W, Lu Z, Deng C, Zhang L, et al. Preoperative Prediction of Sentinel Lymph Node Metastasis in Breast Cancer Based on Radiomics of T2-Weighted Fat-Suppression and Diffusion-Weighted MRI. Eur Radiol (2018) 28:582–91. doi: 10.1007/s00330-017-5005-7
22. Han L, Zhu Y, Liu Z, Yu T, He C, Jiang W, et al. Radiomic Nomogram for Prediction of Axillary Lymph Node Metastasis in Breast Cancer. Eur Radiol (2019) 29:3820–9. doi: 10.1007/s00330-018-5981-2
23. Liu C, Ding J, Spuhler K, Gao Y, Serrano Sosa M, Moriarty M, et al. Preoperative Prediction of Sentinel Lymph Node Metastasis in Breast Cancer by Radiomic Signatures From Dynamic Contrast-Enhanced MRI. J Magn Reson Imaging (2019) 49:131–40. doi: 10.1002/jmri.26224
24. Xie T, Zhao Q, Fu C, Bai Q, Zhou X, Li L, et al. Differentiation of Triple-Negative Breast Cancer From Other Subtypes Through Whole-Tumor Histogram Analysis on Multiparametric MR Imaging. Eur Radiol (2019) 29:2535–44. doi: 10.1007/s00330-018-5804-5
25. Holli-Helenius K, Salminen A, Rinta-Kiikka I, Koskivuo I, Brück N, Boström P, et al. MRI Texture Analysis in Differentiating Luminal A and Luminal B Breast Cancer Molecular Subtypes - A Feasibility Study. BMC Med Imag (2017) 17:69. doi: 10.1186/s12880-017-0239-z
26. Fan M, Li H, Wang S, Zheng B, Zhang J, Li L. Radiomic Analysis Reveals DCE-MRI Features for Prediction of Molecular Subtypes of Breast Cancer. PloS One (2017) 12:e0171683. doi: 10.1371/journal.pone.0171683
27. Fan M, Zhang P, Wang Y, Peng W, Wang S, Gao X, et al. Radiomic Analysis of Imaging Heterogeneity in Tumours and the Surrounding Parenchyma Based on Unsupervised Decomposition of DCE-MRI for Predicting Molecular Subtypes of Breast Cancer. Eur Radiol (2019) 29:4456–67. doi: 10.1007/s00330-018-5891-3
28. Grimm LJ, Zhang J, Mazurowski MA. Computational Approach to Radiogenomics of Breast Cancer: Luminal A and Luminal B Molecular Subtypes Are Associated With Imaging Features on Routine Breast MRI Extracted Using Computer Vision Algorithms. J Magn Reson Imaging (2015) 42:902–7. doi: 10.1002/jmri.24879
29. Huang Y, Cheng Z, Huang X, Liang C, Liang C, Liu Z. Preoperative Evaluation of Histologic Grade in Invasive Breast Cancer With T2W-MRI Based Radiomics Signature. Zhong Nan Da Xue Xue Bao Yi Xue Ban (2019) 44:285–9. doi: 10.11817/j.issn.1672-7347.2019.03.009
30. Fan M, Yuan W, Zhao W, Xu M, Wang S, Gao X, et al. Joint Prediction of Breast Cancer Histological Grade and Ki-67 Expression Level Based on DCE-MRI and DWI Radiomics. IEEE J Biomed Health Inf (2019) PP(99):1–1. doi: 10.1109/JBHI.2019.2956351
31. Yuan G, Liu Y, Huang W, Hu B. Differentiating Grade in Breast Invasive Ductal Carcinoma Using Texture Analysis of MRI. Comput Math Methods Med (2020) 2020:1–14. doi: 10.1155/2020/6913418
32. Ma W, Zhao Y, Ji Y, Guo X, Jian X, Liu P, et al. Breast Cancer Molecular Subtype Prediction by Mammographic Radiomic Features. Acad Radiol (2019) 26:196–201. doi: 10.1016/j.acra.2018.01.023
33. Xiong Q, Zhou X, Liu Z, Lei C, Yang C, Yang M, et al. Multiparametric MRI-Based Radiomics Analysis for Prediction of Breast Cancers Insensitive to Neoadjuvant Chemotherapy. Clin Transl Oncol (2020) 22:50–9. doi: 10.1007/s12094-019-02109-8
34. Liu Z, Li Z, Qu J, Zhang R, Zhou X, Li L, et al. Radiomics of Multi-Parametric MRI for Pretreatment Prediction of Pathological Complete Response to Neoadjuvant Chemotherapy in Breast Cancer: A Multicenter Study. Clin Cancer Res (2019) 25:3538–47. doi: 10.1158/1078-0432.CCR-18-3190
35. Braman NM, Etesami M, Prasanna P, Dubchuk C, Gilmore H, Tiwari P, et al. Intratumoral and Peritumoral Radiomics for the Pretreatment Prediction of Pathological Complete Response to Neoadjuvant Chemotherapy Based on Breast DCE-MRI. Breast Cancer Res (2017) 19:57. doi: 10.1186/s13058-017-0846-1
36. Cain EH, Saha A, Harowicz MR, Marks JR, Marcom PK, Mazurowski MA. Multivariate Machine Learning Models for Prediction of Pathologic Response to Neoadjuvant Therapy in Breast Cancer Using MRI Features: A Study Using an Independent Validation Set. Breast Cancer Res Treat (2019) 173:455–63. doi: 10.1007/s10549-018-4990-9
37. Chamming’s F, Ueno Y, Ferré R, Kao E, Jannot AS, Chong J, et al. Features From Computerized Texture Analysis of Breast Cancers at Pretreatment MR Imaging Are Associated With Response to Neoadjuvant Chemotherapy. Radiology (2018) 286:412–20. doi: 10.1148/radiol.2017170143
38. Mavroforakis M, Georgiou H, Dimitropoulos N, Cavouras D, Theodoridis S. Significance Analysis of Qualitative Mammographic Features, Using Linear Classifiers, Neural Networks and Support Vector Machines. Eur J Radiol (2005) 54:80–9. doi: 10.1016/j.ejrad.2004.12.015
39. Verma B, Mcleod P, Klevansky A. Classification of Benign and Malignant Patterns in Digital Mammograms for the Diagnosis of Breast Cancer. Expert Syst Appl (2010) 37:3344–51. doi: 10.1016/j.eswa.2009.10.016
40. Tagliafico AS, Valdora F, Mariscotti G, Durando M, Nori J, La Forgia D, et al. An Exploratory Radiomics Analysis on Digital Breast Tomosynthesis in Women With Mammographically Negative Dense Breasts. Breast (2018) 40:92–6. doi: 10.1016/j.breast.2018.04.016
41. Sakai A, Onishi Y, Matsui M, Adachi H, Teramoto A, Saito K, et al. A Method for the Automated Classification of Benign and Malignant Masses on Digital Breast Tomosynthesis Images Using Machine Learning and Radiomic Features. Radiol Phys Technol (2020) 13:27–36. doi: 10.1007/s12194-019-00543-5
42. Bickelhaupt S, Paech D, Kickingereder P, Steudle F, Lederer W, Daniel H, et al. Prediction of Malignancy by a Radiomic Signature From Contrast Agent-Free Diffusion MRI in Suspicious Breast Lesions Found on Screening Mammography. J Magn Reson Imaging (2017) 46:604–16. doi: 10.1002/jmri.25606
43. Granzier RWY, Verbakel NMH, Ibrahim A, van Timmeren JE, van Nijnatten TJA, Leijenaar RTH, et al. MRI-Based Radiomics in Breast Cancer: Feature Robustness With Respect to Inter-Observer Segmentation Variability. Sci Rep (2020) 10:14163. doi: 10.1038/s41598-020-70940-z
44. Hu Q, Whitney HM, Giger ML. Radiomics Methodology for Breast Cancer Diagnosis Using Multiparametric Magnetic Resonance Imaging. J Med Imaging (Bellingham) (2020) 7:044502. doi: 10.1117/1.JMI.7.4.044502
45. Zhou H, Dong D, Chen B, Fang M, Cheng Y, Gan Y, et al. Diagnosis of Distant Metastasis of Lung Cancer: Based on Clinical and Radiomic Features. Transl Oncol (2017) 11:31–6. doi: 10.1016/j.tranon.2017.10.010
46. van Griethuysen JJM, Fedorov A, Parmar C, Hosny A, Aucoin N, Narayan V, et al. Computational Radiomics System to Decode the Radiographic Phenotype. Cancer Res (2017) 77:e104–7. doi: 10.1158/0008-5472.CAN-17-0339
47. Leijenaar RT, Carvalho S, Velazquez ER, van Elmpt WJ, Parmar C, Hoekstra OS, et al. Stability of FDG-PET Radiomics Features: An Integrated Analysis of Test-Retest and Inter-Observer Variability. Acta Oncol (2013) 52:1391–7. doi: 10.3109/0284186X.2013.812798
48. Sauerbrei W, Royston P, Binder H. Selection of Important Variables and Determination of Functional Form for Continuous Predictors in Multivariable Model Building. Stat Med (2007) 26:5512–28. doi: 10.1002/sim.3148
49. Tibshirani R. Regression Shrinkage and Selection via the Lasso. J R Stat Soc Ser B (Methodol) (1996) 73:273–82. doi: 10.1111/j.2517-6161.1996.tb02080.x
50. Ruopp MD, Perkins NJ, Whitcomb BW, Schisterman EF. Youden Index and Optimal Cut-Point Estimated From Observations Affected by a Lower Limit of Detection. Biom J (2008) 50:419–30. doi: 10.1002/bimj.200710415
51. Vickers AJ, Elkin EB. Decision Curve Analysis: A Novel Method for Evaluating Prediction Models. Med Decis Making (2006) 26:565–74. doi: 10.1177/0272989X06295361
52. Kerlikowske K, Hubbard RA, Miglioretti DL, Geller BM, Yankaskas BC, Lehman CD, et al. Comparative Effectiveness of Digital Versus Film-Screen Mammography in Community Practice in the United States: A Cohort Study. Ann Intern Med (2011) 155:493–502. doi: 10.7326/0003-4819-155-8-201110180-00005
53. Seely JM, Alhassan T. Screening for Breast Cancer in 2018-What Should We be Doing Today? Curr Oncol (2018) 25:S115–24. doi: 10.3747/co.25.3770
54. Haas BM, Kalra V, Geisel J, Raghu M, Durand M, Philpotts LE. Comparison of Tomosynthesis Plus Digital Mammography and Digital Mammography Alone for Breast Cancer Screening. Radiology (2013) 269:694–700. doi: 10.1148/radiol.13130307
55. Rafferty EA, Park JM, Philpotts LE, Poplack SP, Sumkin JH, Halpern EF, et al. Assessing Radiologist Performance Using Combined Digital Mammography and Breast Tomosynthesis Compared With Digital Mammography Alone: Results of a Multicenter, Multireader Trial. Radiology (2013) 266:104–13. doi: 10.1148/radiol.12120674
56. Girometti R, Tomkova L, Cereser L, Zuiani C. Breast Cancer Staging: Combined Digital Breast Tomosynthesis and Automated Breast Ultrasound Versus Magnetic Resonance Imaging. Eur J Radiol (2018) 107:188–95. doi: 10.1016/j.ejrad.2018.09.002
57. Berg WA, Zhang Z, Lehrer D, Jong RA, Pisano ED, Barr RG, et al. Detection of Breast Cancer With Addition of Annual Screening Ultrasound or a Single Screening MRI to Mammography in Women With Elevated Breast Cancer Risk. JAMA (2012) 307:1394–404. doi: 10.1001/jama.2012.388
58. Clauser P, Carbonaro LA, Pancot M, Girometti R, Bazzocchi M, Zuiani C, et al. Additional Findings at Preoperative Breast MRI: The Value of Second-Look Digital Breast Tomosynthesis. Eur Radiol (2015) 25:2830–9. doi: 10.1007/s00330-015-3720-5
59. Kuhl CK, Mielcareck P, Klaschik S, Leutner C, Wardelmann E, Gieseke J, et al. Dynamic Breast MR Imaging: Are Signal Intensity Time Course Data Useful for Differential Diagnosis of Enhancing Lesions? Radiology (1999) 211:101–10. doi: 10.1148/radiology.211.1.r99ap38101
60. Mariscotti G, Houssami N, Durando M, Bergamasco L, Campanino PP, Ruggieri C, et al. Accuracy of Mammography, Digital Breast Tomosynthesis, Ultrasound and MR Imaging in Preoperative Assessment of Breast Cancer. Anticancer Res (2014) 34:1219–25. doi: 10.1007/s13277-013-1375-x
61. Kontos D, Ikejimba LC, Bakic PR, Troxel AB, Conant EF, Maidment AD. Analysis of Parenchymal Texture With Digital Breast Tomosynthesis: Comparison With Digital Mammography and Implications for Cancer Risk Assessment. Radiology (2011) 261:80–91. doi: 10.1148/radiol.11100966
Keywords: breast, mammography, MRI, radiomics, nomogram
Citation: Niu S, Wang X, Zhao N, Liu G, Kan Y, Dong Y, Cui E-N, Luo Y, Yu T and Jiang X (2021) Radiomic Evaluations of the Diagnostic Performance of DM, DBT, DCE MRI, DWI, and Their Combination for the Diagnosisof Breast Cancer. Front. Oncol. 11:725922. doi: 10.3389/fonc.2021.725922
Received: 16 June 2021; Accepted: 23 August 2021;
Published: 10 September 2021.
Edited by:
Xujiong Ye, University of Lincoln, United KingdomReviewed by:
S Senthil Kumaran, All India Institute of Medical Sciences, IndiaCopyright © 2021 Niu, Wang, Zhao, Liu, Kan, Dong, Cui, Luo, Yu and Jiang. This is an open-access article distributed under the terms of the Creative Commons Attribution License (CC BY). The use, distribution or reproduction in other forums is permitted, provided the original author(s) and the copyright owner(s) are credited and that the original publication in this journal is cited, in accordance with accepted academic practice. No use, distribution or reproduction is permitted which does not comply with these terms.
*Correspondence: Tao Yu, ZHJ5dXRhb0Bob3RtYWlsLmVkdS5jbg==; Xiran Jiang, eHJqaWFuZ0BjbXUuZWR1LmNu
†These authors have contributed equally to this work
Disclaimer: All claims expressed in this article are solely those of the authors and do not necessarily represent those of their affiliated organizations, or those of the publisher, the editors and the reviewers. Any product that may be evaluated in this article or claim that may be made by its manufacturer is not guaranteed or endorsed by the publisher.
Research integrity at Frontiers
Learn more about the work of our research integrity team to safeguard the quality of each article we publish.