 Zhenhui Li1†
 Dafu Zhang1†
 Xiaolin Pang2†
 Shan Yan3†Ming Lei4
 Xianshuo Cheng5Qian Song6
 Le Cai7
 Zhuozhong Wang8,9*
 Dingyun You7*
- 1Department of Radiology, The Third Affiliated Hospital of Kunming Medical University, Yunnan Cancer Hospital, Yunnan Cancer Center, Kunming, China
- 2Department of Radiotherapy, The Sixth Affiliated Hospital of Sun Yat-sen University, Guangzhou, China
- 3Yunnan Key Laboratory of Stem Cell and Regenerative Medicine, Biomedical Engineering Research Center, Kunming Medical University, Kunming, China
- 4Department of Clinical Laboratory Medicine, The Third Affiliated Hospital of Kunming Medical University, Yunnan Cancer Hospital, Yunnan Cancer Center, Kunming, China
- 5Department of Colorectal Surgery, The Third Affiliated Hospital of Kunming Medical University, Yunnan Cancer Hospital, Yunnan Cancer Center, Kunming, China
- 6Cancer Research Institute, The Third Affiliated Hospital of Kunming Medical University, Yunnan Cancer Hospital, Yunnan Cancer Center, Kunming, China
- 7School of Public Health, Kunming Medical University, Kunming, China
- 8The Key Laboratory of Myocardial Ischemia, Harbin Medical University, Ministry of Education, Harbin, China
- 9Cardiology Division, The Second Affiliated Hospital of Harbin Medical University, Harbin, China
Background: Whether elevated postoperative serum carcinoembryonic antigen (CEA) levels are prognostic in patients with stage II colorectal cancer (CRC) remains controversial.
Patients and Methods: Primary and sensitivity analysis populations were obtained from a retrospective, multicenter longitudinal cohort including consecutive patients without neoadjuvant treatment undergoing curative resection for stage I–III CRC. Serum CEA levels before (CEApre-m1) and within 1 (CEApost-m1), 2–3 (CEApost-m2–3), and 4–6 months (CEApost-m4–6) after surgery were obtained, and their associations with recurrence-free survival (RFS) and overall survival (OS) were assessed using Cox regression. Sensitivity and subgroup analyses were performed.
Results: Primary and sensitivity analysis populations included 710 [415 men; age, 54.8 (11.6) years] and 1556 patients [941 men; age, 56.2 (11.8) years], respectively. Recurrence hazard ratios (HRs) in the elevated CEApre-m1, CEApost-m1, CEApost-m2–3, and CEApost-m4–6 groups were 1.30 (95% CI: 0.91–1.85), 1.53 (95% CI: 0.89–2.62), 1.88 (95% CI: 1.08–3.28), and 1.15 (95% CI: 0.91–1.85), respectively. The HRs of the elevated CEApre-m1, CEApost-m1, CEApost-m2–3, and CEApost-m4–6 groups for OS were 1.09 (95% CI: 0.60–1.97), 2.78 (95% CI: 1.34–5.79), 2.81 (95% CI: 1.25–6.30), and 3.30 (95% CI: 1.67–.536), respectively. Adjusted multivariate analyses showed that both in the primary and sensitivity analysis populations, elevated CEApost-m2–3, rather than CEApre-m1, CEApost-m1, and CEApost-m4–6, was an independent risk factor for recurrence, but not for OS. The RFS in the elevated and normal CEApost-m2–3 groups differed significantly among patients with stage II disease [n = 266; HR, 2.89; 95% CI, 1.02–8.24 (primary analysis); n = 612; HR, 2.69; 95% CI, 1.34–5.38 (sensitivity analysis)].
Conclusions: Elevated postoperative CEA levels are prognostic in patients with stage II CRC, with 2–3 months after surgery being the optimal timing for CEA measurement.
Introduction
Colorectal cancer (CRC) is the third leading cause of cancer-related death both in men and women worldwide (1). Tumor relapse is the primary cause of poor prognosis in patients with CRC (2). Predicting the risk of relapse could allow a more targeted approach with respect to the selection of adjuvant therapies and follow-up strategies (e.g., by defining subgroups) for improving overall survival (3).
Carcinoembryonic antigen (CEA) is regarded as an essential indicator of CRC prognosis (4), and the guidelines recommend that serum CEA should be measured preoperatively and postoperatively in patients with CRC (5–9). Recent studies confirm that the preoperative and postoperative serum CEA levels are both associated with CRC outcomes, and elevated postoperative CEA levels are more prognostic than elevated preoperative CEA levels (4, 10–16). Hence, routine measurement of postoperative CEA levels is warranted.
Whether elevated postoperative CEA levels are prognostic in patients with stage II CRC remains controversial (4, 10–13). Some studies report that postoperative CEA levels have a predictive value in patients with stage II CRC (11, 12), while several others have been unable to determine the significance of postoperative CEA levels in such patients (4, 10, 13). A systematic review of published studies (4, 10–13) showed that the time points of postoperative CEA measurement varied across studies. CEA was measured within 4–12 weeks after surgery in some studies (11, 12) and within 1–12 weeks after surgery in several others (4, 10, 13). The difference in the time points of postoperative CEA measurement may be responsible for the inconsistent results, and the optimal timing for postoperative serum CEA measurement is therefore unknown.
In this study, we aimed to examine the association between serum CEA levels at different perioperative time points and CRC outcomes using a retrospective, multicenter longitudinal cohort and to determine the optimal timing for postoperative serum CEA measurement.
Patients and Methods
Ethics Approval and Informed Consent
The ethics committee of each participating hospital approved this multicenter retrospective study. The requirement for informed consent was waived by the board, owing to the study’s retrospective nature. All the patient data in the survey were anonymized. This study followed the Strengthening the Reporting of Observational Studies in Epidemiology (STROBE) reporting guidelines.
Patients
A multicenter retrospective cohort was created. It included all consecutive patients with CRC who did not receive neoadjuvant treatment but underwent curative resection for stage I–III colorectal adenocarcinoma between January 2011 and June 2017 at two hospitals in China. A detailed description of the cohort’s inclusion and exclusion criteria can be found in the Online-Only Supplement. Participants were included in the primary analysis population if preoperative serum CEA data and postoperative serum CEA measurements obtained within 1, 2–3, and 4–6 months after surgery were available. Participants were included in the sensitivity analysis population if postoperative serum CEA measurements obtained within 2–3 months after surgery were available. The study flowchart is shown in Figure 1.
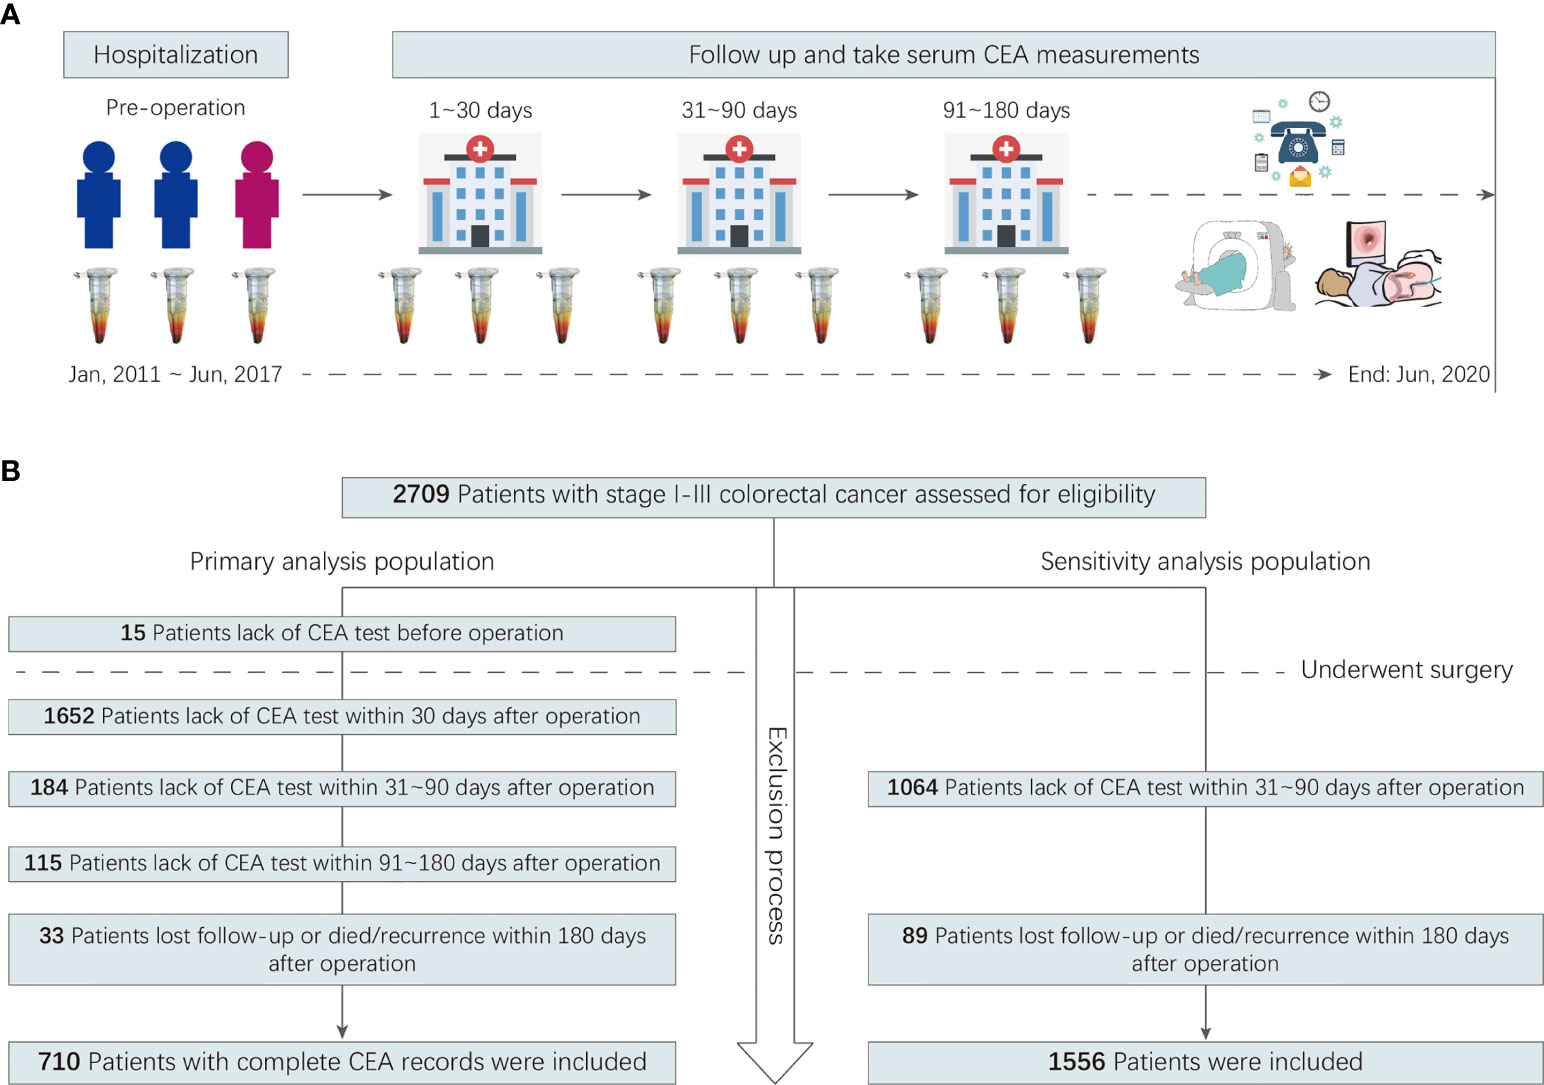
Figure 1 Study flowchart.
Serum CEA Determination
Preoperative serum CEA level (CEApre-m1) was defined as the CEA level obtained closest to the time of surgery (as long as it was obtained within 4 weeks before surgery). Postoperative serum CEA level was defined as the last CEA value obtained 1 (CEApost-m1), 2–3 (CEApost-m2–3), and 4–6 months (CEApost-m4–6) after surgery (a month was defined as 30 natural days). The CEA status was classified into two types as follows: normal (≤5.0 ng/mL) and elevated (>5.0 ng/mL). All CEA measurements were made with a chemiluminescence immunoassay using the Cobas 8000 e602 immunoassay analyzer (Roche Diagnostics, Tokyo, Japan) at Yunnan Cancer Hospital and an Alinity i immunoassay analyzer (Abbott Diagnostics, Chicago, IL, USA) at The Sixth Affiliated Hospital of Sun Yat-sen University, following World Health Organization standard methods (code 73/601) (17).
Surveillance Protocol and Outcome
The surveillance protocol was detailed in our previous study (18). In this study, follow-up ended on June 30, 2020. The primary outcome was recurrence-free survival (RFS). Recurrence included local recurrence and distant metastases, which were confirmed via a biopsy sample, positive imaging findings, or histological analyses. RFS was calculated from the date of surgery until the date of recurrence, death, or last follow-up. Data from patients who died or were lost to follow-up were treated as censored. The secondary outcome was overall survival (OS).
Covariates
Covariates included age, sex, surgical approach (open resection or laparoscopic resection), primary site, tumor differentiation, tumor–node–metastasis (TNM) stage (I-III), lymph node yield (yes or no), mucinous (colloid) type (yes or no), the presence of lymphovascular invasion (yes or no), the presence of perineural invasion (yes or no), and the use of adjuvant chemotherapy (yes or no).
Statistical Analysis
All statistical analyses were performed using R (version 3.6.2). All tests were 2-sided, and P values <.05 indicated statistical significance. The mean, standard deviation (SD), and minimum and maximum values were used to describe results for continuous variables with a normal distribution (including age and body mass index [BMI]); these were further compared using the independent two-sample t-test. The group-specific number and percentage of patients in each category were used to describe results for categorical parameters, which were further compared using the chi-square (χ2) test.
Differences in RFS between normal and elevated CEA groups at different time points were assessed using the Cox proportional hazards regression model. Hazard ratios (HRs) with two-sided 95% confidence intervals (CIs) were calculated for each group. Cumulative event curves were used to demonstrate the 3-year recurrence of patients with CRC, and log-rank tests were utilized to statistically analyze the differences between the two CEA groups.
To test the robustness of the risk estimates, we used two additional sensitivity analyses. (1) Multivariate Cox proportional hazards regression analysis with stepwise variable selection was performed to identify independent risk factors for recurrence and death. Three models were used: model 1 was unadjusted and constructed using CEApre-m1, CEApost-m1, CEApost-m2–3, and CEApost-m4–6; model 2 was a version of model 1 adjusted for demographic variables; and model 3 was a version of model 2 adjusted for clinicopathological variables as well. (2) The statistical analyses used in the primary population were also performed in the expanded sensitivity analysis population.
To test for potential sources of heterogeneity, subgroup analyses were performed after stratification by age, sex, BMI, primary tumor site, tumor differentiation, mucinous (colloid) type, cancer stage, lymph node yield, the presence of lymphovascular invasion, the presence of perineural invasion, tumor deposit, CEApre-m1, and CEApost-m1, with tests for interaction using the Cox regression model. Forest charts of subgroup-stratified analyses were created using the R package “forestplot.”
To distinguish between high-recurrence risk and low-recurrence risk patients, associated with RFS differences, we have used maximally selected rank statistics to determine the potential threshold value of CEA (19).
Results
Patient Characteristics
In total, 710 patients were included in the primary analysis. The number of participants assessed for eligibility and the reasons for exclusion are shown in Figure 1. The 710 patients included 415 men (58.5%), and the mean (SD) age was 54.8 (11.6) years. The mean age and SD of female and male patients were 54.2 ± 11.2 and 55.3 ± 11.8 years, respectively. The 385 patients underwent laparoscopic surgery, 325 underwent open surgery. A total of 699 (98.5%) patients had adjuvant chemotherapy. The median long-term follow-up duration was 49.0 [interquartile range (IQR): 38.7–66.6] months. During the follow-up period, 152 patients (21.4%) showed recurrence, with an incidence density of 24.7 per 1,000 person-years. The characteristics of the primary analysis population are shown in Table 1.
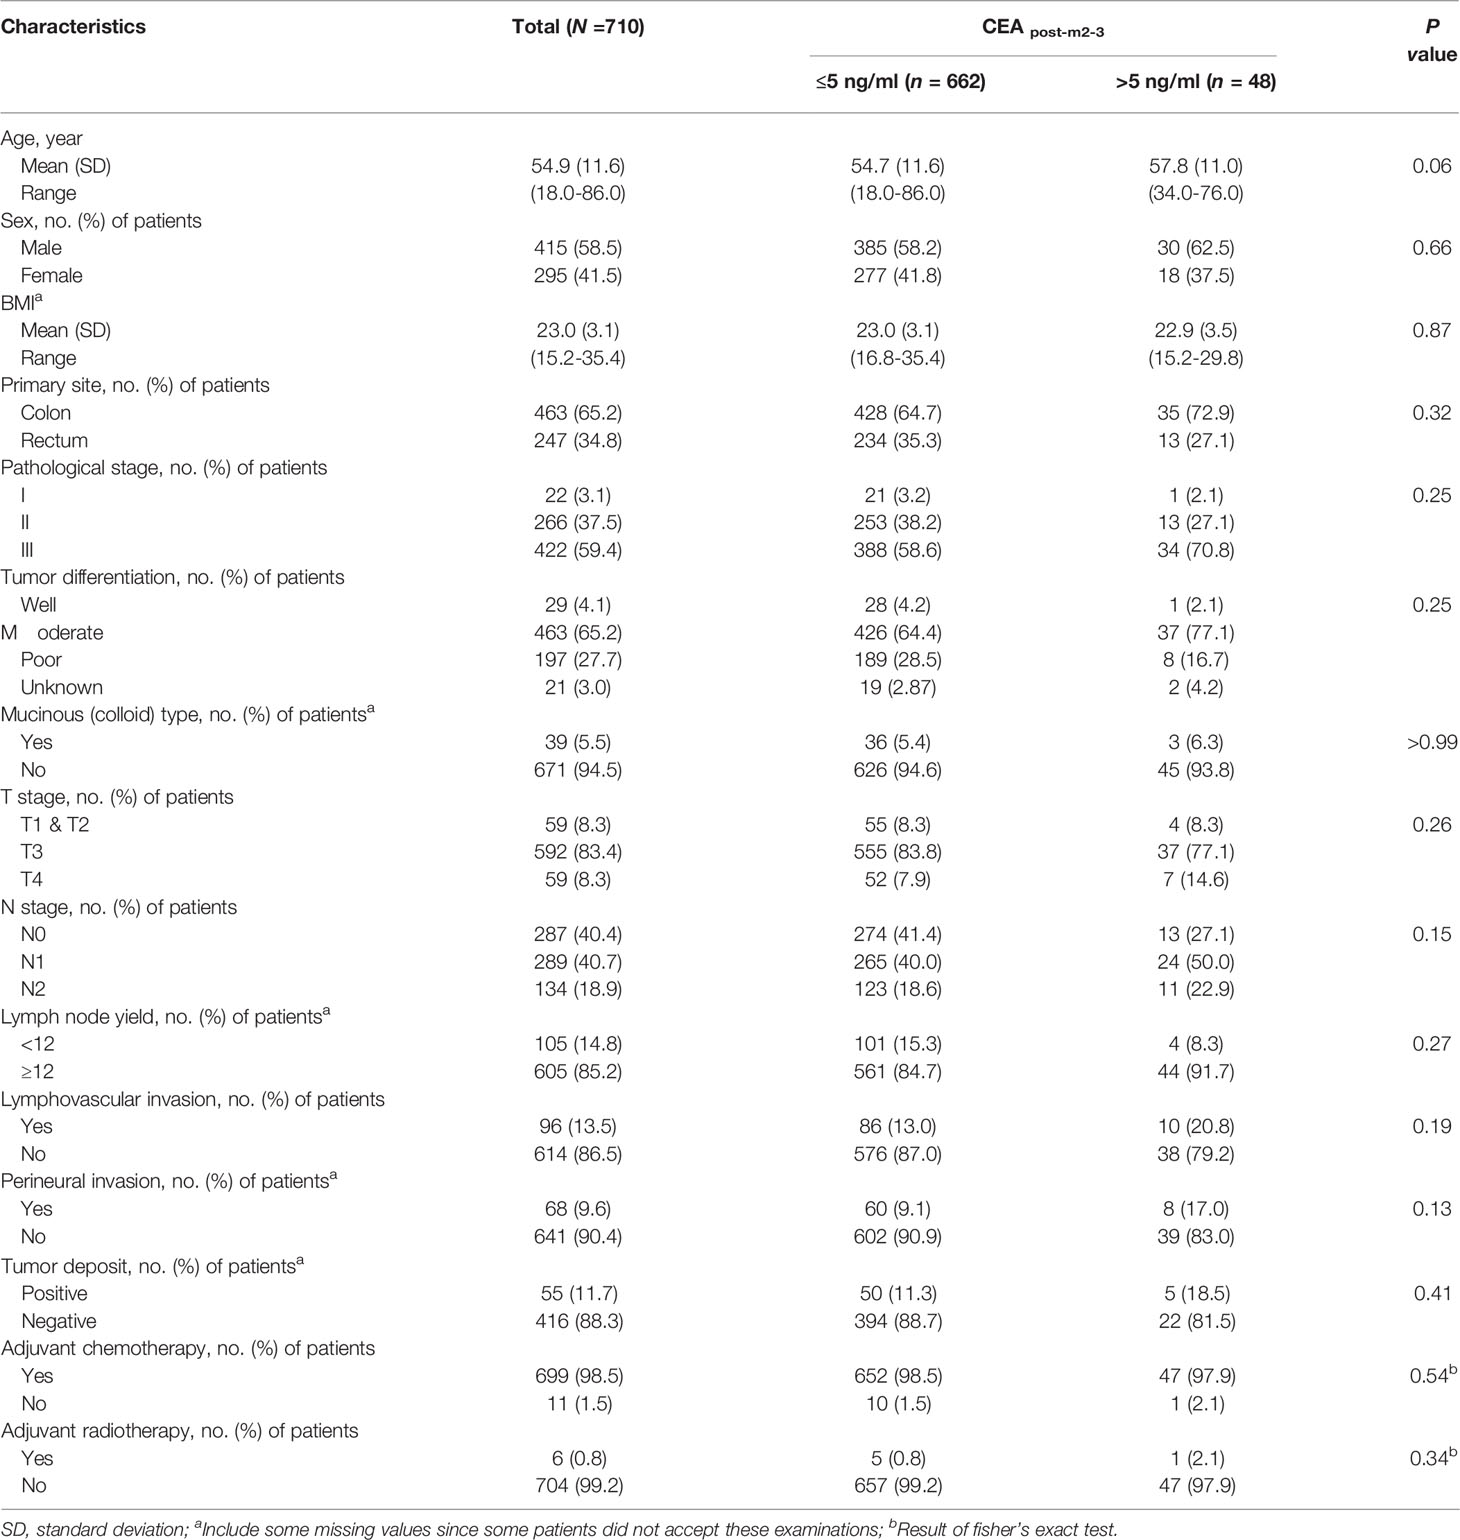
Table 1 Demographic and Clinicopathological Characteristics of Primary Analysis Population.
The median (IQR) CEApre-m1, CEApost-m1, CEApost-m2–3, and CEApost-m4–6 levels were 3.8 (2.0–8.8), 1.8 (1.2–2.9), 2.0 (1.3–2.9), and 2.2 (1.5–3.3) ng/mL, respectively. There were 417, 648, 662, and 642 patients with normal CEA levels before and 1, 2–3, and 4–6 months after surgery and 293, 62, 48, and 68 patients with elevated CEA levels before and 1, 2–3, and 4–6 months after surgery in the primary analysis population, respectively. The proportion of patients with elevated CEA levels at different perioperative time points showed a U-shaped curve, and the proportion observed within 2–3 months after surgery was the lowest (Figures 2A, B).
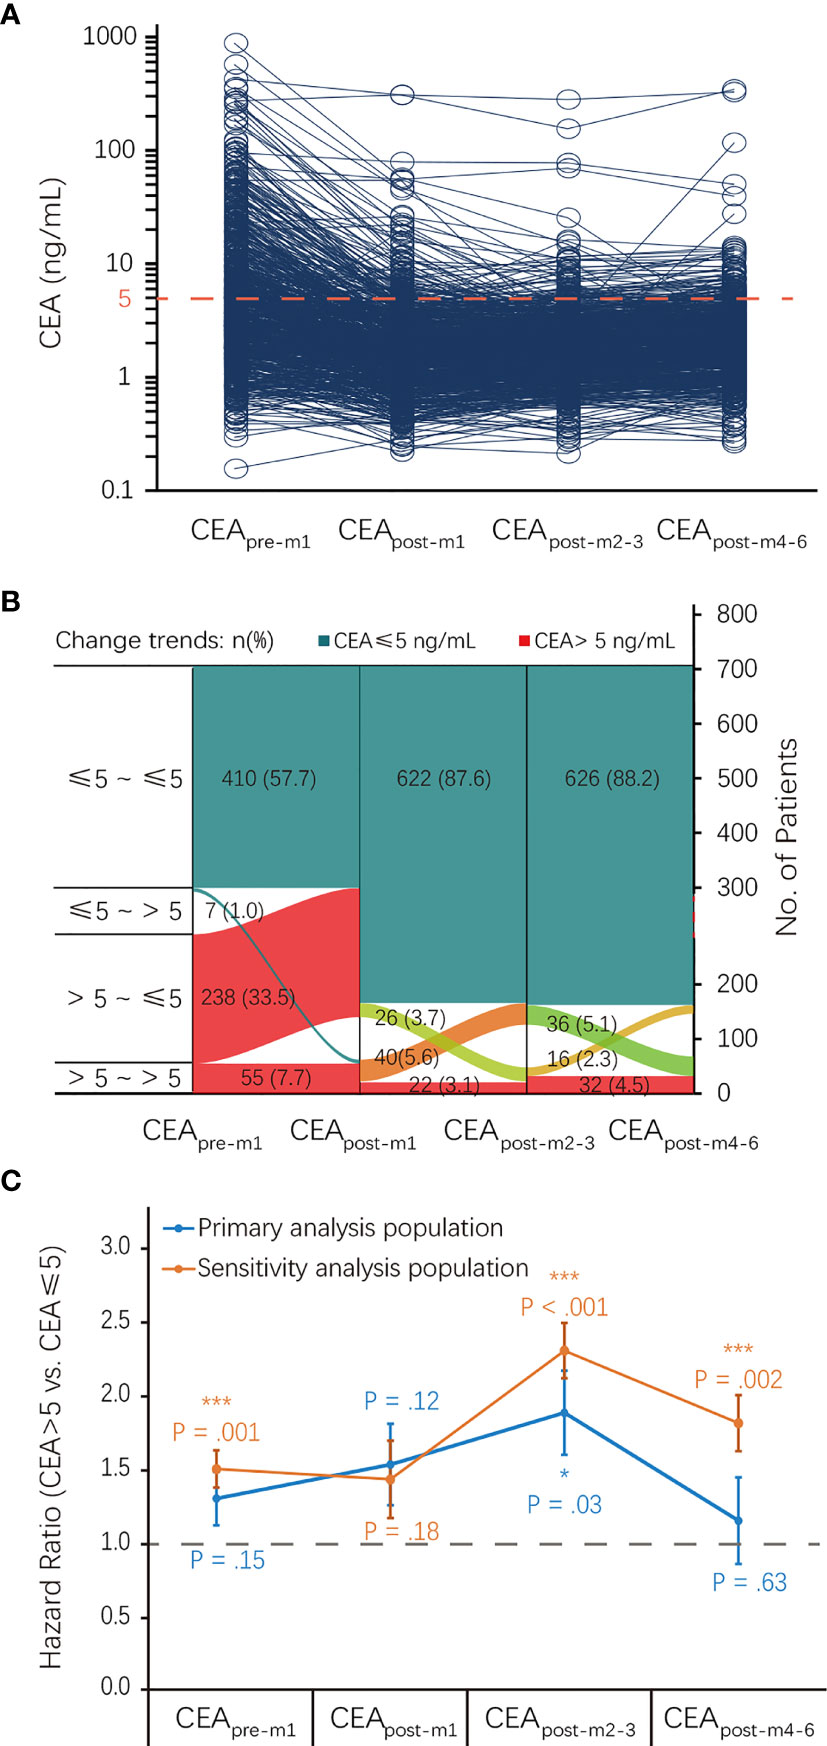
Figure 2 CEA status at different perioperative time points and its association with RFS. (A) CEA levels of each patient at different perioperative time points. (B) The proportion of patients with elevated CEA levels at different perioperative time points. (C) Association of CEA status at different perioperative time points with RFS. CEA, carcinoembryonic antigen; CI, confidence interval; HR, hazard ratio; RFS, recurrence-free survival.
Association of CEA Status at Different Perioperative Time Points With RFS and OS
There was an inverted U-shaped association between CEA status at different perioperative time points and RFS (Figure 2C). Univariate analysis showed that recurrence HRs in the elevated CEApre-m1, CEApost-m1, CEApost-m2–3, CEApost-m4–6 groups were 1.30 (95% CI: 0.91–1.85), 1.53 (95% CI: 0.89–2.62), 1.88 (95% CI: 1.08–3.28), and 1.15 (95% CI: 0.91–1.85), respectively. However, this association was only significant for elevated CEApost-m2–3 levels (P = 0.03) in the primary analysis (Table 2). The HRs of the elevated CEApre-m1, CEApost-m1, CEApost-m2–3, and CEApost-m4–6 groups for OS were 1.09 (95% CI: 0.60–1.97), 2.78 (95% CI: 1.34–5.79), 2.81 (95% CI: 1.25–6.30), and 3.30 (95% CI: 1.67–.536), respectively (Table S1).
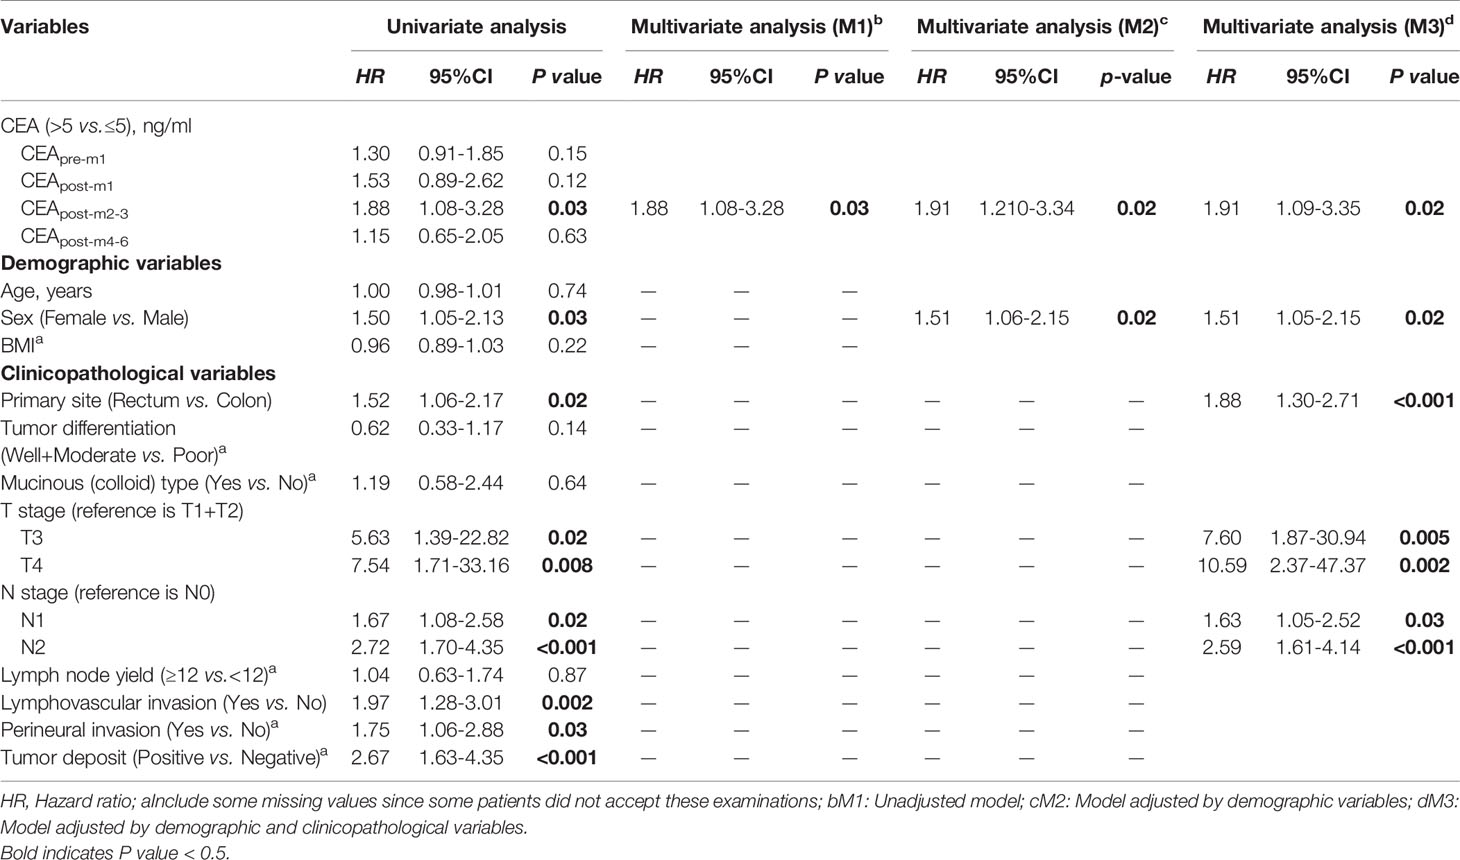
Table 2 Univariate and Multivariate Analysis of 3-year Recurrence Free Survival based on Primary Analysis Population.
Subsequently, adjusted multivariate Cox proportional hazards regression analyses showed that elevated CEApost-m2–3, rather than CEApre-m1, CEApost-m1, or CEApost-m4–6, was an independent risk factor for recurrence, but not for OS, in the primary analysis population (Table 2 and Table S1). Additionally, the adjustments resulted in a slight attenuation of the risk estimates in patients with elevated CEApost-m2–3, both in model 2 (elevated CEApost-m2–3 vs. normal CEApost-m2–3: HR, 2.38; 95% CI: 1.23–4.61) and model 3 (elevated CEApost-m2–3 vs. normal CEApost-m2–3: HR, 2.10; 95% CI: 1.02–4.32) (Table 2).
Figure 3 shows the cumulative incidence rates of recurrence in the normal and elevated CEA groups at different perioperative time points. There was no significant difference in the 3-year recurrence rates between those with normal and elevated CEA levels before (19.8% vs. 15.6%; Figure 3A) and 1 month (24.2% vs. 16.7%; Figure 3B) after surgery. However, patients with elevated CEApost-m2–3 levels showed a higher cumulative incidence rate of recurrence than patients with normal CEApost-m2–3 levels in the primary analysis (29.2% vs. 16.5%; Figure 3C). In contrast, no significant differences in the 3-year recurrence rates were observed between patients showing elevated and normal CEA levels 4–6 months after surgery (19.1% vs. 17.1%; Figure 3D).
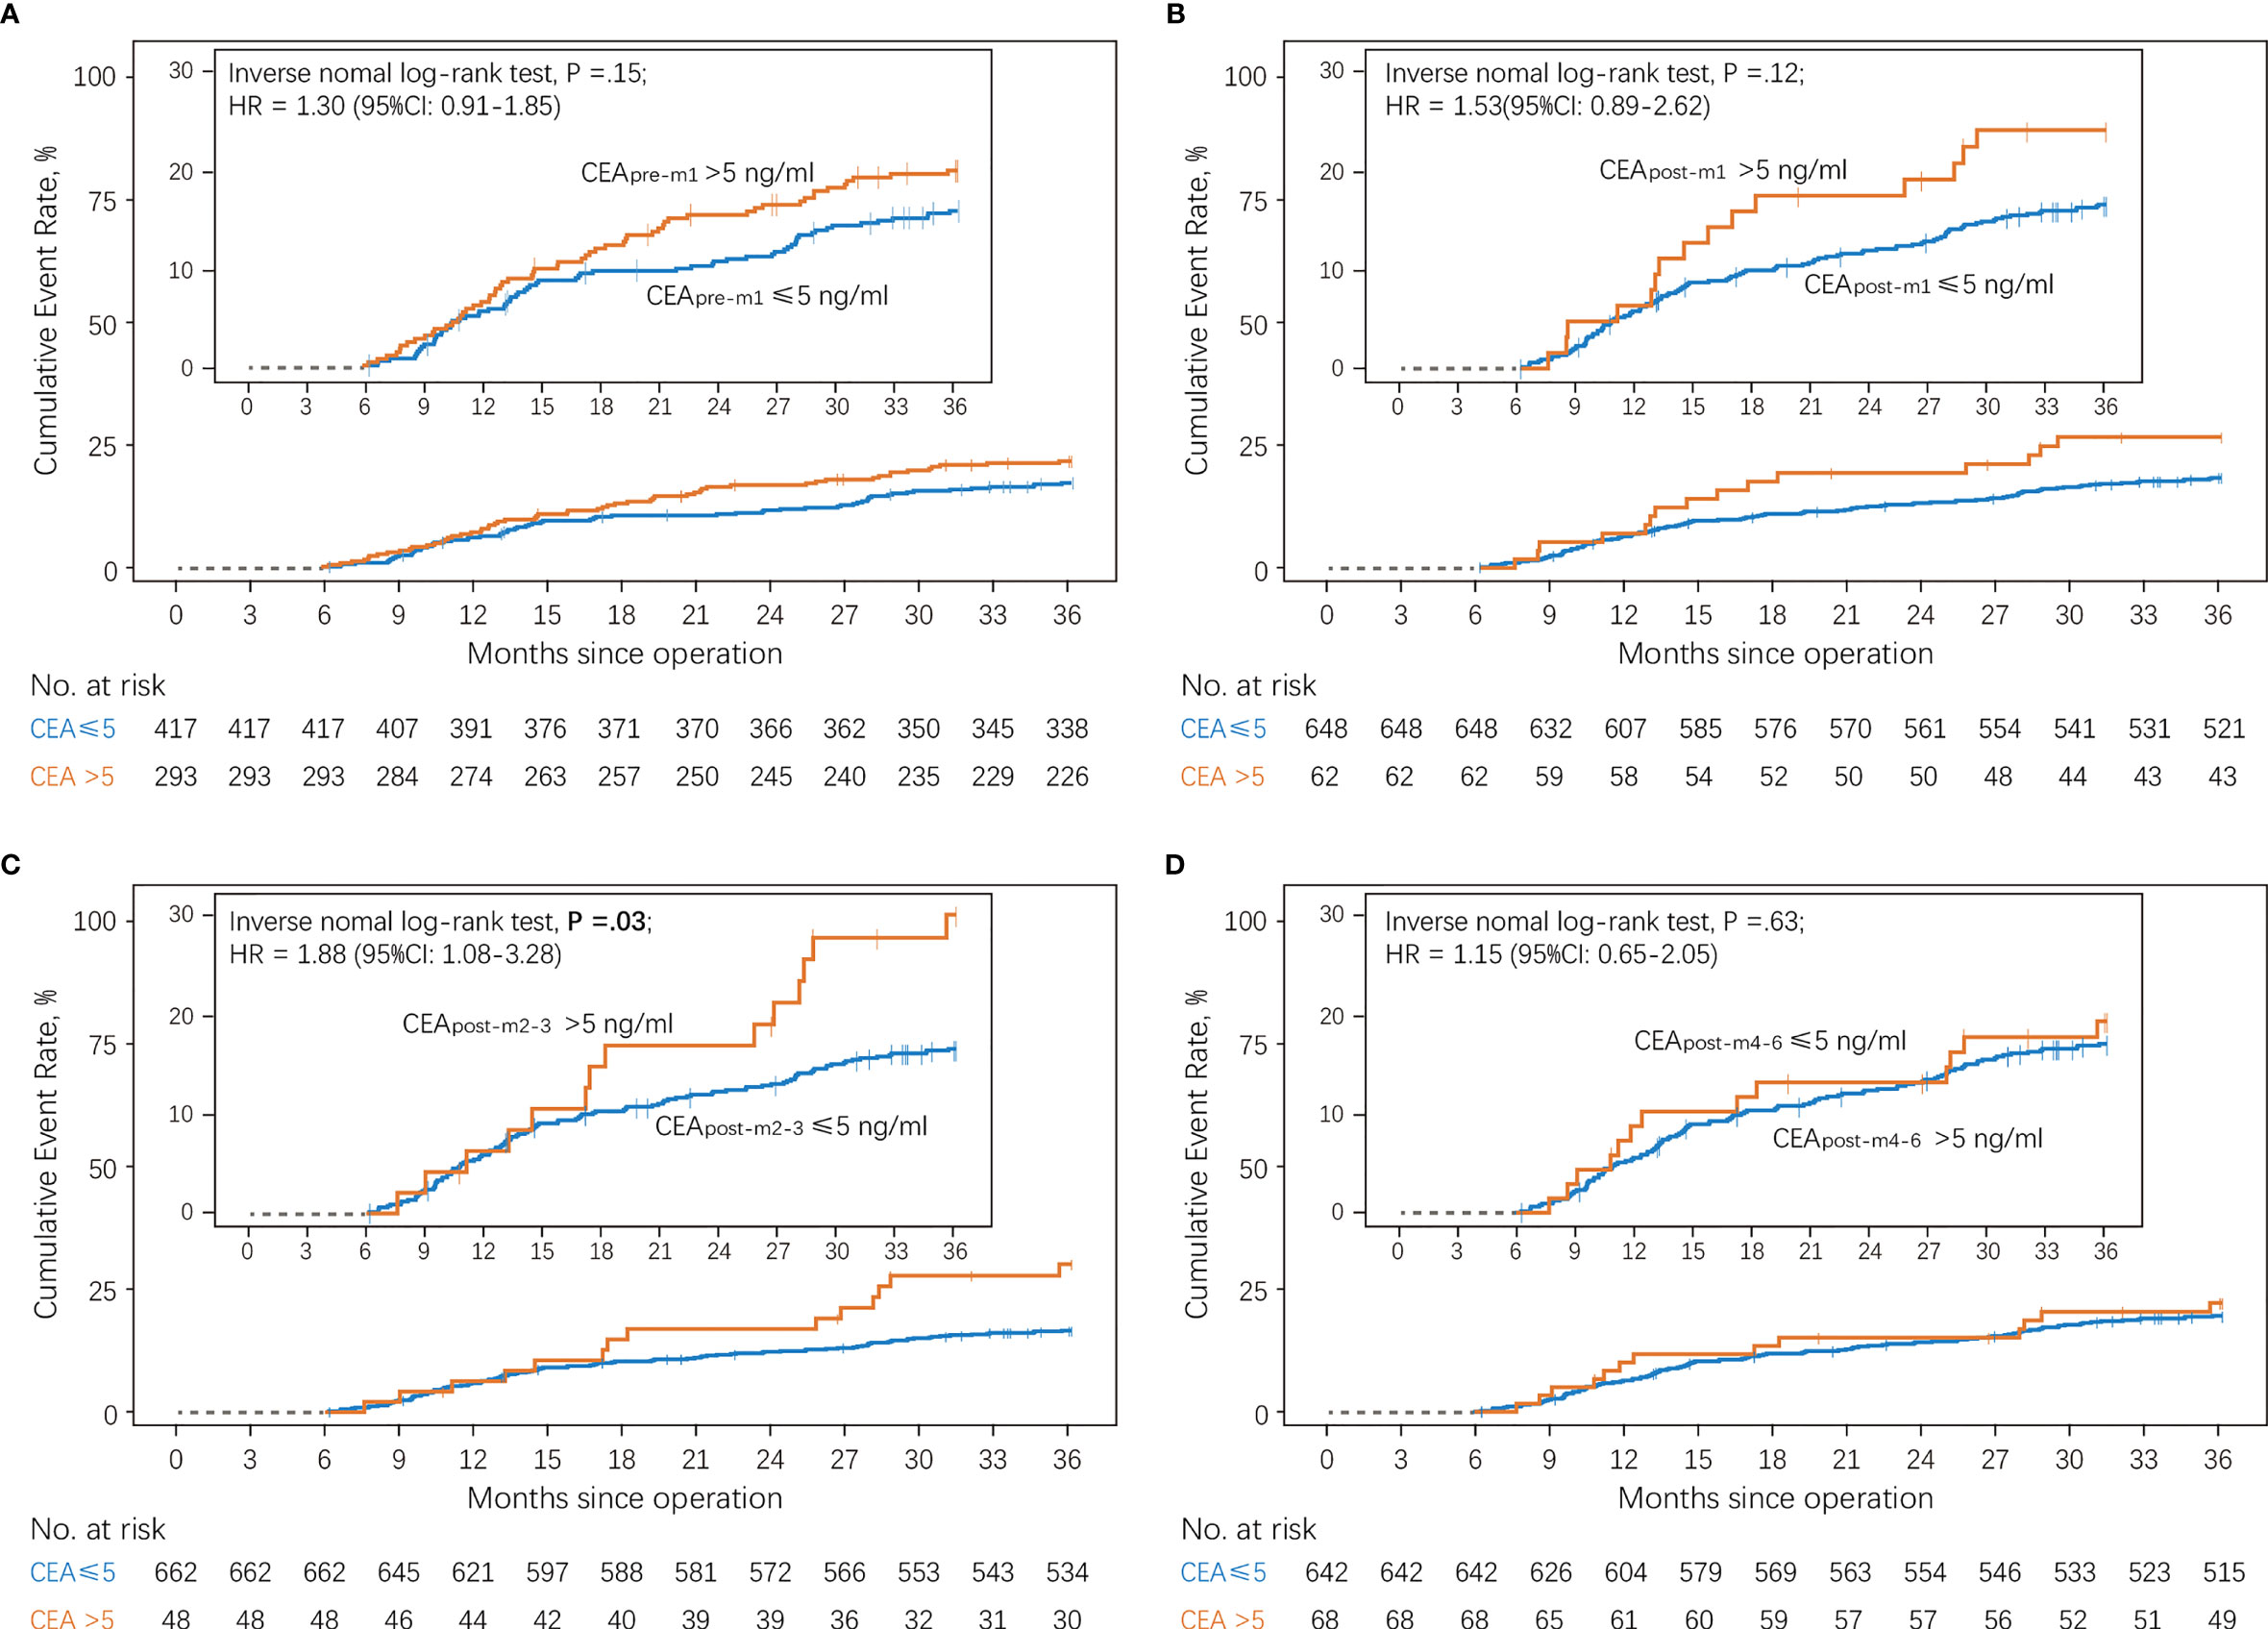
Figure 3 Cumulative incidence of recurrence according to serum CEA levels compared using a log-rank test (A) Patients with normal vs. elevated preoperative CEA levels (CEApre-m1). (B) Patients with normal vs. elevated CEA levels 1 month after surgery (CEApost-m1). (C) Patients with normal vs. elevated CEA levels 2–3 months after surgery (CEApost-m2–3). (D) Patients with normal vs. elevated CEA levels 4–6 months after surgery (CEApost-m4–6). CEA, carcinoembryonic antigen.
Sensitivity Analysis
The results from the sensitivity analysis are shown in Tables S2 and S3. In addition to the primary analysis population, the sensitivity analysis population also included 846 patients for whom CEApre-m1, CEApost-m1, or CEApost-m4–6 levels were unavailable. The results were consistent with those obtained from the primary analysis. In the sensitivity analysis population, CEApre-m1 (elevated CEApre-m1 vs. normal CEApre-m1: HR, 1.50; 95% CI: 1.17–1.92) and CEApost-m4–6 (elevated CEApost-m4–6 vs. normal CEApost-m4–6: HR, 1.81; 95% CI: 1.25–2.62) were associated with significantly shorter RFS in the univariate analysis but not in the multivariate analysis.
Subgroup Analysis
Patients with elevated CEApost-m2–3 tended to have a higher risk of recurrence, similar to that in the overall population (Figure 4 and Figure S1), in most subgroups except for among patients with normal CEApre-m1. It should be noted that the RFS of the elevated and normal CEApost-m2–3 groups also differed significantly among patients with stage II CRC [elevated CEApost-m2–3 vs. normal CEApost-m2–3: HR, 2.89; 95% CI: 1.02–8.24 [primary analysis population); HR, 2.69; 95% CI: 1.34–5.38 (sensitivity analysis population)]. There were no statistically significant interactions between patients’ baseline characteristics and CEApost-m2–3 (all P > 0.05).
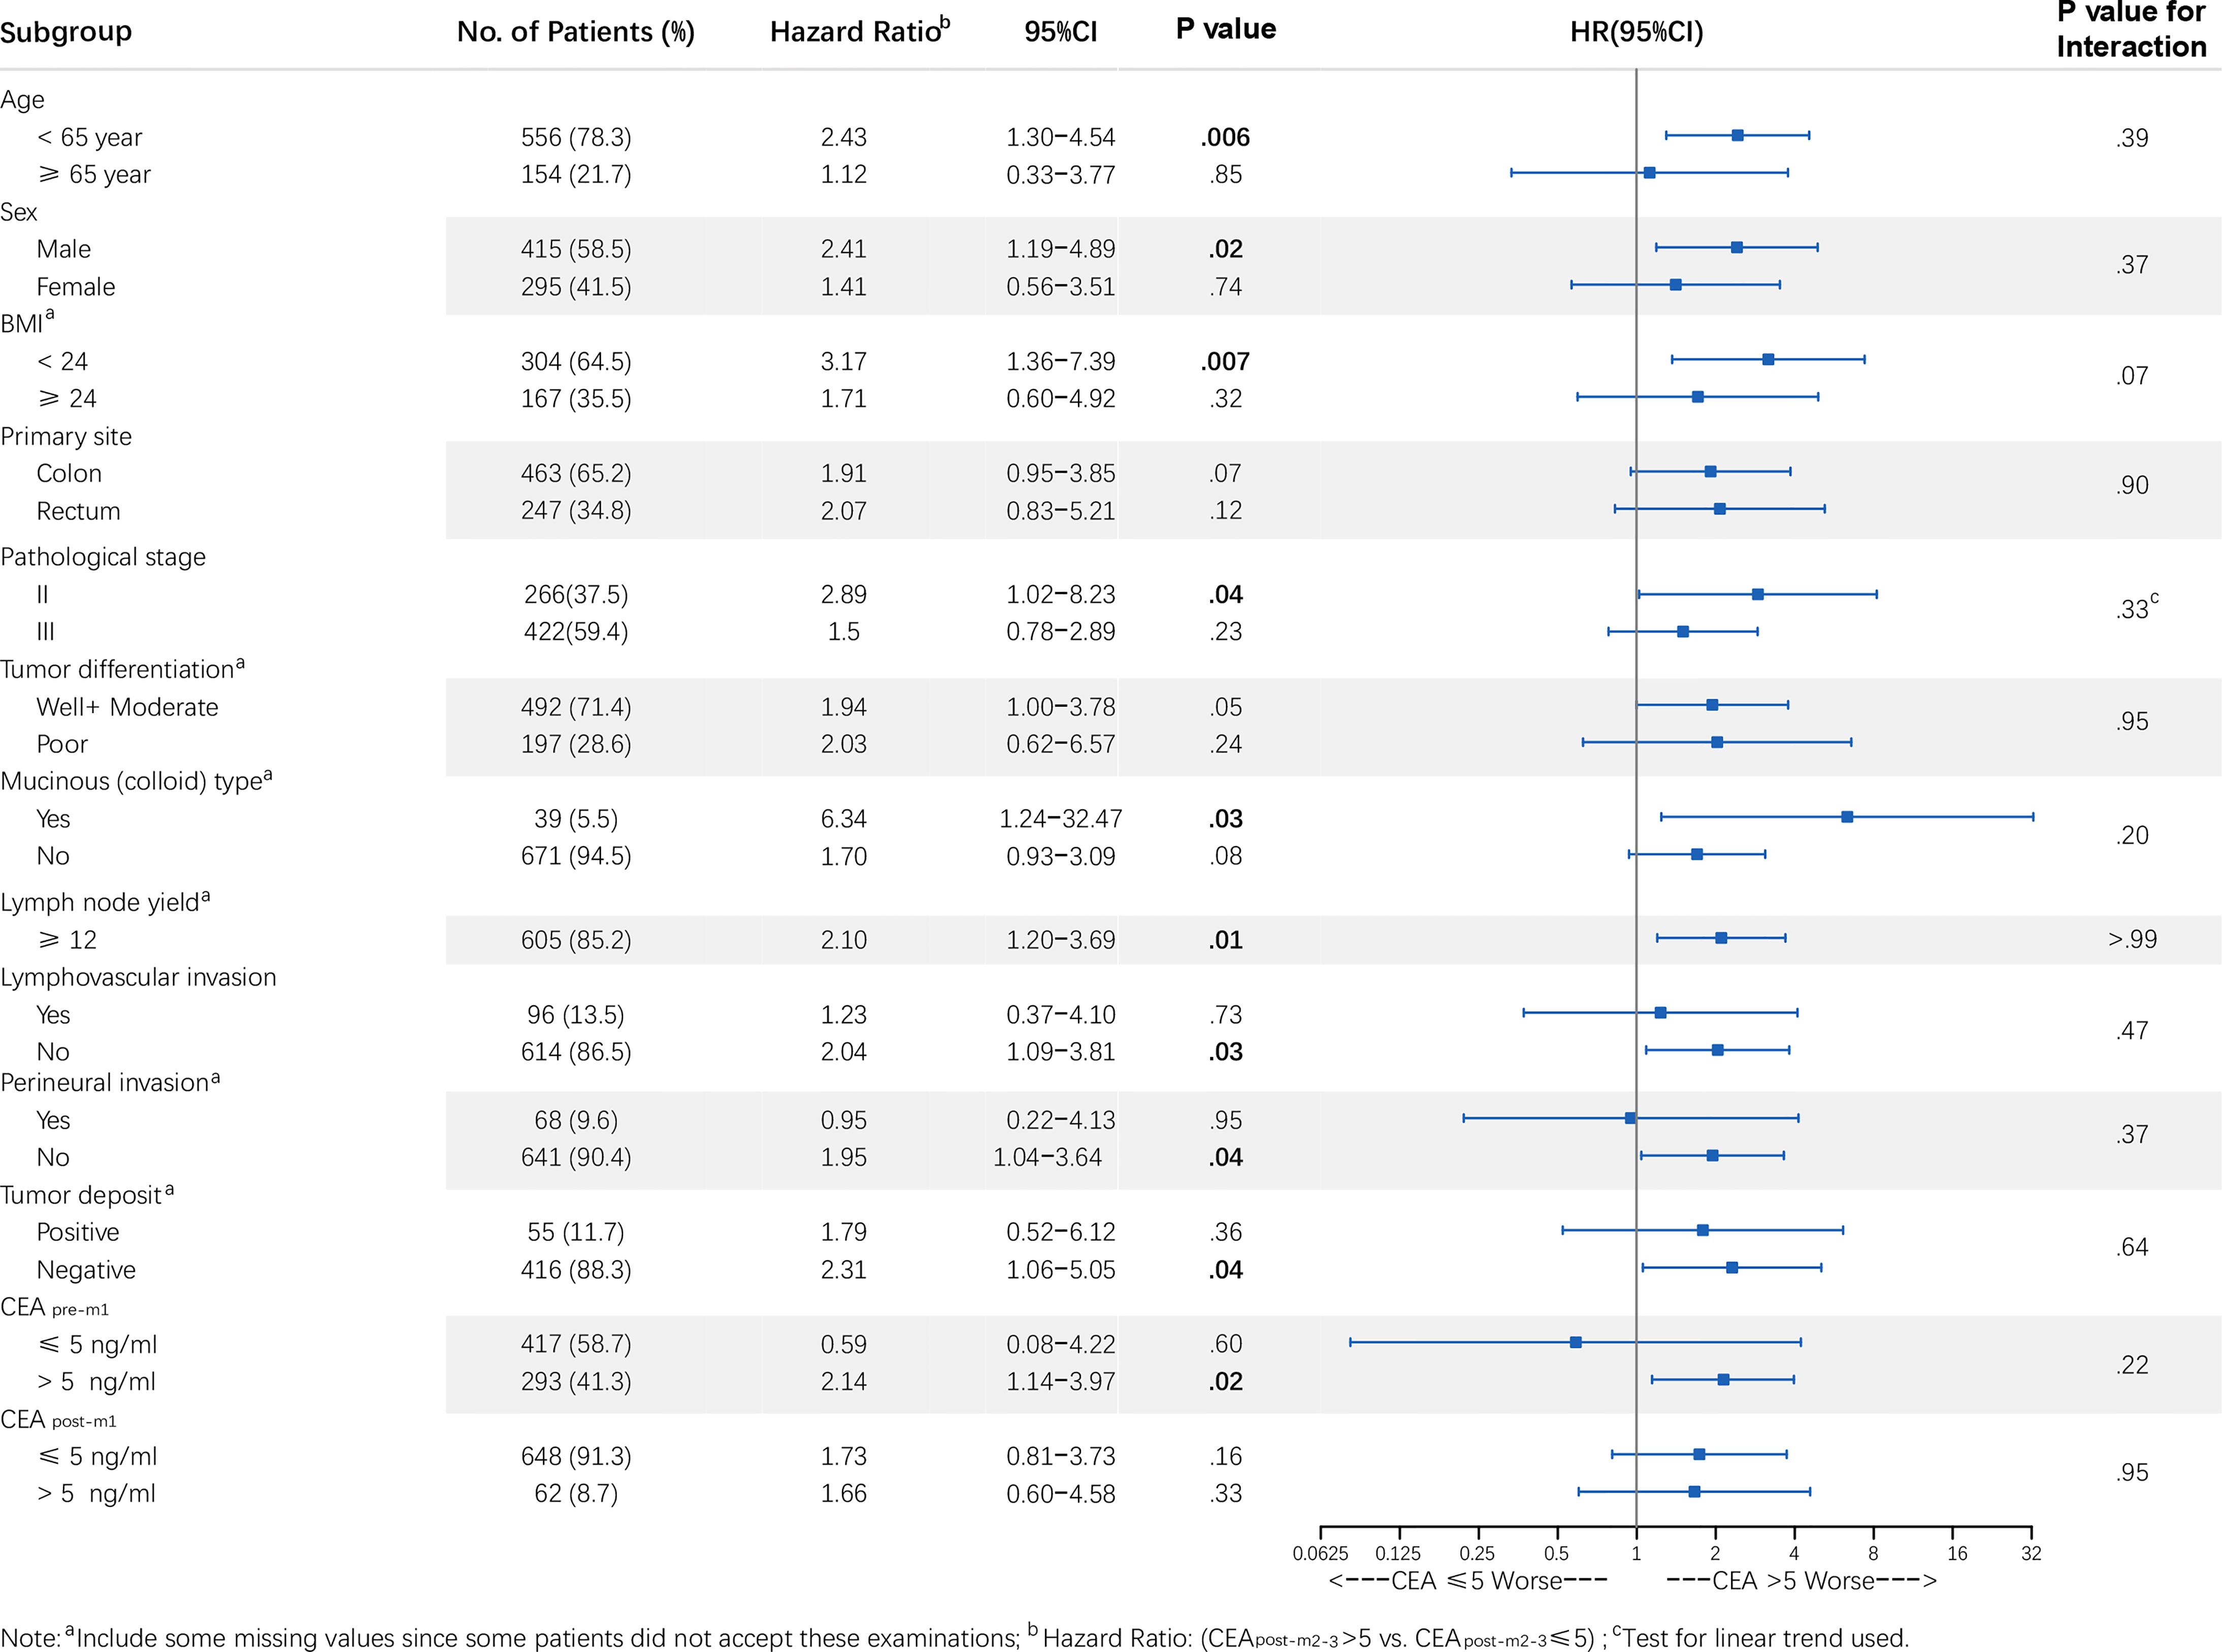
Figure 4 Forest plot of CEApost-m2–3 stratified by clinicopathological variables in the primary analysis population. Note: a Includes some missing values since some patients did not accept these examinations; b HR: (CEA >5.0 vs. ≤5.0 ng/mL); c Test for linear trend used. P values for interaction were calculated using the Cox regression model. HR and 95% CIs are provided and are visually represented by the squares and error bars. CEA, carcinoembryonic antigen; CEApost-m2–3, serum CEA levels 2–3 months after surgery; CI, confidence interval; HR, hazard ratio; RFS, recurrence-free survival.
Threshold Value of CEApost-m2–3
Patients were classified into CEApost-m2–3-low (≤ 5.14 ng/mL) or CEApost-m2–3-high (> 5.14 ng/mL) groups based on the optimal cut-off point determined by maximally selected rank statistics (Figure S2). And the RFS curves were statistically different (p = 0.003) when the threshold value of CEA was 5.14 ng/mL in the sensitivity analysis population (Figure S3).
Discussion
Our analyses of a retrospective, multicenter longitudinal cohort of patients with stage I–III CRC who underwent curative resection showed that the association between serum CEA levels and CRC outcomes varied at different perioperative time points, and CEApost-m2–3 was more informative than CEApre-m1, CEApost-m1, and CEApost-m4–6. Our data also showed that elevated CEApost-m2–3 was associated with shorter RFS. This association seemed to be independent of traditional prognostic factors and CEA levels at other perioperative time points.
We found that elevated postoperative CEA levels were more prognostic than elevated preoperative CEA levels, consistent with several previous studies (4, 10, 14–16). We also found, for the first time, that elevated CEApost-m2–3 is more prognostic than elevated CEApost-m1 and CEApost-m4–6. It may be postulated that the prognostic value of perioperative CEA levels is more likely to depend on the proportion of CEA reflecting the biological behavior of tumors. The elevated tumor biomarker levels are due to tumor burden and differences in the biological behavior of tumors (20). Preoperative CEA levels are both related to the tumor burden and biological behavior, while postoperative CEA levels are mainly related to biological behavior. This may be why elevated postoperative CEA levels are more prognostic than elevated preoperative CEA levels. In addition, the half-life of CEA varies from 3 to 7 days (21). Therefore, 3.0–18.0 weeks following surgery are required to allow for the clearance of CEA corresponding to tumor burden (16, 21). Interestingly, our data showed that the proportion of patients with elevated CEA levels within 2–3 months after surgery was the lowest. Together, these data indicate that the CEA level within 2–3 months after surgery may represent actual differences in the biological behavior of tumors. Hence, CEApost-m2–3 is more strongly associated with CRC outcomes than CEApost-m1 and CEApost-m4–6.
The sensitivity and subgroup analyses supported our findings, demonstrating that the effect estimates were robust. It is important to note that the association between CEApost-m2–3 and recurrence in patients with CRC may vary according to CEApre-m1, with an RFS advantage seen in patients with normal CEApost-m2–3 and elevated CEApre-m1 but not in patients with normal CEApost-m2–3 and CEApre-m1. This suggests that elevated CEApost-m2–3 may not be informative when CEApre-m1 is normal. Moreover, this also implies that combined use of CEApost-m2–3 and CEApre-m1 may help clinicians in assessing the risk of recurrence better, thus allowing them to determine the optimal follow-up strategy and adjust adjuvant treatment regimens.
After subgroup analysis, our study also showed that postoperative CEA levels within 2–3 months after surgery had predictive value in patients with stage II CRC, consistent with some previous studies (11, 12). Our results confirmed that the prognostic value of serum CEA levels in patients with stage II CRC was affected by the timing of postoperative measurement. Our findings support the use of postoperative CEA measurements within 2–3 months as an indicator for the requirement of adjuvant treatment in patients with stage II CRC. And we found that the potential threshold value of CEA post-m2–3 was 5.14 ng/mL, which was close to 5.0 ng/mL. Besides, The CEApost-m2–3 had good prognostic value in OS analysis, though it was not significant in the multivariate model analysis. However, considering the clinical value of recurrence prediction, we believe that 2-3 months after surgery is the key time of perioperative serum CEA measurement.
The large size of the multicenter cohort ensured that our findings were robust when applied to different conditions, which is a major strength of our study. One limitation, however, is that different immunoassay analyzers were used for CEA measurements at the two centers. Even though harmonization of the CEA results obtained using the two immunoassay analyzers has not yet been achieved (22), the normal CEA ranges for both immunoassay analyzers are 0.0–5.0 ng/mL (17). We analyzed CEA levels as a dichotomized variable. Hence, the primary results of this study should not be affected by CEA testing methods. Another limitation is that the proportion of patients who were not treated with adjuvant chemotherapy was too low (1.5% and 8.4% in the primary and sensitivity analysis populations, respectively). Therefore, the results may not be generalizable to patients not receiving adjuvant chemotherapy. Finally, we did not control for other factors that can lead to false-positive CEA elevation (23), such as tobacco use (24), as this was challenging to accurately ascertain from the patients.
In conclusion, our study provides evidence that elevated CEApost-m2–3, rather than CEApre-m1, CEApost-m1, and CEApost-m4–6, is associated with CRC outcomes. The optimal timing for perioperative serum CEA measurement is 2–3 months after surgery for patients with CRC, and CEApost-m2–3 can be used as a predictor of RFS. Our findings suggest that prolonged adjuvant chemotherapy and more frequent follow-ups should be considered to reduce the risk of relapse in CRC patients with elevated CEApost-m2–3.
Data Availability Statement
The raw data supporting the conclusions of this article will be made available by the authors, without undue reservation.
Ethics Statement
The studies involving human participants were reviewed and approved by Ethics Committee of Yunnan Cancer Hospital (KY201824). The patients/participants provided their written informed consent to participate in this study.
Author Contributions
DY had full access to all of the data in the study and takes responsibility for the integrity of the data and the accuracy of the data analysis. Study concept and design, DY. Acquisition, analysis, or interpretation of data, ZL, ZW, XP, SY, DZ, ML, XC, QS, LC, and DY. Drafting of the manuscript, ZL, ZW, XP, and SY. Critical revision of the manuscript for important intellectual content, ZL, ZW, XP, SY, DZ, ML, XC, QS, LC, and DY. Statistical analysis, ZL, ZW, and DY. Administrative, technical, or material support, DZ, ML, XC, QS, and LC. Study supervision, DY. All authors contributed to the article and approved the submitted version.
Funding
This study was funded by research grants from the National Natural Science Foundation of China [82001986, 81660545, 81960592, and 82073569], National Science Fund for Distinguished Young Scholars [81925023], the Outstanding Youth Science Foundation of Yunnan Basic Research Project [202101AW070001, 202001AW070021], National Key Research and Development Program of China [2017YFC1309102], the Key Science Foundation of Yunnan Basic Research [202101AS070040], the Applied Basic Research Projects of Yunnan Province, China [202001AY070001-240, 202001AY070001-242, 2019FE001-083 and 2018FE001-065], Yunnan digitalization, development and application of biotic resource [202002AA100007], the Innovative Research Team of Yunnan Province [2019-6], and the fellowship of China Postdoctoral Science Foundation [2020M670923].
Conflict of Interest
The authors declare that the research was conducted in the absence of any commercial or financial relationships that could be construed as a potential conflict of interest.
The reviewer ZY declared a shared affiliation, with no collaboration, with XP to the handling editor at the time of the review.
Publisher’s Note
All claims expressed in this article are solely those of the authors and do not necessarily represent those of their affiliated organizations, or those of the publisher, the editors and the reviewers. Any product that may be evaluated in this article, or claim that may be made by its manufacturer, is not guaranteed or endorsed by the publisher.
Acknowledgments
We thank Elsevier Webshop - Author Services for editorial and language assistance.
Supplementary Material
The Supplementary Material for this article can be found online at: https://www.frontiersin.org/articles/10.3389/fonc.2021.722883/full#supplementary-material
Supplementary Figure 1 | Forest plot of CEApost-m2–3 stratified by clinicopathological variables in the sensitivity analysis population. Note: a Includes some missing values since some patients did not accept these examinations; b HR: (CEA >5.0 vs. ≤5.0 ng/mL); c Test for linear trend used. P values for interaction were calculated using the Cox regression model. HR and 95% CIs are provided and are visually represented by the squares and error bars. CEA, carcinoembryonic antigen; CEApost-m2–3, serum CEA levels 2–3 months after surgery; CI, confidence interval; HR, hazard ratio; RFS, recurrence-free survival.
Supplementary Figure 2 | The optimal cut-off to CEA as high-recurrence risk and low-recurrence risk patient was determined by maximally selected rank statistics method.
Supplementary Figure 3 | Kaplan-Meier survival curves of RFS of CEA-low vs CEA-high categories in the sensitivity analysis population. CEA-low: CEApost-m2–3≤ 5.14 ng/mL; CEA-highd: CEApost-m2–3> 5.14 ng/mL
References
1. Siegel RL, Miller KD, Goding Sauer A, Fedewa SA, Butterly LF, Anderson JC, et al. Colorectal Cancer Statistics, 2020. CA Cancer J Clin (2020) 70(3):145–64. doi: 10.3322/caac.21601
2. Liebig C, Ayala G, Wilks J, Verstovsek G, Liu H, Agarwal N, et al. Perineural Invasion is an Independent Predictor of Outcome in Colorectal Cancer. J Clin Oncol (2009) 27(31):5131–7. doi: 10.1200/JCO.2009.22.4949
3. King TA, Lyman JP, Gonen M, Voci A, De Brot M, Boafo C, et al. Prognostic Impact of 21-Gene Recurrence Score in Patients With Stage IV Breast Cancer: TBCRC 013. J Clin Oncol (2016) 34(20):2359–65. doi: 10.1200/JCO.2015.63.1960
4. Konishi T, Shimada Y, Hsu M, Tufts L, Jimenez-Rodriguez R, Cercek A, et al. Association of Preoperative and Postoperative Serum Carcinoembryonic Antigen and Colon Cancer Outcome. JAMA Oncol (2018) 4(3):309–15. doi: 10.1001/jamaoncol.2017.4420
5. National Comprehensive Cancer Network. NCCN Clinical Practice Guidelines in Oncology (NCCN Guidelines). Colon Cancer Version 2 (2020). Available at: https://www.nccn.org/professionals/physician_gls/default.aspx (Accessed January 3, 2021).
6. National Comprehensive Cancer Network. NCCN Clinical Practice Guidelines in Oncology (NCCN Guidelines). Rectal Cancer Version 3 (2020). Available at: https://www.nccn.org/professionals/physician_gls/default.aspx (Accessed January 3, 2021).
7. Zhang S, Li J, Cai S, Xu R, Zhang Z, Yuan Y, et al. Chinese Society of Clinical Oncology (CSCO) Diagnosis and Treatment Guidelines for Colorectal Cancer 2018. Chin J Cancer Res (2019) 31(1):117–34. doi: 10.21147/j.issn.1000-9604.2019.01.07
8. Argilés G, Tabernero J, Labianca R, Hochhauser D, Salazar R, Iveson T, et al. Localised Colon Cancer: ESMO Clinical Practice Guidelines for Diagnosis, Treatment and Follow-Up. Ann Oncol (2020) 31(10):1291–305. doi: 10.1016/j.annonc.2020.06.022
9. Glynne-Jones R, Wyrwicz L, Tiret E, Brown G, Rodel C, Cervantes A, et al. Rectal Cancer: ESMO Clinical Practice Guidelines for Diagnosis, Treatment and Follow-Up. Ann Oncol (2017) 28(suppl_4):iv40. doi: 10.1093/annonc/mdx224
10. Nakamura Y, Shida D, Tanabe T, Takamizawa Y, Imaizumi J, Ahiko Y, et al. Prognostic Impact of Preoperatively Elevated and Postoperatively Normalized Carcinoembryonic Antigen Levels Following Curative Resection of Stage I-III Rectal Cancer. Cancer Med (2020) 9(2):653–62. doi: 10.1002/cam4.2758
11. Tsai HL, Huang CW, Chen CW, Yeh YS, Ma CJ, Wang JY. Survival in Resected Stage II Colorectal Cancer Is Dependent on Tumor Depth, Vascular Invasion, Postoperative CEA Level, and the Number of Examined Lymph Nodes. World J Surg (2016) 40(4):1002–9. doi: 10.1007/s00268-015-3331-y
12. Lin JK, Lin CC, Yang SH, Wang HS, Jiang JK, Lan YT, et al. Early Postoperative CEA Level Is a Better Prognostic Indicator Than Is Preoperative CEA Level in Predicting Prognosis of Patients With Curable Colorectal Cancer. Int J Colorectal Dis (2011) 26(9):1135–41. doi: 10.1007/s00384-011-1209-5
13. Kim JY, Kim NK, Sohn SK, Kim YW, Kim KJ, Hur H, et al. Prognostic Value of Postoperative CEA Clearance in Rectal Cancer Patients With High Preoperative CEA Levels. Ann Surg Oncol (2009) 16(10):2771–8. doi: 10.1245/s10434-009-0651-x
14. Huang CS, Chen CY, Huang LK, Wang WS, Yang SH. Prognostic Value of Postoperative Serum Carcinoembryonic Antigen Levels in Colorectal Cancer Patients Who Smoke. PloS One (2020) 15(6):e0233687. doi: 10.1371/journal.pone.0233687
15. Xie HL, Gong YZ, Kuang JA, Gao F, Tang SY, Gan JL. The Prognostic Value of the Postoperative Serum CEA Levels/Preoperative Serum CEA Levels Ratio in Colorectal Cancer Patients With High Preoperative Serum CEA Levels. Cancer Manag Res (2019) 11:7499–511. doi: 10.2147/CMAR.S213580
16. Yu H, Luo Y, Wang X, Bai L, Huang P, Wang L, et al. Time to Lowest Postoperative Carcinoembryonic Antigen Level Is Predictive on Survival Outcome in Rectal Cancer. Sci Rep (2016) 6:34131. doi: 10.1038/srep34131
17. Laurence DJ, Turberville C, Anderson SG, Neville AM. First British Standard for Carcinoembryonic Antigen (CEA). Br J Cancer (1975) 32(3):295–9. doi: 10.1038/bjc.1975.227
18. Li Z, Li S, Liang Y, Pu H, Tu C, Wu Z, et al. Predictive Value of Postoperative Peripheral CD4+ T Cells Percentage in Stage I-III Colorectal Cancer: A Retrospective Multicenter Cohort Study of 1028 Subjects. Cancer Manag Res (2020) 12:5505–13. doi: 10.2147/CMAR.S259464
19. Torsten Hothorn BL. On the Exact Distribution of Maximally Selected Rank Statistics. Comput Stat Data Anal (2003) 43(2):121–37. doi: 10.1016/S0167-9473(02)00225-6
20. Berger AC, Garcia M Jr, Hoffman JP, Regine WF, Abrams RA, Safran H, et al. Postresection CA 19-9 Predicts Overall Survival in Patients With Pancreatic Cancer Treated With Adjuvant Chemoradiation: A Prospective Validation by RTOG 9704. J Clin Oncol (2008) 26(36):5918–22. doi: 10.1200/JCO.2008.18.6288
21. Lokich J, Ellenberg S, Gerson B, Knox WE, Zamcheck N. Plasma Clearance of Carcinoembryonic Antigen Following Hepatic Metastatectomy. J Clin Oncol (1984) 2(5):462–5. doi: 10.1200/JCO.1984.2.5.462
22. Zhang K, Huo H, Lin G, Yue Y, Wang Q, Li J. A Long Way to Go for the Harmonization of Four Immunoassays for Carcinoembryonic Antigen. Clin Chim Acta (2016) 454:15–9. doi: 10.1016/j.cca.2015.12.029
23. Barton MK. False Elevations of Carcinoembryonic Antigen Levels are Common in Patients Under Surveillance for Colorectal Cancer Recurrence. CA Cancer J Clin (2014) 64(6):365–6. doi: 10.3322/caac.21247
Keywords: colorectal cancer, carcinoembryonic antigen, adjuvant chemotherapy, recurrence risk, risk stratification
Citation: Li Z, Zhang D, Pang X, Yan S, Lei M, Cheng X, Song Q, Cai L, Wang Z and You D (2021) Association Between Serum Carcinoembryonic Antigen Levels at Different Perioperative Time Points and Colorectal Cancer Outcomes. Front. Oncol. 11:722883. doi: 10.3389/fonc.2021.722883
Received: 09 June 2021; Accepted: 22 September 2021;
Published: 08 October 2021.
Edited by:
Liliana Belgioia, Università di Genova, ItalyReviewed by:
Xueliang Wu, First Affiliated Hospital of Hebei North University, ChinaZixu Yuan, The Sixth Affiliated Hospital of Sun Yat-sen University, China
Copyright © 2021 Li, Zhang, Pang, Yan, Lei, Cheng, Song, Cai, Wang and You. This is an open-access article distributed under the terms of the Creative Commons Attribution License (CC BY). The use, distribution or reproduction in other forums is permitted, provided the original author(s) and the copyright owner(s) are credited and that the original publication in this journal is cited, in accordance with accepted academic practice. No use, distribution or reproduction is permitted which does not comply with these terms.
*Correspondence: Zhuozhong Wang, d2FuZ3podW96aG9uZ0Bob3RtYWlsLmNvbQ==; Dingyun You, eW91ZGluZ3l1bkBxcS5jb20=
†These authors have contributed equally to this work