 Stephany Corrêa1
 Francisco P. Lopes
 Carolina Panis
 Thais Basili
 Eliana Abdelhay
- 1Centro de Transplante de Medula Óssea (CEMO), Instituto Nacional de Câncer (INCA), Rio de Janeiro, Brazil
- 2Grupo de Biologia do Desenvolvimento e Sistemas Dinâmicos, Universidade Federal do Rio de Janeiro (UFRJ), Duque de Caxias, Brazil
- 3Laboratório de Biologia de Tumores, Universidade Estadual do Oeste do Paraná (UNIOESTE), Francisco Beltrão, Brazil
- 4Department of Pathology, Memorial Sloan Kettering Cancer Center, New York, NY, United States
Breast cancer (BC) has been extensively studied, as it is one of the more commonly diagnosed cancer types worldwide. The study of miRNAs has increased what is known about the complexity of pathways and signaling and has identified potential biomarkers and therapeutic targets. Thus, miRNome profiling could provide important information regarding the molecular mechanisms involved in BC. On average, more than 430 miRNAs were identified as differentially expressed between BC cell lines and normal breast HMEC cells. From these, 110 miRNAs were common to BC subtypes. The miRNome enrichment analysis and interaction maps highlighted epigenetic-related pathways shared by all BC cell lines and revealed potential miRNA targets. Quantitative evaluation of BC patient samples and GETx/TCGA-BRCA datasets confirmed MYB and EZH2 as potential targets from BC miRNome. Moreover, overall survival was impacted by EZH2 expression. The expression of 15 miRNAs, selected according to aggressiveness of BC subtypes, was confirmed in TCGA-BRCA dataset. Of these miRNAs, miRNA-mRNA interaction prediction revealed 7 novel or underexplored miRNAs in BC: miR-1271-5p, miR-130a-5p, and miR-134 as MYB regulators and miR-138-5p, miR-455-3p, miR-487a, and miR-487b as EZH2 regulators. Herein, we report a novel molecular miRNA signature for BC and identify potential miRNA/mRNAs involved in disease subtypes.
Introduction
Breast cancer (BC) is the most common type of cancer and the leading cause of cancer-related death among women worldwide. As a result of several etiologic factors and clinical characteristics, BCs have different prognoses and treatments. BC is classified according to the presence of receptors into 4 major molecular subtypes (1, 2): luminal A (estrogen and/or progesterone receptor positive), luminal-HER (estrogen and/or progesterone receptor positive and HER2 positive), HER2 (human epidermal receptor 2 positive or enriched) and triple-negative (negative for these receptors) (3).
The carcinogenesis of BC is complex and involves several distinct mechanisms at the cellular and molecular levels. In addition to genetic alterations and microenvironment involvement, epigenetic modifications also occur in tumor cell progression. These alterations in gene expression can be driven by different processes, such as methylation, histone modification, chromatin remodeling, and by noncoding RNAs, such as microRNAs (miRNAs) (4, 5).
MiRNAs are a class of small noncoding RNAs approximately 22 nucleotides in length that have an important role in posttranscriptional gene regulation by targeting messenger RNAs (mRNAs) with an antisense complementary sequence, thus inhibiting or inducing the translation of the mRNA by different mechanisms (6). MiRNAs can target not just one but several mRNAs due to imperfect base pairing and are key regulators in various cellular processes, including cellular growth, differentiation and apoptosis. They are also deregulated in many diseases, including cancer (7). Because of their contributions to gene regulation and their involvement in several signaling networks, these molecules can act as tumor suppressor or oncogenic miRNAs by targeting oncogenes or tumor suppressor genes, respectively.
MiRNAs have been actively studied in recent years (8), and some studies have observed aberrant expression of miRNAs in BC. Different groups have observed the overexpression of miR-21 and miRNA-221/222, which confer trastuzumab and tamoxifen resistance, respectively (9, 10). In contrast, members of the let-7 family are downregulated (11). Most of these studies focused on one or a few miRNAs, or on a specific pathway of interest, as there are many targets, elements and interactions affected by miRNA regulation.
Genomic technologies can provide information to better understand the biology and the components involved in tumorigenesis. Although BC classification provides important information regarding the underlying biology and clinical behavior of cancer, which provides insights into its prognosis and the appropriate treatment approach (12), it is still difficult to transpose transcriptomic and proteomic studies in BC; this is likely due to the differential expression of miRNAs (13, 14).
Moreover, it has become clear that the global screening of miRNAs may offer valuable information, which could be used to enhance the analysis of already existing BC data. MiRNA expression profiling has the potential to improve tumor stratification, patient diagnosis, and the assignment of patient prognoses and even has the potential to be used as a therapeutic tool. To achieve this impact, high-throughput approaches are applied to identify cancer-specific molecular-fingerprints by screening thousands of targets (15, 16).
Therefore, in the present work, we analyzed the miRNome of cellular lineages that represent the BC subtypes to identify the signaling and pathways deregulated in BC, together with potential biomarkers of the disease.
Materials And Methods
Cell Culture
In this study, cellular lineages were used to model different BC subtypes. The cell lines MCF-7, EVSA-T (luminal) and MDA-MB-231 (triple-negative) were obtained commercially from DSMZ collection, with the following catalog numbers: ACC-115, ACC-433, and ACC-732, respectively. The HCC-1954 (HER2) cell line was purchased from ATCC bioresource (ATCC® CRL-2338™). The cells were cultured in appropriate conditions using RPMI-1640 medium (Sigma-Aldrich) supplemented with 10% fetal bovine serum (FBS) (Thermo Fisher Scientific), 1% glutamine (Thermo Fisher Scientific) and 1% penicillin/streptomycin (Sigma-Aldrich). The cell line used as a control, HMEC (human mammary epithelial cells), was obtained from Thermo Fisher Scientific (catalog number A10565), and the cells were maintained in the recommended culture medium (HuMec) (Thermo Fisher Scientific) according to the manufacturer’s instructions. All of the cultures were maintained at 37°C in a 5% CO2 air atmosphere.
Patient Cohort
This study was designed and conducted in accordance with the ethical principles from the Declaration of Helsinki and participants signed informed consent forms. Approval for this study was obtained by the Institutional Ethics Committee from the Brazilian National Cancer Institute – (INCA, Rio de Janeiro, Brazil) (CAAE number: 48492915.0.0000.5274). For the validation cohort, patient samples were obtained from the National Bank of Tumors and DNA (BNT) at INCA.
miRNA Enrichment and Quantification
An enriched fraction of miRNAs from the cell lines was obtained using a miRNeasy Mini kit (Qiagen), and the quantification of miRNAs was performed with a Qubit microRNA Assay Kit (Life Technologies). Reverse transcription was performed using miScript II RT (Qiagen), according to the concentration of each sample and the manufacturer’s instructions.
Human miRNome miScript™ miRNA PCR Array
The expression of miRNA was evaluated by quantitative real-time PCR (qRT-PCR) using a Human miRNome miScript™ miRNA PCR Array, which was performed on a Rotor-Gene using a detection system that involved a miScript SYBR Green PCR Kit and a total of 12 miScript miRNA PCR Array Rotor-Discs. All of the components were acquired from Qiagen. This technique allows for the expression analysis of the 1008 mature miRNA sequences from the human miRNA genome that are abundantly expressed and best characterized in miRBase (www.mirbase.org).
To perform the PCR array, a premix of cDNA, miScript Universal Primer, QuantiTect SYBR Green PCR Master Mix, and RNase-free water was prepared according to the manufacturer’s protocol, and then it was added to a miScript miRNA PCR Array Rotor-Disc using a QIAgility instrument. Each Rotor-Disc was tightly sealed with a Rotor-Disc Heat-Sealing Film and transferred to the Rotor-Gene Q to start the PCR cycles. The cycling program had an initial step of 15 minutes at 95°C to activate the HotStart Taq DNA polymerase, which was followed by 40 cycles of three-step cycling: denaturation at 94°C for 15 seconds, annealing at 55°C for 30 seconds, and extension at 70°C for 30 seconds. Each Rotor-Disc contained different housekeeping genes for normalization by arithmetic mean and different controls. A cycle threshold (CT) value of 0.02 was used to analyze the data according to the protocol. CT values were inserted into the miScript miRNA PCR Array Data Analysis Excel Template available at http://pcrdataanalysis.sabiosciences.com/mirna. This tool automatically performed relative quantification of the expression of genes of interest in MCF-7, EVSA-T, HCC-1954 and MDA-MB-231 cell lines and compared their levels with those of HMEC cells (control lineage), using the ΔΔCT method (17).
MetaCore™ and Venn Diagram Analysis
Lists containing differentially expressed (DE) miRNAs with a fold change ≥ 2 derived from each lineage were uploaded into MetaCore™ (GeneGO Inc.) for analysis. Different analyses were performed, including a pooled analysis with data from all four cell lines. The online software allowed for functional analysis and categorization of the differentially expressed miRNAs into signaling pathways and networks (occasionally MetaCore™ do not distinguish -5p and -3p isoforms), and it yields information regarding potential miRNA targets. The Venn diagram was drafted with an online tool: http://bioinformatics.psb.ugent.be/webtools/Venn/.
Real Time Quantitative PCR
Total RNA was extracted from BC cell lines, tissues from BC patients and healthy control samples using TRIzol reagent (Invitrogen) and a RNeasy mini kit (Qiagen). Total RNA was treated with a DNase Amplification Grade I Kit (Invitrogen) to remove DNA contamination. Complementary DNA synthesis was performed with Superscript-II Reverse Transcriptase (Invitrogen) following the manufacturer’s protocol. RT-qPCR was performed using SYBR Green Master Mix (Invitrogen) in a Rotor-Gene Q (Qiagen). The following forward (Fow) and reverse (Rev) primers were used: MYB - Fow 5’ AGTCTGGAAAGCGTCACTTG 3’, Rev 5’ GTTCCATTCTGTTCCACCAG 3’; EZH2 - Fow 5’ AGAAGGGACCAGTTTGTTGG 3’, Rev 5’ GTGCACAGGCTGTATCCTTC 3’; MITF - Fow 5’ TTGGGCTTGATGGATCCTGC 3’, Rev 5’ GGCAGACCTTGGTTTCCAT 3’; SIP1 - Fow 5’ CCCTTCTGCGACATAAATACGA 3’, Rev 5’ TGTGATTCATGTGCTGCGAGT 3’; and GAPDH - Fow 5’ GTCAACGGATTTGGTCGTATTG -3′, Rev 5’ TGGAAGATGGTGATGGGATTT - 3’. The PCR cycling conditions included an initial denaturation of 95°C for 10 minutes, followed by 45 cycles of 20 seconds at 95°C, 20 seconds at 60°C, and 40 seconds at 72°C. The GAPDH mRNA levels were used as a reference of expression. The fold-expression was calculated according to the ΔΔCT method (17).
mRNA and miRNA Expression Data From The Cancer Genome Atlas
A total of 1046 cases were extracted from The Cancer Genome Atlas (TCGA) breast cancer repository at the Genomic Data Commons (GDC) Data Portal (https://portal.gdc.cancer.gov) for mRNA expression analysis. The following parameter selections were adopted: Program TCGA; Project TCGA-BRCA; Disease Type Ductal and Lobular Neoplasms; Sample Type - primary tumor or solid tissue normal; Gender Female; Data Category Transcriptome Profiling; Data type Gene Expression Quantification; Experimental Strategy RNA-Seq; and Workflow Type HTSeq – FPKM.
The same strategy was used to obtain a total of 1037 cases from TCGA-BRCA for miRNA expression analysis. The following parameter selections were adopted: Program TCGA; Project TCGA-BRCA; Disease Type Ductal and Lobular Neoplasms; Sample Type - primary tumor or solid tissue normal; Gender Female; Data Category Transcriptome Profiling; Data type Isoform Expression Quantification; Experimental Strategy miRNA-Seq; and Workflow Type BCGSC miRNA Profiling (RPM).
The TCGA-BC dataset was categorized according to the BC molecular subtypes by the cBioPortal online tool (https://www.cbioportal.org/) and TCGABiolinks (R/Bioconductor package) (18). Patients with DCIS (ductal in situ), neoadjuvant therapy, prior treatment/malignancy, inconclusive classification and Normal-like subtype data, were further excluded from all our analyses, together with their paired normal solid tissue.
mRNA Expression Data From Genotype-Tissue Expression
Healthy breast tissue samples (n=179) from the public resource Genotype-Tissue Expression (GTEx) project were sampled using the UCSC Xena online tool (https://xena.ucsc.edu). mRNA expression data was obtained by RNAseq strategy (FPKM) and compared to TCGA-BRCA data with TCGABiolinsksal (R/Bioconductor package) (19).
miRNA-mRNA Target Prediction
The prediction of miRNA-mRNA interaction binding sites was performed with the following online tools: miRTAR (http://mirtar.mbc.nctu.edu.tw/human/), miRwalk (http://mirwalk.umm.uni-heidelberg.de), Targetscan (http://www.targetscan.org/vert_72/), miRnet (https://www.mirnet.ca), miRDB (http://mirdb.org), and miRror (http://www.proto.cs.huji.ac.il/mirror/search.php). Using these tools, the 5’ untranslated region (5’UTR), coding sequence (CDS) and 3’ untranslated region (3’UTR) were investigated from selected mRNAs of interest.
Statistical Analysis
RT-qPCR experiments were performed in triplicate, and the expression data were analyzed with GraphPad Prism® v.8 software (GraphPad) and presented as the mean ± SD. Patient expression data were categorized in quartiles (low - 25% downregulated; high - 25% overexpressed) and Kaplan-Meyer analysis was used to access death risk (overall survival). Data for patients who did not present complete information regarding days-to-death/days-to-follow-up or were followed fewer 30 days were removed from the study. Statistical analyses (ANOVA for expression data and Gehan-Breslow-Wilcoxon test for overall survival) were performed using GraphPad Prism® v.8 software (GraphPad). P-values (p) <0.05 were considered statistically significant (*p < 0.05, **p < 0.01, ***p < 0.001, and ****p < 0.0001).
RESULTS
In Vitro Breast Cancer Models Exhibit a Shared miRNA Profile Based on miRNome
To obtain the miRNome profiles from the BC cell lines used in our study (MCF7, EVSA-T, HCC-1954 and MDA-MB-231), we performed a global analysis of the 1008 miRNAs in the miRNome PCR array. According to our results, the following number of miRNAs was identified as DE: 449 miRNAs in MCF7 (221 downregulated, 228 upregulated), 459 in EVSA-T (152 downregulated, 307 upregulated), 486 in HCC-1954 (461 downregulated, 25 upregulated) and 437 in MDA-MB-231 (100 downregulated, 337 upregulated). The miRNAs levels of all BC cell lines were compared to the normal cell line HMEC, which was used as a control, with a ≥ 2-fold-change as a cut-off (Figure 1A). The DE miRNAs from each cell line with their respective fold-change are listed in Tables S1–S4. To highlight the potential miRNAs involved in BC carcinogenesis, a Venn diagram was drafted. From this diagram, we identified 110 common differentially expressed miRNAs when comparing the BC cell lines analyzed in our study with the HMEC cell line. The diagram also identified miRNAs exclusive to each subtype (Figure 1B).
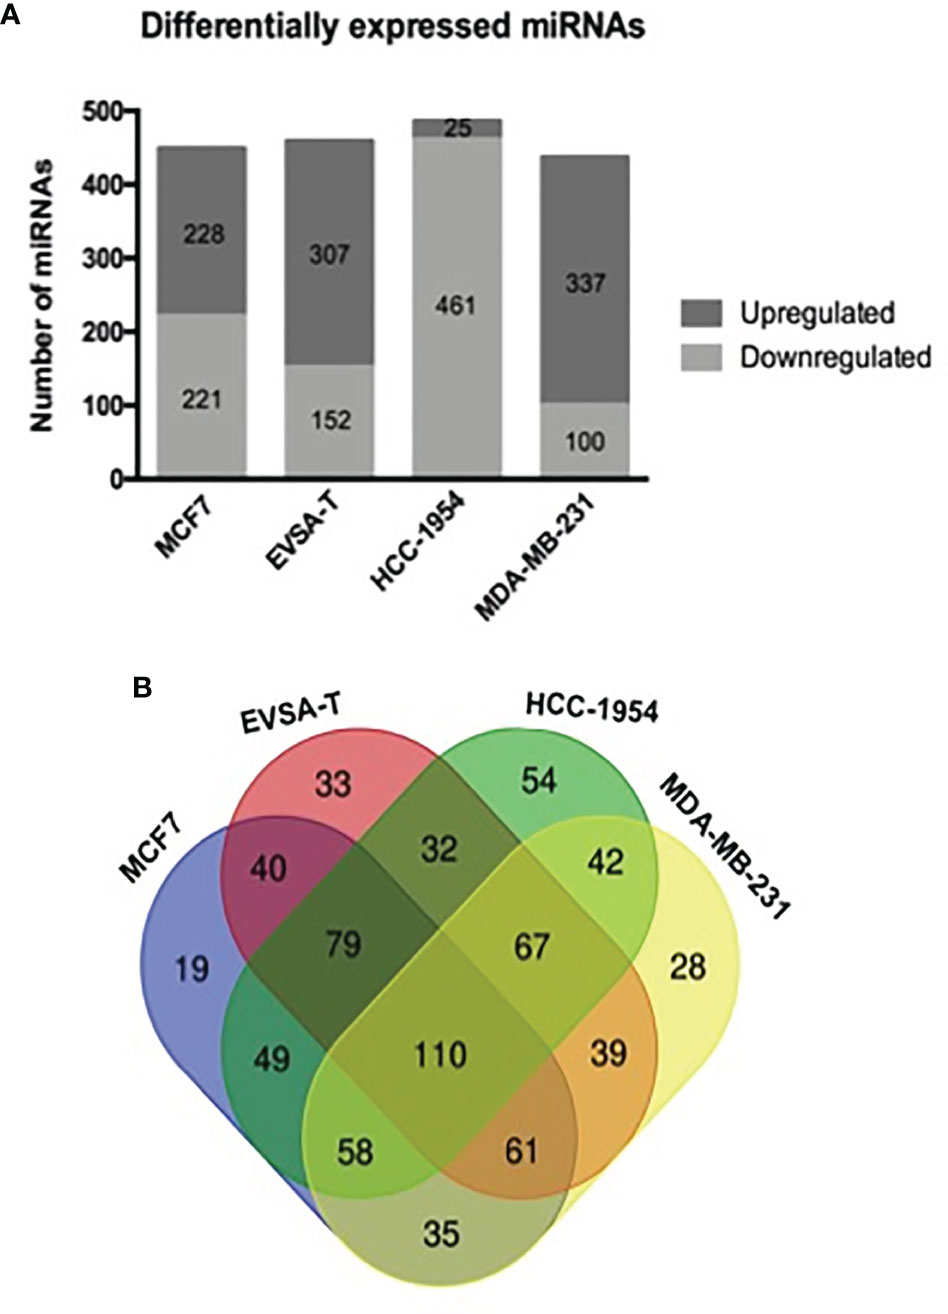
Figure 1 Differentially expressed miRNAs in human breast cancer cell lines. (A) Number of miRNAs obtained as differentially expressed by RT-qPCR analysis of 1008 miRNA levels from miRNome PCR array. SnoRNAs/snRNAs were used as housekeeping genes for normalization. Positive and negative controls were also evaluated in the array. Quantification was performed by the ΔΔCT method. The results were normalized relative to the HMEC cell line. (B) A Venn diagram drafted from http://bioinformatics.psb.ugent.be/webtools/Venn, showing the total number and overlapping miRNAs identified as differentially expressed by quantitative PCR array from the following breast cancer cell lines: MCF7, EVSA-T, HCC-1954 and MDA-MB-231 (normalized relative to the HMEC cell line).
As our goal was to understand the signaling and pathways related to BC and to correlate miRNA expression with BC subtypes, we performed an in silico analysis using these 110 common DE miRNAs. Cell lines were designated with numbers (1 to 4) according to their subtypes (MCF7, EVSA-T, HCC-1954 and MDA-MB-231) to facilitate the analysis. MetaCore™ provided an overview regarding the 10 most relevant pathway maps from our data (Table 1). Some of the pathways are well-known in BC, such as TGFβ signaling and epithelial-to-mesenchymal transition (EMT), as well as pathways involved in altering cell proliferation, survival, migration and angiogenesis. Moreover, epigenetic alterations mediated by miRNAs also appeared among the top 10 altered pathways.
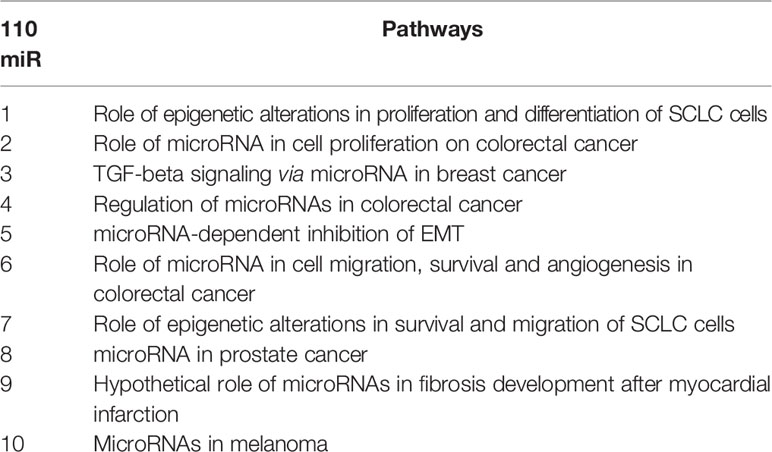
Table 1 Top 10 pathway maps from 110 common miRNAs in the BC miRNome.
Particular miRNAs appeared in more than one pathway map; e.g., miRNA-200b, miRNA-497-5p and miRNA-34b-3p, confirming that they are important and the most studied miRNAs. The miRNAs that may be related to proliferation, cell survival and EMT pathways were differentially expressed in the in vitro models. As shown, we observed that miR-497-5p and miR-95 (Figure S1) were upregulated in BC, while miR-205-5p was downregulated (Figure S2). As shown in Figure S2, we observed a shift in miRNA expression; e.g., miR-200a, miR-200c, miR-141 and miR-429. These were upregulated in less aggressive cell lines and downregulated in more aggressive cell lines, implying the differential regulation of the SIP1 gene.
Interaction maps (networks) generated by MetaCore™ were also based on described and validated interactions, allowing identification of known relevant targets in BC, such as PTEN (Figure S3A). Nevertheless, the interaction map of miR-205-5p (Figure S3B) showed that this miRNA might be directly epigenetically regulated by the lncRNA LINC-ROR and indirectly regulated by EZH2, which has an important role in chromatin remodeling.
MYB and EZH2 Are Potential Targets Identified in the Breast Cancer miRNome
The miRNA targets first identified by MetaCore™ were targets commonly described in cancer studies, such as p53 and c-myc, among others. Moreover, the pathways addressed genes that are regulated and that may regulate miRNA expression. Nevertheless, when we examined these pathways more closely, we were able to address some poorly investigated (direct and indirect) targets in BC, such as SNX1. The following targets were selected based on miRNA pathway maps and networks from MetaCore™ analysis, together with chip array data (BC patients) from our previous work (data not shown) (20): MYB, EZH2, MITF, SNX1, and SIP1. Although the latter is recognized as relevant for EMT, and for this matter is relevant in BC, the ultimate question here is whether this gene may be regulated by miRNAs other the well-described ones. We performed a quantitative analysis in an independent cohort of healthy control donors (n=5) and BC molecular subtypes (total n=28). As shown in Figure 2, most of the gene profiles were upregulated in BC subtypes, suggesting that they are relevant in BC and are potential miRNA targets. Moreover, the expression of these genes was investigated using the TCGA dataset. The TCGA-BRCA consortium accounts for 1098 cases from which 1046 were extracted according to the applied filters. A total of 106 normal solid tissues (NST - adjacent tissue) were obtained and 975 primary tumors were categorized by BC molecular subtypes, as follows: 527 from LUMA, 193 from LUMB, 80 from HER2 and 175 from BASAL (TN). Healthy breast (normal breast - NB) samples from the GTEX dataset were also evaluated (n=179). As shown in Figure 3, there is a correspondence in expression levels for MYB and EZH2 among BC subtypes when compared to NST and NB. Moreover, using the same dataset, overall survival analysis from quartiles showed that MYB and EZH2 overexpression are related to survival rate (Figure 4), with the latter statistically significant, which supports their relationship in BC subtypes.
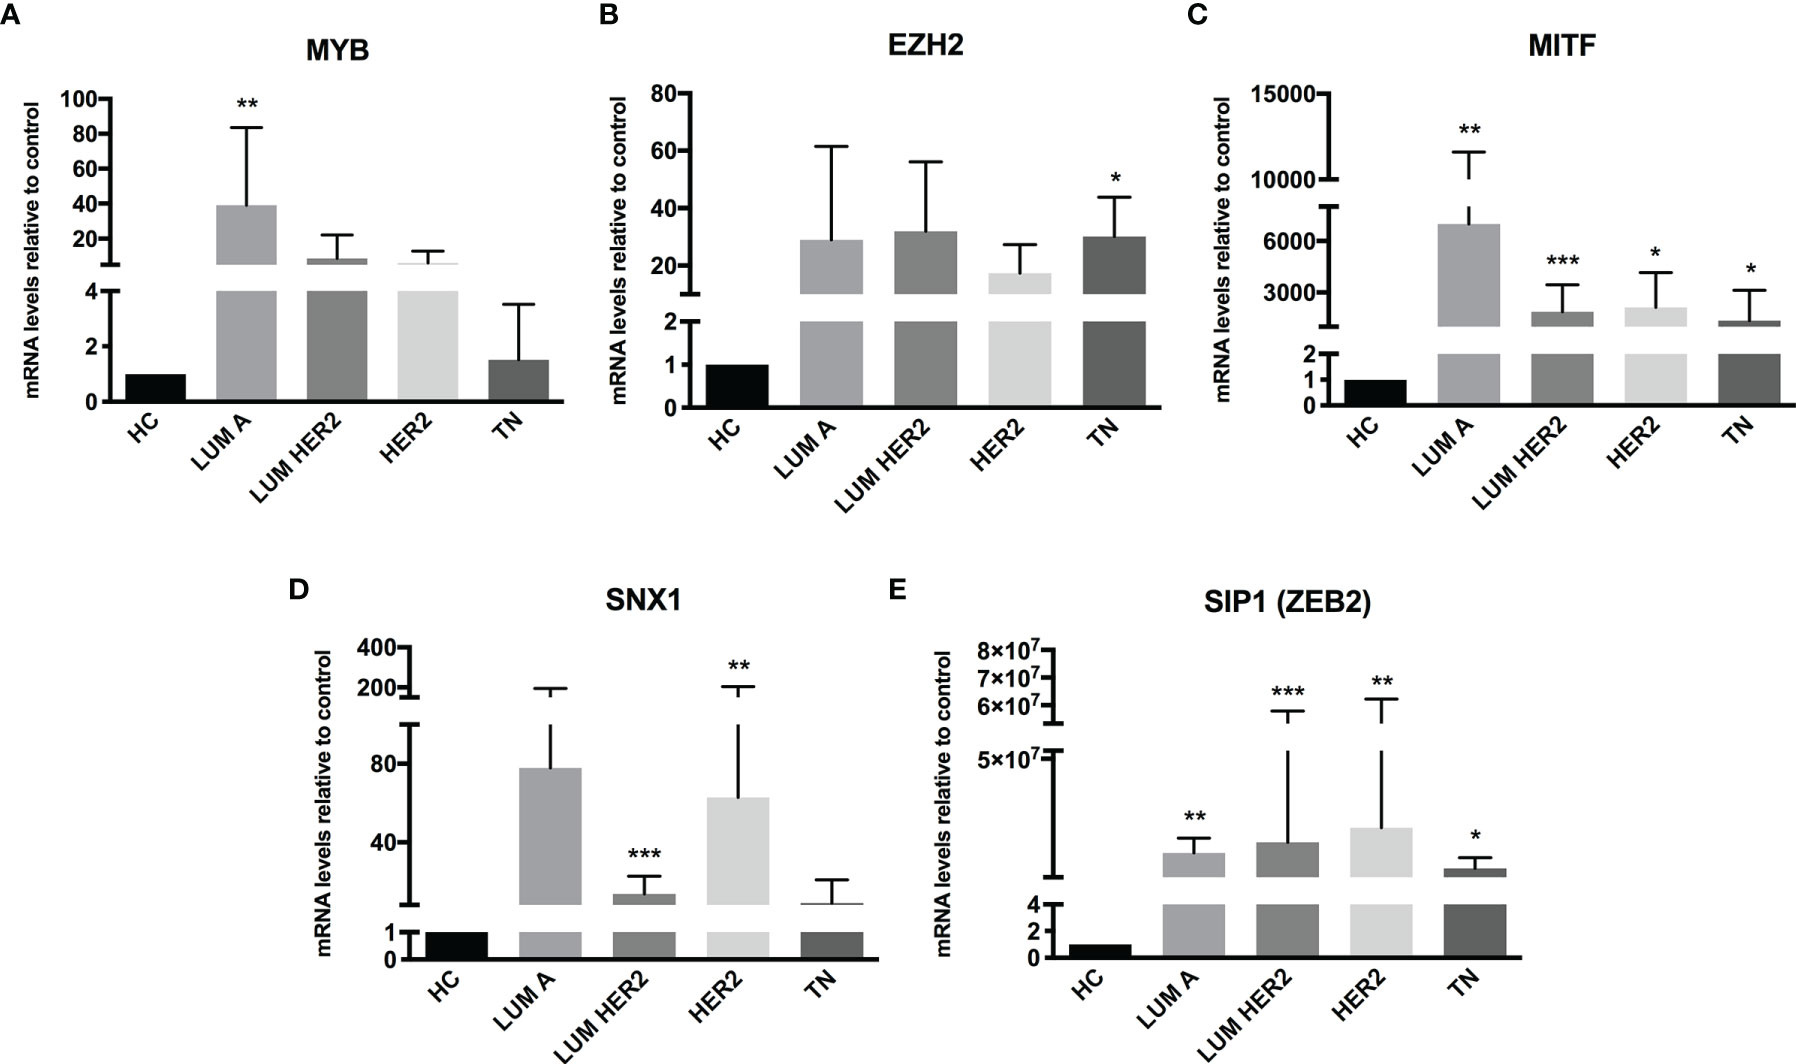
Figure 2 Putative miRNA targets are differentially expressed in BC patients. RT-qPCR analysis of miRNA targets in BC patients. The mRNA level of (A) MYB, (B) EZH2, (C) MITF, (D) SNX1 and (E) SIP1 (ZEB2) was assessed by raw expression values normalized to GAPDH expression. Healthy donors were used as healthy controls (HC n = 5). Quantification was performed by the ΔΔCT method. Statistical differences are related to the HC group (LUM A n = 5; LUM HER2 n = 12; HER2 n = 7; TN n = 4). HC, Healthy Control; TN – Basal. *p < 0.05, **p < 0.01 and ***p < 0.001.
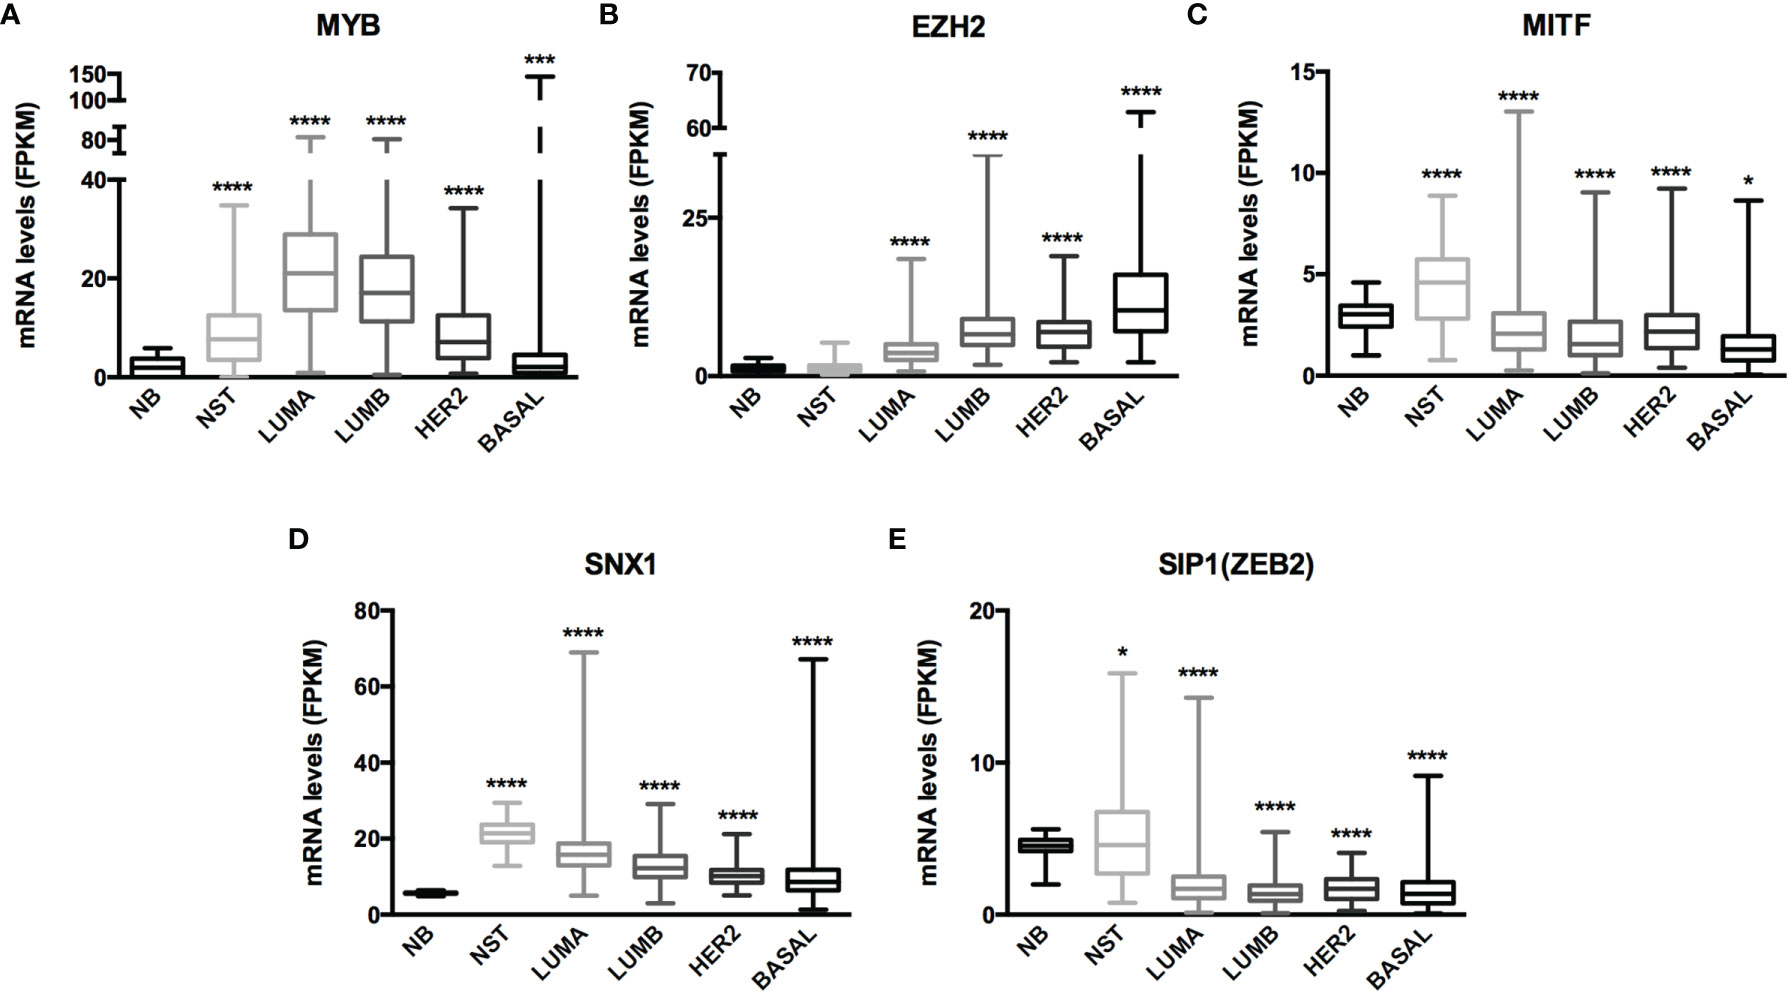
Figure 3 mRNA expression from GTEx and TCGA-BRCA dataset evidenced MYB and EZH2 as miRNome targets. Histogram analysis of miRNAs targets from the GTEx/TCGA-BRCA dataset. We collected (A) MYB, (B) EZH2, (C) MITF, (D) SNX1 and (E) SIP1(ZEB2) mRNA levels (FKPM) from NB, NST, LUMA, LUMB, HER2 and BASAL subtypes. Statistical differences are related to the NB group. NB, Normal Breast; NST, Normal Solid Tissues. *p < 0.05 and ****p < 0.0001.
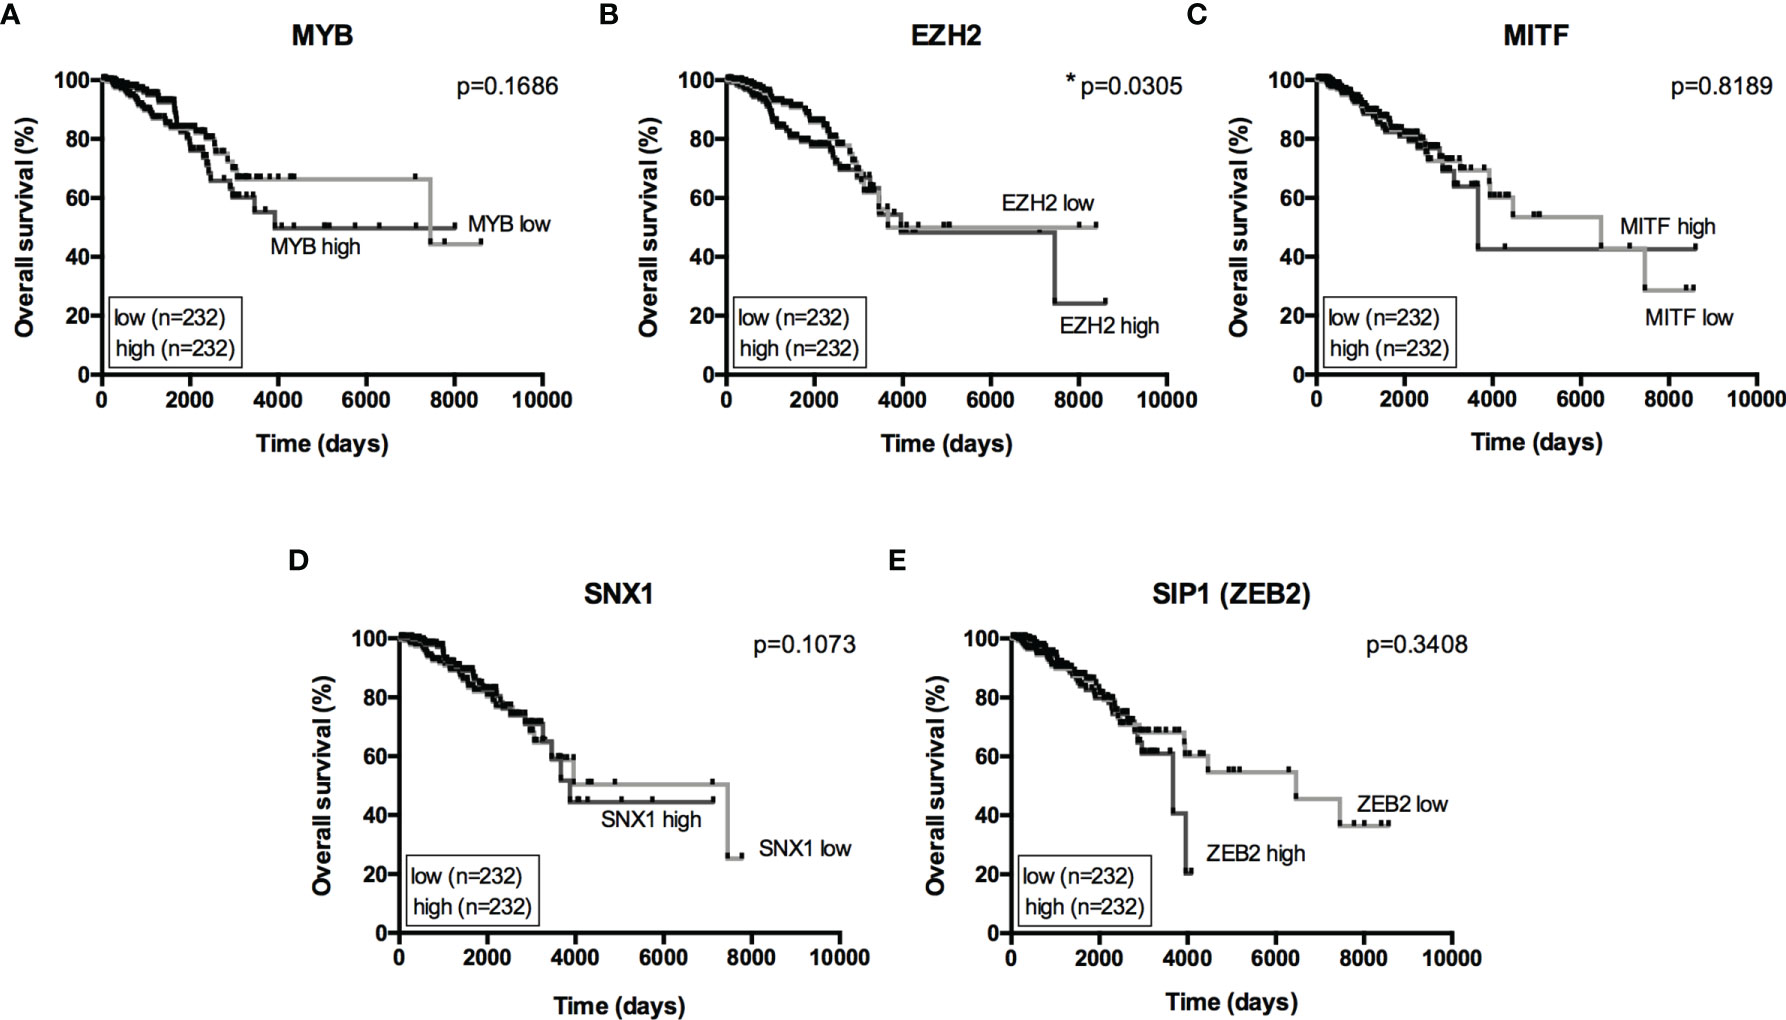
Figure 4 Overall Survival analysis from miRNome targets. Kaplan-Meier curves for overall survival in the TCGA-BRCA dataset with low- and high-expression of (A) MYB, (B) EZH2, (C) MITF, (D) SNX1 and (E) SIP1(ZEB2). Expression levels from LUMA, LUMB, HER2 and BASAL subtypes were determined as low or high based on quartile analysis. Statistical differences show poor overall survival (higher risk) for patients with a specific mRNA expression. *p < 0.05.
A Set of 7 miRNAs May Be Related to MYB and EZH2 Expression in Breast Cancer
The Venn diagram pointed 110 DE miRNAs as common to all molecular subtypes and for this reason as potentially directly involved in BC tumorigenesis. However, their fold change varied among cell lines. This aspect is extremely relevant because, even though we analyzed the same miRNAs for pathway and interactome network analysis, fold change differences highlight a potential signature regarding BC subtypes. Therefore, we filtered the 110 DE miRNA list and selected those miRNAs upregulated and downregulated in all the cell lines and miRNAs whose expression shifted according to subtypes. As shown in Table S5, 8 miRNAs were upregulated in all BC models; 19 were downregulated in all BC models and 27 miRNAs presented initial (e.g., MCF7 cell line) up- or downregulation then later exhibited down- or upregulation (e.g., MDA-MB-231 cell line). The expression of these 54 miRNAs was also investigated in the TCGA dataset using a total of 97 normal solid tissues and 960 primary tumor samples. These primary tumors were also categorized by BC molecular subtypes as follow: 524 from LUMA, 189 from LUMB, 79 from HER2 and 168 from BASAL (TN). As GTEX data does not separate -5p and -3p isoforms, we did not analyze NB samples for miRNAs. As shown in Figure 5, the expression levels of 15 miRNAs corroborated with our in vitro models for all BC subtypes, regardless of upregulation, downregulation or shift in expression (Figure S4). Although only miRNA-874 exhibited significant differences in overall survival rates from low/high-expressed quartiles (Figure 6), most Kaplan-Meyer curves correlated with gene expression e.g., miR-205-5p, miR-382-5p, miR-487a (low expression - worse survival rate) and miR-497-3p (high expression - worse survival rate). These 15 miRNAs were also analyzed via in silico prediction of the potential targets evidenced by BC patient quantitative analysis - MYB, and EZH2. For this analysis, 6 online tools were used for miRNA-mRNA interaction for the investigation of validated and predicted sites. Our results showed that most predicted sites are localized in the CDS; however, sites in the 5UTR and 3UTR were also identified. At least one predicted binding site was found for 14 miRNAs; only miR-376c-3p did not present any consensus-binding site in both MYB and EZH2 transcripts (NM_001130173 and NM_004456, respectively) (Table 2). Most miRNA binding sites were predicted for mRNA sequences but validated sites were also observed in our analysis. For MYB, 4 miRNAs presented 3UTR binding sites identified by at least 2 types of software (miR-1271-5p, miR-130a-5p, miR-134 and miR-497-3p). The latter is upregulated in our study, so it does not correspond with MYB expression. For EZH2, miR-138-5p had binding sites identified in 5 software packages, and most miRNAs with 3UTR binding sites were downregulated in BC subtypes (miR-455-3p, miR-487a and miR-487b). The exception is miR-95; further, miR-497-3p levels does not correspond to EZH2 expression.
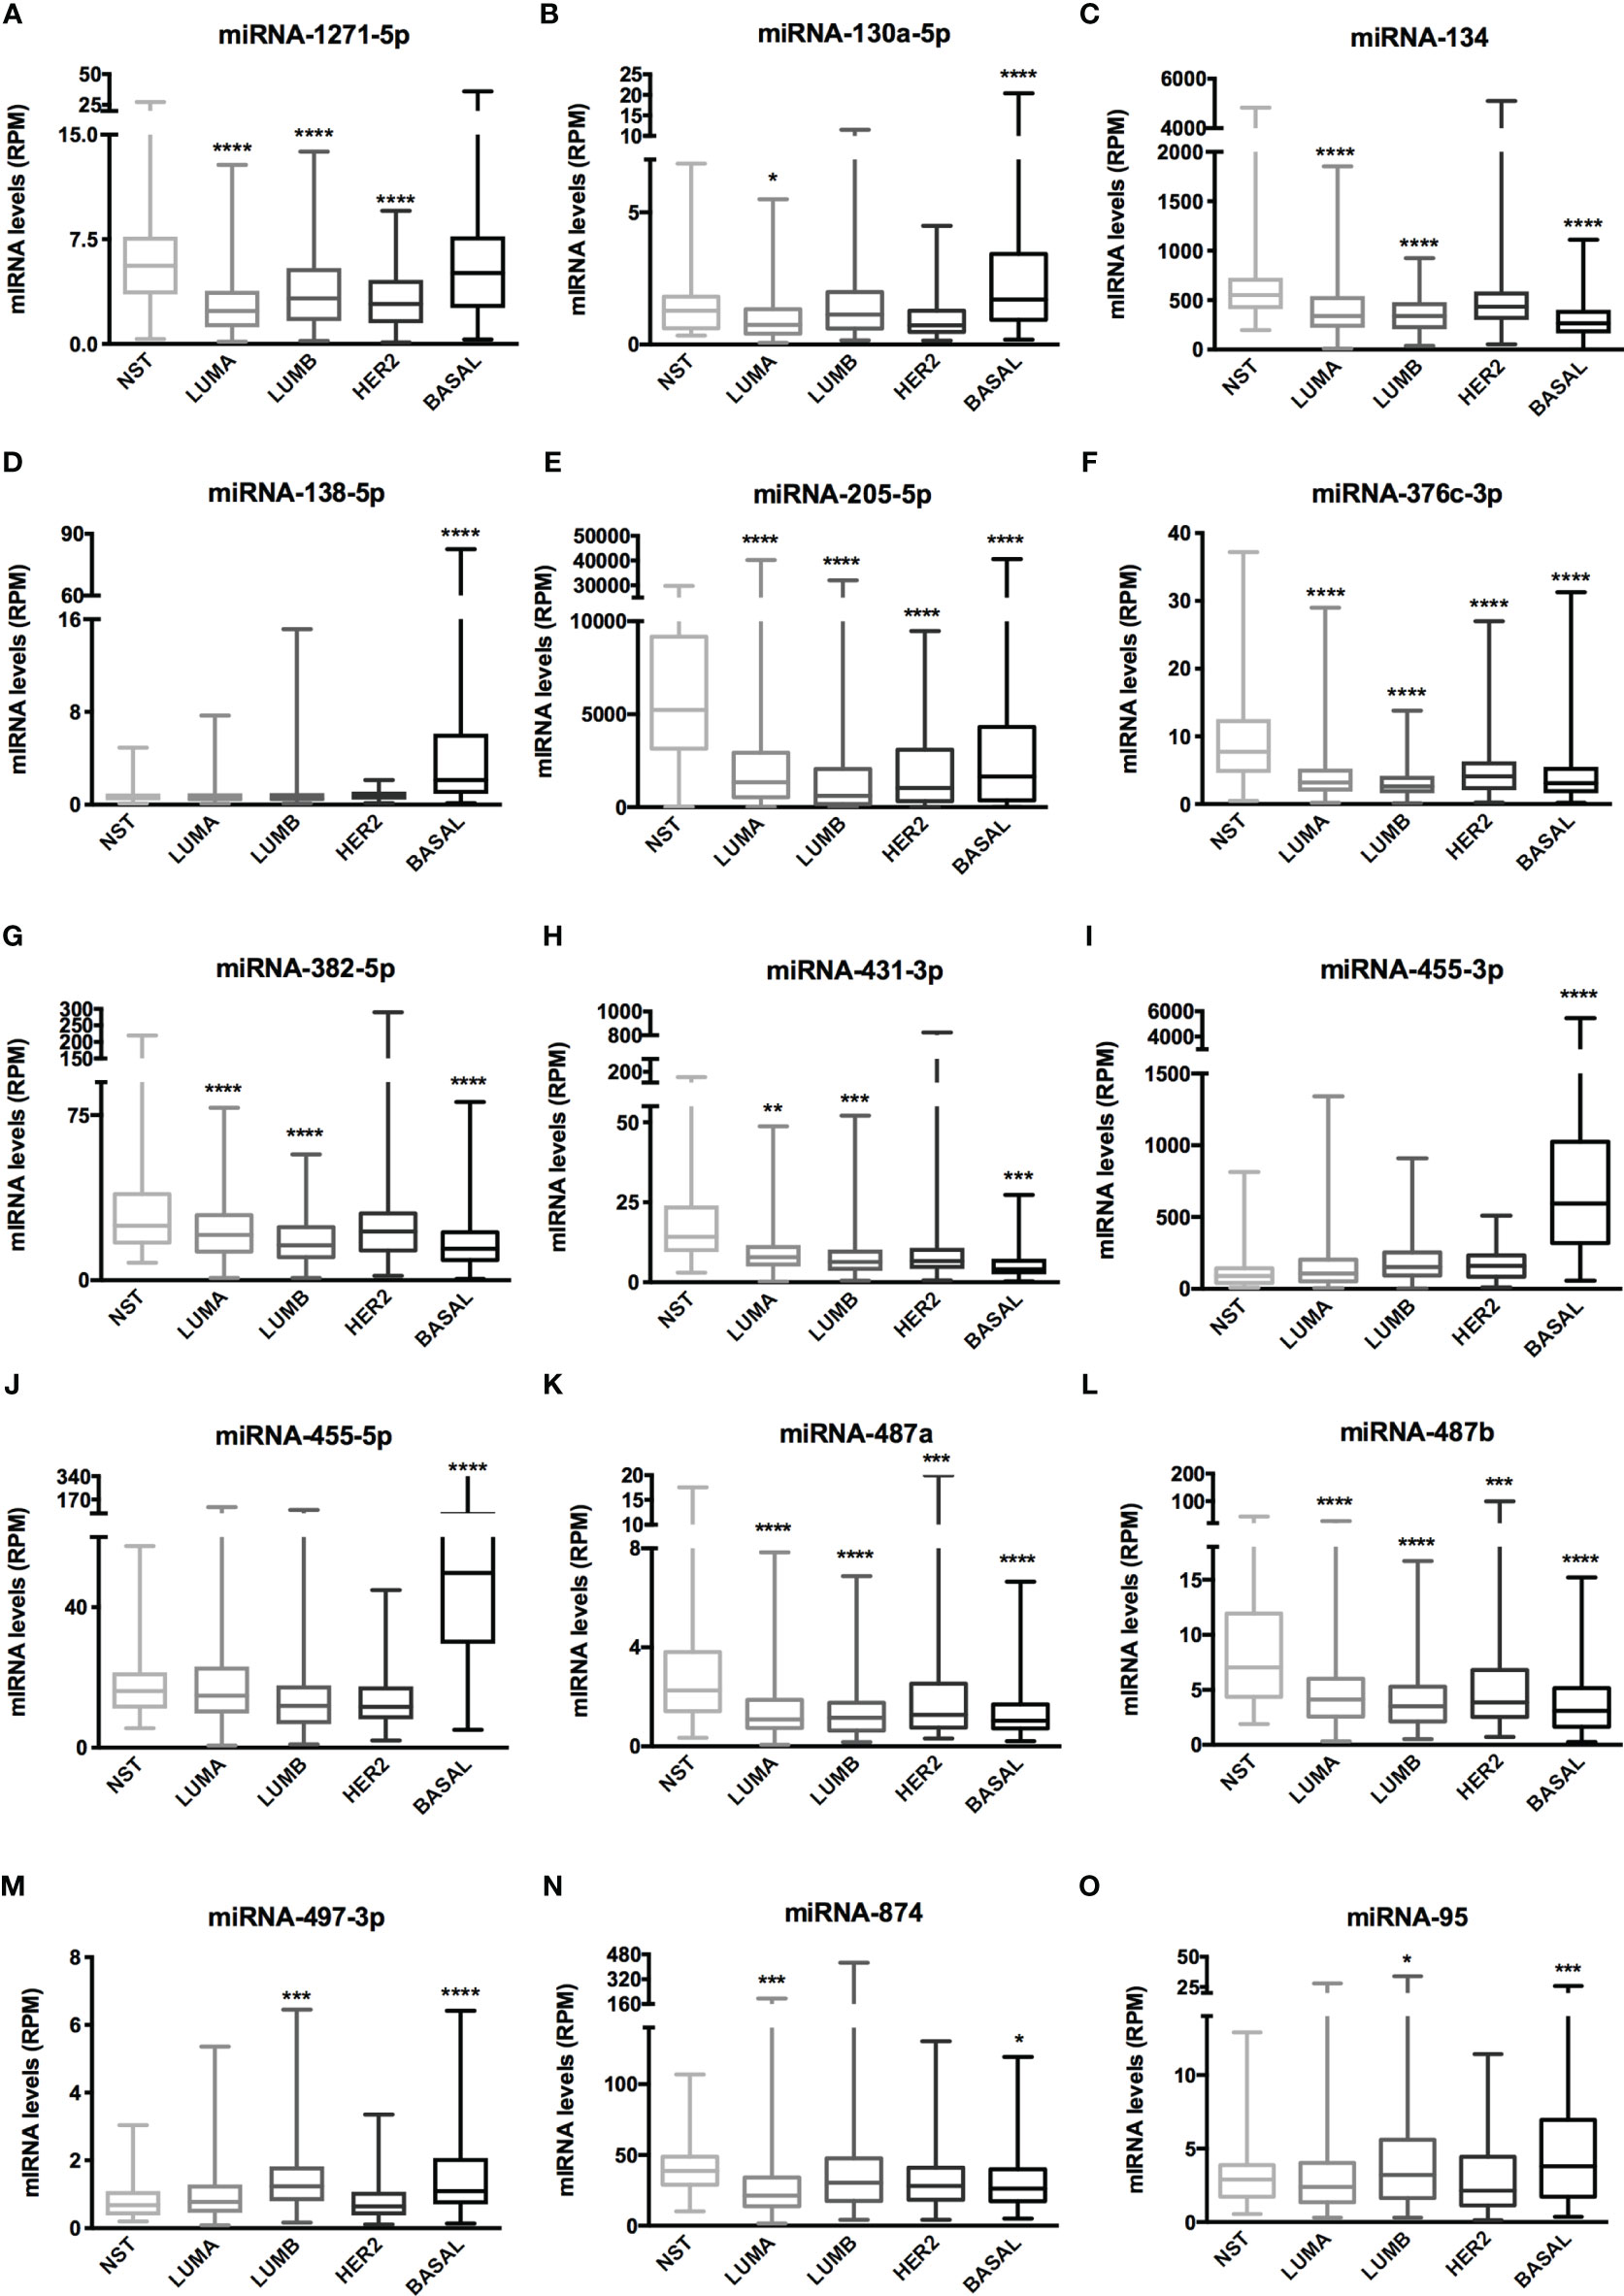
Figure 5 miRNA expression of 15 miRNAs related to BC aggressiveness from TCGA dataset. Histogram analysis of miRNAs targets from the TCGA-BRCA dataset. (A) miRNA-1271-5p, (B) miRNA-130a-5p, (C) miRNA-134, (D) miRNA-138-5p, (E) miRNA-205-5p, (F) miRNA-376c-3p, (G) miRNA-382-5p, (H) miRNA-431-3p, (I) miRNA-455-3p, (J) miRNA-455-5p, (K) miRNA-487a, (L) miRNA-487b, (M) miRNA-497-3p, (N) miRNA-874, (O) miRNA-95. We collected miRNA expression data (RPM) of interest from NST, LUMA, LUMB, HER2 and BASAL subtypes. Statistical differences are related to NST group. NST, Normal Solid Tissues. *p < 0.05, **p < 0.01, ***p < 0.001, and ****p < 0.0001.
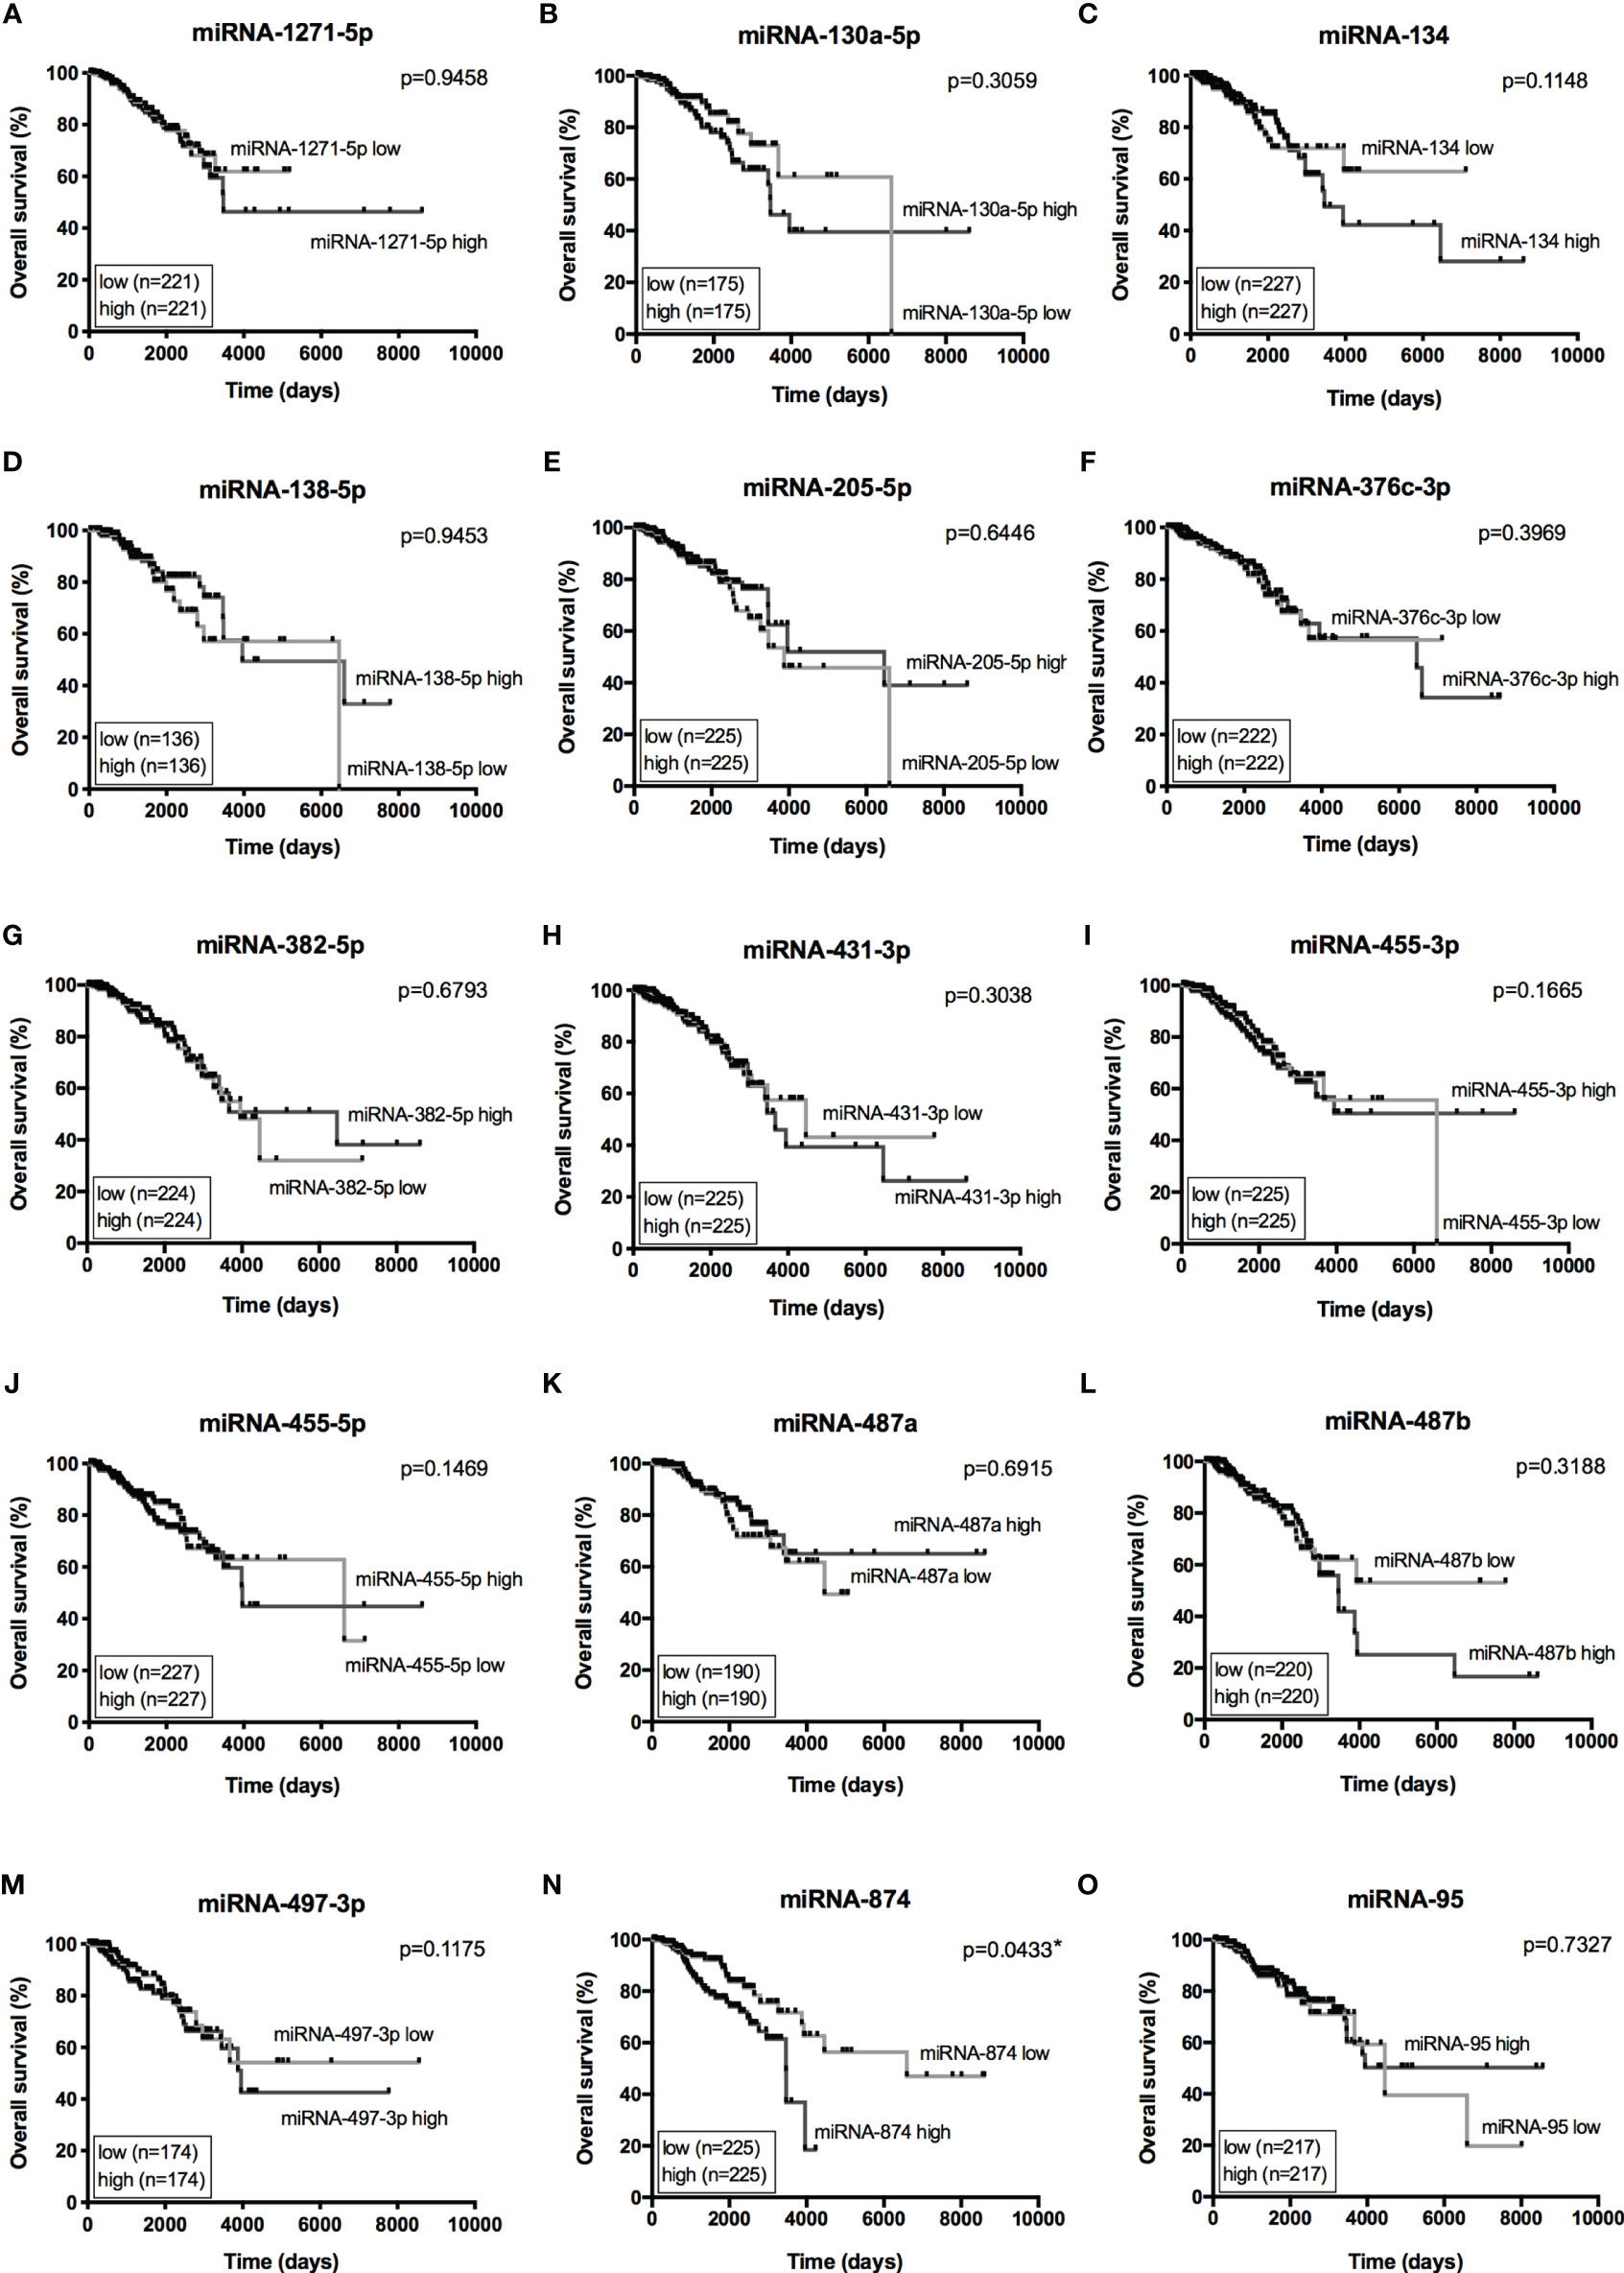
Figure 6 Overall Survival curves from 15 miRNAs of interest. Kaplan-Meier curves for overall survival of TCGA-BRCA dataset with low- and high-expression of 15 miRNAs of interest. (A) miRNA-1271-5p, (B) miRNA-130a-5p, (C) miRNA-134, (D) miRNA-138-5p, (E) miRNA-205-5p, (F) miRNA-376c-3p, (G) miRNA-382-5p, (H) miRNA-431-3p, (I) miRNA-455-3p, (J) miRNA-455-5p, (K) miRNA-487a, (L) miRNA-487b, (M) miRNA-497-3p, (N) miRNA-874, (O) miRNA-95. Expression levels from LUMA, LUMB, HER2 and BASAL subtypes were determined as low or high based on quartile analysis. Statistical differences show poor overall survival (higher risk) for patients with a specific miRNA expression (high or low). *p < 0.05.
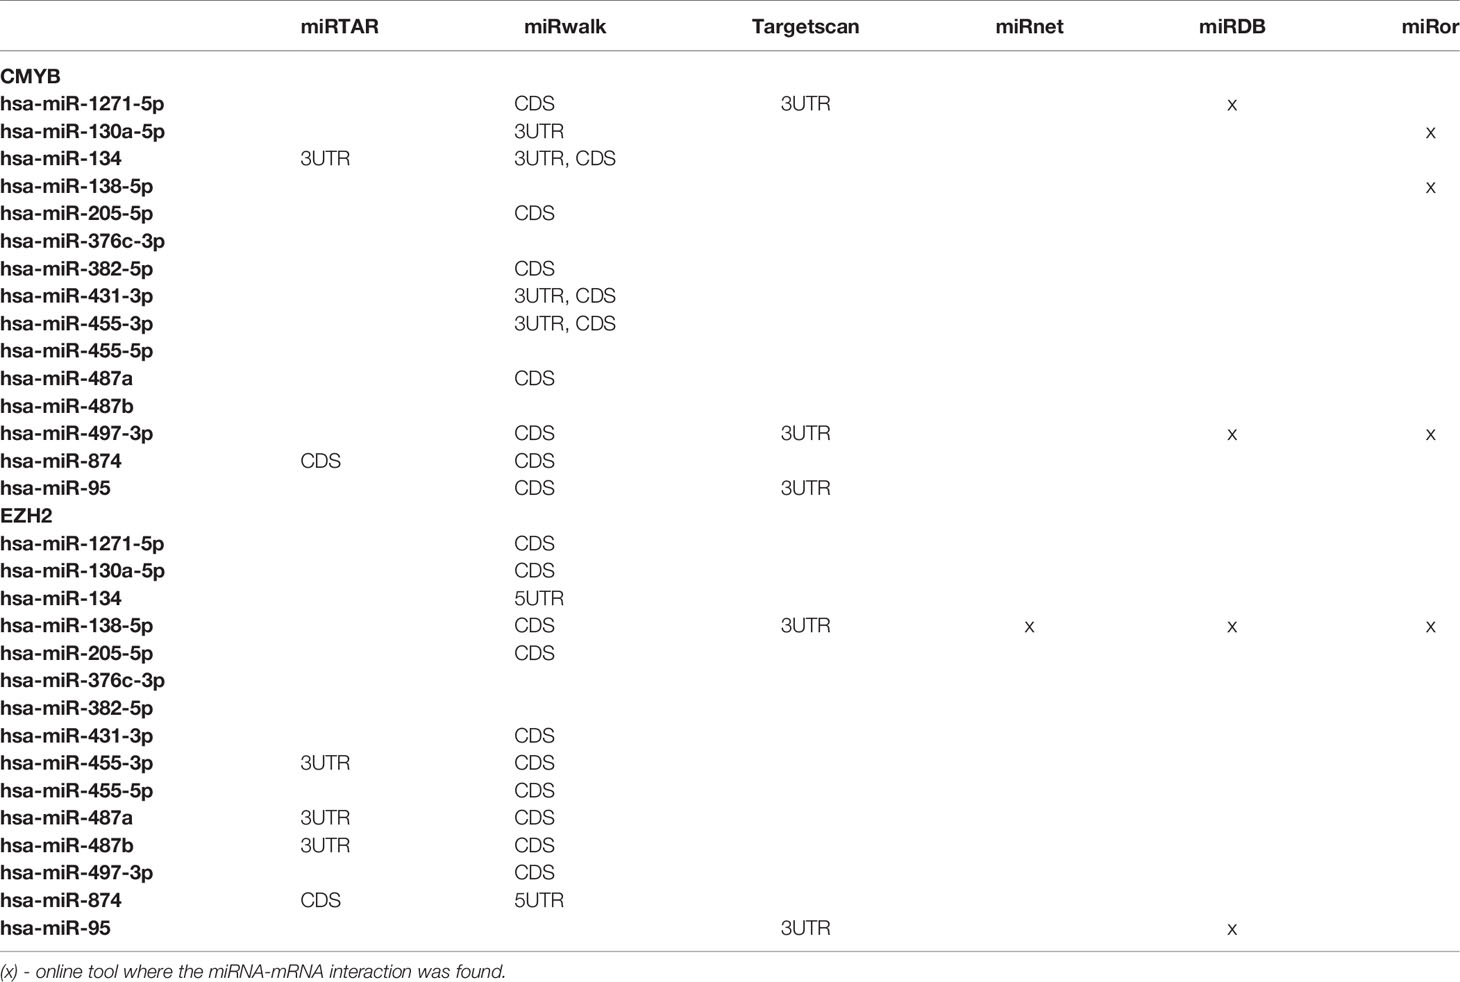
Table 2 Prediction analysis of miRNA-target interaction from MYB and EZH2 mRNAs.
Therefore, based on our results, we can suggest a set of 7 miRNAs investigated in BC that may act in balance to promote tumorigenesis through targeting MYB (miR-1271-5p, miR-130a-5p and miR-134) and EZH2 (miR-138-5p, miR-455-3p, miR-487a and miR-487b).
Discussion
The attempts to better understand the mechanisms involved in cancer initiation, progression and resistance are never-ending. The knowledge acquired so far has allowed little translation from basic research to clinical medicine; however, the information has provided improvement in patient prognosis, which leads to and motivates further understanding of cancer mechanisms, until the long sought-after goal of personalized medicine is achieved (18).
In this context, the pursuit of molecules capable of adding information to current data that are applicable as diagnostic, prognostic, disease monitoring and resistance markers is what drives large-scale studies on cancer today (21, 22). Therefore, miRNAs are highly attractive because of their role in transcriptional and translational regulation. MiRNA research implies a high level of complexity regarding the molecular biology of miRNAs, as one target can be regulated by several miRNAs and the same miRNA may regulate several targets. Because of this complexity, the major reports in the literature focus on one specific miRNA or a family of miRNAs in a given query. As a result, the global study of miRNAs or the miRNome need to be the focus of more study, especially as the understanding of global modifications in cell biology may lead to or be involved in cancer. Therefore, the aim of this study was to perform miRNome profiling of BC using in vitro models that correspond to the four major molecular subtypes to identify the signaling and pathways related to BC. In parallel, our goal was to reveal novel miRNAs (and targets) that could be associated with BC tumorigenesis.
With a PCR array approach, we identified more than 400 DE miRNAs among BC subtypes. As the amount of data was massive, we executed in silico analysis with Mecatore™ software to categorize the 110 common differentially expressed miRNAs among the cell lines to better understand their role in BC tumorigenesis. In a general analysis where DE miRNAs from each cell line were uploaded and evaluated alone, the top 10 pathway maps identified by MetaCore™ varied little among BC subtypes (data not shown). The same pathways were obtained from enrichment analysis of the 110 miRNAs, demonstrating that they were in fact associated with the identified signaling molecules and pathways.
Most of the miRNA pathway maps were previously described in colorectal and melanoma tumors, meaning that the same proposed regulation could be occurring in a BC context, but it should be validated to confirm such regulation. This finding highlights the lack of omics studies on miRNAs in BC compared to studies of other tumor types. Moreover, well-described miRNAs in cancer were identified in our study, ratifying their importance in tumorigenesis. To reveal more about the proposed regulation by MetaCore™, specific targets were selected based on previous chip array analysis (data not shown). Quantitative analysis from our targets in BC patients together with TCGA-BRCA evaluation (mRNA expression and overall survival) identified MYB and EZH2 as relevant for the investigation of miRNA-mRNA binding sites. Higher levels of EZH2 are correlated with a higher risk, which makes sense because upregulation of EZH2 was more pronounced in the basal subtype. For MYB, higher levels are seen in luminal subtypes; therefore, lower levels correspond more with higher risk (although not statistically). Although SNX1 was upregulated among BC subtypes when compared to NB, as the NST cohort also exhibited upregulation of SNX1 mRNA levels, this gene was excluded from further analysis.
Comparison of common DE miRNAs suggested that the difference in fold change, determined through in vitro models, might correspond to disease aggressiveness, an important feature in BC. In silico comparison of DE miRNAs enabled a better visualization of this difference, and fold change analysis directed our attention to 54 particular miRNAs. Again, analysis from TCGA-BRCA showed that most miRNA expression matched some particular (s) subtype (s), and they must have a biological implication for them. However, as our focus was to identify differentially expressed miRNAs among BC subtypes, we filtered 15 miRNAs whose quantitative expression corresponded with the identified ones in our in vitro models. This choice will also be beneficial for further studies, where models for functional analysis investigation will be needed. Overall survival was also investigated for these 15 miRNAs. The best approach to understand the impact on overall survival would be to perform the same analysis separating each BC subtype. However, the small amount of some subtypes (e.g., HER2), and the lack of some miRNA expression data could negatively impact with the results.
With a clear subset of miRNAs, miRNAs-mRNAs interactions were used to demonstrate potential regulation of selected genes, and together with all of the applied analyses (MetaCore™ analysis, miRNAs-mRNAs binding sites prediction analysis, miRNA expression and targets expression), miR-1271-5p, miR-130a-5p and miR-134 were highlighted as regulators of MYB. miR-138-5p, miR-455-3p, miR-487a and miR-487b were, identified as regulators of EZH2 based on our results.
In colorectal cancer, miR-1271-5p was shown to act as an OncomIR (23) by downregulating NOXA, resulting in a cell proliferation decrease and promotion of apoptosis. Nevertheless, its expression corroborates with our findings in most investigated tumors and it works as a tumor suppressor through different mechanisms and targets in hepatocellular cancer (24, 25), multiple myeloma (26, 27), ovarian cancer (28, 29) and pancreatic cancer (30). Its role in BC has not yet been addressed. A different scenario presents for miR-130a-5p. This miRNA has been recently reported in BC. Its downregulation was reported in patient plasma, and it was correlated with, among others, hormone receptors (31), corroborating our findings as lower expression of this miRNA was observed in luminal tumors. Moreover, its downregulation has been implicated by circVAPA sponging (32) in patient samples and BC cells. The same findings were obtained for other tumor types (33–35), where lncRNAs were investigated as competing endogenous RNA and therefore sponge miR-130a-5p with consequent downregulation. However, its relationship with MYB in BC still needs clarification. Of the potential regulators for MYB, miR-134 is the most studied. Its role as a tumor suppressor has been investigated in several tumors (36). In BC, it has been reported to play a role in drug response, cell proliferation, migration, and invasion (37, 38) through several targeted pathways, such as STAT5B, KRAS, BDNF/TrkB; nevertheless, MYB has not been explored as a potential target of miR-134.
As for EZH2 potential regulators, miR-138-5p was the most consistent in miRNA-mRNA prediction from all analyzed miRNAs. Indeed, this regulation has been reported recently in different contexts (39, 40), including ovarian cancer (41) and prostate cancer (42). For BC, this miRNA was also found to be downregulated by Zhao and coworkers, corroborating our findings; it inhibits cell migration/invasion by targeting RHBDD1 (43). Nevertheless, miR-455-3p has not been reported as a regulator of EZH2. There are only 3 reports for BC with distinct roles for this miRNA. Li and coworkers reported overexpression in TNBC cell lines (44); Guo (45) and Zeng (46) reported that miR-455-3p was downregulated in BC patients, corroborating with our findings. In other cancer types, this miRNA has also been described as a tumor suppressor, supporting our quantitative findings. There are 3 studies on miR-487a in BC. Again, one reports that this molecule is an OncomIR (47), and the other 2 studies described this miRNA as a tumor suppressor (48, 49), which is consistent with what was presented in our work. This highlights the need for further studies in BC, as this miRNA has also been reported to be a tumor suppressor in other solid tumors. There is one study on miR-487b in BC, and it reports the regulation of EZH2 via miR-487b by overexpressing the 3UTR region of EZH2 in BC cell lines to identify its target mRNAs (50). This finding is consistent with our data and justifies further studies to evaluate this regulation in disease.
As shown, most of these miRNAs were not reported/described in BC. They may play a role in cancer hallmarks related to BC together with well-studied ones, such as miR-200, miR-34, and miR-429 (among others), which were also identified in our study. The difficulty and complexity of studying miRNAs highlight their potential relevance and the essential need for further validation. A subset of nonreported miRNAs in BC from our data (1/3 from 110 common miRNAs) indicates the amount of effort necessary to elucidate the role of miRNA in BC. It is important to address that the proposed regulation presented in this study may be a combination of regulation by multiple miRNAs. Nevertheless, the screening of potential targets highlights the most important miRNAs as indicated by their differences in fold change among BC cell lines, which is confirmed in a larger cohort of patient samples.
The approach applied in this study presented signaling molecules and pathways involved in BC and revealed novel interactions and potential regulation regarding miRNAs in BC. Moreover, the identification of in silico targets, such as MYB and EZH2, suggests that less studied miRNAs could be potential players in BC subtypes.
Data Availability Statement
The original contributions presented in the study are included in the article/Supplementary Material. Further inquiries can be directed to the corresponding author.
Ethics Statement
The studies involving human participants were reviewed and approved by Institutional Ethics Committee from the Brazilian National Cancer Institute - INCA. Committee number: CAAE: 48492915.0.0000.5274. The patients/participants provided their written informed consent to participate in this study.
Author Contributions
SC performed miRNA enrichment, validation experiments, in silico and statistical analysis, drafted the manuscript, participated in the study design and contributed intellectual content. FL extracted and processed the miRNAs and mRNAs expression data from TCGA dataset and revised the manuscript final version. CP supported the patients’ selection, and contributed intellectual content. TB performed cell culture and miRNome experiments. RB supported the in silico analysis and contributed intellectual content. EA conceived of the study and its design and coordination, provided the financial support, helped to draft the manuscript and critically revised the manuscript for intellectual content. All authors contributed to the article and approved the submitted version.
Funding
This work was supported by FAPERJ (E-26/110.122/2013; E-26/110.664/2012). The obtained funding allowed the purchase of consumables and reagents necessary to carry out the experiments related to this study.
Conflict of Interest
The authors declare that the research was conducted in the absence of any commercial or financial relationships that could be construed as a potential conflict of interest.
Publisher’s Note
All claims expressed in this article are solely those of the authors and do not necessarily represent those of their affiliated organizations, or those of the publisher, the editors and the reviewers. Any product that may be evaluated in this article, or claim that may be made by its manufacturer, is not guaranteed or endorsed by the publisher.
Acknowledgments
We thank the National Bank of Tumors and DNA (BNT) at INCA and its personal for collection, preparation and maintenance of the human samples used in this study.
Supplementary Material
The Supplementary Material for this article can be found online at: https://www.frontiersin.org/articles/10.3389/fonc.2021.710919/full#supplementary-material
Supplementary Figure 1 | Pathway map – Role of microRNAs in cell proliferation in colorectal cancer. Pathway map generated by MetaCore™ software. The lists of DE miRNAs were uploaded into the software and compared to correlate the fold change obtained in the PCR array with disease aggressiveness. The cell lines – MCF7, EVSA-T, HCC-1954 and MDA-MB-231 – were designated with numbers 1 to 4, respectively. Up-regulated miRNAs are marked with a red thermometer and downregulated with a blue thermometer. Red arrows indicate an inhibition effect, and green arrows indicate an activation effect.
Supplementary Figure 2 | Pathway map - MicroRNA-dependent inhibition of EMT. Pathway map generated by MetaCore™ software. The lists of DE miRNAs were uploaded into the software and compared to correlate the fold change obtained in the PCR array with disease aggressiveness. The cell lines - MCF7, EVSA-T, HCC-1954 and MDA-MB-231 - were designated with numbers 1 to 4, respectively. Up-regulated miRNAs are marked with a red thermometer and downregulated with a blue thermometer. Red arrows indicate an inhibition effect, and green arrows indicate an activation effect.
Supplementary Figure 3 | Interaction maps in breast cancer miRNome. Representative interaction maps generated by MetaCore™ software in (A) PTEN network from DE miRNAs and (B) the interaction map of miR-205-5p. Up-egulated miRNAs are marked with red circles, and downregulated miRNAs are marked with blue circles. The ‘checkerboard’ color indicates mixed expression for the gene between files or between multiple tags for the same miRNA.
Supplementary Figure 4 | Heatmap of 15 differentially expressed miRNAs among BC cell lines confirmed in BC subtypes (TCGA).
Supplementary Table 1 | miRNAs differentially expressed in the MCF7 cell line.
Supplementary Table 2 | miRNAs differentially expressed in the EVSA-T cell line.
Supplementary Table 3 | miRNAs differentially expressed in the HCC-1954 cell line.
Supplementary Table 4 | miRNAs differentially expressed in the MDA-MB-231 cell line.
Supplementary Table 5 | 54 DE miRNAs according to aggressiveness among BC subtypes.
Abbreviations
BC, breast cancer; CDS, coding sequence; DE, differentially expressed; EMT, epithelial-to-mesenchymal transition; Fow, forward; FPKM, Fragments Per Kilobase Million; GTEx, genotype-Tissue Expression; NB, normal breast; NST, normal solid tumor; Rev, reverse; RPM, reads per million; RT-qPCR, real-time quantitative PCR; TCGA, The Cancer Genome Atlas; UTR, untranslated region.
References
1. Perou CM, Sørlie T, Eisen MB, van de Rijn M, Jeffrey SS, Rees CA, et al. Molecular Portraits of Human Breast Tumours. Nat (2000) 406:747–52. doi: 10.1038/35021093
2. Liang J, Chen P, Hu Z, Zhou X, Chen L, Li M, et al. Genetic Variants in Fibroblast Growth Factor Receptor 2 (FGFR2) Contribute to Susceptibility of Breast Cancer in Chinese Women. Carcinog (2008) 29:2341–56. doi: 10.1093/carcin/bgn235
3. Anderson WF, Rosenberg PS, Prat A, Perou CM, Sherman ME. How Many Etiological Subtypes of Breast Cancer: Two, Three, Four, Or More? J Natl Cancer Inst (2014) 106:dju165. doi: 10.1093/jnci/dju165
4. Connolly R, Stearns V. Epigenetics as a Therapeutic Target in Breast Cancer. J Mammary Gland Biol Neoplasia (2012) 17:191–204. doi: 10.1007/s10911-012-9263-3
5. Wang W, Luo YP. MicroRNAs in Breast Cancer: Oncogene and Tumor Suppressors With Clinical Potential. J Zhejiang Univ Sci B (2015) 16:18–31. doi: 10.1631/jzus.B1400184
6. Pasquinelli AE. MicroRNAs and Their Targets: Recognition, Regulation and an Emerging Reciprocal Relationship. Nat Rev Genet (2012) 13:271–82. doi: 10.1038/nrg3162
7. Cora' D, Re A, Caselle M, Bussolino F. MicroRNA-Mediated Regulatory Circuits: Outlook and Perspectives. Phys Biol (2017) 14:045001. doi: 10.1088/1478-3975/aa6f21
8. Kilic T, Erdem A, Ozsoz M, Carrara S. microRNA Biosensors: Opportunities and Challenges Among Conventional and Commercially Available Techniques. Biosens Bioelectron (2018) 99:525–36. doi: 10.1016/j.bios.2017.08.007
9. Pan F, Mao H, Deng L, Li G, Geng P. Prognostic and Clinicopathological Significance of microRNA-21 Overexpression in Breast Cancer: A Meta-Analysis. Int J Clin Exp Pathol (2012) 7:5622–33.
10. Chen WX, Hu Q, Qiu MT, Zhong SL, Xu JJ, Tang JH, et al. miR-221/222: Promising Biomarkers for Breast Cancer. Tumour Biol (2013) 34:1361–70. doi: 10.1007/s13277-013-0750-y
11. Garzon R, Marcucci G, Croce CM. Targeting microRNAs in Cancer: Rationale, Strategies and Challenges. Nat Rev Drug Discov (2010) 9:775–89. doi: 10.1038/nrd3179
12. Coleman WB, Anders CK. Discerning Clinical Responses in Breast Cancer Based On Molecular Signatures. Am J Pathol (2017) S0002-9440:30680–96. doi: 10.1016/j.ajpath.2017.08.002
13. Lal S, McCart Reed AE, de Luca XM, Simpson PT. Molecular Signatures in Breast Cancer. Methods (2017) S1046-2023:30058–60. doi: 10.1016/j.ymeth.2017.06.032
14. Gámez-Pozo A, Trilla-Fuertes L, Berges-Soria J, Selevsek N, López-Vacas R, Díaz-Almirón M, et al. Functional Proteomics Outlines the Complexity of Breast Cancer Molecular Subtypes. Sci Rep (2017) 7:10100. doi: 10.1038/s41598-017-10493-w
15. Di Leva G, Garofalo M, Croce CM. microRNAs in Cancer. Annu Rev Pathol (2014) 9:287–94. doi: 10.1146/annurev-pathol-012513-104715
16. Kourea HP, Zolota V, Scopa CD. Targeted Pathways in Breast Cancer: Molecular and Protein Markers Guiding Therapeutic Decisions. Curr Mol Pharmacol (2014) 7:4–21. doi: 10.2174/187446720701150105170830
17. Schmittgen TD, Livak KJ. Analyzing Real-Time PCR Data by the Comparative C(T) Method. Nat Protoc (2008) 3:1101–8. doi: 10.1038/nprot.2008.73
18. Bettaieb A, Paul C, Plenchette S, Shan J, Chouchane L, Ghiringhelli F. Precision Medicine in Breast Cancer: Reality or Utopia? J Transl Med (2017) 15:139. doi: 10.1186/s12967-017-1239-z
19. Colaprico A, Silva TC, Olsen C, Garofano L, Cava C, Garolini D, et al. TCGAbiolinks: An R/Bioconductor Package for Integrative Analysis of TCGA Data. Nucleic Acids Res (2016) 44:e71. doi: 10.1093/nar/gkv1507
20. Panis C, Pizzatti L, Corrêa S, Binato R, Lemos GF, da Silva do Amaral Herrera AC, et al. The Positive Is Inside the Negative: HER2-Negative Tumors Can Express the HER2 Intracellular Domain and Present a HER2-Positive Phenotype. Cancer Lett (2015) 357:186–95. doi: 10.1016/j.canlet.2014.11.029
21. Huang S, Chaudhary K. Garmire LX. More Is Better: Recent Progress in Multi-Omics Data Integration Methods. Front Genet (2017) 8:4. doi: 10.3389/fgene.2017.00084
22. Korcsmaros T, Schneider MV, Superti-Furga G. Next Generation of Network Medicine: Interdisciplinary Signaling Approaches. Integr Biol (Camb) (2017) 9:97–108. doi: 10.1039/c6ib00215c
23. Wu Z, Hu Z, Han X, Li Z, Zhu Q, Wang Y, et al. The BET-Bromodomain Inhibitor JQ1 Synergized ABT-263 Against Colorectal Cancer Cells Through Suppressing C-Myc-Induced miR-1271-5p Expression. BioMed Pharmacother (2017) 95:1574–9. doi: 10.1016/j.biopha.2017.09.087
24. Lin MF, Yang YF, Peng ZP, Zhang MF, Liang JY, Chen W, et al. FOXK2, Regulted by miR-1271-5p, Promotes Cell Growth and Indicates Unfavorable Prognosis in Hepatocellular Carcinoma. Int J Biochem Cell Biol (2017) 88:155–61. doi: 10.1016/j.biocel.2017.05.019
25. Liu HM, Tan HY, Lin Y, Xu BN, Zhao WH, Xie YA. MicroRNA-1271-5p Inhibits Cell Proliferation and Enhances Radiosensitivity by Targeting CDK1 in Hepatocellular Carcinoma. J Biochem (2000) 167:513–24. doi: 10.1093/jb/mvz114
26. Yang Y, Chen L. Downregulation of lncRNA UCA1 Facilitates Apoptosis and Reduces Proliferation in Multiple Myeloma via Regulation of the miR-1271-5p/HGF Axis. J Chin Med Assoc (2019) 82:699–709. doi: 10.1097/JCMA.0000000000000145
27. Liu N, Feng S, Li H, Chen X, Bai S, Liu Y. Long non-Coding RNA MALAT1 Facilitates the Tumorigenesis, Invasion and Glycolysis of Multiple Myeloma via miR-1271-5p/SOX13 Axis. J Cancer Res Clin Oncol (2020) 146:367–79. doi: 10.1007/s00432-020-03127-8
28. Li Q, Shi J, Xu X. MicroRNA-1271-5p Inhibits the Tumorigenesis of Ovarian Cancer Through Targeting E2F5 and Negatively Regulates the mTOR Signaling Pathway. Panminerva Med (2020) 14. doi: 10.23736/S0031-0808.20.03939-7
29. Wang L, Zhu MJ, Ren AM, Wu HF, Han WM, Tan RY, et al. A ten-microRNA Signature Identified From a Genome-Wide microRNA Expression Profiling in Human Epithelial Ovarian Cancer. PloS One (2014) 9:e96472. doi: 10.1371/journal.pone.0096472
30. Bai X, Lu D, Lin Y, Lv Y, He L. A Seven-miRNA Expression-Based Prognostic Signature and Its Corresponding Potential Competing Endogenous RNA Network in Early Pancreatic Cancer. Exp Ther Med (2019) 18:1601–8. doi: 10.3892/etm.2019.7728
31. Li X, Zou W, Wang Y, Liao Z, Li L, Zhai Y, et al. Plasma-Based microRNA Signatures in Early Diagnosis of Breast Cancer. Mol Genet Genomic Med (2020) 8:e1092. doi: 10.1002/mgg3.1092
32. Zhou SY, Chen W, Yang SJ, Li J, Zhang JY, Zhang HD, et al. Circular RNA circVAPA Regulates Breast Cancer Cell Migration and Invasion via Sponging miR-130a-5p. Epigenomics (2020) 12:303–17. doi: 10.2217/epi-2019-0124
33. Xu CH, Xiao LM, Liu Y, Chen LK, Zheng SY, Zeng EM, et al. The lncRNA HOXA11-AS Promotes Glioma Cell Growth and Metastasis by Targeting miR-130a-5p/HMGB2. Eur Rev Med Pharmacol Sci (2019) 23:241–52. doi: 10.26355/eurrev_201901_16770
34. Wang W, Wu D, He X, Hu X, Hu C, Shen Z, et al. CCL18-Induced HOTAIR Upregulation Promotes Malignant Progression in Esophageal Squamous Cell Carcinoma Through the miR-130a-5p-ZEB1 Axis. Cancer Lett (2019) 460:18–28. doi: 10.1016/j.canlet.2019.06.009
35. Pan JY, Zhang F, Sun CC, Li SJ, Li G, Gong FY, et al. miR-134: A Human Cancer Suppressor? Mol Ther Nucleic Acids (2017) 6:140–9. doi: 10.1016/j.omtn.2016.11.003
36. O'Brien K, Lowry MC, Corcoran C, Martinez VG, Daly M, Rani S, et al. miR-134 in Extracellular Vesicles Reduces Triple-Negative Breast Cancer Aggression and Increases Drug Sensitivity. Oncotarget (2015) 6:32774–89. doi: 10.18632/oncotarget.5192
37. Su X, Zhang L, Li H, Cheng P, Zhu Y, Liu Z, et al. MicroRNA-134 Targets KRAS to Suppress Breast Cancer Cell Proliferation, Migration and Invasion. Oncol Lett (2017) 13:1932–8. doi: 10.3892/ol.2017.5644
38. Tajbakhsh A, Mokhtari-Zaer A, Rezaee M, Afzaljavan F, Rivandi M, Hassanian SM, et al. Therapeutic Potentials of BDNF/TrkB in Breast Cancer; Current Status and Perspectives. J Cell Biochem (2017) 118:2502–15. doi: 10.1002/jcb.25943
39. Shi WL, Liu ZZ, Wang HD, Wu D, Zhang H, Xiao H, et al. Integrated miRNA and mRNA Expression Profiling in Fetal Hippocampus With Down Syndrome. J BioMed Sci (2016) 23:48. doi: 10.1186/s12929-016-0265-0
40. Liu Y, Liu H, Li Y, Mao R, Yang H, Zhang Y, et al. Circular RNA SAMD4A Controls Adipogenesis in Obesity Through the miR-138-5p/EZH2 Axis. Theranostics (2020) 10:4705–19. doi: 10.7150/thno.42417
41. Zhang Y, Ai H, Fan X, Chen S, Wang Y, Liu L. Knockdown of Long non-Coding RNA HOTAIR Reverses Cisplatin Resistance of Ovarian Cancer Cells Through Inhibiting miR-138-5p-Regulated EZH2 and SIRT1. Biol Res (2020) 53:18. doi: 10.1186/s40659-020-00286-3
42. Qiu X, Wang W, Li B, Cheng B, Lin K, Bai J, et al. Targeting Ezh2 Could Overcome Docetaxel Resistance in Prostate Cancer Cells. BMC Cancer (2019) 19:27. doi: 10.1186/s12885-018-5228-2
43. Zhao C, Ling X, Li X, Hou X, Zhao D. MicroRNA-138-5p Inhibits Cell Migration, Invasion and EMT in Breast Cancer by Directly Targeting RHBDD1. Breast Cancer (2019) 26:817–25. doi: 10.1007/s12282-019-00989-w
44. Li Z, Meng Q, Pan A, Wu X, Cui J, Wang Y, et al. MicroRNA-455-3p Promotes Invasion and Migration in Triple Negative Breast Cancer by Targeting Tumor Suppressor EI24. Oncotarget (2017) 8:19455–66. doi: 10.18632/oncotarget.14307
45. Guo J, Liu C, Wang W, Liu Y, He H, Chen C, et al. Identification of Serum miR-1915-3p and miR-455-3p as Biomarkers for Breast Cancer. PloS One (2018) 13:e0200716. doi: 10.1371/journal.pone.0200716
46. Zeng Y, Gao T, Huang W, Yang Y, Qiu R, Hou Y, et al. MicroRNA-455-3p Mediates GATA3 Tumor Suppression in Mammary Epithelial Cells by Inhibiting TGF-β Signaling. J Biol Chem (2019) 294:15808–25. doi: 10.1074/jbc.RA119.010800
47. Ma M, He M, Jiang Q, Yan Y, Guan S, Zhang J, et al. MiR-487a Promotes TGF-β1-Induced EMT, the Migration and Invasion of Breast Cancer Cells by Directly Targeting Magi2. Int J Biol Sci (2016) 12:397–408. doi: 10.7150/ijbs.13475
48. Ma MT, He M, Wang Y, Jiao XY, Zhao L, Bai XF, et al. MiR-487a Resensitizes Mitoxantrone (MX)-Resistant Breast Cancer Cells (MCF-7/MX) to MX by Targeting Breast Cancer Resistance Protein (BCRP/Abcg2). Cancer Lett (2013) 339:107–15. doi: 10.1016/j.canlet.2013.07.016
49. Cao L, Wang M, Dong Y, Xu B, Chen J, Ding Y, et al. Circular RNA Circrnf20 Promotes Breast Cancer Tumorigenesis and Warburg Effect Through miR-487a/HIF-1α/Hk2. Cell Death Dis (2020) 11:145. doi: 10.1038/s41419-020-2336-0
Keywords: miRNome, breast cancer, MYB, EZH2, novel miRNAs
Citation: Corrêa S, Lopes FP, Panis C, Basili T, Binato R and Abdelhay E (2021) miRNome Profiling Reveals Shared Features in Breast Cancer Subtypes and Highlights miRNAs That Potentially Regulate MYB and EZH2 Expression. Front. Oncol. 11:710919. doi: 10.3389/fonc.2021.710919
Received: 17 May 2021; Accepted: 30 August 2021;
Published: 27 September 2021.
Edited by:
Marija Balic, Medical University of Graz, AustriaReviewed by:
Valentine Comaills, Andalusian Center of Molecular Biology and Regenerative Medicine (CABIMER), SpainPetra Tesarova, Charles University, Czechia
Copyright © 2021 Corrêa, Lopes, Panis, Basili, Binato and Abdelhay. This is an open-access article distributed under the terms of the Creative Commons Attribution License (CC BY). The use, distribution or reproduction in other forums is permitted, provided the original author(s) and the copyright owner(s) are credited and that the original publication in this journal is cited, in accordance with accepted academic practice. No use, distribution or reproduction is permitted which does not comply with these terms.
*Correspondence: Eliana Abdelhay, ZWFiZGVsaGF5QGluY2EuZ292LmJy