 Zhenzi Su
 Aidi Gao
 Xiaoqing Li
 Shitao Zou
 Chao He
 Jinchang Wu1,3*
 Wei-Qun Ding
94% of researchers rate our articles as excellent or good
Learn more about the work of our research integrity team to safeguard the quality of each article we publish.
Find out more
ORIGINAL RESEARCH article
Front. Oncol. , 20 July 2021
Sec. Molecular and Cellular Oncology
Volume 11 - 2021 | https://doi.org/10.3389/fonc.2021.706337
This article is part of the Research Topic Stress Response Signaling in Tumor Development and its Implications for Cancer Treatment View all 27 articles
Esophageal squamous cell carcinoma (ESCC) is one of the most lethal cancers with rapid progression and a high mortality rate. Our previous study demonstrated that DNA polymerase iota (Pol ι) is overexpressed in ESCC tumors and correlates with poor prognosis. However, its role in ESCC proliferation remains obscure. We report here that Pol ι promotes ESCC proliferation and progression through Erk- O-GlcNAc transferase (OGT) regulated Glucose-6-phosphate dehydrogenase (G6PD) overactivation. Cell clonogenic ability was assessed by colony formation assay. Cell proliferation was assessed by EdU incorporation assay. Our transcriptome data was reanalyzed by GSEA and validated by analysis of cellular metabolism, G6PD activity, and cellular NADPH concentration. The level of Pol ι, OGT, G6PD and O-GlcNAcylation in ESCC cells and patient samples were analyzed. The MEK inhibitor PD98059 was applied to confirm OGT expression regulation by the Erk signaling. The G6PD inhibitor polydatin was used to examine the role of G6PD activation in Pol ι promoted proliferation. We found that Pol ι promotes ESCC proliferation. It shunted the glucose flux towards the pentose phosphate pathway (PPP) by activating G6PD through OGT-promoted O-GlcNAcylation. The expression of OGT was positively correlated with Pol ι expression and O-GlcNAcylation. Notably, elevated O-GlcNAcylation was correlated with poor prognosis in ESCC patients. Pol ι was shown to stimulate Erk signaling to enhance OGT expression, and the G6PD inhibitor polydatin attenuated Pol ι induced tumor growth in vitro and in vivo. In conclusion, Pol ι activates G6PD through Erk-OGT-induced O-GlcNAcylation to promote the proliferation and progression of ESCC, supporting the notion that Pol ι is a potential biomarker and therapeutic target of ESCC.
Esophageal cancer is recognized as the sixth leading cause of cancer death worldwide with a poor 5-year survival rate of less than 20% (1, 2). Esophageal squamous cell carcinoma (ESCC) is the predominant form of esophageal cancer in the world (3–5). In China, it ranks the fourth of estimated cancer deaths (6). The survival rate of early-stage ESCC can be greatly improved by surgical treatment. Unfortunately, most ESCC patients were diagnosed at an advanced stage with rapid progression and poor prognosis (7). Thus, it is urgent to understand how ESCC progresses in order to improve its clinical outcomes.
DNA polymerase iota (Pol ι) belongs to the Y-family DNA polymerase and participates in translesion DNA synthesis (TLS) (8). Pol ι (product of the POLI gene) was identified as the second homolog of yeast Rad30 gene in human (9). Although Pol ι is well-recognized for its function of bypassing DNA lesions during replication (8), recent studies suggested that Pol ι is involved in the progression of various types of cancer. Overexpression of Pol ι was found in breast cancer (10, 11), bladder cancer (12), glioma (13), and ESCC (14). Furthermore, elevated Pol ι activates the Erk and JNK signaling pathway, contributing to invasion, metastasis and poor prognosis of ESCC (15, 16). However, whether Pol ι plays a role in ESCC proliferation remains unclear.
One of the main overactivated metabolic pathways during rapid cancer progression is the pentose phosphate pathway (PPP), which regulates the production of the nucleotides structure component ribose-5-phosphate and nicotinamide adenine dinucleotide phosphate (NADPH) (17–19). Activation of the PPP renders tumor cells an advantage for proliferation and development (20–22). Glucose-6-phosphate dehydrogenase (G6PD) serves as a pacemaker of PPP due to its activity to shunt glucose flux to PPP and catalyze the first and rate-limiting step of PPP (17). Mounting evidence indicated that increased glucose flux towards PPP and overactivation of G6PD are common in many cancer types, including clear cell renal cell carcinoma, hepatocellular carcinoma, colorectal cancer, prostate cancer, and ESCC (23–27). It is known that G6PD overactivation in tumor cells is regulated at the transcriptional or posttranslational level (17, 21, 22, 27–29). Recent evidence suggested that OGT promotes O-GlcNAcylation of G6PD, and this process is critical for G6PD activation and tumor progression (30). However, it remains unclear how G6PD and PPP are overactivated in ESCC and whether Pol ι is involved in their regulation.
In this study, Pol ι was found to promote ESCC proliferation, resulting from activated G6PD that redirected glucose flux towards PPP. Mechanistically, we found that Pol ι activates G6PD through Erk-OGT-induced O-GlcNAcylation. This novel finding, along with our previous reports (14–16), indicates that Pol ι is a potential new biomarker and therapeutic target of ESCC.
Human ESCC cell lines, TE-1 and KYSE-150, were obtained from the Shanghai Cell Bank (Shanghai, China). The stable Pol ι downregulated KYSE-150 cells were previously generated (15). For stable Pol ι overexpression TE-1 cells generation, the human POLI gene was amplified and cloned into the lentivirus vector LV5 (GenePharma, Suzhou, China) for virus production. TE-1 cells were infected with lentivirus containing control plasmid or POLI gene and selected by Puromycin (Sigma-Aldrich, St. Louis, MO, USA). TE-1 cells were cultured in DMEM medium and KYSE-150 cells were cultured in RPMI-1640 medium. All the aforementioned media (Hyclone, Logan, UT, USA) were supplemented with 10% fetal bovine serum (FBS, Clark Bioscience, VA, Richmond, USA). Cells were incubated under standard conditions (5% CO2 and 37°C) in a humidified atmosphere.
TE-1 and KYSE-150 cells were seeded at a density of 500 or 1,000 cells per well in 6-well plates, respectively. After 7-10 days of incubation under standard conditions, colonies were stained with the Wright-Giemsa staining kit (Nanjing JianCheng Technology, Nanjing, China). Colonies that contain more than 50 cells were counted. In the drug-treated group, cells were exposed to different concentrations of polydatin (Sigma-Aldrich, St.Louis, USA) after being attached overnight.
The EdU incorporation assay of different cell lines was performed using a BeyoClick™ EDU Cell Proliferation Kit with TMB (Beyotime Biotechnology, Shanghai, China) according to the manufacturer’s instructions. In brief, TE-1 and KYSE-150 cells were seeded in 96-well plates at a density of 1,000 cells per well. Cells were incubated with 10 μM EdU for 2 h at 37 °C, followed by fixation with 4% paraformaldehyde and permeabilization with 0.3% Triton X-100. Subsequently, 50 μL of Click reaction buffer containing biotin was added to each well. After incubation for 30 min at room temperature in the dark, Streptavidin-HRP working solution was added and incubated for another 30 min at room temperature. Then, cells were washed three times with PBS. After 5 min developing with the TMB developing buffer, the absorbance was measured at 630 nm using a microplate reader (Thermo Scientific, Rochester, NY, USA).
Real-time ATP rate assay was performed using the Seahorse Bioscience XFp Analyzer (Agilent, Santa Clara, CA, USA). By measuring extracellular acidification rate (ECAR) and oxygen consumption rate (OCR), the fractions of ATP produced from mitochondrial oxidative phosphorylation and glycolysis can be distinguished. Briefly, 1 × 10⁴ cells were seeded in each well of Seahorse XFp Microplate. After cell attachment, the cultural media was changed by unbuffered assay medium containing 10 mM glucose, 1mM pyruvate, and 2 mM glutamine. Cells were then incubated in a non-CO2 incubator for 60 min at 37 °C. A baseline measurement was first performed, followed by sequential injection of 1.5 μM oligomycin and 0.5 μM each of Rotenone and Antimycin A mixture. Results were analyzed using the Real-Time ATP Rate Assay Report Generator.
The G6PD activity was measured using the G6PD Activity Assay Kit (Beyotime Biotechnology). Briefly, 1 × 10⁵ TE-1 and KYSE-150 cells or 10 mg tumor tissues were harvested and lysed with G6PD extracting solution at 4°C. Fifty μL protein sample and 50 μL of the G6PD test solution were successively added to each well of a 96-well plate. After incubating at 37°C for 10 min in the dark, the absorbance was measured at 450 nm using a microplate reader (Thermo Scientific). Protein concentration, determined by the BCA protein quantification kit (Beyotime Biotechnology), was used for normalization.
The NADPH concentration in cells was measured according to the manufacture’s protocol using NADPH Assay Kit (Beyotime Biotechnology). Briefly, 1 × 10⁵ TE-1 and KYSE-150 cells were harvested and lysed with the extracting buffer at 4°C. Then, the protein sample was incubated at 60°C for 30 min to decompose NADP+. Fifty μL protein sample and 50 μL working solution were successively added to each well of a 96-well plate. After incubating at 37°C for 10 min in the dark, 10 μL developing buffer was added into each well and incubated for another 10 min. The absorbance was then measured at 450 nm using a microplate reader (Thermo Scientific). Protein concentration, determined by the BCA protein quantification kit (Beyotime Biotechnology), was used for normalization.
Total RNA was isolated using TRIzol Reagent (Sigma-Aldrich). The RNA concentrations were determined using the NanoDrop2000 (Thermo Scientific). Total RNA (1 μg) was reverse-transcribed into cDNA in a 20 μL reaction mixture using the RevertAid First Strand cDNA Synthesis Kit (Thermo Scientific). Quantitative real-time PCR analyses were performed using the StepOne Plus instrument (Applied Biosystems, Rochester, NY, USA). The primers for human POLI, OGT, and ACTB were as follows: POLI, Forward: 5’-ACTTTCTGCGGTGACTGTGT-3’, Reverse: 5’-TACATGGCTTCCCGCATCTC-3’; OGT, Forward: 5’-GCTCACTTGCTTAGGTTGTCTT-3’, Reverse: 5’-GCCGCTCTAGTTCCATTGTG-3’; ACTB, Forward: 5’-CACCATTGGCAATGAGCGGTTCC-3’, Reverse: 5’-GTAGTTTCGTGGATGCCACAGG-3’. Relative POLI and OGT mRNA expression levels were calculated using the 2-ΔCt method and normalized to ACTB expression levels.
Cells were harvested and lysed with M-PER lysis buffer (Thermo Scientific) containing protease inhibitor cocktail and phosphatase inhibitor cocktail (Beyotime Biotechnology) for 30 min at 4°C. Protein concentration was determined using the BCA protein quantification kit (Beyotime Biotechnology). Equal amounts of the proteins were separated by SurePAGE™ precast gels with a linear gradient between 4%-20% (GenScript, Nanjing, China) and transferred to PVDF membranes (Millipore, Billerica, MA, USA) by eBlot® L1 protein transfer system (GenScript). After blocking with 5% non-fat milk, the membranes were incubated with primary antibodies against β-actin (Beyotime Biotechnology), Pol ι (Proteintech, Rosemont, IL, USA), G6PD (Abcam, Cambridge, MA, USA), OGT (Proteintech), O-GlcNAc (Invitrogen Life Technologies, Carlsbad, CA, USA), Erk and p-Erk (Cell Signaling Technology, Danvers, Massachusetts, USA) at 4°C overnight. After washing with TBST three times, the membranes were incubated with HRP-conjugated anti-mouse or anti-rabbit secondary antibody (MultiSciences, Hangzhou, China). High-sig ECL Western Blotting Substrate (Tanon, Shanghai, China) was applied for band visualization. Images of the protein bands were collected by Tanon-5200 Chemiluminescent Imaging System (Tanon). β-actin expression was served as a loading control.
Cells were collected and lysed using RIPA lysis buffer (Beyotime Biotechnology) containing protease inhibitors for 30 min at 4°C. The protein was incubated with anti-G6PD and anti-IgG antibodies at 4°C overnight. Then Protein A/G agarose beads (Abcam) was added to each tube. After incubation again at 4°C for 3 h, the beads were collected by centrifugation at 2,000 x g for 2 min. Subsequently, the beads were washed with IP wash buffer three times, followed by adding 40 μL 2× loading buffer and denaturing at 100°C for 5 min. Western blot was then performed. The anti-O-GlcNAC antibody (RL2, Thermo Scientific) was used to test the O-GlcNAcylation of G6PD.
A predicted OGT promoter, -2,000 to +500 bp, was acquired from the NCBI RefSeq database and cloned into the pGL4 plasmid. The pGL4-OGT and pRL-TK were transfected into cells with a ratio of 10:1 for 48 h. Then the OGT promoter activity was examined by Dual-Luciferase Reporter Assay (Promega, Madison, WI, USA). In brief, cells were seeded in 6-well plates at a density of 1 × 10⁵ cells per well and incubated overnight. The pGL4-OGT plasmid was transfected into the corresponding cells using the Lipofectamine 3000 (Invitrogen, USA). Cells were collected and lysed in the 1× Passive Lysis Buffer (PLB, Promega, USA) at ambient temperature for 20 min. 20 μL lysate was transferred into the tube containing 100 μL Luciferase Assay Buffer II (LAR II, Promega). After mixing 3 times, the tube was placed in the GloMax 20/20 Luminous detector (Promega) and recorded the measurement. Then, 100 μL Stop & Glo Reagent (Promega) was added into the same tube and recorded the second measurement. Results of triplicate transfections were combined to evaluate OGT promoter luciferase activity.
Tumor tissues were paraffin-embedded and sectioned. For IHC analysis, the sections were dewaxed, hydrated, and heat-treated using sodium citrate, pH 6.0. Sections were blocked with 5% BSA at 37°C for 1 h, followed by incubation with primary antibody against Pol ι (Abcam), OGT, O-GlcNAcylation at 4°C overnight. After washing with PBS three times, the HRP-conjugated anti-mouse/rabbit secondary antibody was used to incubate the sections for 1 h at 37°C. Sections were developed with a DAB kit (Cwbiotech, Beijing, China). Hematoxylin was used for counterstaining. Then the sections were washed and mounted.
The expression of Pol ι, OGT, and O-GlcNAcylation was scored by two pathologists. The staining density was scored: 1 (<25%), 2 (26%-50%), 3 (51%-75%) and 4 (>75%). The staining intensity was scored: 1 (negative or weakly positive), 2 (positive), and 3 (strongly positive). The final score for each section was calculated by multiplying the scores of the density and intensity.
This study was approved by the Institutional Ethics Committee of Nanjing Medical University. Human samples were obtained from The Affiliated Suzhou Hospital of Nanjing Medical University (Jiangsu, China) with informed consent.
TE-1 cells were seeded at a density of 1 × 10⁵ cells per well in a 6-well plate. After incubation overnight at 37 °C, cells were treated with different concentrations of PD98059 for 24 h at 37 °C. Then cells extracts were blotted with Erk and p-Erk Antibody.
For the in vivo xenograft study, 6-8 weeks old female BALB/C nude mice were obtained from Shanghai SLAC Laboratory Animal Co. Ltd. (Shanghai, China). 1 × 10⁷ cells suspended in 100 μL normal saline were injected subcutaneously into nude mice at the left groin. The tumor volume was calculated by the 4/3 × π × [(long diameter/2) (short diameter/2)2] formula. When the average tumor size grew up to 300 mm3, the nude mice were divided into three groups (n = 6 for each group). In the treatment group, the mice were intraperitoneally injected with 5 mg/kg polydatin dissolved in normal saline every other day. Mice in untreated groups were administrated with the same volume of normal saline containing DMSO as control. The animal experiment was approved by the Ethics Committee of the Nanjing Medical University.
SPSS 19.0 software (IBM, Chicago, IL, USA) was used for Statistical analysis. All data were presented as mean ± standard deviation (SD). Differences between two groups were evaluated by the Student t-test. Differences among more groups were analyzed by one-way ANOVA. Spearman correlation was used to analyze the correlation between two genes expression. Statistical significance was considered to be a P-value < 0.05.
To investigate the influence of Pol ι on the proliferation of ESCC cells, Pol ι overexpressed TE-1 cells and downregulated KYSE-150 cells were used in this study. The expression of Pol ι in these cell lines was confirmed by Western blot (Figures 1A, C). We then performed colony formation assay and EdU incorporation assay for these cells. The results of the colony formation assay indicated that Pol ι overexpression strengthened the clonogenic abilities of TE-1 and KYSE-150 cells in comparison with the control group (Figures 1B, D). Similar results were observed in the EdU incorporation assay. As shown in Figure 1E, overexpression of Pol ι enhanced the proliferation of TE-1 cells compared to the control cells (P < 0.01), whereas only half of EdU incorporated in Pol ι downregulated KYSE-150 cells.
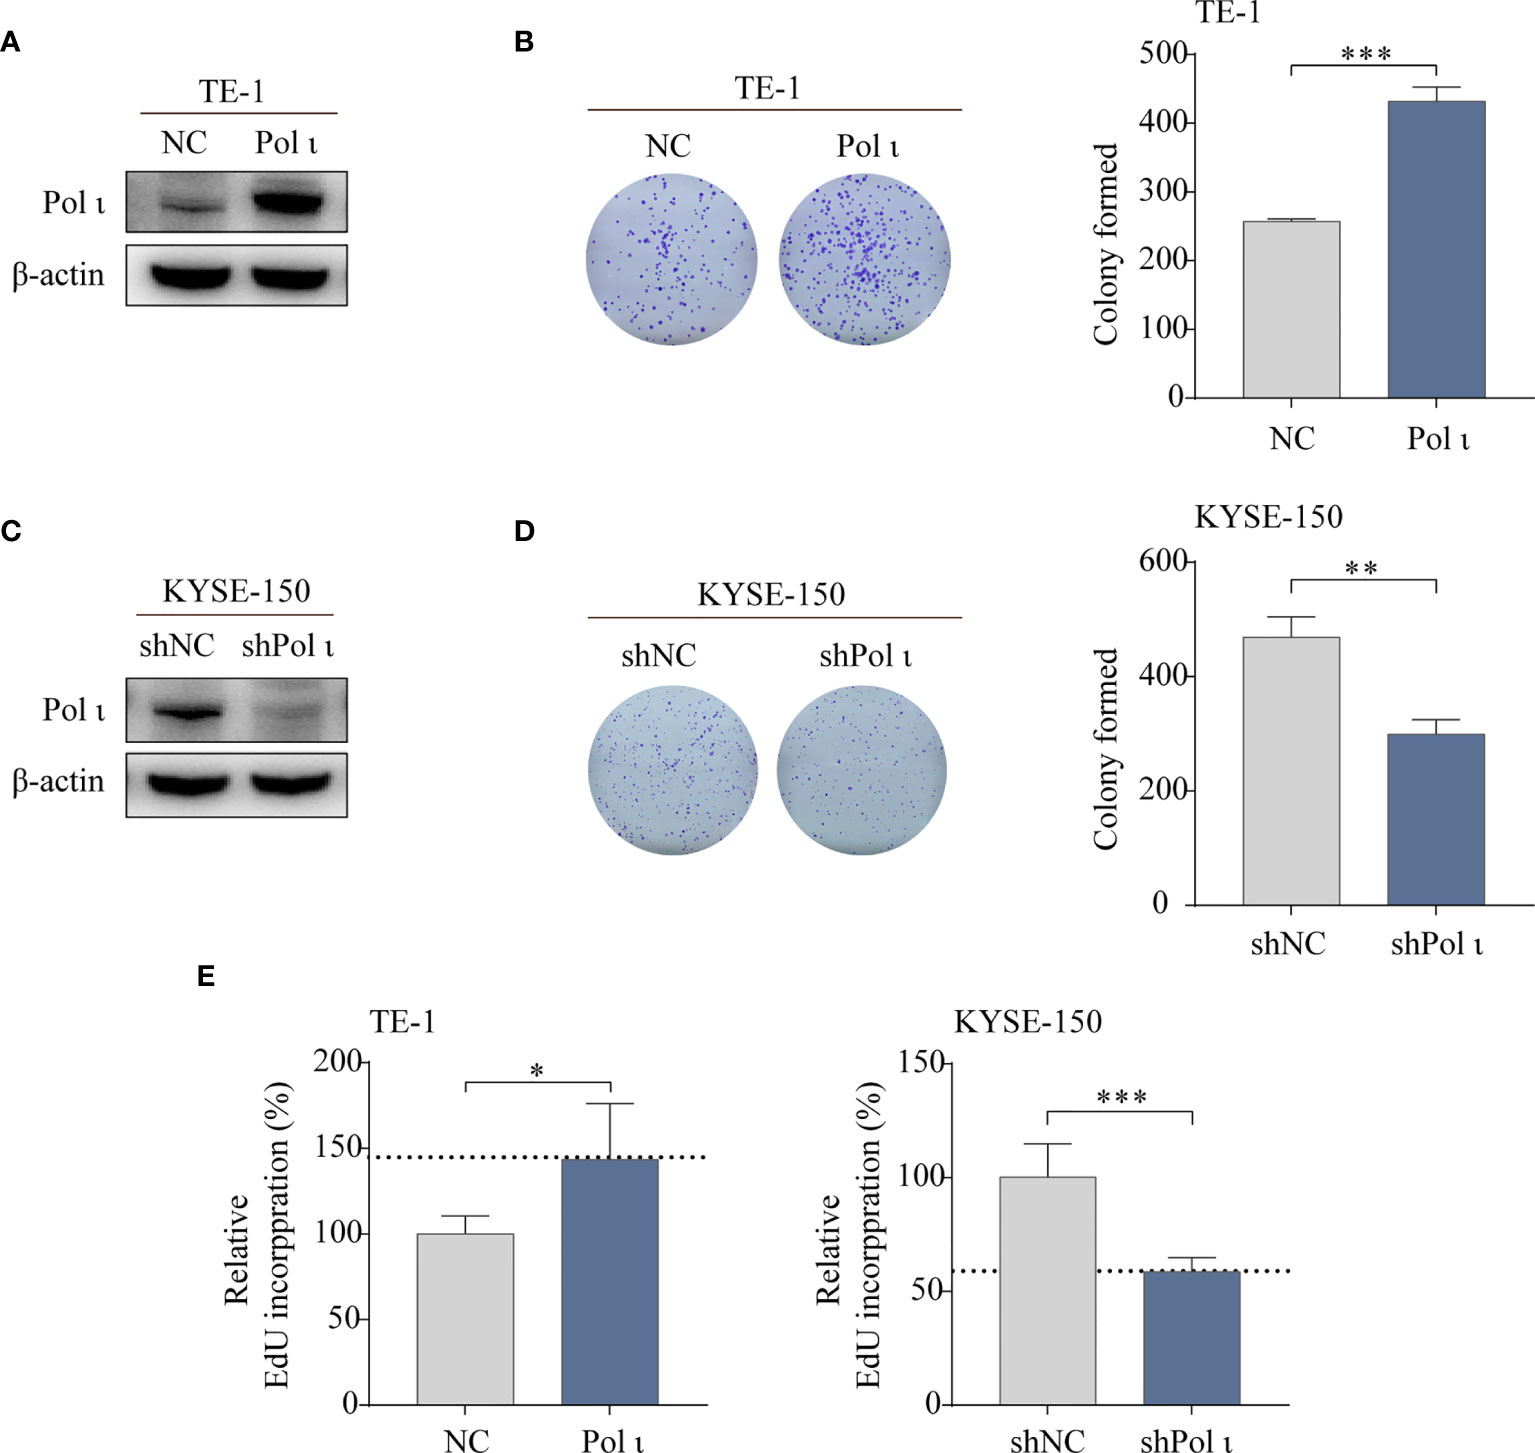
Figure 1 Pol ι promotes ESCC cell proliferation in vitro. (A, C) Differentially expressed Pol ι was confirmed by Western blot analysis in two ESCC cell lines with β-actin level as an internal control. The colony formation assay of TE-1 (B) and KYSE-150 cells (D). (E) The EdU incorporation assay, results of NC or shNC cells were served as control and the results of Pol ι up-or down-regulated cells were presented relative to control. *P < 0.05, **P < 0.01, ***P < 0.001.
Taken together, these results indicated that Pol ι promotes ESCC cell colony formation and proliferation.
To unveil the underlying mechanisms of Pol ι induced proliferation of ESCC cells, Gene Set Enrichment Analysis (GSEA, v4.1.0, MSigDB 7.2) (31, 32) was performed to reanalyze our transcriptome data (15) in Pol ι downregulated KYSE-150 shPol ι cells versus control KYSE-150 shNC cells. As shown in Figure 2A, many upregulated genes were enriched in the oxidative phosphorylation pathway, including subunits of NADH dehydrogenase (DUFA), ubiquinone oxidoreductase and Cytochrome c oxidase (Figure 2B). On the other hand, many downregulated genes were involved in other metabolism pathways, such as glycolysis or lipid metabolism. Of note, O-linked N-acetylglucosamine (GlcNAc) transferase (OGT), the key regulator of G6PD activity, was found to be downregulated in KYSE-150 shPol ι cells (Figure 2B).
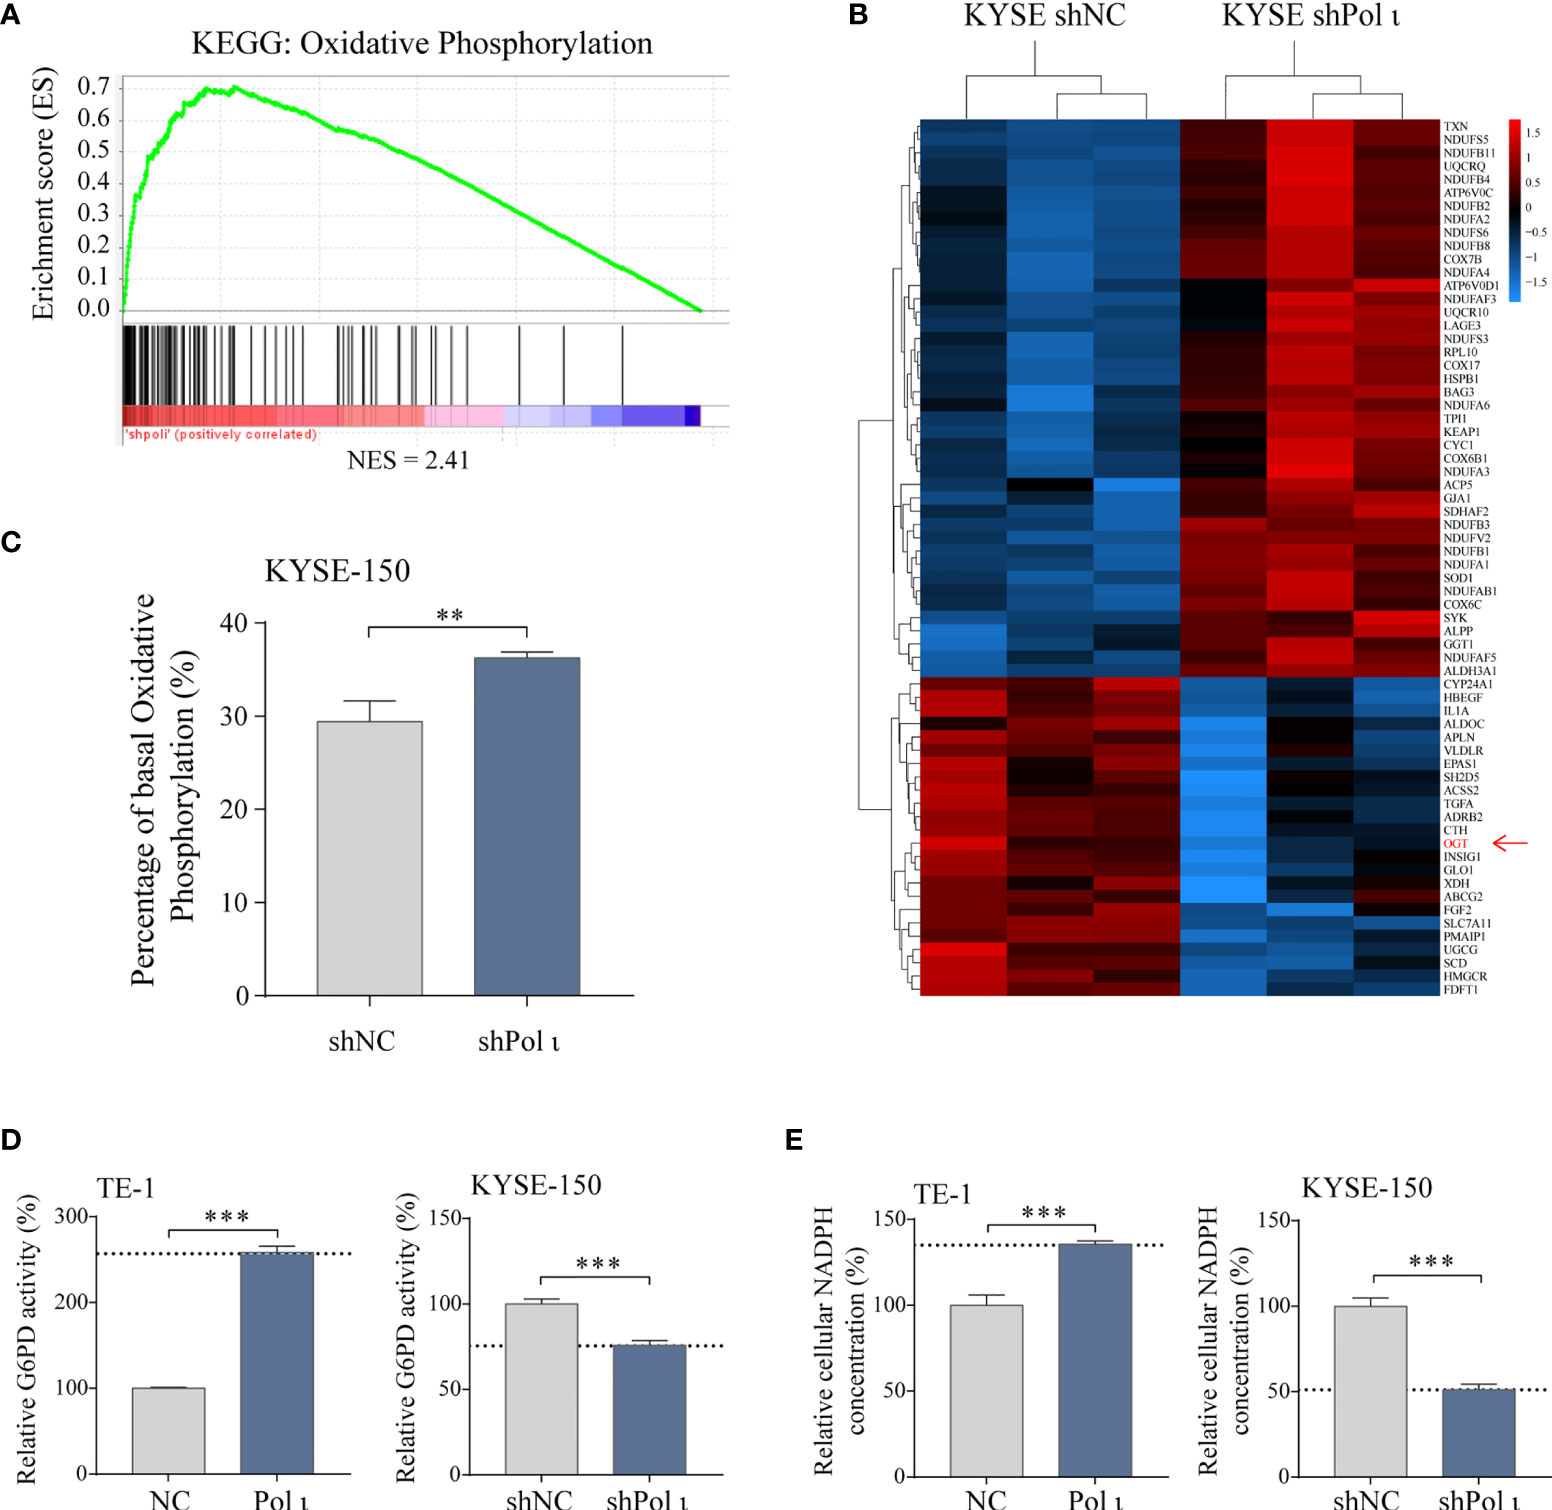
Figure 2 Pol ι induces metabolic transition. (A) RNA transcriptome data was reanalyzed using Gene Set Enrichment Analysis. Genes involved in the oxidative phosphorylation pathway were found enriched in Pol ι downregulated KYSE-150 cells. NES = 2.41, P < 0.001, FDR-q < 0.001. (B) heatmap of differentially expressed genes that participate in cellular metabolism. (C) rate of cellular metabolism tested by Seahorse analyzer using Real-Time ATP rate assay kit. Total ATP production, the sum of ATP generated from oxidative phosphorylation and Glycolysis, was considered 100%. The ATP production of each metabolic pathway was calculated by oxygen consumption rate (OCR) and extracellular acidification rate (ECAR) after serial injection of oligomycin (1.5 μM) and a mix of rotenone and antimycin A (0.5 μM each). Relative G6PD activity (D) and cellular NADPH concentration (E) in Pol ι differentially expressed TE-1 and KYSE-150 cells. **P < 0.01, ***P < 0.001.
We next applied cellular metabolism rate analysis to evaluate whether a metabolic transition was triggered in the wake of Pol ι-knocking down-induced upregulation of oxidative phosphorylation related genes. As expected, KYSE-150 shPol ι cells exhibited higher oxidative phosphorylation capacity, comparing to control cells (Figure 2C). Furthermore, cellular metabolism rate analysis also indicated that oxidative phosphorylation is similar but not reduced in Pol ι upregulated cells comparing with control cells (Figure S1). These results suggested that Pol ι may play a key role in the directional control of glucose flux.
Considering the pivotal role of G6PD, the rate-limiting enzyme of PPP, in glucose flux redirection and cancer cell proliferation, we then assessed its activity in Pol ι differentially expressed ESCC cell lines. As shown in Figure 2D, the enzymatic activity of G6PD was 2.5-fold higher in Pol ι upregulated TE-1 cells than control cells. On the contrary, its activity dropped to around 75% when Pol ι was knocked down in KYSE-150 cells. Of note, in our subsequent studies, we found that the protein level of G6PD did not change (Figure 3B). Consistently, cellular NADPH concentration showed a similar pattern, which jumped to about 150% in TE-1 Pol ι cells while declined approximately 50% in KYSE-150 shPol ι cells (Figure 2E).
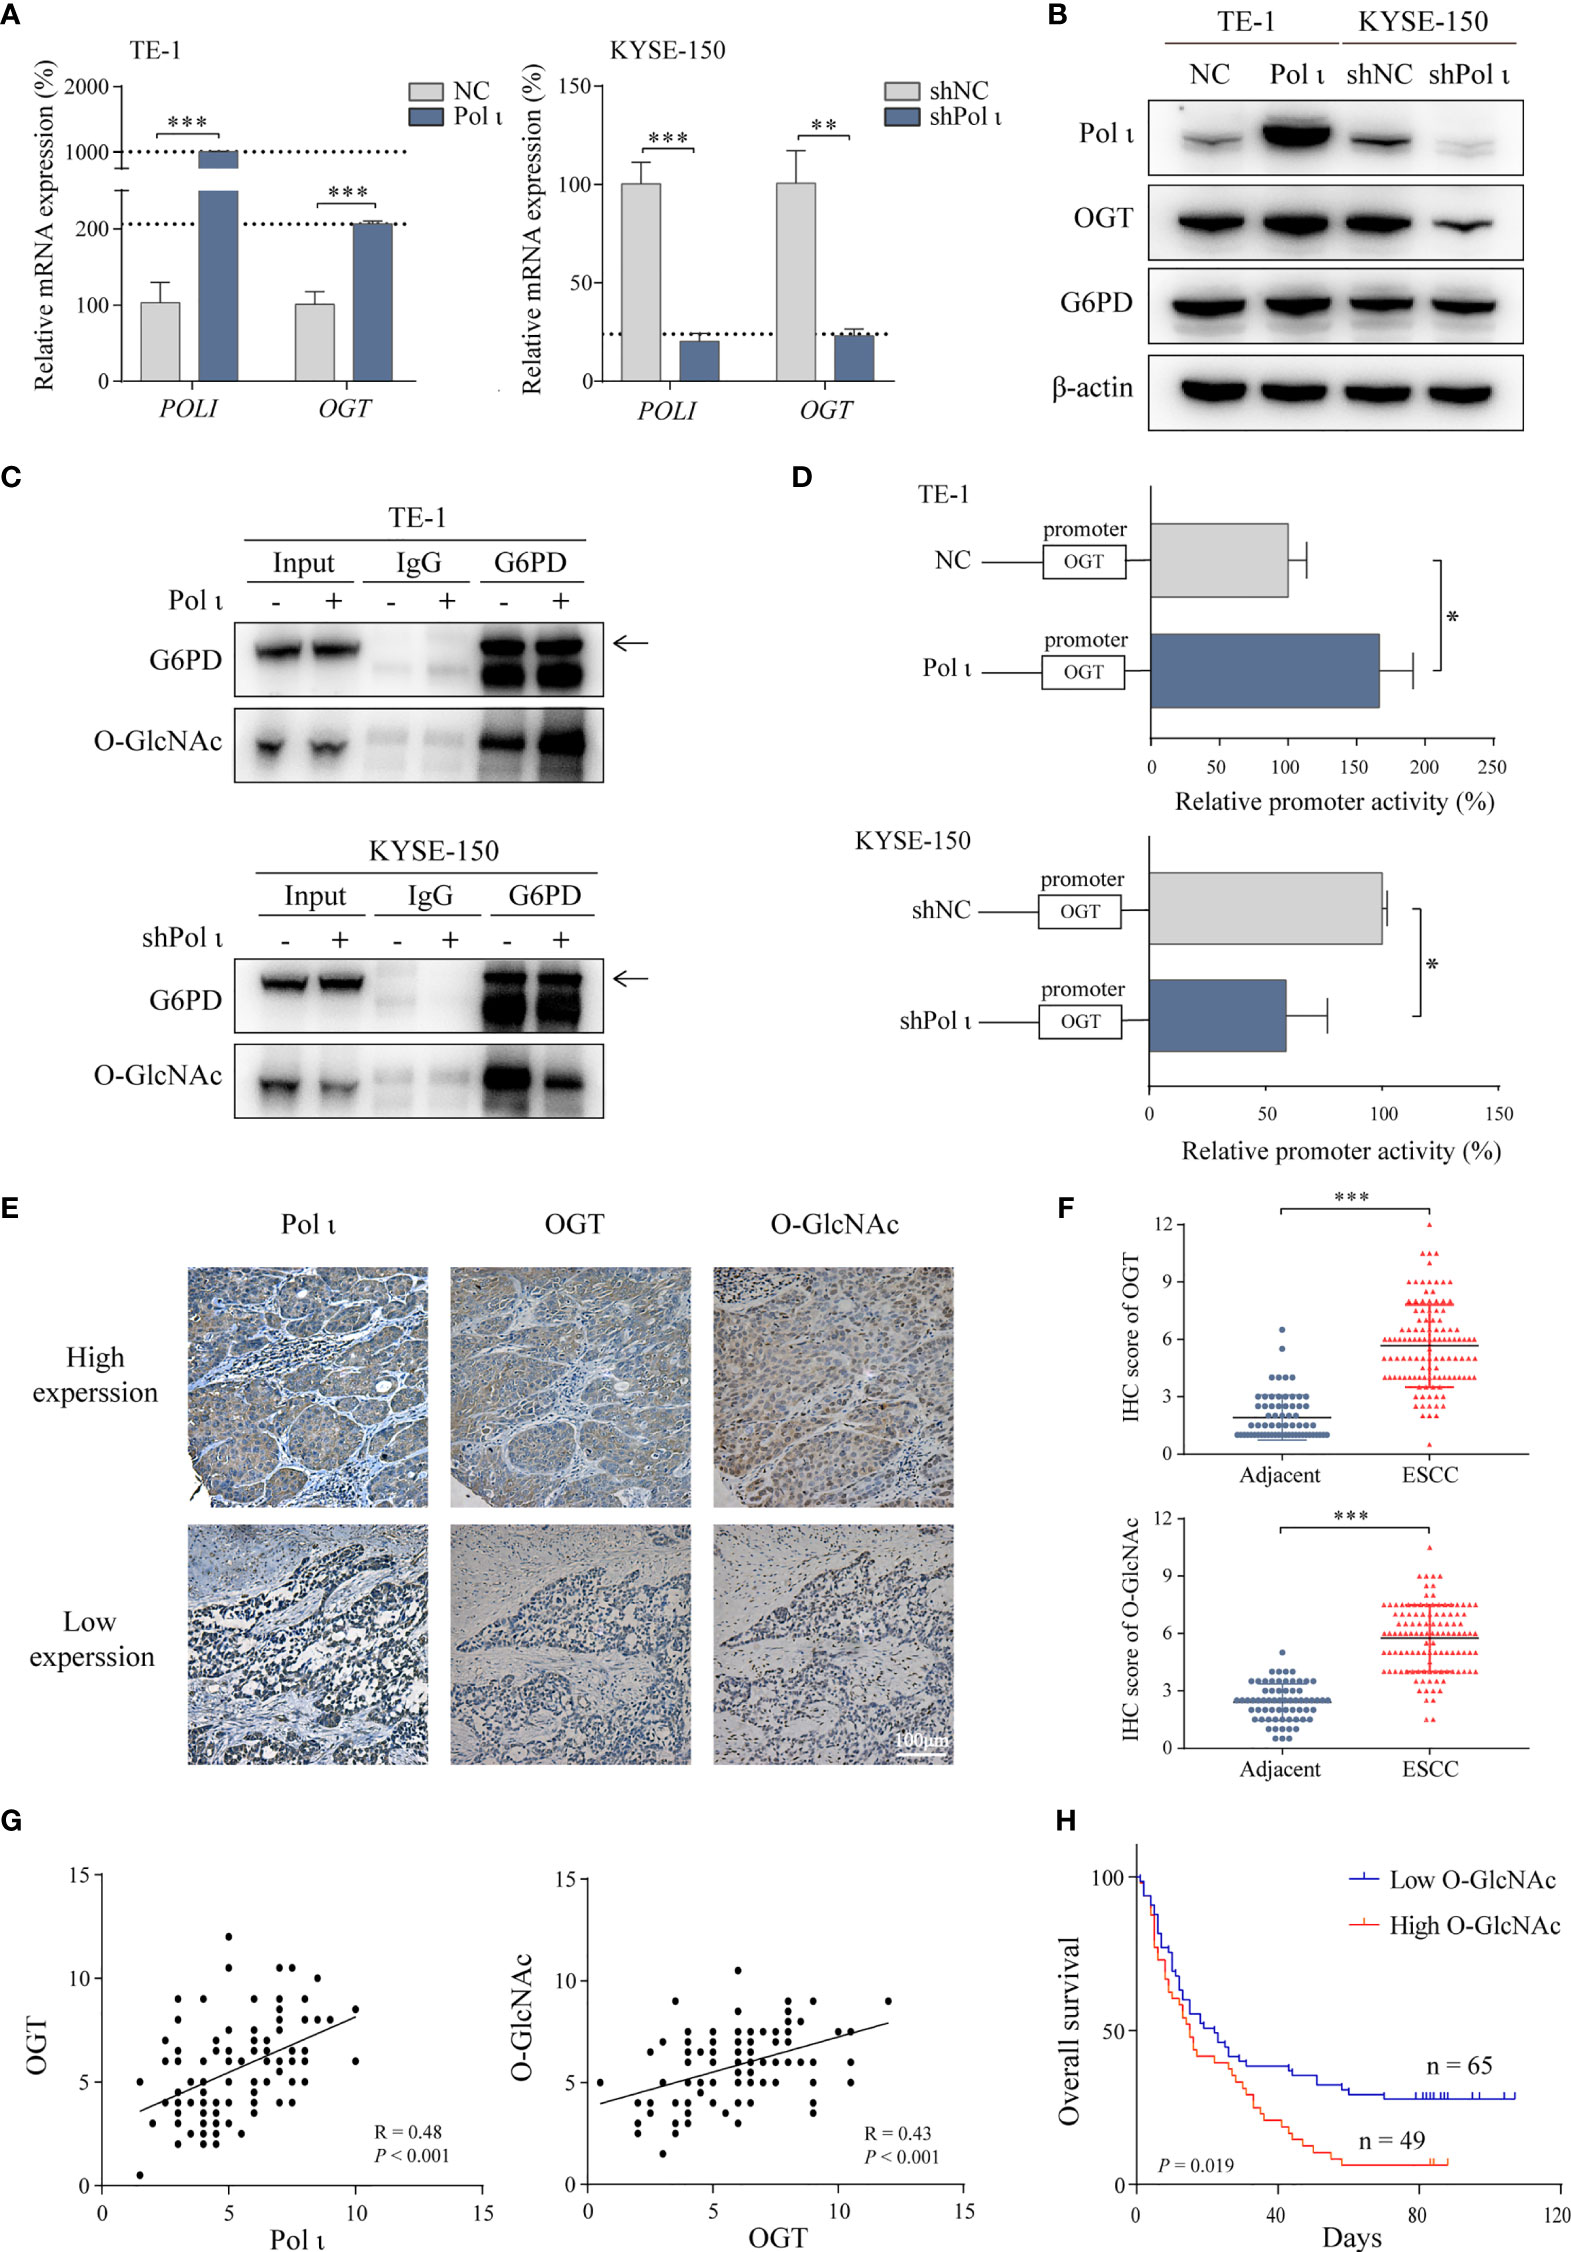
Figure 3 Pol ι activates G6PD through OGT-promoted O-GlcNAcylation. (A) The relative mRNA level of POLI and OGT in Pol ι differentially expressed TE-1 and KYSE-150 cells. (B) the protein level of Pol ι, OGT and G6PD. (C) O-GlcNAcylation of G6PD was detected after G6PD immunoprecipitation in ESCC cells. (D) the promoter of OGT (-2000 to +500 bp) was cloned into pGL-4 vector. The pGL4-OGT and internal control reporter vector pRL-TK were co-transfected into TE-1 and KYSE-150 cells. The relative OGT promoter activity was detected by dual-luciferase reporter assay. (E) Immunohistochemical staining of Pol ι, OGT and protein O-GlcNAcylation in paraffin-embedded ESCC tissues. Scale bar = 100 μm. (F) level of OGT and protein O-GlcNAcylation in ESCC and adjacent tissues based on IHC score. (G) The correlation between Pol ι and OGT, and the correlation between OGT and protein O-GlcNAcylation were evaluated based on IHC score in 114 tumor tissue samples. (H) Survival analysis based on the IHC score of protein O-GlcNAcylation in 114 ESCC samples. Kaplan–Meier survival analysis was applied. *P < 0.05, **P < 0.01, ***P < 0.001.
These results indicated that Pol ι directs the glucose flux to PPP through activation of G6PD.
Since the enzymatic activity of G6PD is tightly regulated by OGT induced O-GlcNAcylation (30) and OGT was found to be downregulated when Pol ι was knocked down in KYSE-150 cells (Figure 2B), we postulated that Pol ι may modulate G6PD activity by regulating OGT expression. As shown in Figures 3A, B, both quantitative RT-PCR and Western blot assay indicated that OGT expression is enhanced in TE-1 Pol ι cells while decreased in KYSE-150 shPol ι cells. Moreover, the protein level of G6PD remained unchanged. Subsequently, we detected the O-GlcNAcylation of immunoprecipitated G6PD using an O-GlcNAcylation antibody RL2. As shown in Figure 3C, overexpression of Pol ι increased and downregulation of Pol ι decreased the O-GlcNAcylation of G6PD, indicating that OGT induced O-GlcNAcylation of G6PD is regulated by Pol ι. We further assessed the OGT promoter activity using dual-luciferase reporter assay and found that the OGT promoter activity is significantly increased in Pol ι overexpressed TE-1 cells and decreased in Pol ι downregulated KYSE-150 cells (Figure 3D).
We also tested the expression of Pol ι, OGT and O-GlcNAcylation in tissues of 114 ESCC patients by IHC. Pol ι and OGT positive staining were mainly found in the cytoplasm, while O-GlcNAcylation positive staining was found in both the nucleus and cytoplasm (Figure 3E). The level of OGT and protein O-GlcNAcylation was significantly higher in tumor tissues than that in adjacent tissues (Figure 3F). The correlation between Pol ι, OGT and O-GlcNAcylation based on their IHC score was further analyzed. As shown in Figure 3G, Pol ι expression was positively correlated with that of OGT (r = 0.48, P < 0.001). Similarly, OGT expression was also positively correlated with the level of O-GlcNAcylation (r = 0.43, P < 0.001). We then applied Kaplan–Meier survival analysis and found that patients harboring a higher level of O-GlcNAcylation exhibit poor prognosis (P = 0.019, Figure 3H).
Taken together, these data showed that Pol ι induces OGT expression to promote G6PD O-GlcNAcylation and activation. Moreover, Elevated O-GlcNAcylation correlates with increased tumor size and poor patient prognosis.
It has been reported that the Erk signaling pathway is responsible for the transcriptional regulation of OGT (33). Therefore, we evaluated the role of Erk in Pol ι regulated OGT transcription. In line with our previous study, overexpression of Pol ι enhances and knockdown of Pol ι diminishes the phosphorylation of Erk (Figure 4A). Subsequently, we used a specific inhibitor PD98059 to inhibit Erk phosphorylation in Pol ι overexpressed TE-1 cell lines. As shown in Figure 4B, PD98059 inhibited Erk phosphorylation in a concentration-dependent manner, and decreased OGT protein expression. Moreover, the inhibited Erk phosphorylation was associated with reduced OGT mRNA expression (Figure 4C) and OGT promoter activity (Figure 4D) in Pol ι overexpressed TE-1 cell lines.
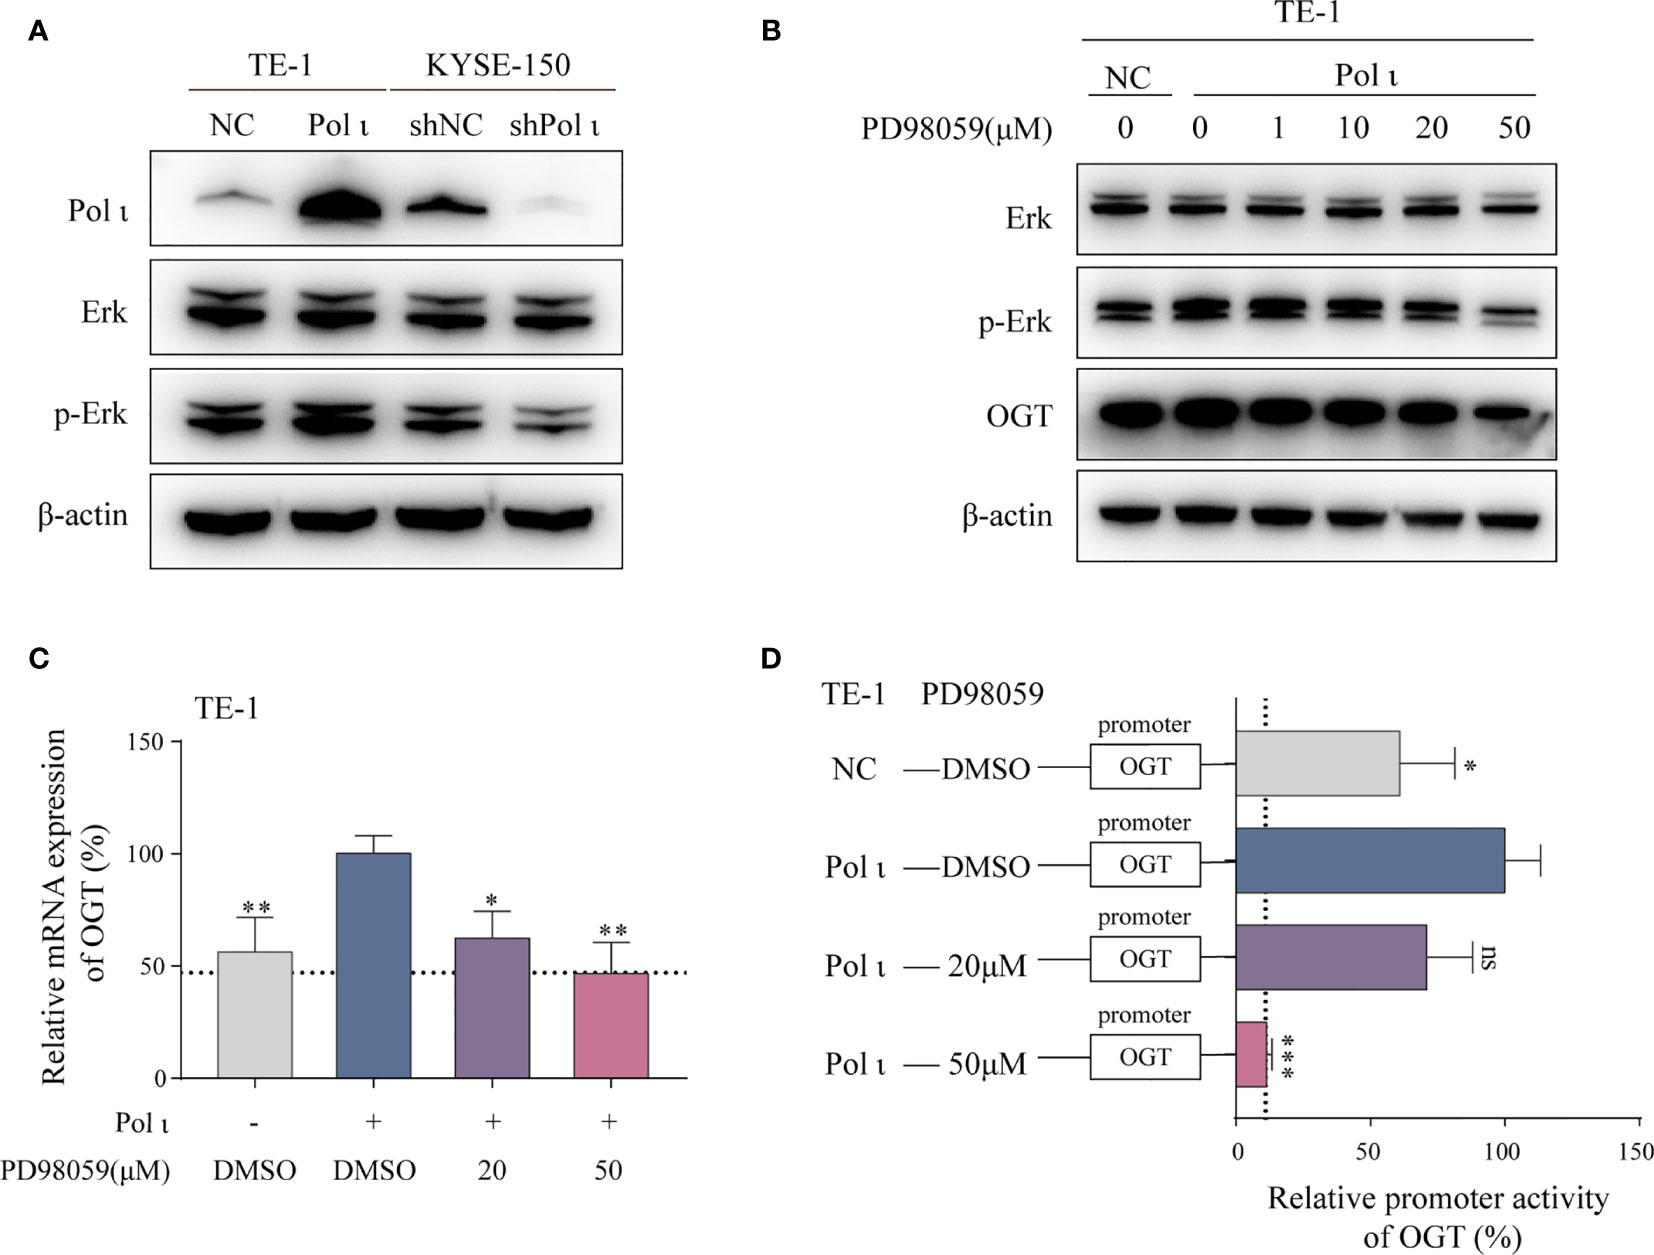
Figure 4 Pol ι regulates OGT expression through the Erk signaling pathway. (A) Western blot confirmation of Pol ι expression and Erk phosphorylation. (B) PD98059 inhibited Erk phosphorylation and OGT expression in a dose-dependent manner. PD98059 attenuated OGT mRNA expression (C) and promoter activity (D) in TE-1 cells. *P < 0.05, **P < 0.01, ***P < 0.001.
Altogether, these findings indicated that OGT expression is regulated by the Pol ι-Erk signaling cascade.
To further corroborate the role of G6PD activation in Pol ι-induced ESCC proliferation, a known G6PD inhibitor termed polydatin, a natural molecule found in Polygonum cuspidatum, was used to restrain the G6PD activity in Pol ι overexpressed TE-1 cells and wild type KYSE-150 cells. As shown in Figure 5A, we found that the enzymatic activity of G6PD decreases in a concentration-dependent manner in both cell lines once treated with increasing concentrations of polydatin. Similarly, cellular NADPH concentrations were also reduced when higher polydatin concentration was used (Figure 5B). We next assessed the influence of G6PD inactivation on cell proliferation. Results from colony formation assay and EdU Cell Proliferation assay indicated that polydatin treatment significantly reduces ESCC cell proliferation compared with the DMSO treated group (Figures 5C, D).
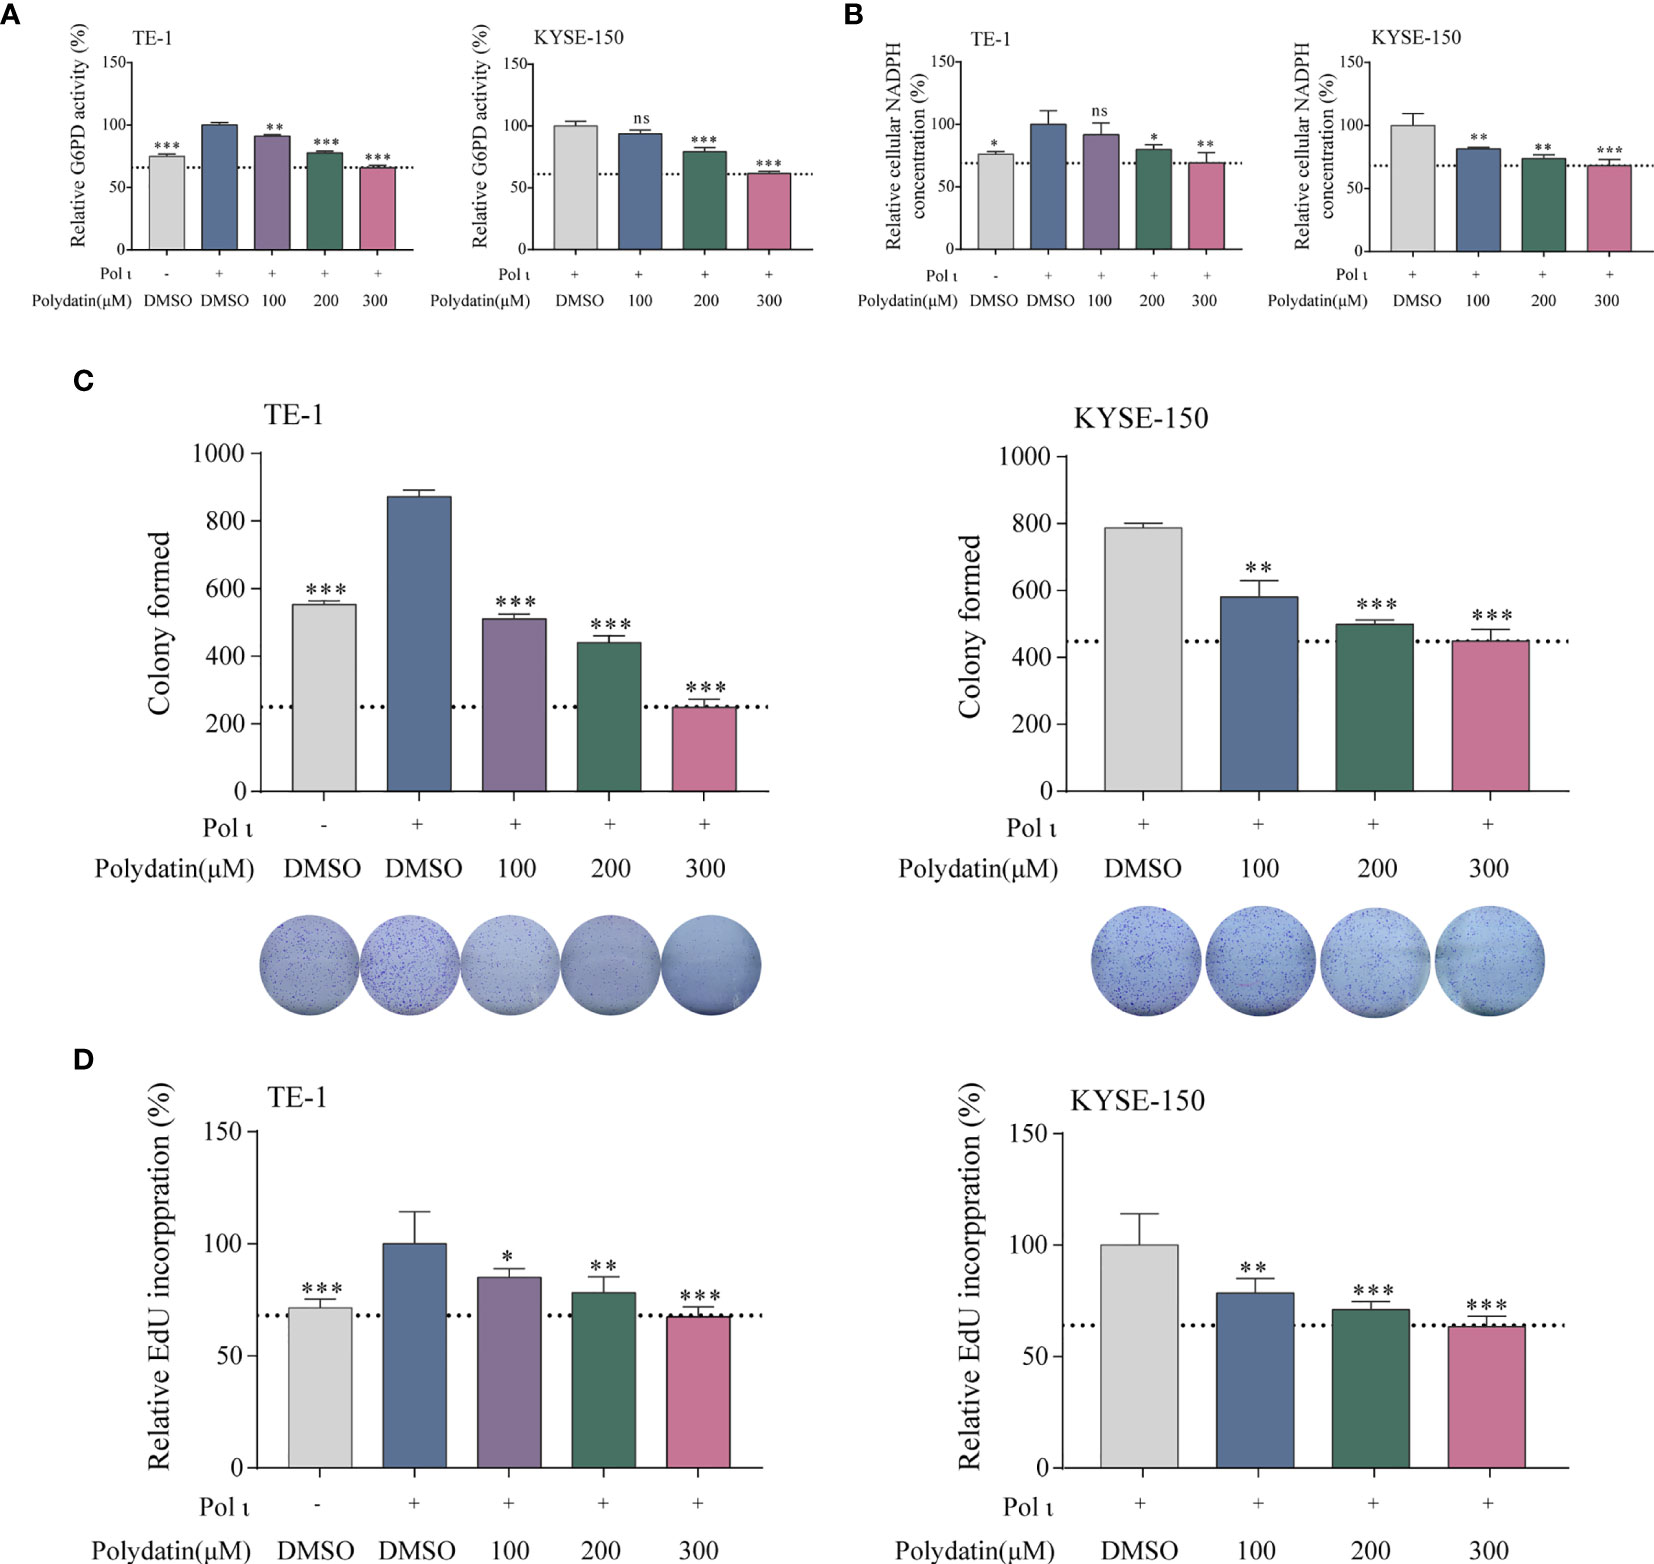
Figure 5 The G6PD inhibitor polydatin suppresses ESCC cell proliferation. G6PD activity (A) and cellular NADPH concentration (B) decreased in a dose-dependent manner upon polydatin treatment. ESCC cell proliferation after polydatin treatment was assessed by colony formation assay (C) and EdU incorporation assay (D). *P < 0.05, **P < 0.01, ***P < 0.001.
Thus, it is obvious that G6PD activity is critical to Pol ι-induced proliferation in vitro.
We further tested the role of Pol ι and G6PD activation in ESCC cell proliferation in vivo. The TE-1 NC and TE-1 Pol ι cells were injected subcutaneously into female nude mice. For drug treatment, 5 mg/kg polydatin dissolved in normal saline was injected intraperitoneally every other day after the average tumor size grew up to 300 mm3. Mice in control groups were administrated with the same volume of normal saline. As seen in Figure 6A, forced expression of Pol ι promoted tumor growth in TE-1 Pol ι cells comparing with control TE-1 cells, whereas polydatin treatment significantly suppressed Pol ι-induced proliferation of TE-1 cells. Further enzymatic activity assay confirmed the inhibition of G6PD by polydatin in tumor tissues (Figure 6B). We then performed IHC to verify the expression of OGT and O-GlcNAcylation. As presented in Figure 6C, a concomitant ascending tendency of OGT and O-GlcNAcylation with Pol ι overexpression was evident.
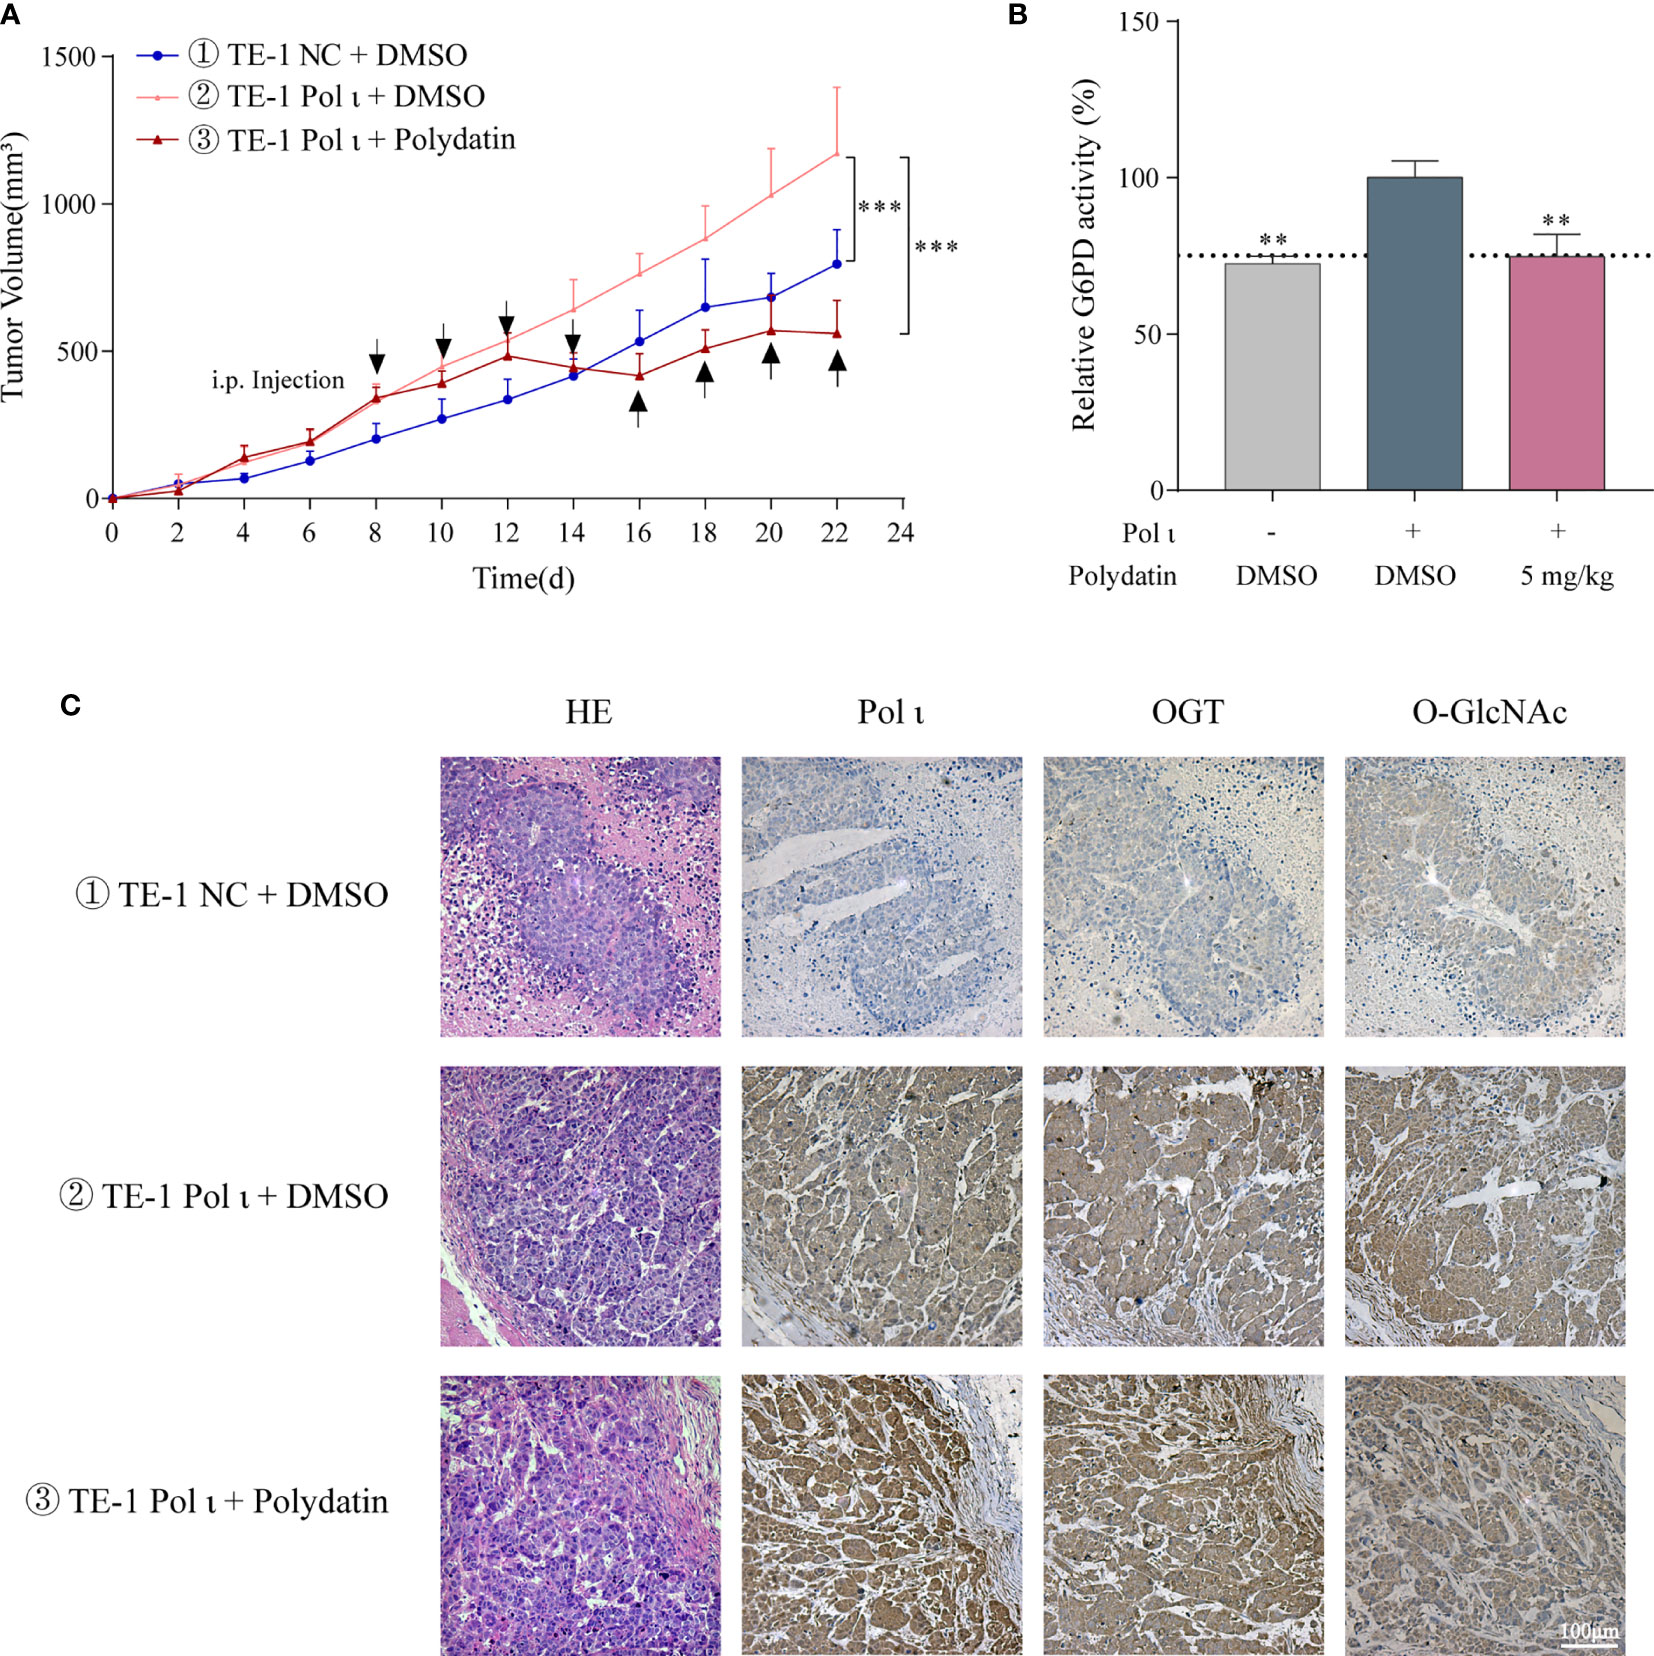
Figure 6 Pol ι promotes ESCC cell proliferation through G6PD activation in vivo. (A) the tumor volume of xenograft nude mice with different Pol ι expression. Mice were divided into three groups when the average tumor size grew up to 300 mm3. 5 mg/kg polydatin was intraperitoneally injected every other day. Same volume of normal saline was used as control. (B) relative G6PD activity in tumor tissue. (C) hematoxylin and eosin (HE) staining and immunohistochemical staining of Pol ι, OGT and protein O-GlcNAcylation in tumors. **P < 0.01, ***P < 0.001. Scale bar = 100 μm.
These results demonstrated that G6PD activity is vital for Pol ι-promoted ESCC cell proliferation in vivo.
Activation of G6PD plays a pivotal role in cancer proliferation and progression. It shunts glucose flux towards PPP to meet the demands for ribose-5-phosphate and NADPH (17, 18). In this study, Pol ι was found to promote ESCC proliferation by activating G6PD. Pol ι activates G6PD through OGT-mediated G6PD O-GlcNAcylation, and inhibition of G6PD activity by the specific inhibitor polydatin attenuates Pol ι-promoted ESCC cell proliferation both in vitro and in vivo. Our findings show that Pol ι plays a critical role in ESCC proliferation and progression.
Several lines of evidence indicate that G6PD is a critical effector in Pol ι-promoted ESCC cell proliferation through redirection of glucose flux. First, results from GSEA and seahorse analyzer demonstrated that in KYSE-150 cells, Pol ι downregulation triggers increased oxidative phosphorylation, which is previously reported to impede glucose metabolism and tumor cell proliferation (18). Furthermore, G6PD activity and cellular NADPH concentration are reduced in KYSE-150 shPol ι cells. These results indicate that after Pol ι downregulation, the glucose flux is oriented towards oxidative phosphorylation due to G6PD deactivation. Second, Pol ι upregulation in TE-1 cells results in enhanced G6PD activity and cellular NADPH concentration, suggesting augmentation of glucose flux into PPP. Third, treatment with polydatin, the specific inhibitor of G6PD (34–36), inhibits Pol ι-promoted ESCC cell proliferation both in vitro and in vivo. These results indicate that G6PD activity is essential for Pol ι-promoted ESCC proliferation.
G6PD overactivation in tumor cells is regulated at the transcriptional or posttranslational level (17, 21, 22, 27–29). As shown in Figure 3B, the expression of G6PD remains unchanged in Pol ι differentially expressed cells, suggesting that posttranslational modification may be responsible for G6PD activation, such as OGT induced O-GlcNAcylation (30). Consistent with this assumption, Pol ι upregulation enhances and Pol ι downregulation attenuates G6PD O-GlcNAcylation in our ESCC model systems. It is known that O-GlcNAcylation activates G6PD through enhancing NADP+ binding to G6PD and promoting the formation of oligomeric G6PD, leading to increased glucose flux towards PPP (30). As a consequence, cell proliferation and tumor progression are enhanced (17, 19, 29, 30). Therefore, our data indicated that G6PD activation by OGT-induced O-GlcNAcylation promotes ESCC proliferation.
OGT promotes protein O-GlcNAcylation (37, 38) and has been found to be upregulated in most cancers including ESCC (39, 40). In the present study, we found that total O-GlcNAcylation level is correlated with OGT expression and poor patient prognosis (R = 0.43, Figures 3F, G). One of the key regulators contributing to OGT overexpression is the hyperactive Erk signaling cascade in cancer (33). The Erk pathway is deregulated in about one-third of human cancers and is one of the key signaling pathways that contribute to cancer proliferation (32). It has been reported that DNA polymerase iota (Pol ι) can interact with p53 (41, 42), which regulates Erk signaling pathway (43–45). Hence, it is possible that Erk signaling pathway is activated by Pol ι via the DNA damage repair system.
Therefore, we postulate that elevated OGT may result from Pol ι overexpression in ESCC (14). Our results indicated that the expression of Pol ι is positively correlated with that of OGT in ESCC cells and patient samples (R = 0.48, Figure 3F). Furthermore, Pol ι coupled Erk signaling enhances the OGT promoter activity which can be suppressed by PD98059, the MEK signaling specific inhibitor (46). There are four MEK activated MAPK cascades that have been defined: Erk 1/2, c-Jun N terminal kinase (JNK), p38 MAPK and Erk5 (47, 48). It is reported that the MEK inhibitor PD98059 has no effect on the activation of JNK (49) and p38 (50). Otherwise, evidence suggested that PD98059 inhibits both Erk 1/2 and Erk 5 pathways (51). However, it is Erk 1/2 but not Erk 5 activated Elk-1 transcriptional activity (52), which was reported to mediate Erk signaling-induced OGT expression (33). Therefore, in our study, PD98059 induced OGT downregulation is mainly due to its inhibitory effect of Erk 1/2 cascade. Hence, our findings demonstrate that Pol ι enhances OGT expression through the Erk signaling cascade.
However, in the context of Pol ι regulation of OGT expression in ESCC cells, there are still some research gaps to be filled. First, the transcriptional factors responsible for Erk-induced OGT expression in ESCC need to be identified. Second, further scrutiny is required to identify glycosylated proteins in addition to G6PD. Future studies will be carried out to fully understand how Pol ι promotes OGT overexpression and protein O-GlcNAcylation.
In conclusion, the results from the present study demonstrate that Pol ι promotes ESCC proliferation through the Erk-OGT cascade-induced G6PD overactivation. This study provides novel insight into ESCC proliferation and progression, indicating that Pol ι is a potential biomarker and therapeutic target of ESCC.
The original contributions presented in the study are included in the article/Supplementary Material. Further inquiries can be directed to the corresponding authors.
Samples of human ESCC and adjacent tissues were obtained from The Affiliated Suzhou Hospital of Nanjing Medical University (Jiangsu, China) with informed consent. The patients/participants provided their written informed consent to participate in this study. The animal study was reviewed and approved by the Institutional Ethics Committee of Nanjing Medical University.
ZS designed the study, performed the experiments, analyzed the data and wrote the manuscript. AG designed the study and performed the experiments. XL performed animal experiments. SZ analyzed the clinical data. CH: designed the study, analyzed the data and wrote the manuscript. JW and JZ supervised the study, reviewed and edited the manuscript. W-QD reviewed and edited the manuscript. All authors contributed to the article and approved the submitted version.
The present study was supported by the National Natural Science Foundation of China (81672975, 81802341), the Six Talent Peaks Project of Jiangsu Province of China (WSN095), “333” Project of Jiangsu Province of China (BRA2016071), the Suzhou Administration of Science & Technology (SYS2019091) and the Suzhou Key Medical Center (SZZX201506).
The authors declare that the research was conducted in the absence of any commercial or financial relationships that could be construed as a potential conflict of interest.
The Supplementary Material for this article can be found online at: https://www.frontiersin.org/articles/10.3389/fonc.2021.706337/full#supplementary-material
1. Sung H, Ferlay J, Siegel RL, Laversanne M, Soerjomataram I, Jemal A, et al. Global Cancer Statistics 2020: GLOBOCAN Estimates of Incidence and Mortality Worldwide for 36 Cancers in 185 Countries. CA Cancer J Clin (2021) 7:209–49. doi: 10.3322/caac.21660
2. Abnet CC, Arnold M, Wei WQ. Epidemiology of Esophageal Squamous Cell Carcinoma. Gastroenterology (2018) 154:360–73. doi: 10.1053/j.gastro.2017.08.023
3. Alsop BR, Sharma P. Esophageal Cancer. Gastroenterol Clin North Am (2016) 45:399–412. doi: 10.1016/j.gtc.2016.04.001
4. Lagergren J, Smyth E, Cunningham D, Lagergren P. Oesophageal Cancer. Lancet (2017) 390:2383–96. doi: 10.1016/S0140-6736(17)31462-9
5. Smyth EC, Lagergren J, Fitzgerald RC, Lordick F, Shah MA, Lagergren P, et al. Oesophageal Cancer. Nat Rev Dis Primers (2017) 3:17048. doi: 10.1038/nrdp.2017.48
6. Chen W, Zheng R, Baade PD, Zhang S, Zeng H, Bray F, et al. Cancer Statistics in China, 2015. CA Cancer J Clin (2016) 66:115–32. doi: 10.3322/caac.21338
7. Codipilly DC, Qin Y, Dawsey SM, Kisiel J, Topazian M, Ahlquist D, et al. Screening for Esophageal Squamous Cell Carcinoma: Recent Advances. Gastrointest Endosc (2018) 88:413–26. doi: 10.1016/j.gie.2018.04.2352
8. McIntyre J. Polymerase Iota - an Odd Sibling Among Y Family Polymerases. DNA Repair (Amst) (2020) 86:102753. doi: 10.1016/j.dnarep.2019.102753
9. Tissier A, McDonald JP, Frank EG, Woodgate R. Poliota, a Remarkably Error-Prone Human DNA Polymerase. Genes Dev (2000) 14:1642–50. doi: 10.1101/gad.14.13.1642
10. Yang J, Chen Z, Liu Y, Hickey RJ, Malkas LH. Altered DNA Polymerase Iota Expression in Breast Cancer Cells Leads to a Reduction in DNA Replication Fidelity and a Higher Rate of Mutagenesis. Cancer Res (2004) 64:5597–607. doi: 10.1158/0008-5472.CAN-04-0603
11. Zou S, Xu Y, Chen X, He C, Gao A, Zhou J, et al. DNA Polymerase Iota (Pol Iota) Promotes the Migration and Invasion of Breast Cancer Cell Via EGFR-ERK-mediated Epithelial to Mesenchymal Transition. Cancer Biomark (2019) 24:363–70. doi: 10.3233/CBM-181516
12. Yuan F, Xu Z, Yang M, Wei Q, Zhang Y, Yu J, et al. Overexpressed DNA Polymerase Iota Regulated by JNK/c-Jun Contributes to Hypermutagenesis in Bladder Cancer. PloS One (2013) 8:e69317. doi: 10.1371/journal.pone.0069317
13. Wang H, Wu W, Wang HW, Wang S, Chen Y, Zhang X, et al. Analysis of Specialized DNA Polymerases Expression in Human Gliomas: Association With Prognostic Significance. Neuro Oncol (2010) 12:679–86. doi: 10.1093/neuonc/nop074
14. Zhou J, Zhang S, Xie L, Liu P, Xie F, Wu J, et al. Overexpression of DNA Polymerase Iota (Poliota) in Esophageal Squamous Cell Carcinoma. Cancer Sci (2012) 103:1574–9. doi: 10.1111/j.1349-7006.2012.02309.x
15. He C, Wu S, Gao A, Su Y, Min H, Shang ZF, et al. Phosphorylation of ETS-1 Is a Critical Event in DNA Polymerase Iota-Induced Invasion and Metastasis of Esophageal Squamous Cell Carcinoma. Cancer Sci (2017) 108:2503–10. doi: 10.1111/cas.13399
16. Zou S, Shang ZF, Liu B, Zhang S, Wu J, Huang M, et al. DNA Polymerase Iota (Pol Iota) Promotes Invasion and Metastasis of Esophageal Squamous Cell Carcinoma. Oncotarget (2016) 7:32274–85. doi: 10.18632/oncotarget.8580
17. Patra KC, Hay N. The Pentose Phosphate Pathway and Cancer. Trends Biochem Sci (2014) 39:347–54. doi: 10.1016/j.tibs.2014.06.005
18. Pavlova NN, Thompson CB. The Emerging Hallmarks of Cancer Metabolism. Cell Metab (2016) 23:27–47. doi: 10.1016/j.cmet.2015.12.006
19. Stincone A, Prigione A, Cramer T, Wamelink MM, Campbell K, Cheung E, et al. The Return of Metabolism: Biochemistry and Physiology of the Pentose Phosphate Pathway. Biol Rev Camb Philos Soc (2015) 90:927–63. doi: 10.1111/brv.12140
20. Munemoto M, Mukaisho KI, Miyashita T, Oyama K, Haba Y, Okamoto K, et al. Roles of the Hexosamine Biosynthetic Pathway and Pentose Phosphate Pathway in Bile Acid-Induced Cancer Development. Cancer Sci (2019) 110:2408–20. doi: 10.1111/cas.14105
21. Wu S, Wang H, Li Y, Xie Y, Huang C, Zhao H, et al. Transcription Factor Yy1 Promotes Cell Proliferation by Directly Activating the Pentose Phosphate Pathway. Cancer Res (2018) 78:4549–62. doi: 10.1158/0008-5472.CAN-17-4047
22. Wang YP, Zhou LS, Zhao YZ, Wang SW, Chen LL, Liu LX, et al. Regulation of G6PD Acetylation by SIRT2 and KAT9 Modulates NADPH Homeostasis and Cell Survival During Oxidative Stress. EMBO J (2014) 33:1304–20. doi: 10.1002/embj.201387224
23. Zhang Y, Chen M, Liu M, Xu Y, Wu G. Glycolysis-Related Genes Serve as Potential Prognostic Biomarkers in Clear Cell Renal Cell Carcinoma. Oxid Med Cell Longev (2021) 2021:6699808. doi: 10.1155/2021/6699808
24. Lu M, Lu L, Dong Q, Yu G, Chen J, Qin L, et al. Elevated G6PD Expression Contributes to Migration and Invasion of Hepatocellular Carcinoma Cells by Inducing Epithelial-Mesenchymal Transition. Acta Biochim Biophys Sin (Shanghai) (2018) 50:370–80. doi: 10.1093/abbs/gmy009
25. Tsouko E, Khan AS, White MA, Han JJ, Shi Y, Merchant FA, et al. Regulation of the Pentose Phosphate Pathway by an Androgen Receptor-mTOR-mediated Mechanism and Its Role in Prostate Cancer Cell Growth. Oncogenesis (2014) 3:e103. doi: 10.1038/oncsis.2014.18
26. Wang X, Li X, Zhang X, Fan R, Gu H, Shi Y, et al. Glucose-6-Phosphate Dehydrogenase Expression is Correlated With Poor Clinical Prognosis in Esophageal Squamous Cell Carcinoma. Eur J Surg Oncol (2015) 41:1293–9. doi: 10.1016/j.ejso.2015.08.155
27. Ma H, Zhang F, Zhou L, Cao T, Sun D, Wen S, et al. c-Src Facilitates Tumorigenesis by Phosphorylating and Activating G6PD. Oncogene (2021) 40:2567–80. doi: 10.1038/s41388-021-01673-0
28. Du W, Jiang P, Mancuso A, Stonestrom A, Brewer MD, Minn AJ, et al. Tap73 Enhances the Pentose Phosphate Pathway and Supports Cell Proliferation. Nat Cell Biol (2013) 15:991–1000. doi: 10.1038/ncb2789
29. Cho ES, Cha YH, Kim HS, Kim NH, Yook JI. The Pentose Phosphate Pathway as a Potential Target for Cancer Therapy. Biomol Ther (Seoul) (2018) 26:29–38. doi: 10.4062/biomolther.2017.179
30. Rao X, Duan X, Mao W, Li X, Li Z, Li Q, et al. O-GlcNAcylation of G6PD Promotes the Pentose Phosphate Pathway and Tumor Growth. Nat Commun (2015) 6:8468. doi: 10.1038/ncomms9468
31. Mootha VK, Lindgren CM, Eriksson KF, Subramanian A, Sihag S, Lehar J, et al. PGC-1alpha-Responsive Genes Involved in Oxidative Phosphorylation are Coordinately Downregulated in Human Diabetes. Nat Genet (2003) 34:267–73. doi: 10.1038/ng1180
32. Subramanian A, Tamayo P, Mootha VK, Mukherjee S, Ebert BL, Gillette MA, et al. Gene Set Enrichment Analysis: A Knowledge-Based Approach for Interpreting Genome-Wide Expression Profiles. Proc Natl Acad Sci U S A (2005) 102:15545–50. doi: 10.1073/pnas.0506580102
33. Zhang X, Ma L, Qi J, Shan H, Yu W, Gu Y. MAPK/ERK Signaling Pathway-Induced hyper-O-GlcNAcylation Enhances Cancer Malignancy. Mol Cell Biochem (2015) 410:101–10. doi: 10.1007/s11010-015-2542-8
34. Adem S, Comakli V, Kuzu M, Demirdag R. Investigation of the Effects of Some Phenolic Compounds on the Activities of glucose-6-phosphate Dehydrogenase and 6-Phosphogluconate Dehydrogenase From Human Erythrocytes. J Biochem Mol Toxicol (2014) 28:510–4. doi: 10.1002/jbt.21592
35. Mele L, Paino F, Papaccio F, Regad T, Boocock D, Stiuso P, et al. A New Inhibitor of Glucose-6-Phosphate Dehydrogenase Blocks Pentose Phosphate Pathway and Suppresses Malignant Proliferation and Metastasis In Vivo. Cell Death Dis (2018) 9:572. doi: 10.1038/s41419-018-0635-5
36. Mele L, la Noce M, Paino F, Regad T, Wagner S, Liccardo D, et al. Glucose-6-Phosphate Dehydrogenase Blockade Potentiates Tyrosine Kinase Inhibitor Effect on Breast Cancer Cells Through Autophagy Perturbation. J Exp Clin Cancer Res (2019) 38:160. doi: 10.1186/s13046-019-1164-5
37. Hanover JA, Krause MW, Love DC. The Hexosamine Signaling Pathway: O-GlcNAc Cycling in Feast or Famine. Biochim Biophys Acta (2010) 1800:80–95. doi: 10.1016/j.bbagen.2009.07.017
38. Bond MR, Hanover JA. A Little Sugar Goes a Long Way: The Cell Biology of O-GlcNAc. J Cell Biol (2015) 208:869–80. doi: 10.1083/jcb.201501101
39. Itkonen HM, Loda M, Mills IG. O-GlcNAc Transferase - An Auxiliary Factor or a Full-Blown Oncogene? Mol Cancer Res (2021) 19:555–64. doi: 10.1158/1541-7786.MCR-20-0926
40. Qiao Z, Dang C, Zhou B, Li S, Zhang W, Jiang J, et al. O-Linked N-acetylglucosamine Transferase (OGT) Is Overexpressed and Promotes O-Linked Protein Glycosylation in Esophageal Squamous Cell Carcinoma. J BioMed Res (2012) 26:268–73. doi: 10.7555/JBR.26.20110121
41. Biber S, Pospiech H, Gottifredi V, Wiesmuller L. Multiple Biochemical Properties of the p53 Molecule Contribute to Activation of Polymerase Iota-Dependent DNA Damage Tolerance. Nucleic Acids Res (2020) 48:12188–203. doi: 10.1093/nar/gkaa974
42. Hampp S, Kiessling T, Buechle K, Mansilla SF, Thomale J, Rall M, et al. DNA Damage Tolerance Pathway Involving DNA Polymerase Iota and the Tumor Suppressor p53 Regulates DNA Replication Fork Progression. Proc Natl Acad Sci U S A (2016) 113:E4311–9. doi: 10.1073/pnas.1605828113
43. Chen SL, Liu LL, Wang CH, Lu SX, Yang X, He YF, et al. Loss of RDM1 Enhances Hepatocellular Carcinoma Progression Via p53 and Ras/Raf/ERK Pathways. Mol Oncol (2020) 14:373–86. doi: 10.1002/1878-0261.12593
44. Lee SJ, Lee SH, Yoon MH, Park BJ. A New p53 Target Gene, RKIP, Is Essential for DNA Damage-Induced Cellular Senescence and Suppression of ERK Activation. Neoplasia (2013) 15:727–37. doi: 10.1593/neo.121862
45. Lee SY, Choi HC, Choe YJ, Shin SJ, Lee SH, Kim HS. Nutlin-3 Induces BCL2A1 Expression by Activating ELK1 Through the Mitochondrial P53-ROS-ERK1/2 Pathway. Int J Oncol (2014) 45:675–82. doi: 10.3892/ijo.2014.2463
46. Kojima K, Konopleva M, Samudio IJ, Ruvolo V, Andreeff M. Mitogen-Activated Protein Kinase Kinase Inhibition Enhances Nuclear Proapoptotic Function of p53 in Acute Myelogenous Leukemia Cells. Cancer Res (2007) 67:3210–9. doi: 10.1158/0008-5472.CAN-06-2712
47. Guo YJ, Pan WW, Liu SB, Shen ZF, Xu Y.Hu LL. ERK/MAPK Signalling Pathway and Tumorigenesis. Exp Ther Med (2020) 19:1997–2007. doi: 10.3892/etm.2020.8454
48. Wang Y, Zhang X, Gao L, Li J, Chen W, Chi J, et al. Cortistatin Exerts Antiproliferation and Antimigration Effects in Vascular Smooth Muscle Cells Stimulated by Ang II Through Suppressing ERK1/2, P38 MAPK, JNK and ERK5 Signaling Pathways. Ann Transl Med (2019) 7:561. doi: 10.21037/atm.2019.09.45
49. Alessi DR, Cuenda A, Cohen P, Dudley DT, Saltiel AR. PD 098059 Is a Specific Inhibitor of the Activation of Mitogen-Activated Protein Kinase Kinase In Vitro and In Vivo. J Biol Chem (1995) 270:27489–94. doi: 10.1074/jbc.270.46.27489
50. Sharma GD, He J, Bazan HE. p38 and ERK1/2 Coordinate Cellular Migration and Proliferation in Epithelial Wound Healing: Evidence of Cross-Talk Activation Between MAP Kinase Cascades. J Biol Chem (2003) 278:21989–97. doi: 10.1074/jbc.M302650200
51. Nishimoto S, Nishida E. MAPK Signalling: ERK5 Versus ERK1/2. EMBO Rep (2006) 7:782–6. doi: 10.1038/sj.embor.7400755
Keywords: DNA polymerase iota, Erk signaling pathway, ESCC, G6PD activity, tumor proliferation
Citation: Su Z, Gao A, Li X, Zou S, He C, Wu J, Ding W-Q and Zhou J (2021) DNA Polymerase Iota Promotes Esophageal Squamous Cell Carcinoma Proliferation Through Erk-OGT-Induced G6PD Overactivation. Front. Oncol. 11:706337. doi: 10.3389/fonc.2021.706337
Received: 07 May 2021; Accepted: 05 July 2021;
Published: 20 July 2021.
Edited by:
Shuyu Zhang, Sichuan University, ChinaReviewed by:
Xiaohe Yang, North Carolina Central University, United StatesCopyright © 2021 Su, Gao, Li, Zou, He, Wu, Ding and Zhou. This is an open-access article distributed under the terms of the Creative Commons Attribution License (CC BY). The use, distribution or reproduction in other forums is permitted, provided the original author(s) and the copyright owner(s) are credited and that the original publication in this journal is cited, in accordance with accepted academic practice. No use, distribution or reproduction is permitted which does not comply with these terms.
*Correspondence: Jundong Zhou, emhvdWp1bmRvbmczMzBAMTYzLmNvbQ==; Chao He, dG9kZGhlY2hhb0AxNjMuY29t; Jinchang Wu, d2ppbmNoYW5nQHNpbmEuY29t
†These authors have contributed equally to this work
Disclaimer: All claims expressed in this article are solely those of the authors and do not necessarily represent those of their affiliated organizations, or those of the publisher, the editors and the reviewers. Any product that may be evaluated in this article or claim that may be made by its manufacturer is not guaranteed or endorsed by the publisher.
Research integrity at Frontiers
Learn more about the work of our research integrity team to safeguard the quality of each article we publish.