 Qi Long Song1†
 Yongqiang Yu
95% of researchers rate our articles as excellent or good
Learn more about the work of our research integrity team to safeguard the quality of each article we publish.
Find out more
ORIGINAL RESEARCH article
Front. Oncol. , 03 August 2021
Sec. Genitourinary Oncology
Volume 11 - 2021 | https://doi.org/10.3389/fonc.2021.704645
This article is part of the Research Topic The role of Precision Medicine in the Genitourinary Cancer View all 6 articles
Background: People residing in rural areas have higher prostate cancer (PCa) mortality to incidence ratio (M/I) and worse prognosis than those in urban areas of China. Clinical characteristics at initial diagnosis are significantly associated with biochemical recurrence, overall survival, and PCa disease-free survival.
Objective: This study aimed at investigating the clinical characteristics at initial diagnosis of urban and rural PCa patients and to establish a logistic regression model for identifying independent predictors for high-grade PCa.
Materials and Methods: Clinical characteristics for PCa patients were collected from the largest prostate biopsy center in Anhui province, China, from December 2015 to March 2019. First, urban–rural disparities in clinical characteristics were evaluated at initial diagnosis. Second, based on pathological findings, we classified all participants into the benign+ low/intermediate-grade PCa or high-grade PCa groups. Univariate and multivariate logistic regression analyses were performed to identify independent factors for predicting high-grade PCa, while a nomogram for predicting high-grade PCa was generated based on all independent factors. The model was evaluated using area under receiver-operating characteristic (ROC) curve as well as calibration curve analyses and compared to a model without the place of residence factor of individuals.
Results: Statistically significant differences were observed between urban and rural PCa patients with regard to tPSA, PSA density (PSAD), and Gleason score (GS) (p < 0.05). Logistic regression analysis revealed that tPSA [OR = 1.060, 95% confidence interval (CI): 1.024, 1.098], PSAD (OR = 14.678, 95%CI: 4.137, 52.071), place of residence of individuals (OR = 5.900, 95%CI: 1.068, 32.601), and prostate imaging reporting and data system version 2 (PI-RADS v2) (OR = 4.360, 95%CI: 1.953, 9.733) were independent predictive factors for high-grade PCa. The area under the curve (AUC) of the nomogram was greater than that of the model without the place of residence of individuals. The calibration curve of the nomogram indicated that the prediction curve was basically fitted to the standard curve, suggesting that the prediction model had a better calibration ability.
Conclusions: Compared to urban PCa patients, rural PCa patients presented elevated tPSA, PSAD levels, and higher pathological grades. The place of residence of the individuals was an independent predictor for high-grade PCa in Anhui Province, China. Therefore, appropriate strategies, such as narrowing urban-rural gaps in access to health care and increasing awareness on the importance of early detection should be implemented to reduce PCa mortality rates.
Globally, there were about 1.3 million new prostate cancer (PCa) cases and 358,989 associated mortalities in 2018 (1). Compared to North America and Northern Europe, documented PCa incidences were much lower in China (2). This could be attributed to environmental differences and/or protective effects of diets. It may also be due to a lack of PCa screening and early detection. PCa mortality-incidence ratio (M/I), as a parameter for evaluating the prognosis of PCa, has significantly decreased substantially in North America, coinciding with the initiation of widespread prostate-specific antigen (PSA) screening (3, 4). However, PCa M/I has always been high in China. According to the World Health Organization, there were 603,000 new documented PCa cases in mainland China and approximately 266,000 mortalities in 2015 (5). The PCa M/I ratio in China was about 44.11%, compared to only 11.65% in America (6). This M/I difference may be attributed to substantive genetic differences; however, this does not fully explain for the huge urban–rural disparity in PCa M/I ratio in China. In China, rural men exhibited higher M/I ratios as a result of PCa compared to men in urban areas. It has been reported that PCa M/I ratio was approximately 60% in rural areas, nearly three times higher than that in urban areas (7). Establishing the causes of this big disparity may improve health care services and reduce PCa M/I. Survival outcomes for PCa are significantly correlated with various factors, such as serum PSA levels and Gleason scores (GS) (8, 9). In the new five-tiered prostate cancer grading system proposed by Epstein and colleagues, high-grade PCa (GS ≥ 8) has a much higher likelihood for biochemical recurrence (BCR) following radical prostatectomy (RP) and a much higher mortality rate (10, 11).
Studies, including the European Randomized Study of Screening for Prostate Cancer (ERSPC), Prostate Cancer Prevention Trial risk calculation (PCPT-RC), and nomograms, have developed various predictive models for prostate biopsy results (12–14). However, these models have various limitations when applied in China. First, substantive differences in PSA levels exist between Western and Asian populations. Second, MP-MRI multiparametric MRI (MP-MRI) is rarely included in these models. Third, considering PCa M/I ratio differences between urban and rural areas, it is necessary to include the place of residence of the individuals into high-grade PCa models. In this study, we used data from the largest prostate biopsy center in Anhui province located inland in the eastern midlands of China. We investigated how clinical data at initial diagnosis vary between urban and rural PCa patients and if place of residence is an independent predictor for high-grade PCa. Finally, using the identified independent factors, we established a predictive model for high-grade PCa.
Ethical approval for this study was obtained from the institutional review board of the First Affiliated Hospital of Anhui Medical University, China. The study was performed in Anhui province, which had a total area of 140,100 km2 and had a population of 63.7 million people in 2019. Based on the categorization of districts and counties of Anhui Planning Bureau, there were 104 counties in Anhui Province, which included 45 urban counties and 59 rural counties (Figure 1). This was a retrospective study involving 914 participants undergoing diagnostic prostate transrectal ultrasound (TRUS)-guided 12+X core biopsy at our institution. The study was performed from December 2015 to March 2019. Seventeen participants were excluded as they were from neighboring provinces. Participants with PSA >100 ng/dl were excluded as extreme values (N = 23). Participants without MP-MRI examination data were also excluded (N = 107). Eleven participants who did not identify as urban or rural residents were also excluded. Therefore, the final analysis involved a total of 756 participants from 91 counties, 38 of them urban and 53 rural. The flow chart for participant recruitment and retention process is shown in Figure 2.
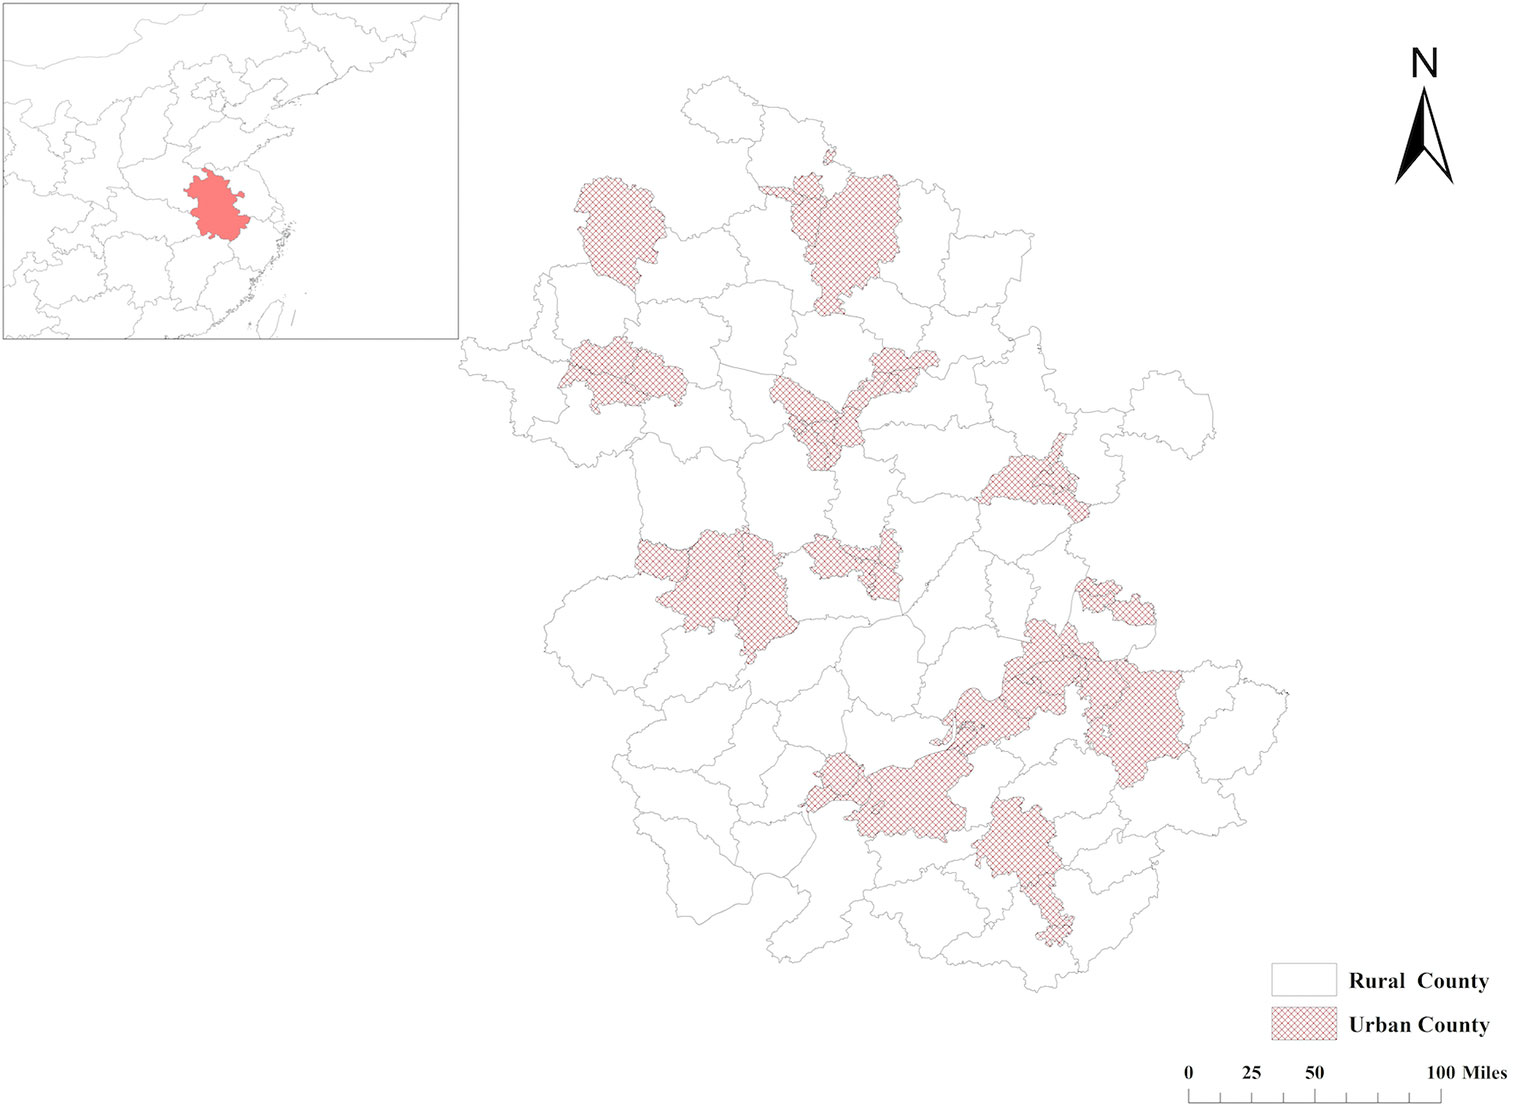
Figure 1 Distribution of urban and rural counties in Anhui Province, China.
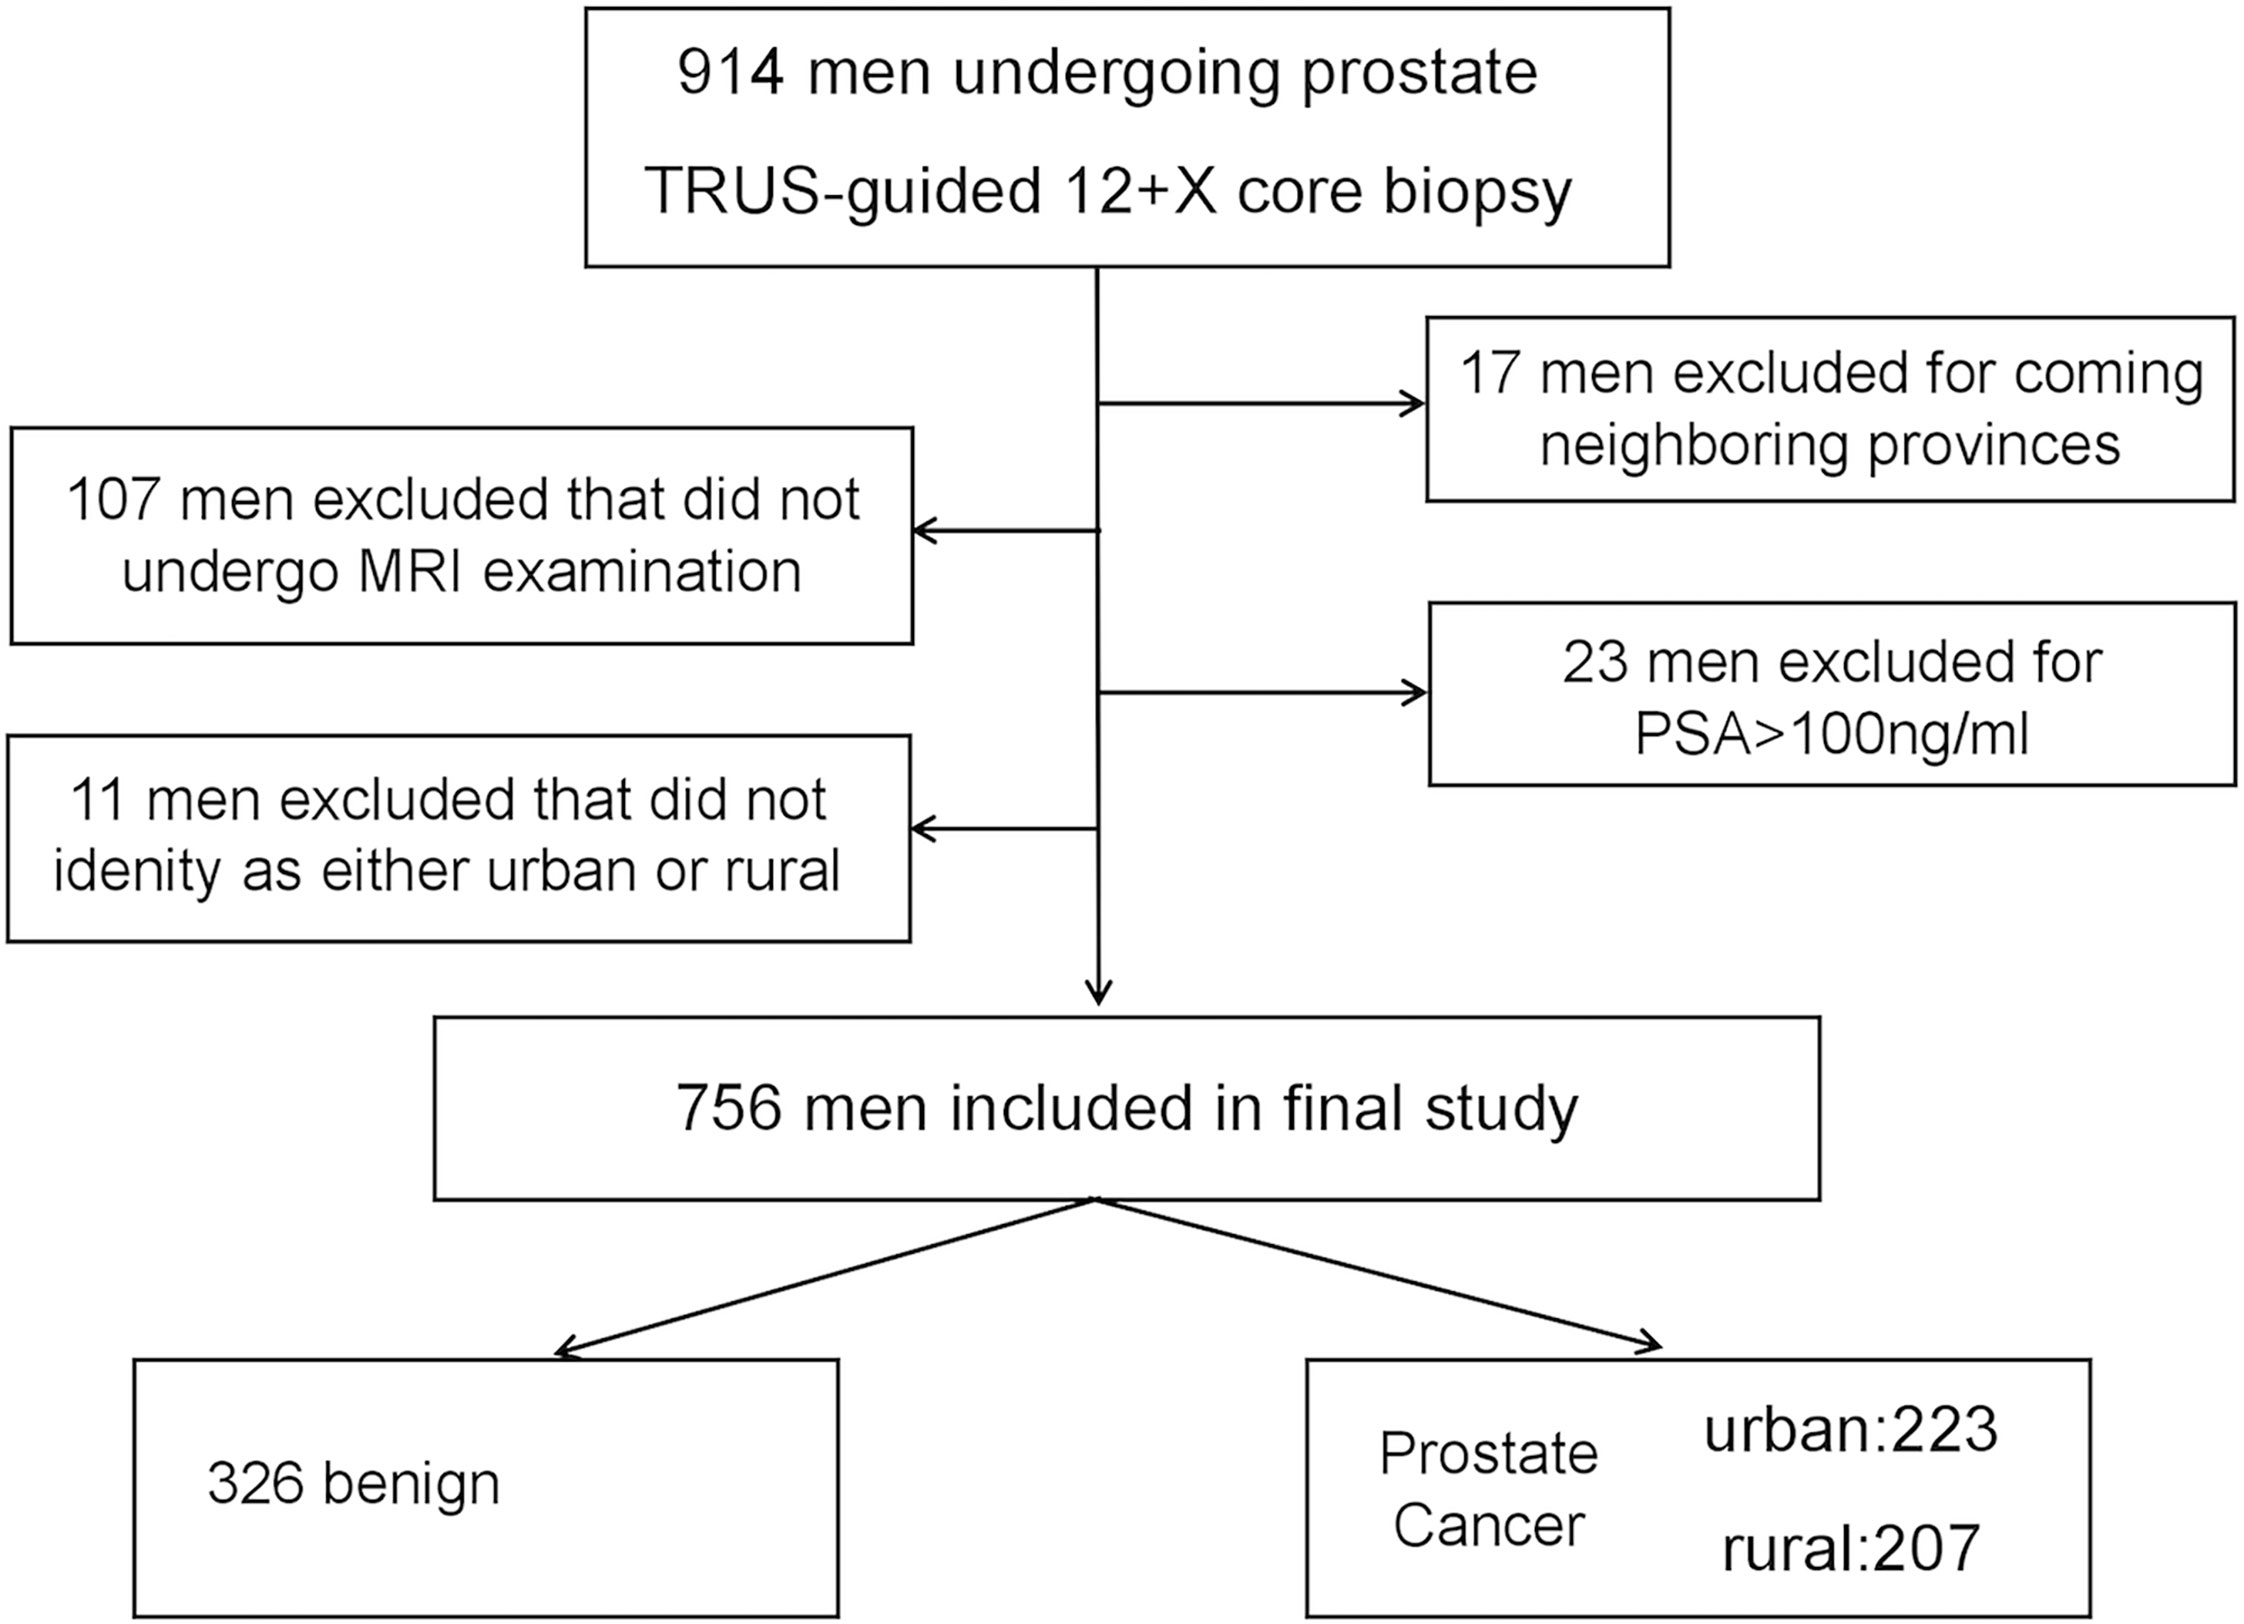
Figure 2 Flow chart schematic of study recruitment and retention.
Data for age, tPSA, fPSA, (f/t)PSA, PSA density (PSAD), prostate imaging reporting and data system version 2 (PI-RADS v2), body mass index (BMI), left-right, anteroposterior, and vertical prostate diameter, GS, and place of residence of the individual were extracted from the electronic medical record systems of the hospital and Picture Archiving and Communication Systems (PACS). Prostate volume was measured using a 3.0-T MRI system (GE 3.0T HDxt) and calculated as follows: volume = left-right diameter × vertical diameter × anteroposterior diameter × π/6. MRI images were centrally reviewed by two experienced radiologists with 5 and 7 years of experience in interpreting prostate MRI, respectively, using PI-RADS v2. The radiologists were blinded to the clinical data of the participants. When PI-RADS v2 categories were inconsistent, an arbitration expert (more senior radiologist with >15 years of experience) made the final decision. Based on the level of suspicion or risk of clinically significant prostate cancer (CSPCa), MRI results were divided into five categories (15).
All participants were subjected to TRUS-guided 12-core systematic biopsy (SB). In case suspected malignant nodules were seen on ultrasound or MRI images, additional two to four needle biopsies were performed in regions with abnormal echoes or signals. The TRUS-guided biopsy was performed as described by Presti JR (16). Based on the latest International Society of Urological Pathology (ISUP) Gleason Grading Group (GGG), pathological diagnoses were classified as benign, ISUP 1 (GS 6), ISUP 2 (GS 3 + 4), ISUP 3 (GS 4 + 3), ISUP 4 (GS 8), and ISUP 5 (GS 9–10) (17). We defined ISUP >3 as high-grade PCa based on previous studies (11, 12).
Statistical analyses were performed using the IBM SPSS 23.0 software (IBM), and additional graphics was generated in R version 3.5.1 (http://www.r-project.org). Normality of continuous clinical data distribution was tested through the Shapiro–Wilk test. For continuous data, t-test and non-parametric Mann–Whitney U tests were performed. The Chi-Square test was used for categorical data. Ranked data were analyzed using the Mann–Whitney U test. Multivariate logistic regression analyses were performed using the stepwise forward strategy to filter independent factors for high-grade PCa based on significant factors as determined by univariate analysis. Finally, a nomogram was developed using the Cox proportional hazards model and validated using area under the receiver-operating characteristic (ROC) curve and calibration curve analyses. The model was compared to the model lacking place of residence as a factor. P < 0.05 was set as the threshold for statistical significance.
A total of 756 participants with valid clinical data on age, tPSA, fPSA, PSAD, (f/t) PSA, prostate volume, BMI, PI-RADS v2, GS, and place of residence were enrolled in this study. Mean age, tPSA, fPSA, (f/tPSA), PSAD, prostate volume, and BMI were 70.46 ± 8.07 years old, 23.73 ± 11.78 ng/ml, 5.32 ± 3.13 ng/ml, 0.24 ± 0.16, 0.50 ± 0.29 ng/ml2, 51.26 ± 28.50 ml, and 23.10 ± 3.07, respectively. Among the participants, 44.2% were rural residents. Proportions of PI-RADS v2 categories 1–2, 3, 4, and 5 were 20.2, 31.4, 27.9, and 20.5, respectively. The proportions of benign, ISUP 1, ISUP 2, ISUP 3, ISUP 4, and ISUP 5 were 43.1, 5.8, 11.4, 12.7, 14.4, and 12.6%, respectively. Clinical characteristics at initial diagnosis were as shown in Tables 1 and 2.
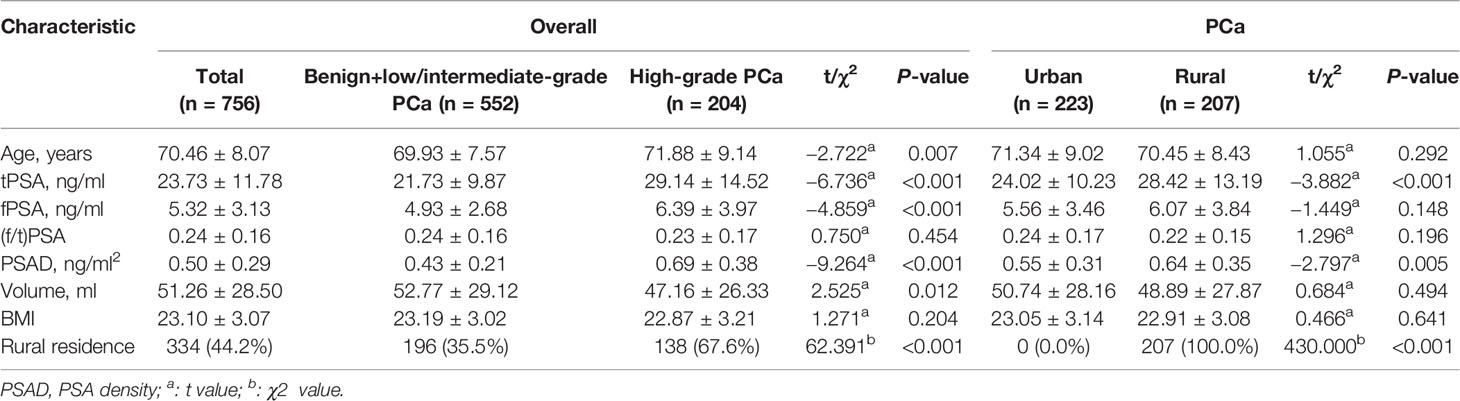
Table 1 Clinical characteristics of study participants.
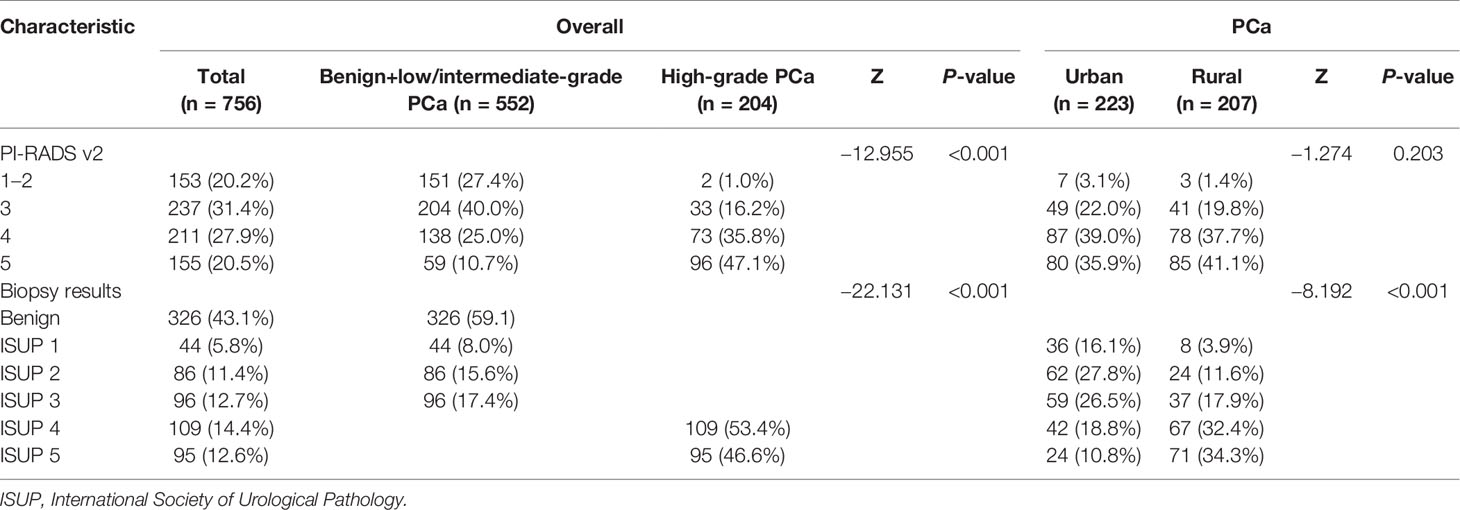
Table 2 PI-RADS v2 and biopsy results of study participants.
Of the 430 participants diagnosed with PCa, 223 were urban residents while 207 were rural residents. Mean tPSA and PSAD of rural patients were higher than those of their urban counterparts (p < 0.001, p = 0.005). Additionally, rural patients exhibited a higher pathologic grade than urban patients (p < 0.001). However, there were no significant differences between urban and rural subgroups with regard to age (p = 0.292), fPSA (p = 0.148), (f/t)PSA (p = 0.196), volume (p = 0.494), BMI (p = 0.641), and PI-RADS v2 (p = 0.203) (Tables 1 and 2).
Based on pathologic findings, participants were grouped into benign + low/intermediate-grade PCa group (n = 552) or high-grade PCa group (n = 204). In the univariate analysis, age, tPSA, fPSA, PSAD, volume, place of residence of the individual, and PI-RADS v2 reached the pre-specified criteria (p < 0.05) for use in stepwise multivariate analysis. Multivariate analysis identified tPSA, PSAD, place of residence, and PI-RADS v2 as independent predictors for high-grade PCa (Table 3). Next, tPSA, PSAD, and PI-RADS v2 were used to establish model 1 for predicting high-grade PCa. Then, places of residence of individuals were added to predictors in model 1 to generate model 2. Figure 3 shows the nomogram based on independent predictors in model 2. The nomogram had a c-index of 0.874. The criteria for using the nomogram: A point corresponded to each independent predictor while total points corresponded to the predicted risk value. For example: for an urban residence, if tPSA was 10 ng/ml, while PSAD was 0.25 ng/ml2, PI-RADS v2 category was 2, the corresponding points were 0, 12, 12, 30, then, total points were 54; the corresponding prostate biopsy result was about 10% of high-grade PCa. Calibration curve of the nomogram revealed that the prediction curve was basically fitted to the standard curve, suggesting that the prediction model had better calibration ability (Figure 4). The area under the ROC curve for model 1 was 0.867 (95% CI: 0.806, 0.927, p < 0.001) and 0.874 (95% CI: 0.815, 0.933, p < 0.001) for model 2. The model with places of residence exhibited slightly better predictive values than the one without (Figure 5).
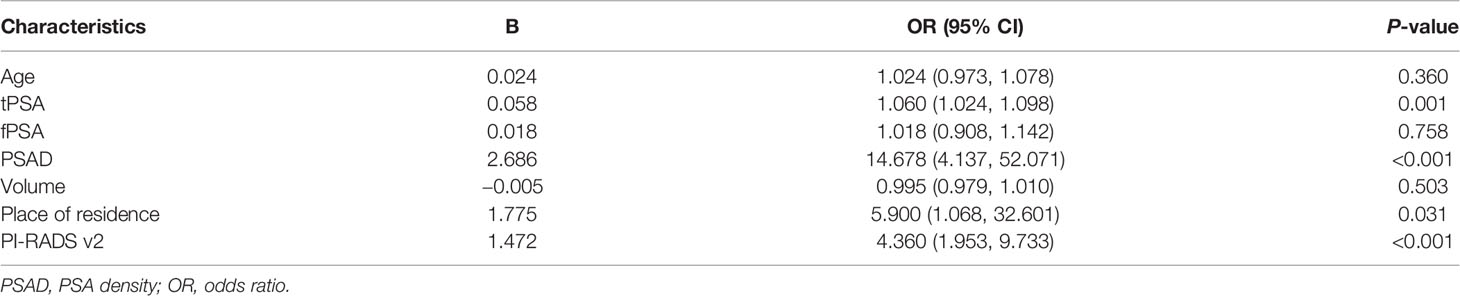
Table 3 Results of logistic regression analysis.
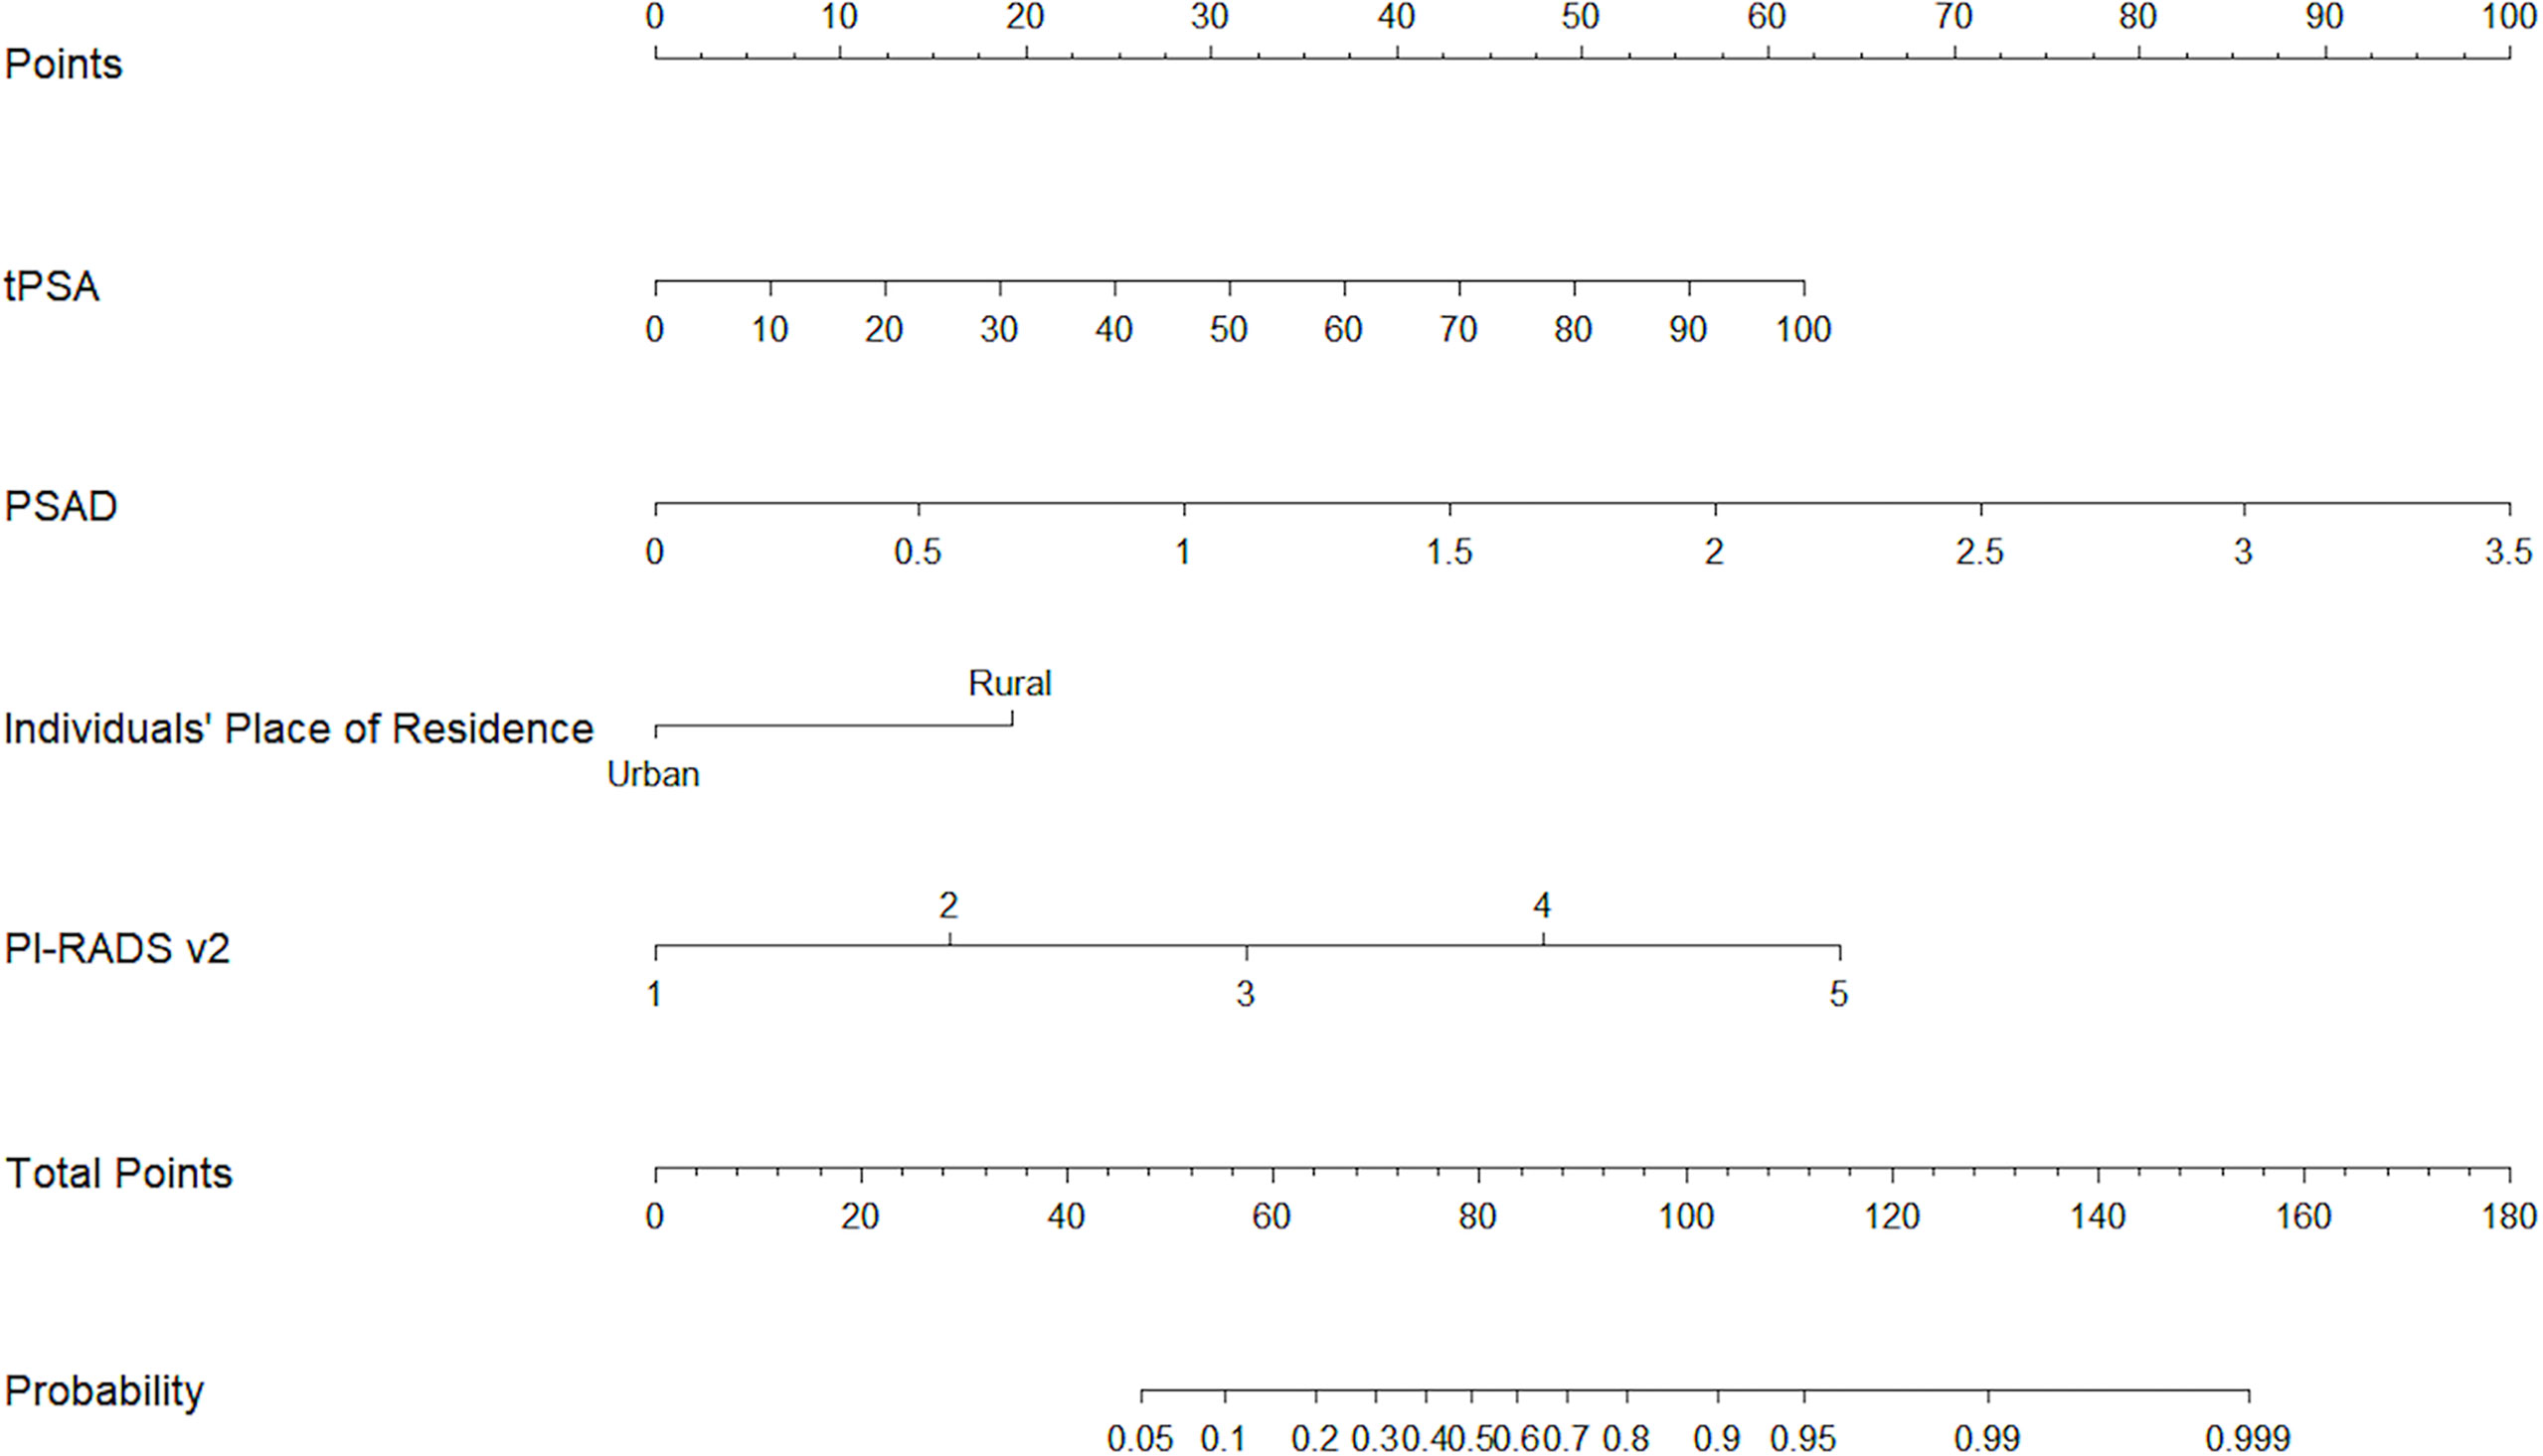
Figure 3 The nomogram for predicting prostate biopsy results for high-grade PCa.
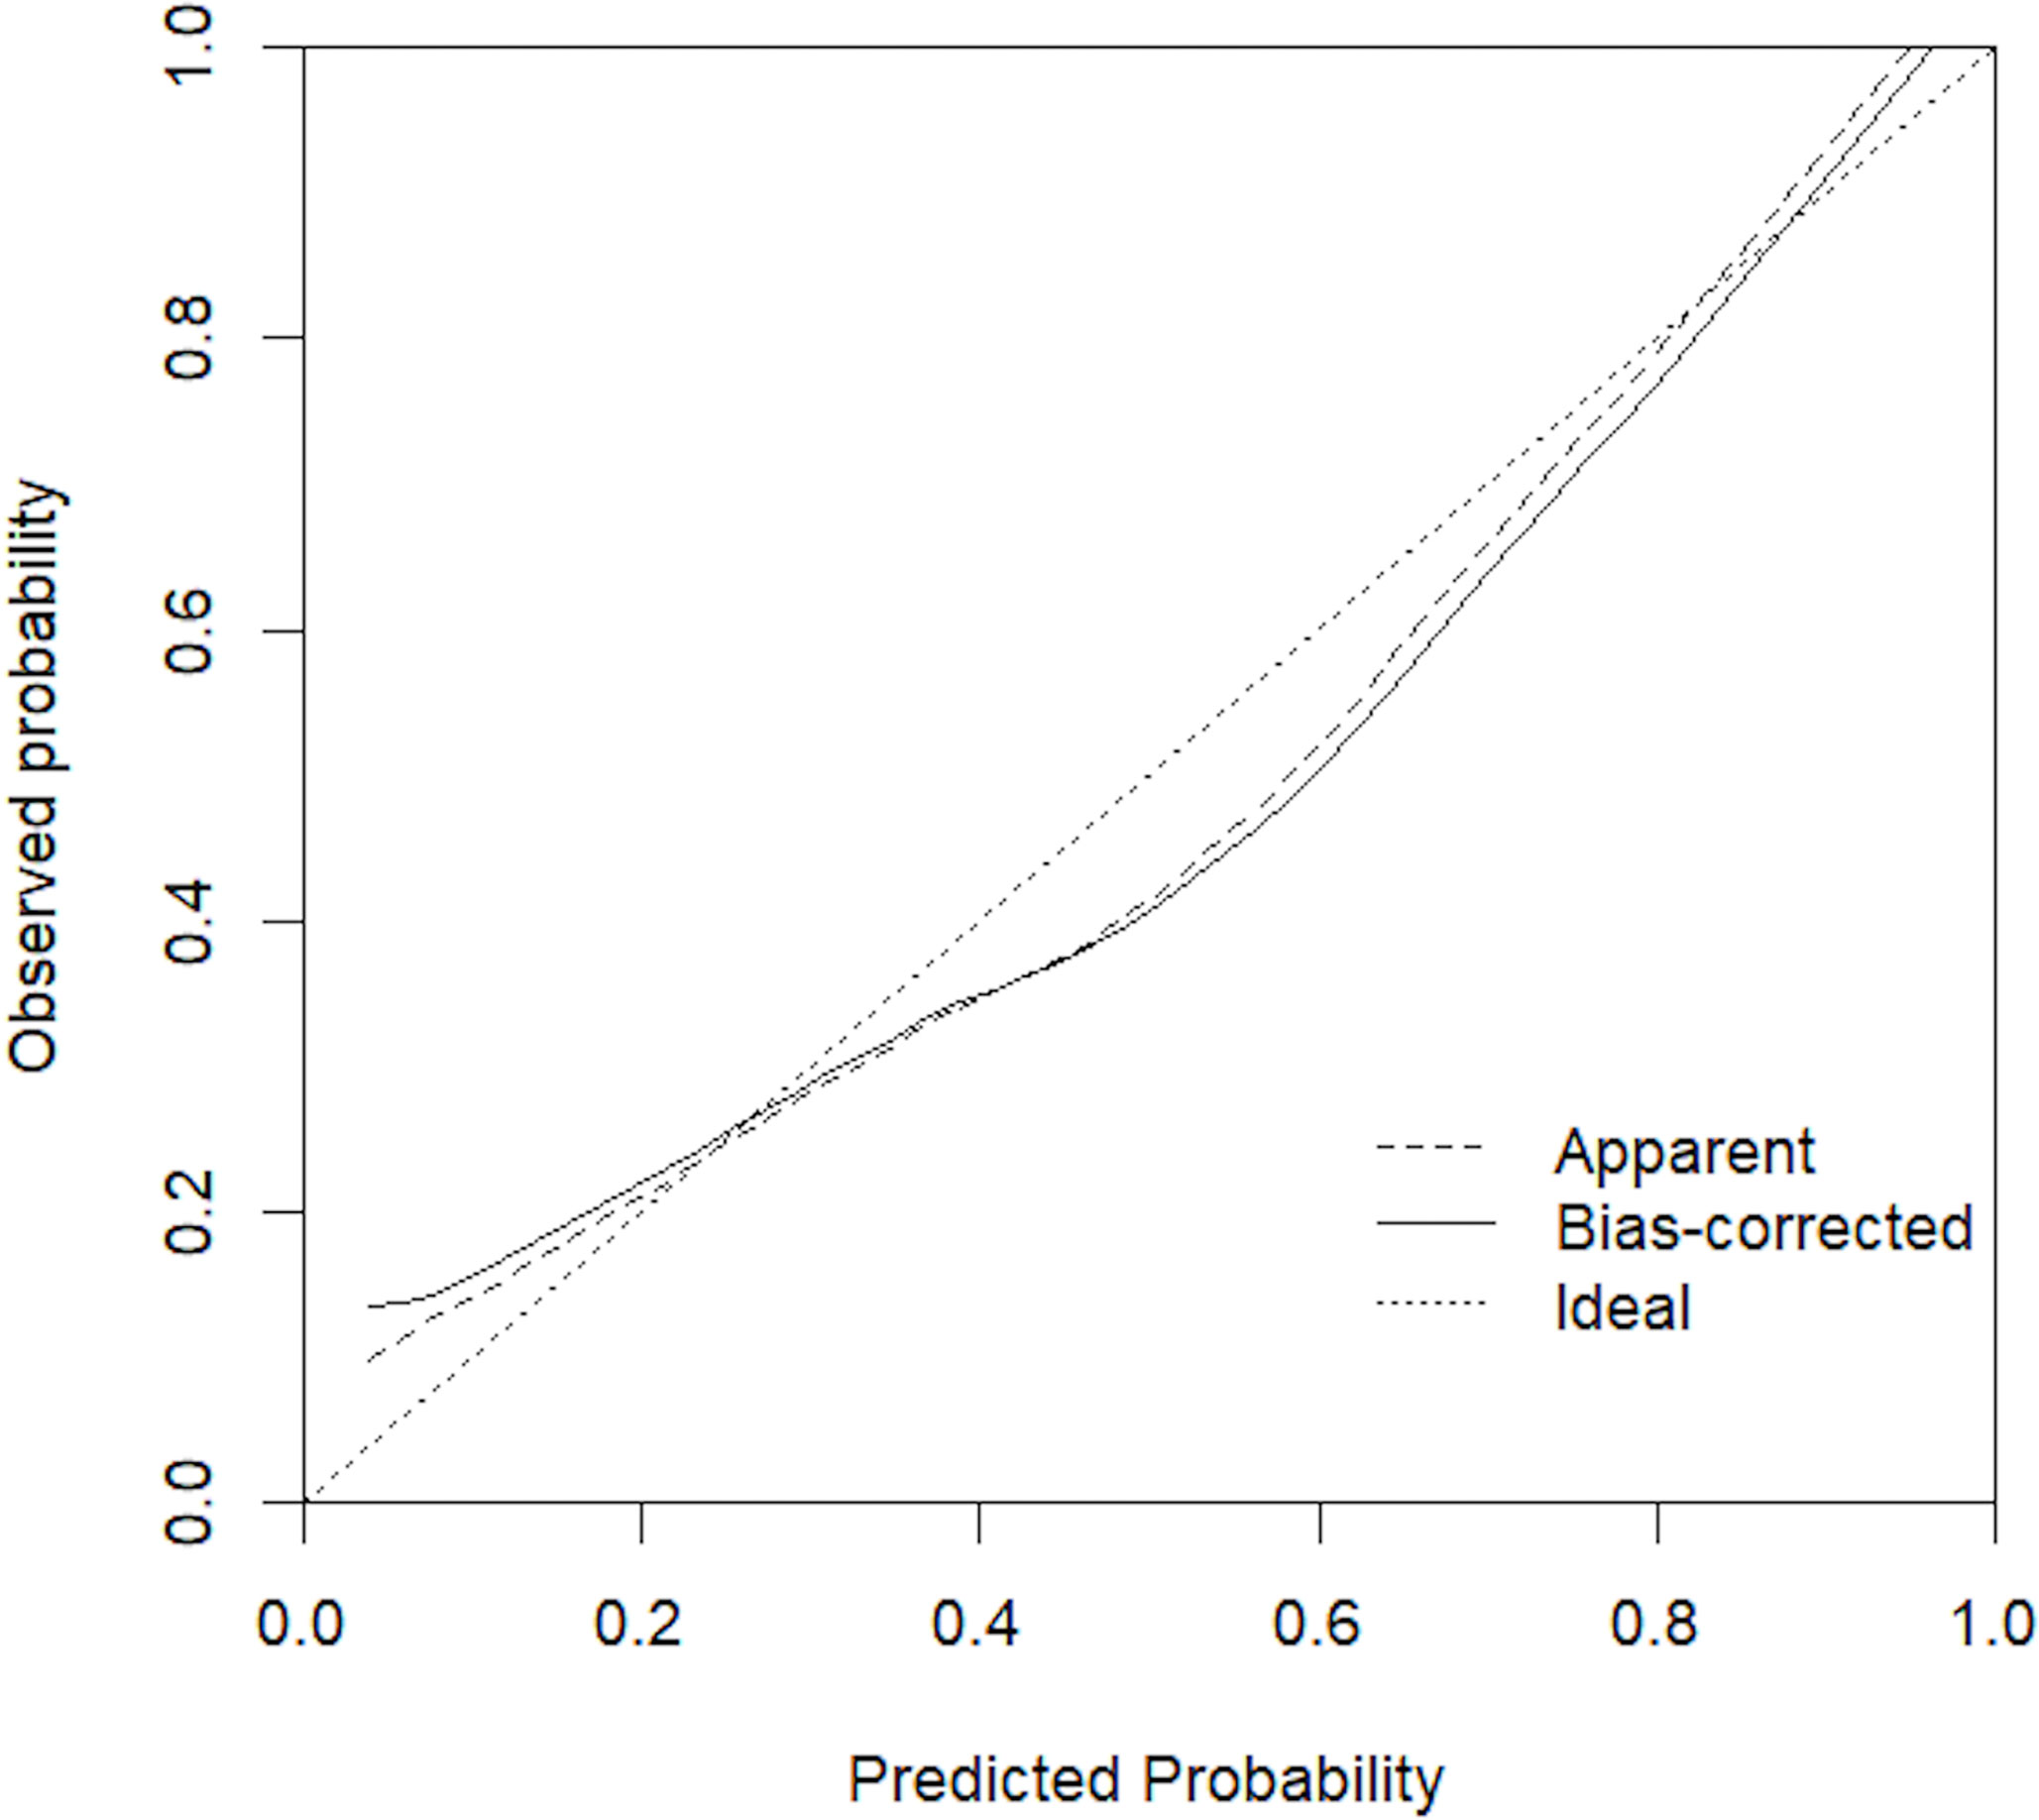
Figure 4 Calibration curve for the nomogram model.
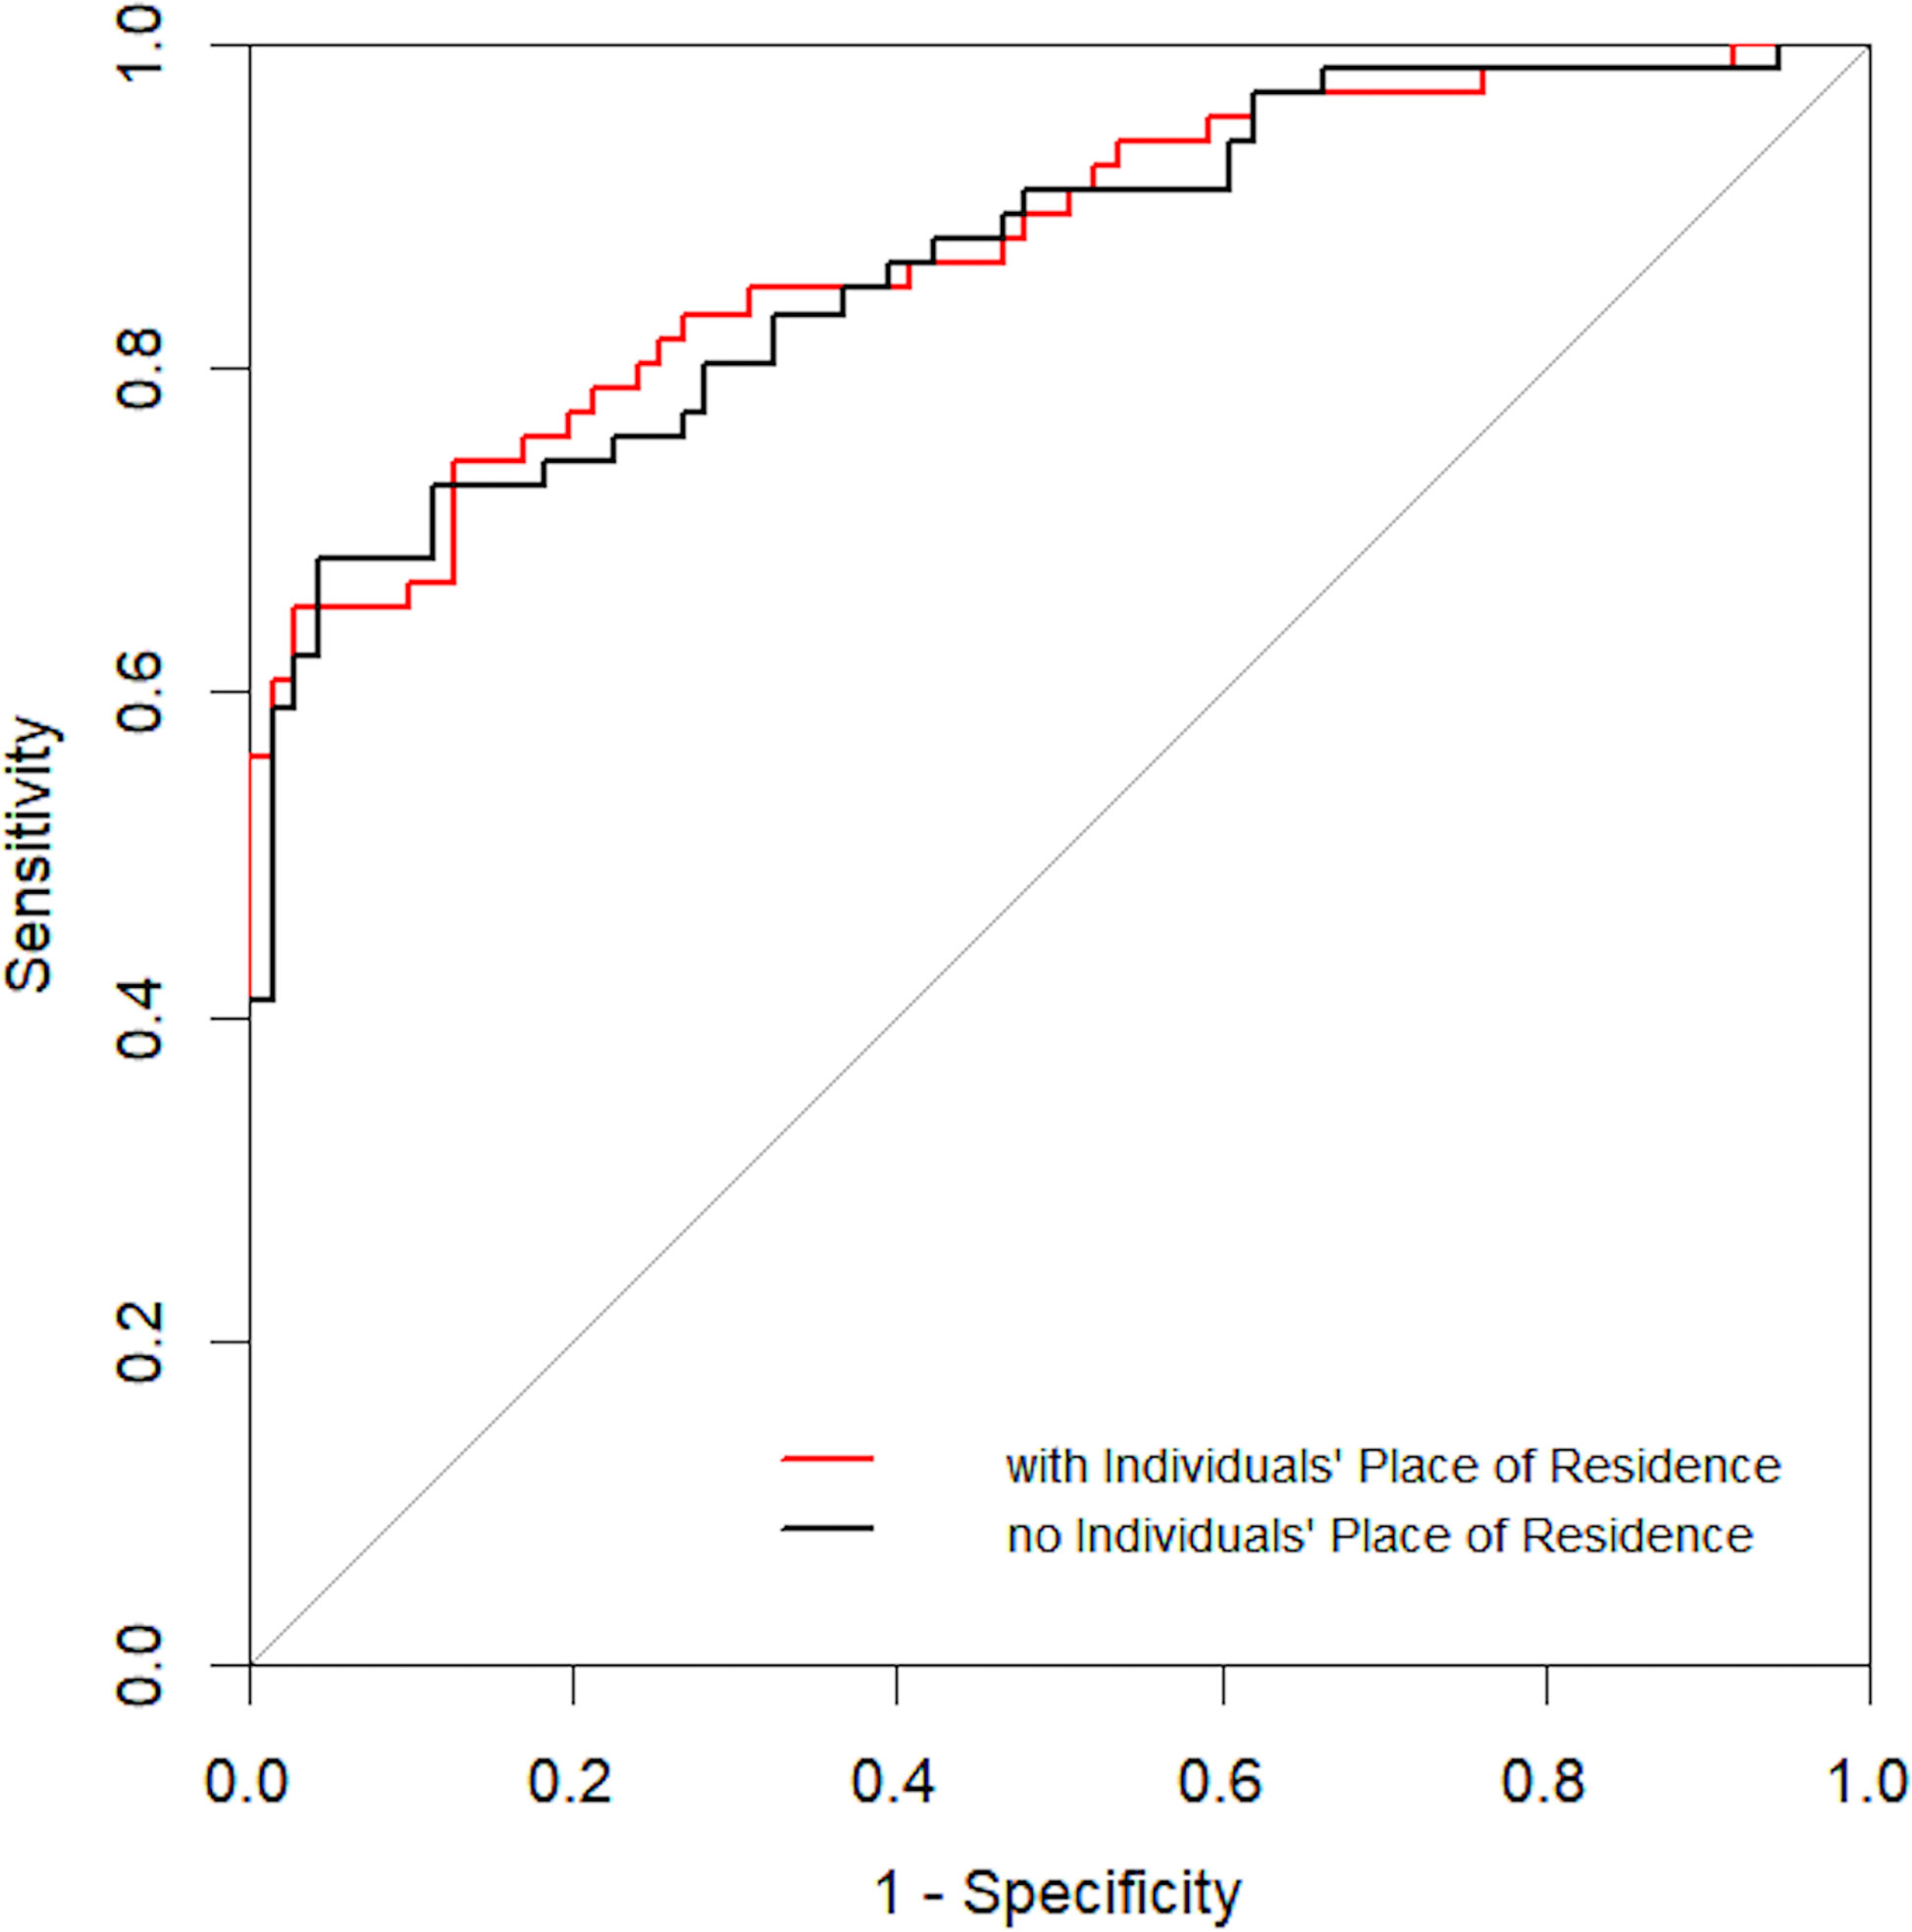
Figure 5 ROC curve for independent risk factors with and without place of residence of individuals.
To the best of our knowledge, this is the first study to show urban–rural disparities in PCa clinical characteristics at initial diagnosis worldwide. An earlier study indicated that men in rural areas had significantly higher PCa mortality than their urban-resident counterparts (7). A previous study in Shanghai found that the 5-year observed survival (OS) and relative survival (RS) for PCa were higher in urban areas relative to rural areas (18). The reasons for these outcomes have not been established; however, they could be due to the nature of the underlying cancer registry data that focus on morbidity and mortality and not on clinical characteristics at initial diagnosis. Our findings suggest this urban–rural disparity in PCa M/I may be due to differences in clinical characteristics at initial diagnosis.
Studies have evaluated various risk factors for PCa and high-grade PCa (19–21); however, based on the high PCa M/I in China and the huge PCa M/I ratio disparity between urban and rural areas, it is important to consider the impact of place of residence on high-grade PCa. We found that tPSA, PSAD, PI-RADS v2, and place of residence were independent predictors for high-grade PCa, consistent with a previous study in Jiangsu Province, China, showing that PSA levels and tumor grade at diagnosis were significantly independently correlated with PCa disease-specific survival (9). Our findings support the concept that more emphasis should be directed toward the differences that exist between urban and rural PCa patients or underlying healthcare disparities, especially late PCa screening and detection, faced by rural men. Since it is associated with over-diagnosis and over-treatment in North America and Northern Europe, it has not been established whether PSA is beneficial in clinical diagnosis and treatment (22–24). However, in China, PCa screening is insufficient, especially in rural areas. Moreover, poor PSA screening results in a significant proportion of PCa patients do not offer the best opportunity for treatment, resulting in higher M/I ratio.
In this study, PI-RADS v2 did not differ significantly in urban vs. rural PCa patients, although it had a high sensitivity and specificity for CSPCa when the cutoff value was category 4 (25, 26). This may be because GS 6 lesions were abundant in all PI-RADS v2 categories and GS ≥7 were more often seen in PI-RADSv2 ≥4 (27). In this study, PI-RADS v2 categories of PCa in both urban and rural cases were found to be concentrated at PI-RADS v2 ≥4 (urban: 167/223; rural: 163/207). Additionally, the AUC for model 2 was slightly higher than that of model 1 probably because PI-RADS v2 and PSAD also had higher odds ratios (ORs) for high-grade PCa. However, we cannot deny that place of residence significantly influences PCa outcomes in China.
Behind the clinical characteristics at initial diagnosis are socioeconomic factors related to urbanization, including per capita disposable income (PCDI), medical insurance reimbursement level, health care services, and health literacy. A study evaluating health provider–patient communication for PCa screening found that financial status was significantly associated with PCa screening and early detection (28). There were socioeconomic and health insurance disparities between urban and rural areas of China. The annual PCDI of urban residents was found to be nearly three times higher than that of rural residents in 2015, at $5031 and $1842, respectively (29). In China, social health insurance dominates the health insurance market. There are three types of social insurance programs (30): the Urban Employee Basic Medical Insurance (UEBMI) launched in 1998, which covers urban employees and retired people; the Urban Resident Basic Medical Insurance (URBMI) established in 2007, which covers unemployed urban residents, and the New Rural Cooperative Medical Scheme (NRCMS) initiated in 2003, which covers local rural residents. Rural residents have fewer comprehensive benefits than urban residents, and the reimbursement level for hospitalized patients covered by the NRCMS (48.04%) is significantly lower than that of UEBMI (74.64%) and URBMI (59.23%) (31). The lower reimbursement ratios limit the ability for rural patients to obtain PCa diagnosis before the appearance of clinical symptoms, such as lower urinary tract obstruction, pain during urination, or bone pain. An uneven distribution of healthcare services plays an important role in disparities in early PCa detection between urban and rural areas of China. Rural men account for a large portion of high-grade PCa but are exposed to fewer medical resources in terms of medical staff and institutions. According to the China Health Statistics Yearbook 2015, the number of registered doctors per thousand people in urban areas is 2.57 times higher than in rural areas (32). The number of hospitals in urban areas increased by 66% from 2005 to 2017, whereas the number of health clinics in rural areas only increased by 8% in the same period (33). Furthermore, tertiary hospitals that can offer prostate biopsy are mainly localized in urban areas. The longer travel distance may deter rural men from accessing early PCa detection services. Education also accounts for disparities in urban–rural health status. Chinese rural residents have relatively poor health literacy levels. Health literacy is associated with health beliefs, including attitudes, values, and knowledge that individuals possess on screening and early detection, which influence their perception of the need for early diagnosis.
This study has several limitations. First, although we discussed several possible explanations for urban–rural disparities in clinical characteristics at initial diagnosis, it is possible that other factors, such as occupation and environmental factors, are also involved. Second, this is a single center study in China, albeit a relatively large one, and multicenter data can externally validate our findings. Additionally, this is a retrospective study on urban–rural disparities in PCa clinical characteristics at initial diagnosis; other factors may also affect the prognosis of patients, and these will be addressed in future studies.
Based on clinical characteristics at initial diagnosis, we investigated disparities in urban–rural PCa M/I ratios. We found that rural PCa patients presented higher tPSA, higher PSAD, and higher pathological grades when compared to urban patients and that rural residence was an independent risk factor for high-grade PCa in Anhui Province, China. Our findings involve the development of appropriate strategies to reduce PCa mortality, such as narrowing urban–rural gaps in accessing healthcare and increasing awareness on the importance of early detection.
The original contributions presented in the study are included in the article/supplementary material. Further inquiries can be directed to the corresponding authors.
YY and XL designed the study, and helped to drafted the manuscript. QS, YQ, JW, and XW were involved in data collection and assembly. YY and XM performed data analysis and interpretation. QS drafted the manuscript. All authors contributed to the article and approved the submitted version.
This study was financially supported by Central Government Transfer Payment Financial Construction Project (Z155080000004) and the National Natural Science Foundation of China (81771817).
The authors declare that the research was conducted in the absence of any commercial or financial relationships that could be construed as a potential conflict of interest.
All claims expressed in this article are solely those of the authors and do not necessarily represent those of their affiliated organizations, or those of the publisher, the editors and the reviewers. Any product that may be evaluated in this article, or claim that may be made by its manufacturer, is not guaranteed or endorsed by the publisher.
We thank our colleagues in the Prostate Biopsy Center of the First Affiliated Hospital of Anhui Medical University, China.
1. Bray F, Ferlay J, Soerjomataram I, Siegel RL, Torre LA, Jemal A. Global Cancer Statistics 2018: GLOBOCAN Estimates of Incidence and Mortality Worldwide for 36 Cancers in 185 Countries. CA Cancer J Clin (2018) 68:394–424. doi: 10.3322/caac.21492
2. Peyromaure M, Debré B, Mao K, Zhang G, Wang Y, Sun Z, et al. Management of Prostate Cancer in China: a Multicenter Report of 6 Institutions. J Urol (2005) 174:1794–7. doi: 10.1097/01.ju.0000176817.46279.93
3. Loeb S, Vonesh EF, Metter EJ, Carter HB, Gann PH, Catalona WJ. What is the True Number Needed to Screen and Treat to Save a Life With Prostate-Specific Antigen Testing? J Clin Oncol (2011) 29:464–7. doi: 10.1200/JCO.2010.30.6373
4. Siegel RL, Miller KD, Fuchs HE, Jemal A. Cancer Statistics, 2021. CA Cancer J Clin (2021) 71:7–33. doi: 10.3322/caac.21654
5. Chen W, Zheng R, Baade PD, Zhang S, Zeng H, Bray F, et al. Cancer Statistics in China, 2015. CA Cancer J Clin (2016) 66:115–32. doi: 10.3322/caac.21338
6. Torre LA, Bray F, Siegel RL, Ferlay J, Lortet-Tieulent J, Jemal A. Global Cancer Statistics, 2012. CA Cancer J Clin (2015) 65:87–108. doi: 10.3322/caac.21262
7. Zhu Y, Wang HK, Qu YY, Ye DW. Prostate Cancer in East Asia: Evolving Trend Over the Last Decade. Asian J Androl (2015) 17:48–57. doi: 10.4103/1008-682X.132780
8. Gleason DF, Mellinger GT. Veterans Administration Cooperative Urological Research Group. Prediction of Prognosis for Prostatic Adenocarcinoma by Combined Histological Grading and Clinical Staging. J Urol (2017) 197:S134–9. doi: 10.1016/j.juro.2016.10.099
9. Shao Q, Ouyang J, Fan Y, Xie J, Zhou J, Wu J, et al. Prostate Cancer in the Senior Men From Rural Areas in East District of China: Contemporary Management and 5-Year Outcomes at Multi-Institutional Collaboration. Cancer Lett (2012) 315:170–7. doi: 10.1016/j.canlet.2011.09.035
10. Epstein JI, Zelefsky MJ, Sjoberg DD, Nelson JB, Egevad L, Magi-Galluzzi C, et al. A Contemporary Prostate Cancer Grading System: a Validated Alternative to the Gleason Score. Eur Urol (2016) 69:428–35. doi: 10.1016/j.eururo.2015.06.046
11. Van Poppel H, Joniau S. An Analysis of Radical Prostatectomy in Advanced Stage and High-Grade Prostate Cancer. Eur Urol (2008) 53:253–9. doi: 10.1016/j.eururo.2007.10.009
12. Wolf AM, Wender RC, Etzioni RB, Thompson IM, D’Amico AV, Volk RJ, et al. American Cancer Society Guideline for the Early Detection of Prostate Cancer: Update 2010. CA Cancer J Clin (2010) 60:70–98. doi: 10.3322/caac.20066
13. Alberts AR, Roobol MJ, Verbeek JFM, Schoots IG, Chiu PK, Osses DF, et al. Prediction of High-Grade Prostate Cancer Following Multiparametric Magnetic Resonance Imaging: Improving the Rotterdam European Randomized Study of Screening for Prostate Cancer Risk Calculators. Eur Urol (2019) 75:310–18. doi: 10.1016/j.eururo.2018.07.031
14. Chua ME, Tanseco PP, Mendoza JS, Castillo JC, Morales ML Jr, Luna SL Jr. Configuration and Validation of a Novel Prostate Disease Nomogram Predicting Prostate Biopsy Outcome: A Prospective Study Correlating Clinical Indicators Among Filipino Adult Males With Elevated PSA Level. Asian J Urol (2015) 2:114–22. doi: 10.1016/j.ajur.2015.04.023
15. Weinreb JC, Barentsz JO, Choyke PL, Cornud F, Haider MA, Macura KJ, et al. PI-RADS Prostate Imaging - Reporting and Data System: 2015, Version 2. Eur Urol (2016) 69:16–40. doi: 10.1016/j.eururo.2015.08.052
16. Presti JC Jr, Chang JJ, Bhargava V, Shinohara K. The Optimal Systematic Prostate Biopsy Scheme Should Include 8 Rather Than 6 Biopsies: Results of a Prospective Clinical Trial. J Urol (2000) 163:163–7. doi: 10.1016/S0022-5347(05)67995-5
17. Epstein JI, Egevad L, Amin MB, Delahunt B, Srigley JR, Humphrey PA, et al. The 2014 International Society of Urological Pathology (ISUP) Consensus Conference on Gleason Grading of Prostatic Carcinoma: Definition of Grading Patterns and Proposal for a New Grading System. Am J Surg Pathol (2016) 40:244–52. doi: 10.1097/PAS.0000000000000530
18. Li X, Deng Y, Tang W, Sun Q, Chen Y, Yang C, et al. Urban-Rural Disparity in Cancer Incidence, Mortality, and Survivals in Shanghai, China, During 2002 and 2015. Front Oncol (2018) 8:579. doi: 10.3389/fonc.2018.00579
19. Xie SW, Wang YQ, Dong BJ, Xia JG, Li HL, Zhang SJ, et al. A Nomogram Based on a TRUS Five-Grade Scoring System for the Prediction of Prostate Cancer and High Grade Prostate Cancer at Initial TRUS-Guided Biopsy. J Cancer (2018) 9:4382–90. doi: 10.7150/jca.27344
20. Preston MA, Wilson KM, Markt SC, Ge R, Morash C, Stampfer MJ, et al. 5α-Reductase Inhibitors and Risk of High-Grade or Lethal Prostate Cancer. JAMA Intern Med (2014) 174:1301–7. doi: 10.1001/jamainternmed.2014.1600
21. Perez-Cornago A, Key TJ, Allen NE, Fensom GK, Bradbury KE, Martin RM, et al. Prospective Investigation of Risk Factors for Prostate Cancer in the UK Biobank Cohort Study. Br J Cancer (2017) 117:1562–71. doi: 10.1038/bjc.2017.312
22. Pashayan N, Duffy SW, Pharoah P, Greenberg D, Donovan J, Martin RM, et al. Mean Sojourn Time, Overdiagnosis, and Reduction in Advanced Stage Prostate Cancer Due to Screening With PSA: Implications of Sojourn Time on Screening. Br J Cancer (2009) 100:1198–204. doi: 10.1038/sj.bjc.6604973
23. US Preventive Services Task Force, Grossman DC, Curry SJ, Owens DK, Bibbins-Domingo K, Caughey AB, et al. Screening for Prostate Cancer: US Preventive Services Task Force Recommendation Statement. JAMA (2018) 319:1901–13. doi: 10.1001/jama.2018.3710
24. Fedewa SA, Gansler T, Smith R, Sauer AG, Wender R, Brawley OW, et al. Recent Patterns in Shared Decision Making for Prostate-Specific Antigen Testing in the United States. Ann Fam Med (2018) 16:139–44. doi: 10.1370/afm.2200
25. Rosenkrantz AB, Babb JS, Taneja SS, Ream JM. Proposed Adjustments to PI-RADS Version 2 Decision Rules: Impact on Prostate Cancer Detection. Radiology (2017) 283:119–29. doi: 10.1148/radiol.2016161124
26. Kasel-Seibert M, Lehmann T, Aschenbach R, Guettler FV, Abubrig M, Grimm MO, et al. Assessment of PI-RADS V2 for the Detection of Prostate Cancer. Eur J Radiol (2016) 85:726–31. doi: 10.1016/j.ejrad.2016.01.011
27. Mehralivand S, Bednarova S, Shih JH, Mertan FV, Gaur S, Merino MJ, et al. Prospective Evaluation of PI-RADS™ Version 2 Using the International Society of Urological Pathology Prostate Cancer Grade Group System. J Urol (2017) 198:583–90. doi: 10.1016/j.juro.2017.03.131
28. Bhuyan SS, Chandak A, Gupta N, Isharwal S, LaGrange C, Mahmood A, et al. Patient-Provider Communication About Prostate Cancer Screening and Treatment: New Evidence From the Health Information National Trends Survey. Am J Mens Health (2017) 11:134–46. doi: 10.1177/1557988315614082
29. Kien VD, Van Minh H, Giang KB, Dao A, Tuan LT, Ng N. Socioeconomic Inequalities in Catastrophic Health Expenditure and Impoverishment Associated With Non-Communicable Diseases in Urban Hanoi, Vietnam. Int J Equity Health (2016) 15:169. doi: 10.1186/s12939-016-0460-3
30. You X, Kobayashi Y. The New Cooperative Medical Scheme in China. Health Policy (2009) 91:1–9. doi: 10.1016/j.healthpol.2018.11.012
31. Xu J, Wang J, King M, Liu R, Yu F, Xing J, et al. Rural-Urban Disparities in the Utilization of Mental Health Inpatient Services in China: The Role of Health Insurance. Int J Health Econ Manage (2018) 18:377–93. doi: 10.1007/s10754-018-9238-z
32. NHFPC. China Statistical Yearbook 2015 (2015). Available at: http://www.stats.gov.cn/tjsj/ndsj/2015/indexeh.htm.
Keywords: place of residence, prostate cancer, risk factors, screening, early detection
Citation: Song QL, Qian Y, Min X, Wang X, Wu J, Li X and Yu Y (2021) Urban–Rural Differences in Clinical Characteristics of Prostate Cancer at Initial Diagnosis: A Single-Center Observational Study in Anhui Province, China. Front. Oncol. 11:704645. doi: 10.3389/fonc.2021.704645
Received: 03 May 2021; Accepted: 19 July 2021;
Published: 03 August 2021.
Edited by:
Ke-hung Tsui, Taipei Medical University, TaiwanCopyright © 2021 Song, Qian, Min, Wang, Wu, Li and Yu. This is an open-access article distributed under the terms of the Creative Commons Attribution License (CC BY). The use, distribution or reproduction in other forums is permitted, provided the original author(s) and the copyright owner(s) are credited and that the original publication in this journal is cited, in accordance with accepted academic practice. No use, distribution or reproduction is permitted which does not comply with these terms.
*Correspondence: Xiaohu Li, bGl4aWFvaHVAYWhtdS5lZHUuY24=; Yongqiang Yu, Y2pyLnl1eW9uZ3FpYW5nQHZpcC4xNjMuY29t
†These authors have contributed equally to this work
Disclaimer: All claims expressed in this article are solely those of the authors and do not necessarily represent those of their affiliated organizations, or those of the publisher, the editors and the reviewers. Any product that may be evaluated in this article or claim that may be made by its manufacturer is not guaranteed or endorsed by the publisher.
Research integrity at Frontiers
Learn more about the work of our research integrity team to safeguard the quality of each article we publish.