
95% of researchers rate our articles as excellent or good
Learn more about the work of our research integrity team to safeguard the quality of each article we publish.
Find out more
ORIGINAL RESEARCH article
Front. Oncol. , 25 June 2021
Sec. Genitourinary Oncology
Volume 11 - 2021 | https://doi.org/10.3389/fonc.2021.700084
This article is part of the Research Topic Panel of Tumor Markers: Towards Precision Medicine in Genitourinary Cancers View all 27 articles
 Ji Chen1†
 Yating Zhan1†Rongrong Zhang1†
 Bo Chen1†Junting Huang1Chunxue Li1Wenjie Zhang1Yajing Wang1Yuxiang Gao1
 Jianjian Zheng1*
 Yeping Li2*
Clear cell renal cell carcinoma (ccRCC) is the most common renal cell carcinoma and has poor prognosis in the locally advanced stage. Ferroptosis, a relatively new type of cell death, has gained significant attention in recent years. This study aimed to explore the prognostic value of ferroptosis-related genes (FRGs) in ccRCC. In this study, 50 differentially expressed FRGs between ccRCC and adjacent normal kidney tissues were identified, 26 of them correlated with overall survival (OS) (P <0.05). Eight optimal FRGs were selected by Lasso regression and multivariate Cox regression analysis, and used to construct a new prognostic risk signature to predict the prognosis of ccRCC patients. In addition, the signature passed the validation of prognostic survival analyses by a significant margin, and the risk score was identified as an independent prognostic marker via Cox regression analyses. Further studies indicated that the signature was significantly correlated with immune cell infiltration. Moreover, the levels of eight FRGs were examined in ccRCC. Collectively, the 8-FRG prognostic risk signature helps the clinicians predict the prognosis and OS of the patients, and standardize prognostic assessments.
Renal cancer accounts for approximately 2–3% of the adult malignancies and 80–90% of the adult renal malignancies (1). Approximately 80% of the RCC cases are Clear cell renal cell carcinoma (ccRCC) (2). Often asymptomatic in the early stages, ccRCC is suspected when the tumor volume increases and the patient develops fever, fatigue and other systemic symptoms (3). In addition, the microscopic appearance is often confused with granular cell carcinoma and spindle cell carcinoma, which makes it very difficult to grade under microscope (4). Recent studies have shown that high-risk ccRCC patients treated with the active drugs have no significant changes in the overall survival (OS) (5). To monitor the disease progression, the scientific community should explore novel and effective biomarkers for ccRCC prognosis, including the new prognostic signatures.
Ferroptosis is a novel cell death modality that has recently been investigated (6). With the advent of malignant drug-resistant tumors and the weakening of the effect of conventional anticancer treatment, the induction of ferroptosis in cells has become a new promising treatment for various cancers (7, 8). Increasing evidence has demonstrated that ferroptosis plays a key role in the regulation of the progression of various human cancers, including Head and neck squamous cell carcinoma (9, 10). CISD1, a typical ferroptosis-related gene (FRG), negatively regulates ferroptosis (11). In contrast, NCOA4 and MT1G have been found to sustain ferroptosis (12, 13). However, the roles of FRGs in the prognosis of ccRCC remain largely unknown.
In this study, we screened eight optimal FRGs to construct a new prognostic risk signature according to transcriptional and relevant clinical data of ccRCC patients obtained from the TCGA database. The prognostic value of this signature was verified via a series of OS-related analyses. In addition, the clinical traits and immune mechanisms of this prognostic risk model were analyzed to validate the accuracy of the signature. Finally, the levels of eight FRGs from the signature were examined in 20 paired ccRCC tissues and adjacent non-tumorous tissues by quantitative real-time PCR (qRT-PCR).
All the mRNA expression files were obtained from the TCGA portal using the GDC tool (https://portal.gdc.cancer.gov/). The files contained data about ccRCC (n = 539) and adjacent nontumorous kidney samples (n = 72). Corresponding clinicopathological characteristics, consisting of OS and cancer specific survival (CSS) for ccRCC patients (n = 533), were also obtained from the TCGA database.
According to the patients’ ID numbers, we matched their transcriptomic data and clinical information, the data of the mismatched patients were removed. Thus, we obtained complete gene expression profiles of 526 ccRCC patients. Using R package “caret”, all ccRCC patients were randomized into two cohorts: the training cohort and the testing cohort (7:3). Specific clinical parameters for the two cohorts and the entire TCGA cohort were shown in Table 1. A total of 60 FRGs utilized in this study were obtained from the previous literature (Supplementary Table 1) (7). The 318 transcription factors (TFs) and relevant contents of immune cells of the TCGA database were downloaded from CISTROME (http://cistrome.org/) (14).
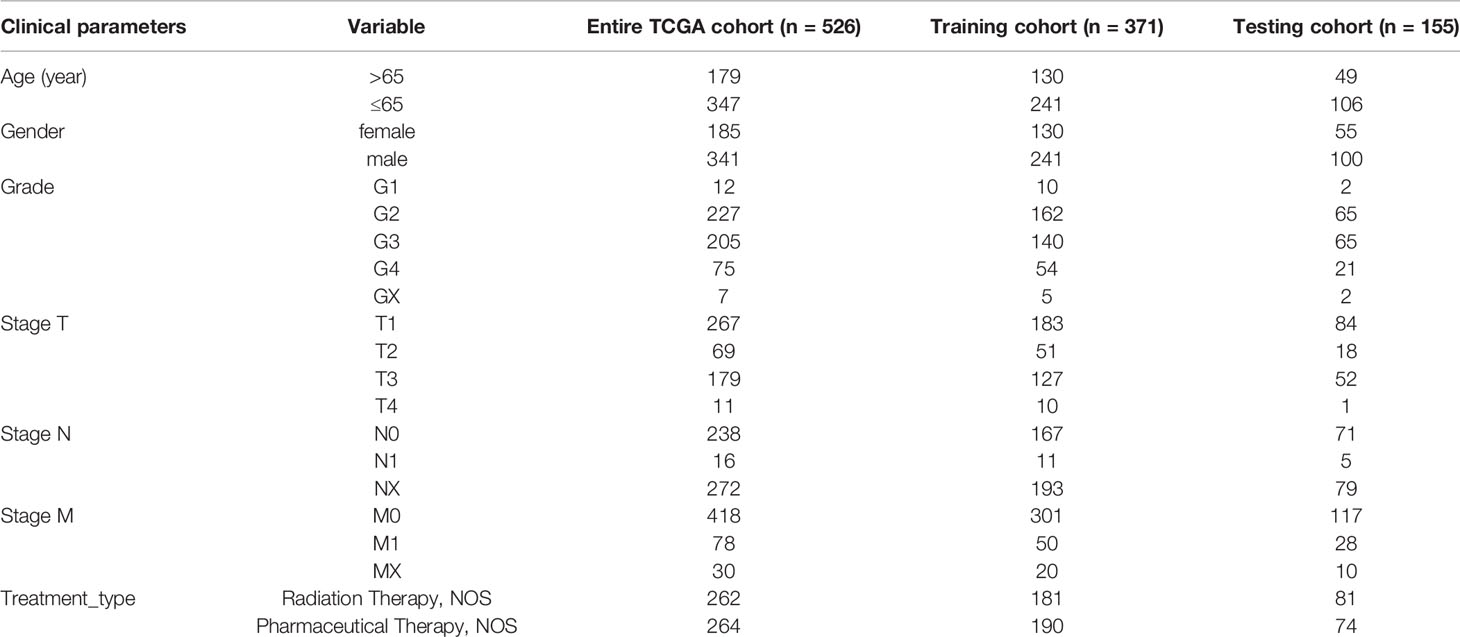
Table 1 The clinical characteristics and associated cohorts of 526 ccRCC patients.
The “limma” R package was performed to measure the differential expression in the training cohort, the false discovery rate (FDR) was calculated by the Benjamin–Hochberg method (15). In brief, the prognostic differentially expressed ferroptosis-related genes (PDEFRGs) were identified via univariate Cox analysis, only DEFRGs with FDR less than 0.05 were identified as OS-related genes. In this study, FRGs significantly associated with OS were considered as prognosis related FRGs. In addition, the Venn diagram was drawn to show these genes.
To explore the PPI relationships between PDEFRGs, a PPI network was performed by the STRING database (version 11.0) and Cytoscape software 3.6.1 (https://cytoscape.org/) (16). In addition, the connections between TFs and FRGs were determined by Cytoscape software.
We removed those FRGs that were over fit to the model via least absolute shrinkage and selection operator (Lasso) regression analysis (17). Eight optimal FRGs were finally selected by the multivariate Cox regression analysis and their regression coefficients were calculated (18). The regression coefficients and the expression levels of eight FRGs were used to achieve the risk score of each ccRCC patient, based on the following formula:
According to the cut-off value, which was the median risk score of the training cohort, we categorized the ccRCC patients in each cohort into two groups: high-risk and low-risk groups. Thus, the 8-FRG prognostic risk signature was generated from the training cohort.
Kaplan–Meier curves and the operating characteristic curve (ROC) analysis were created to calculate the prognostic value of the 8-FRG prognostic risk signature. For ROC analysis, an area under the ROC (AUC) value >0.70 means that the model has an excellent predictive value (19, 20). Using the univariate and multivariate Cox regression analyses, several essential clinical characteristics and the 8-FRG prognostic risk signature were further analyzed. Next, the independent prognostic factors of ccRCC were included into the FRGs-clinical nomogram. The calibrate curve analysis and decision curve analysis (DCA) were applied to validate the accuracy of the nomogram. Finally, the single-sample gene set enrichment analysis (ssGSEA) was performed to obtain the infiltrating score between high- and low-risk groups (21). The relevant gene set file of GSEA analysis used in ssGSEA is provided in Supplementary Table 2. Utilizing the relevant contents of six main immune cells of TCGA database, the immune correlation analysis was performed via R package “corrplot”.
We obtained 20 pairs of ccRCC and adjacent tumor tissue samples from The First Affiliated Hospital of Wenzhou Medical University. The use of these clinical samples was approved by the ethics committee of The First Affiliated Hospital of Wenzhou Medical University. For this study, patients signed a written informed consent. qRT-PCR was performed to evaluate the differences in the mRNA expression. The total RNA from ccRCC and adjacent normal tissues was extracted using TRIzol reagent. The mRNA was then reverse transcribed into cDNA using ribo SCRIPTTM reverse transcription kit. The expression level of mRNA was calibrated with glyceraldehyde-3-phosphate dehydrogenase (GAPDH). SYBR Green master mix was added, and real-time PCR was carried out using a 7500 rapid quantitative PCR system (Applied Biosystems, USA). The CT value of each well was recorded, and the relative quantification of the amplified products was performed using the 2−ΔCt method.
The R software (version 4.0.2) downloaded from (https://www.r-project.org/) was utilized to perform all statistical analyses. The rank correlation was further assessed through the performance of the Pearson correlation coefficient test among the different variables. Independent t-tests were also performed to compare gene expression among different tissues. In all analyses, we set the statistical significance at P <0.05.
The overall workflow of this study is shown in Figure 1. In the training cohort, most of the FRGs (50/60, 83.3%) were differentially expressed in ccRCC tissues as compared with adjacent non-tumorous tissues. Via univariate Cox regression analysis, we identified 26 of them were significantly correlated with OS (P <0.05). Thus, 26 PDEFRGs were selected, as shown in Venn diagram (Figures 2A–C). Through the PPI network, we found that ACACA, FTH1 and HMGCR may be the hub genes (Figure 3A). The correlation of these PDEFRGs was shown in Figure 3B. Among 318 TFs, 253 were found significantly associated with differential expression of all FRGs. Thus, we developed a TFs-FRGs regulatory network to explain the regulatory relationships extensively (Figure 3C).
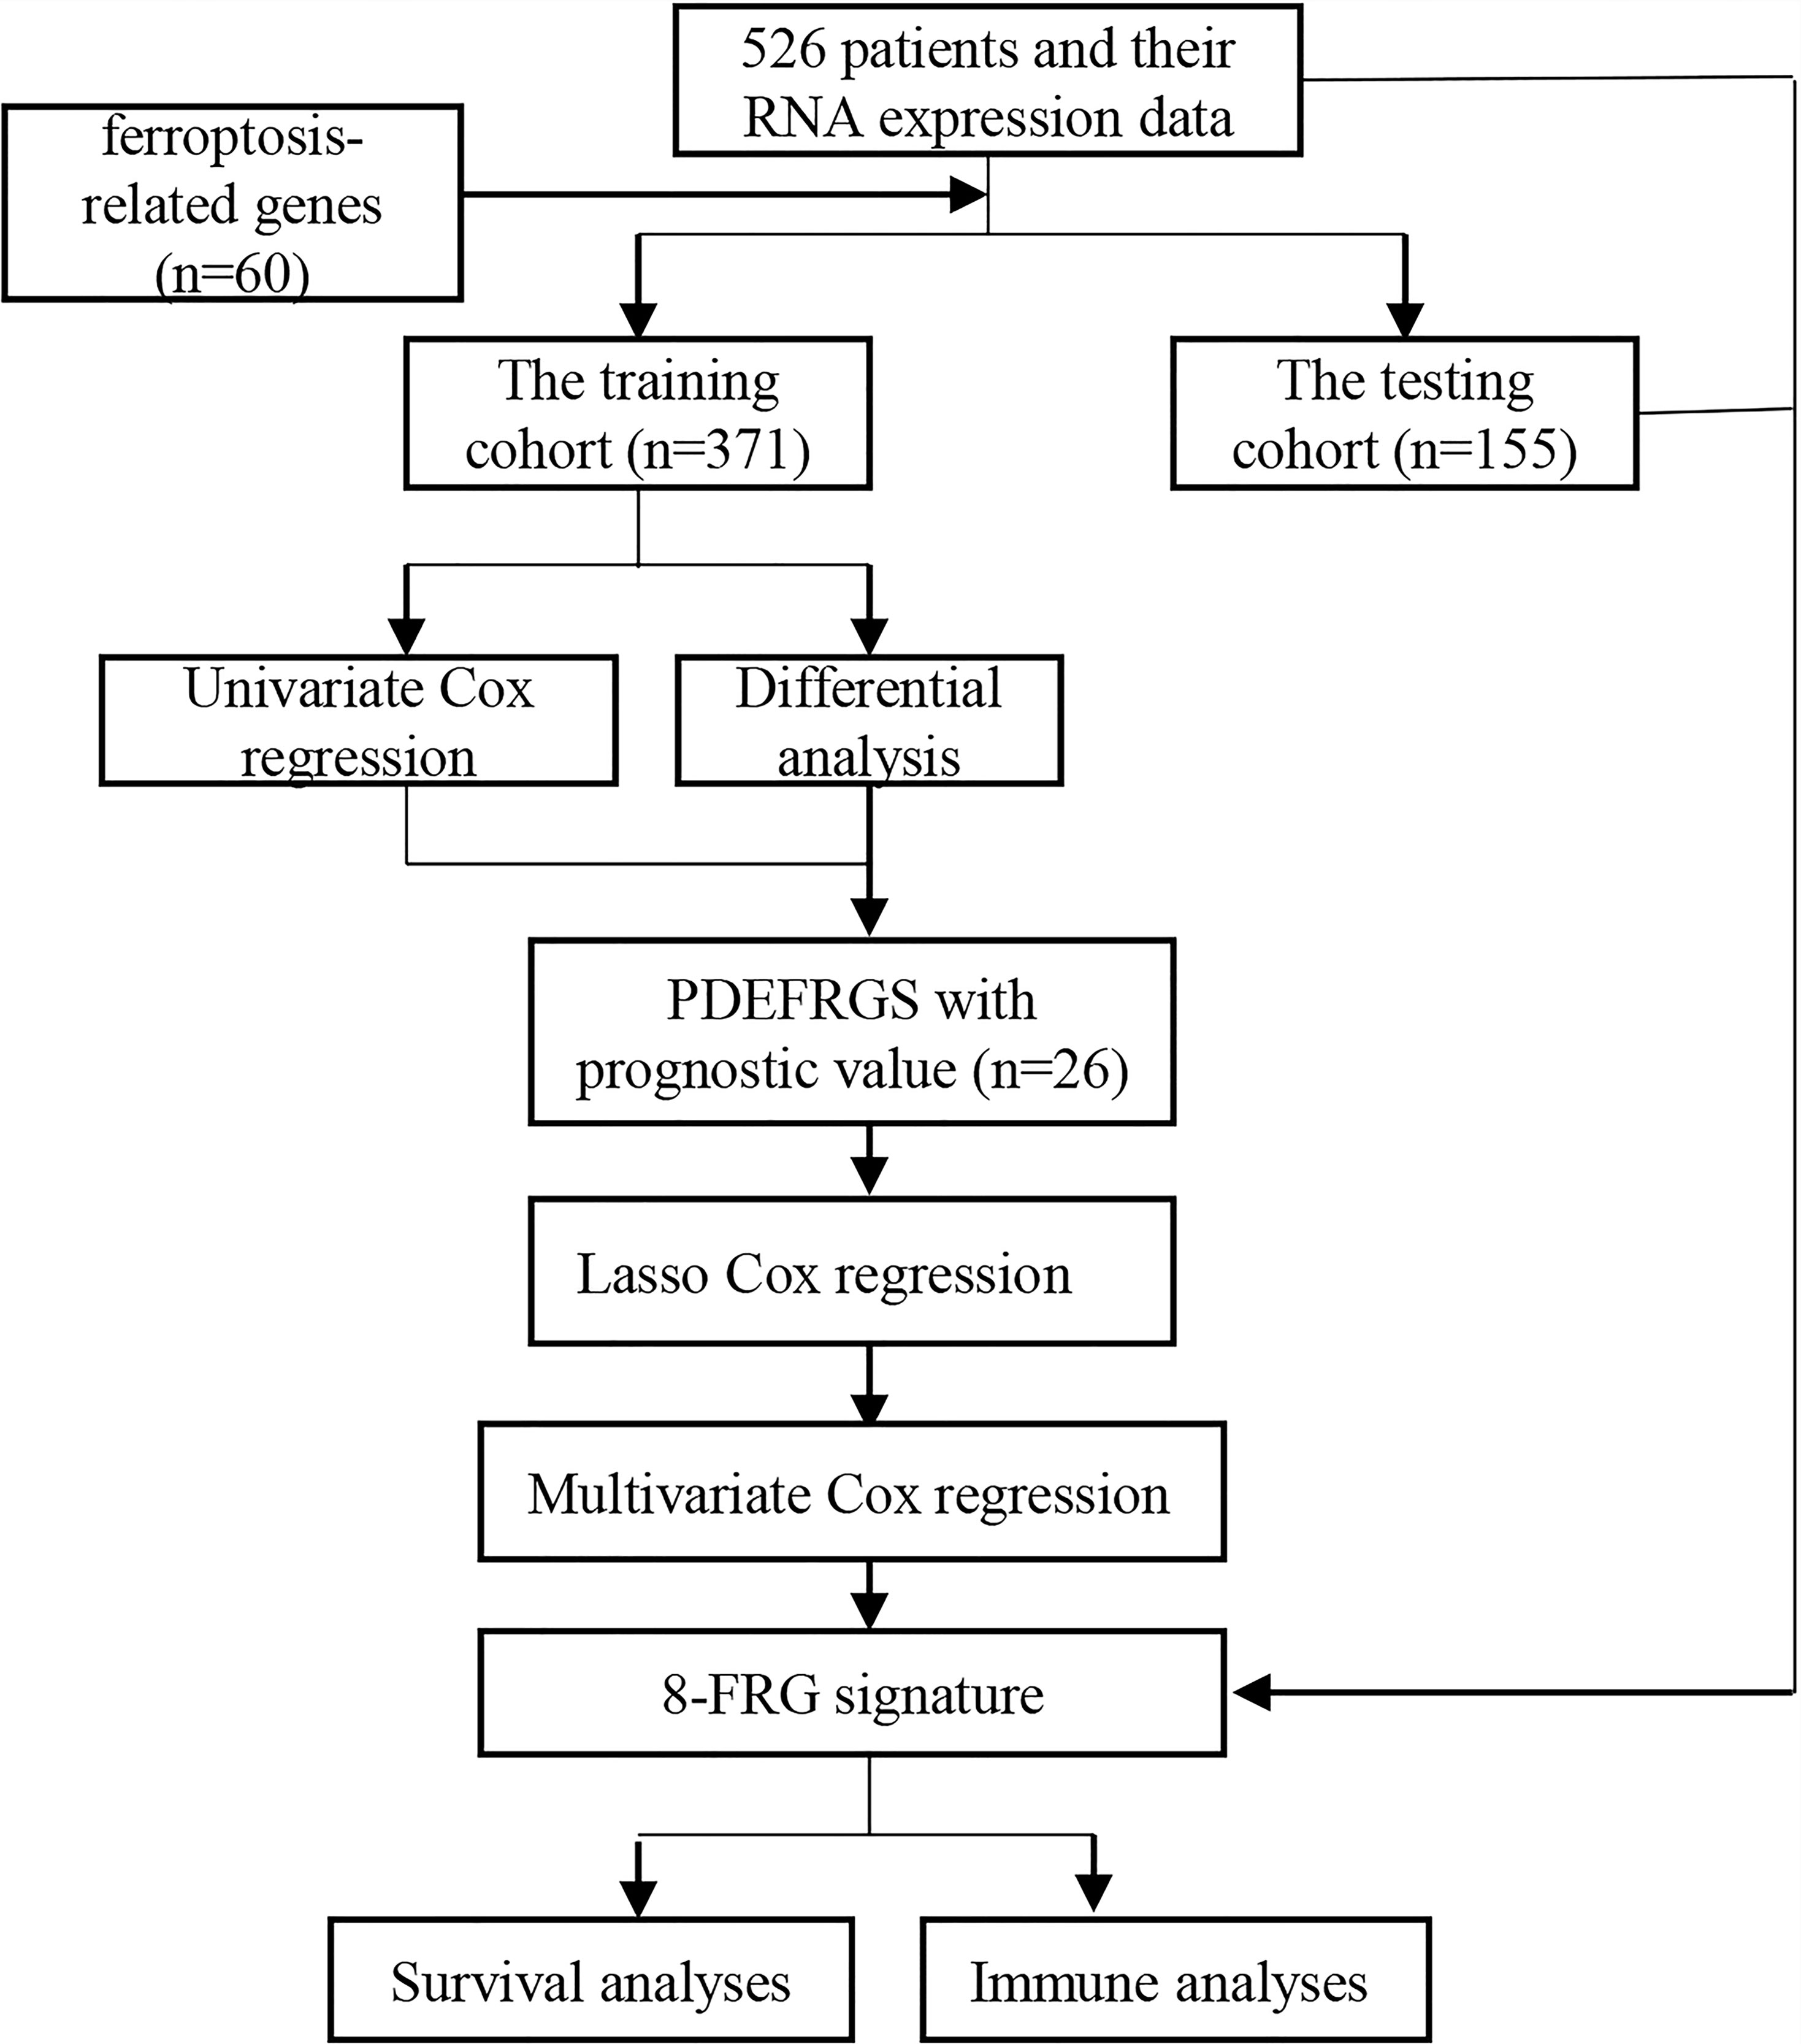
Figure 1 The overall workflow of this study.
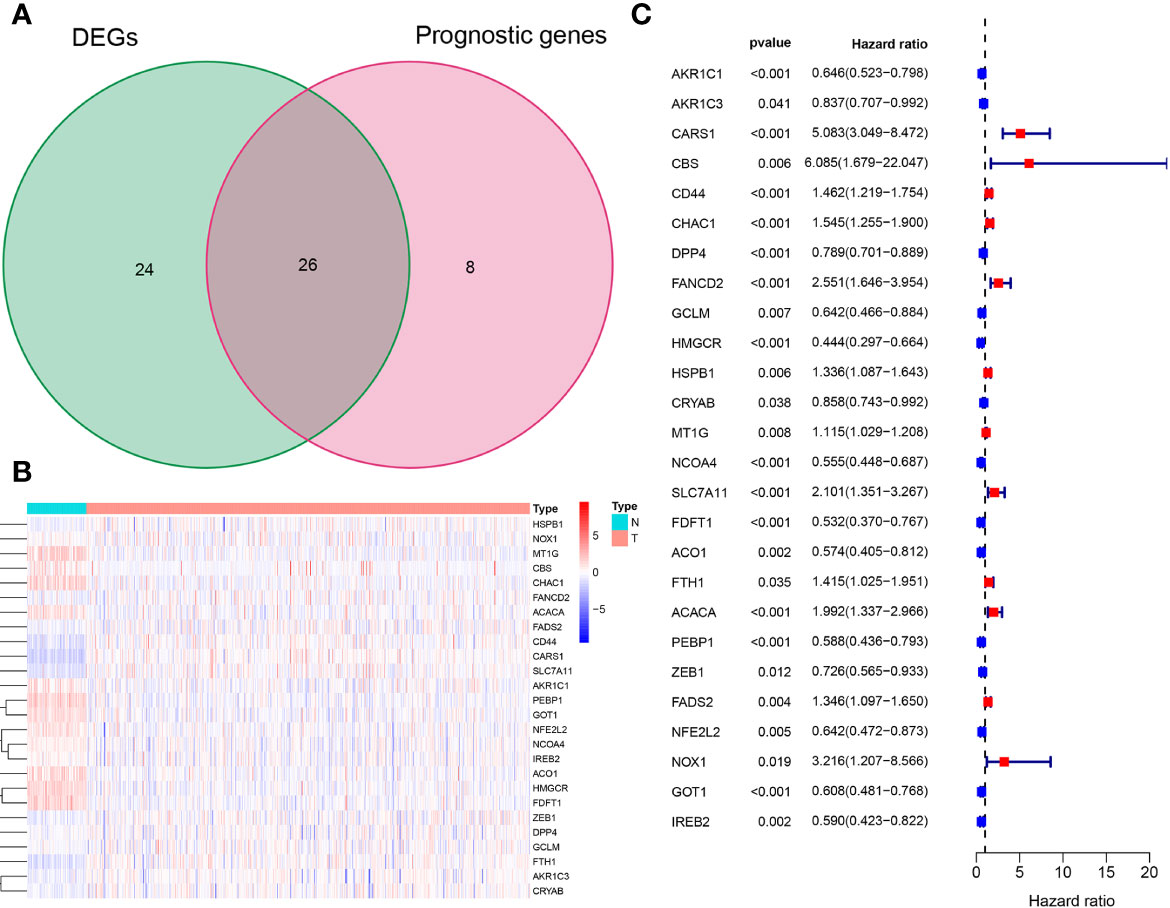
Figure 2 Identification of 26 PDEFRGs. (A) Venn diagram showing 26 PDEFRGs between DEFRGs and prognostic genes. (B) The heat map of 26 PDEFRGs. (C) Forest plots showing that 26 PDEFRGs correlated with OS (P < 0.05).
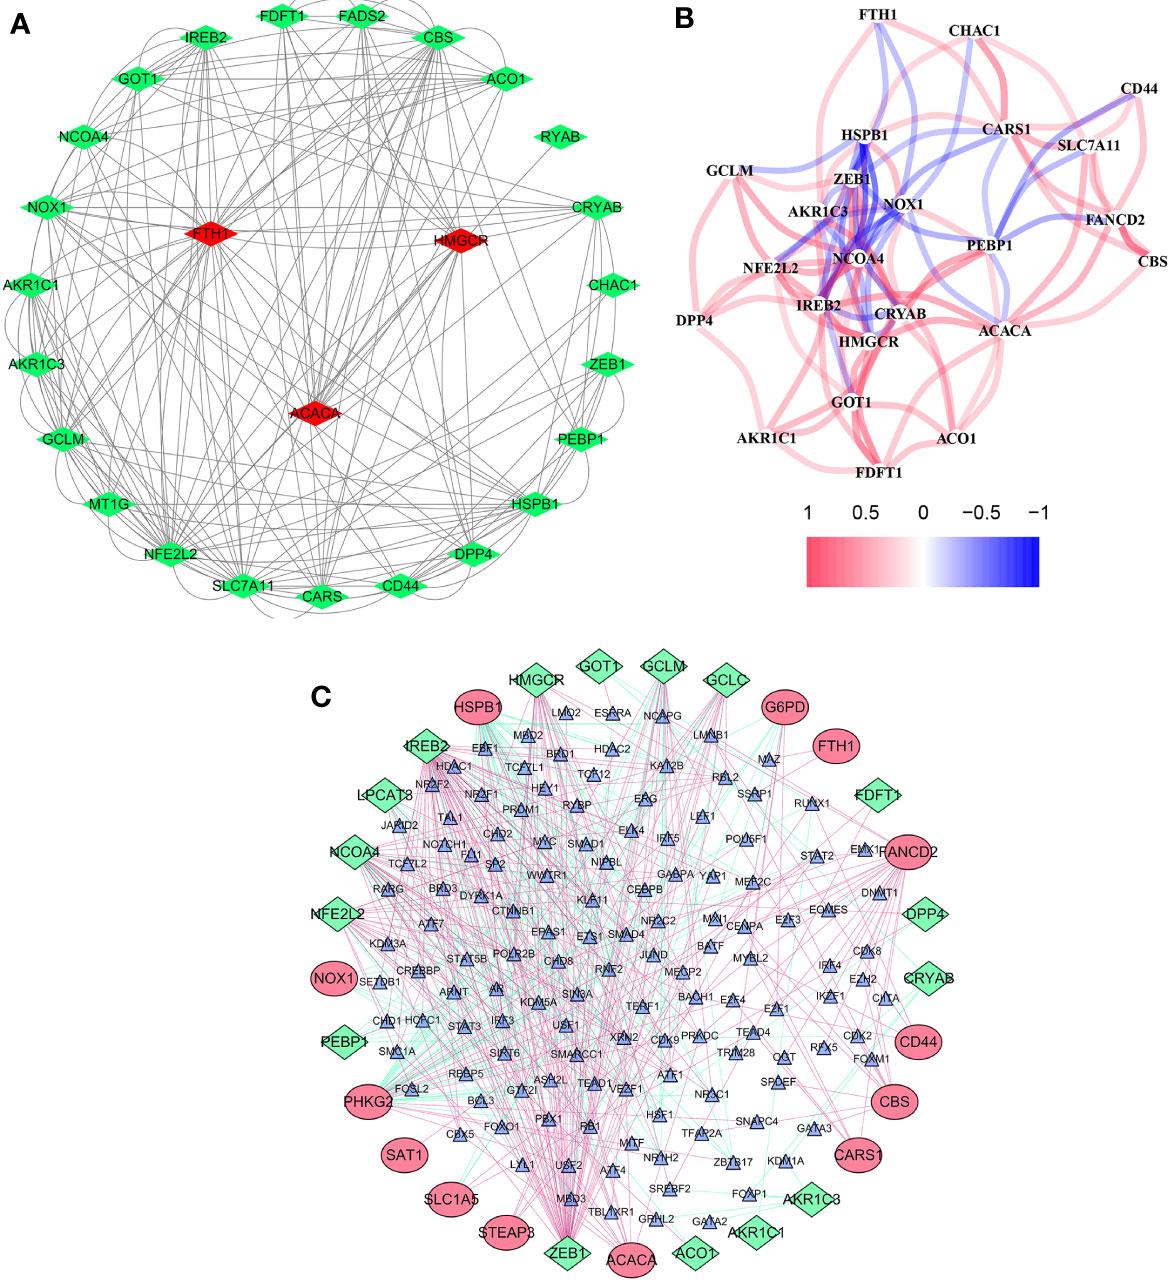
Figure 3 Network of FRGs. (A) PPI network constructed with the nodes with interaction confidence value >0.15 of 26 PDEFRGs. (B) The correlation network of 26 PDEFRGs. Different colors represent the correlation coefficients. (C) TFs-FRGs network; the green nodes: FRGs with low risk (P < 0.05), the red nodes: FRGs with high risk (P < 0.05), the blue nodes: TFs that correlated with the FRGs (correlation coefficient >0.4).
Using the Lasso regression analysis, we removed 15 PDEFRGs that were overfit to the model (Figures 4A, B). Then, the multivariate Cox regression analysis was used to select eight optimal FRGs: AKR1C1, CARS1, HMGCR, CRYAB, MT1G, NCOA4, ACACA and FADS2 (Figures 4C, D). Among them, CARS1, MT1G, ACACA and FADS2 were identified as high-risk genes while AKR1C1, HMGCR, CRYAB and NCOA4 were categorized as low-risk genes. Moreover, the coefficients of eight FRGs were obtained through multivariate Cox regression analysis.
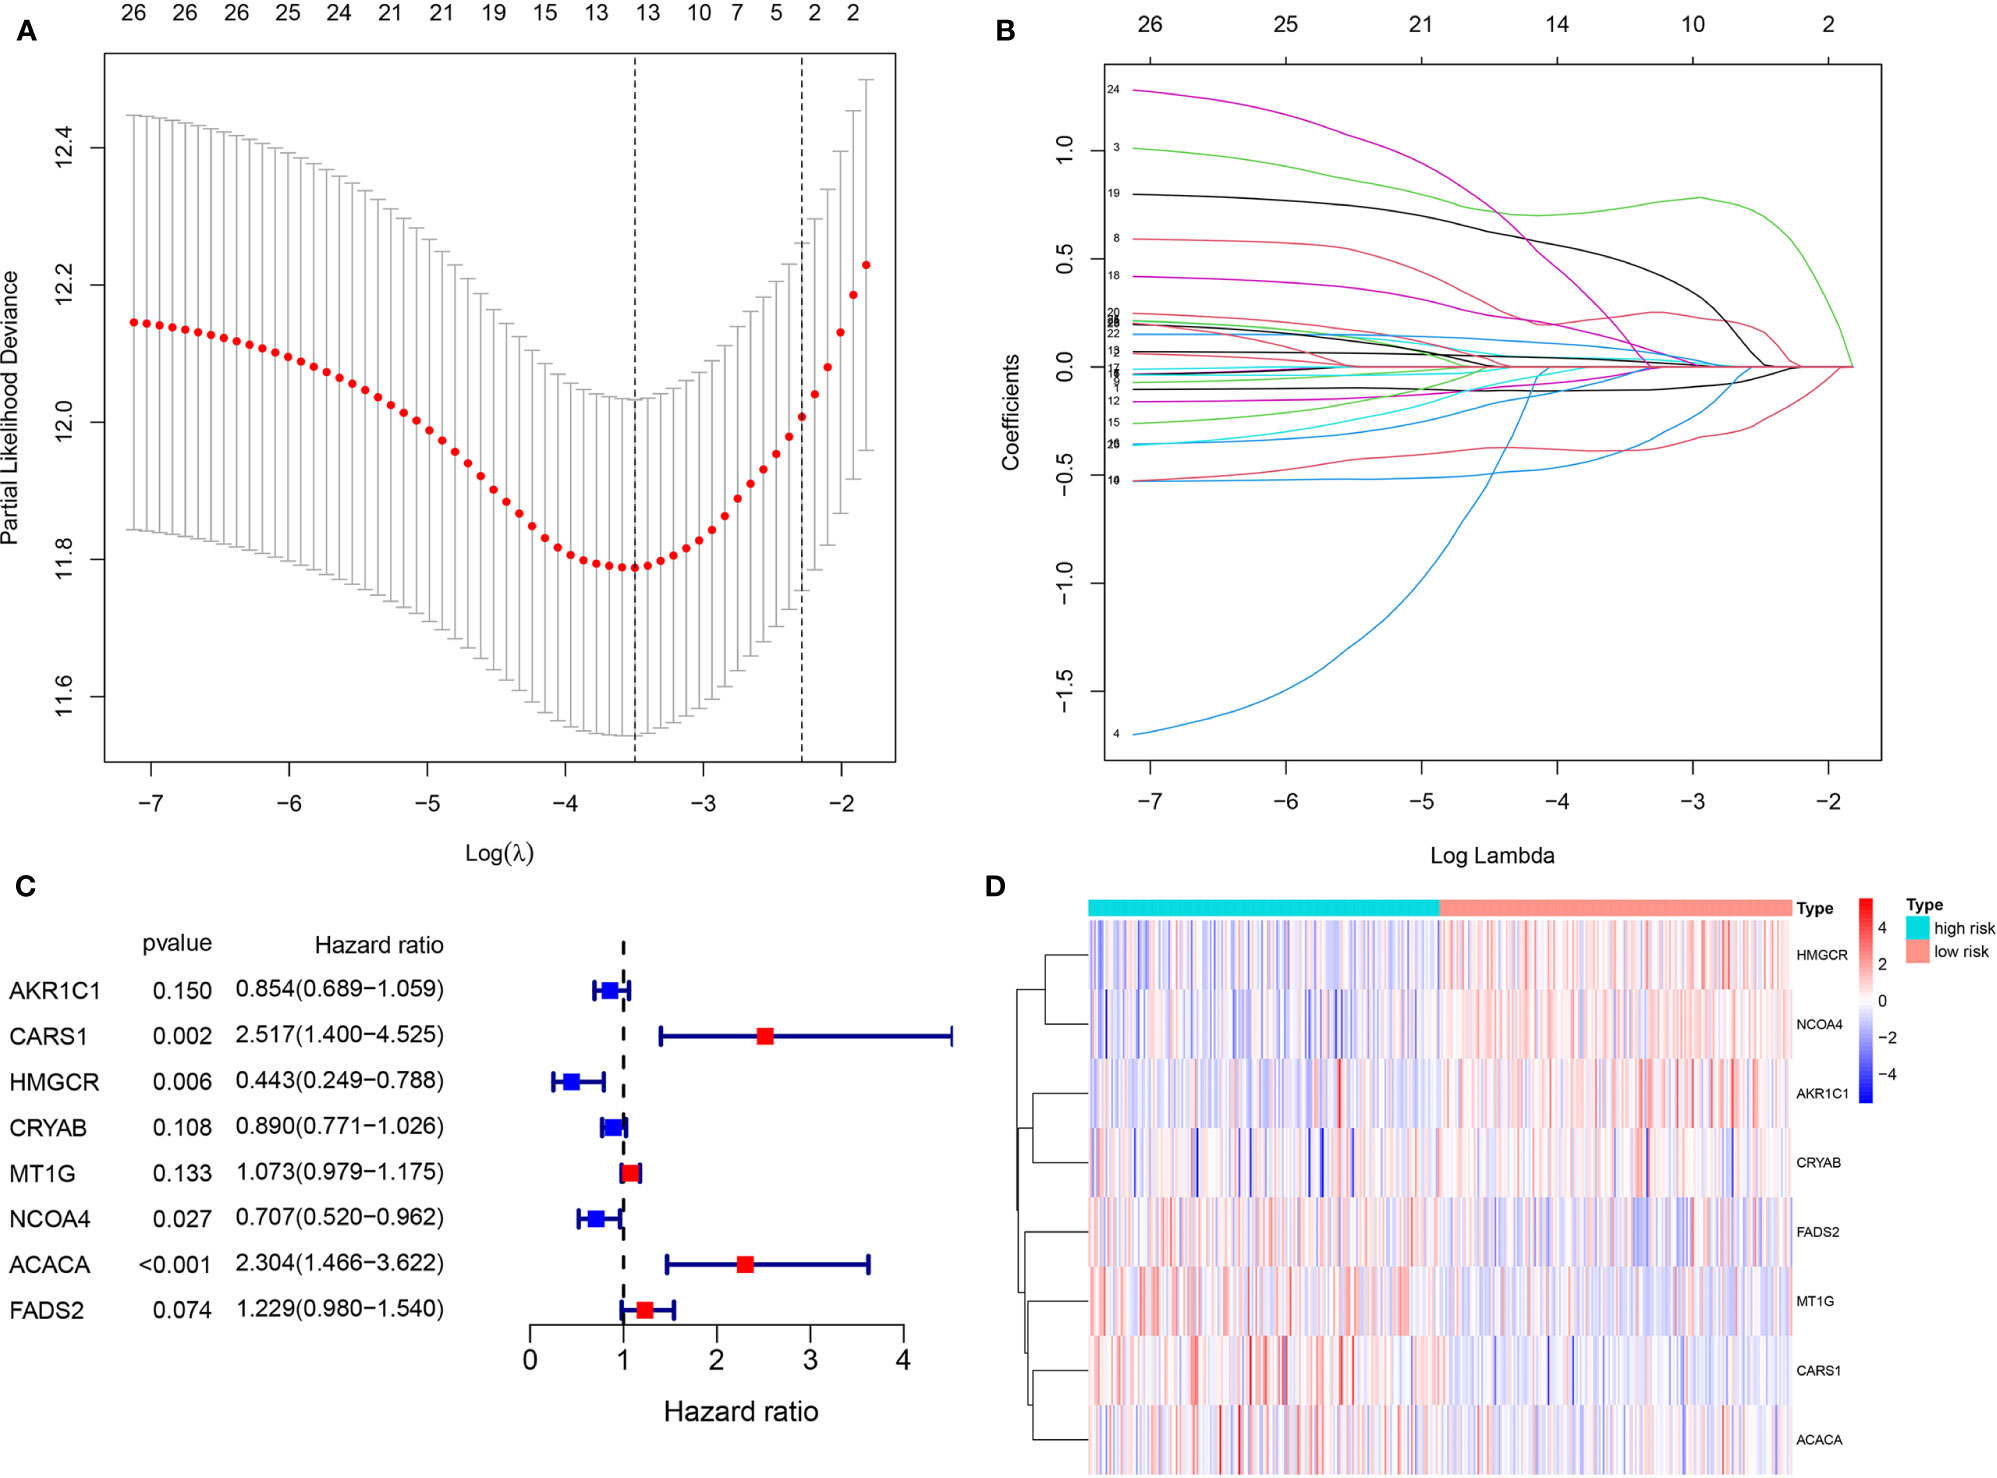
Figure 4 Identification of eight optimal FRGs. (A, B) LASSO regression analyses of 26 PDEFRGs. (C) Forest plots showing eight selected optimal risk FRGs. (D) The heat map of eight optimal FRGs.
The mRNA expression levels and relevant coefficients of the eight optimal PDEFRGs were used to calculate the risk score as per the following formula:
The ccRCC patients were categorized into a high-risk group (n = 185) and a low-risk group (n = 186) (Figure 5A). Kaplan–Meier curve indicated that high-risk patients had a significantly worse OS compared with the low-risk group patients (P <0.001) (Figure 5D). Time-dependent ROC curves were applied to evaluate the predictive capability of the risk score for OS. All the AUC values reached 0.70 (Figure 5C). The survival status scatter plot showed that the ccRCC patients classified as the high-risk group had a poor prognosis than those classified as low-risk (Figure 5B). The principal component analysis (PCA) plot indicated that the patients in different risk groups were distributed in two directions (Figure 5E). Moreover, cancer specific survival (CSS) analysis was performed. The patients in the training cohort were categorized into high- and low-risk groups (Figure 5F). The findings of CSS analysis were similar to the previous findings of OS (Figures 5G–J).
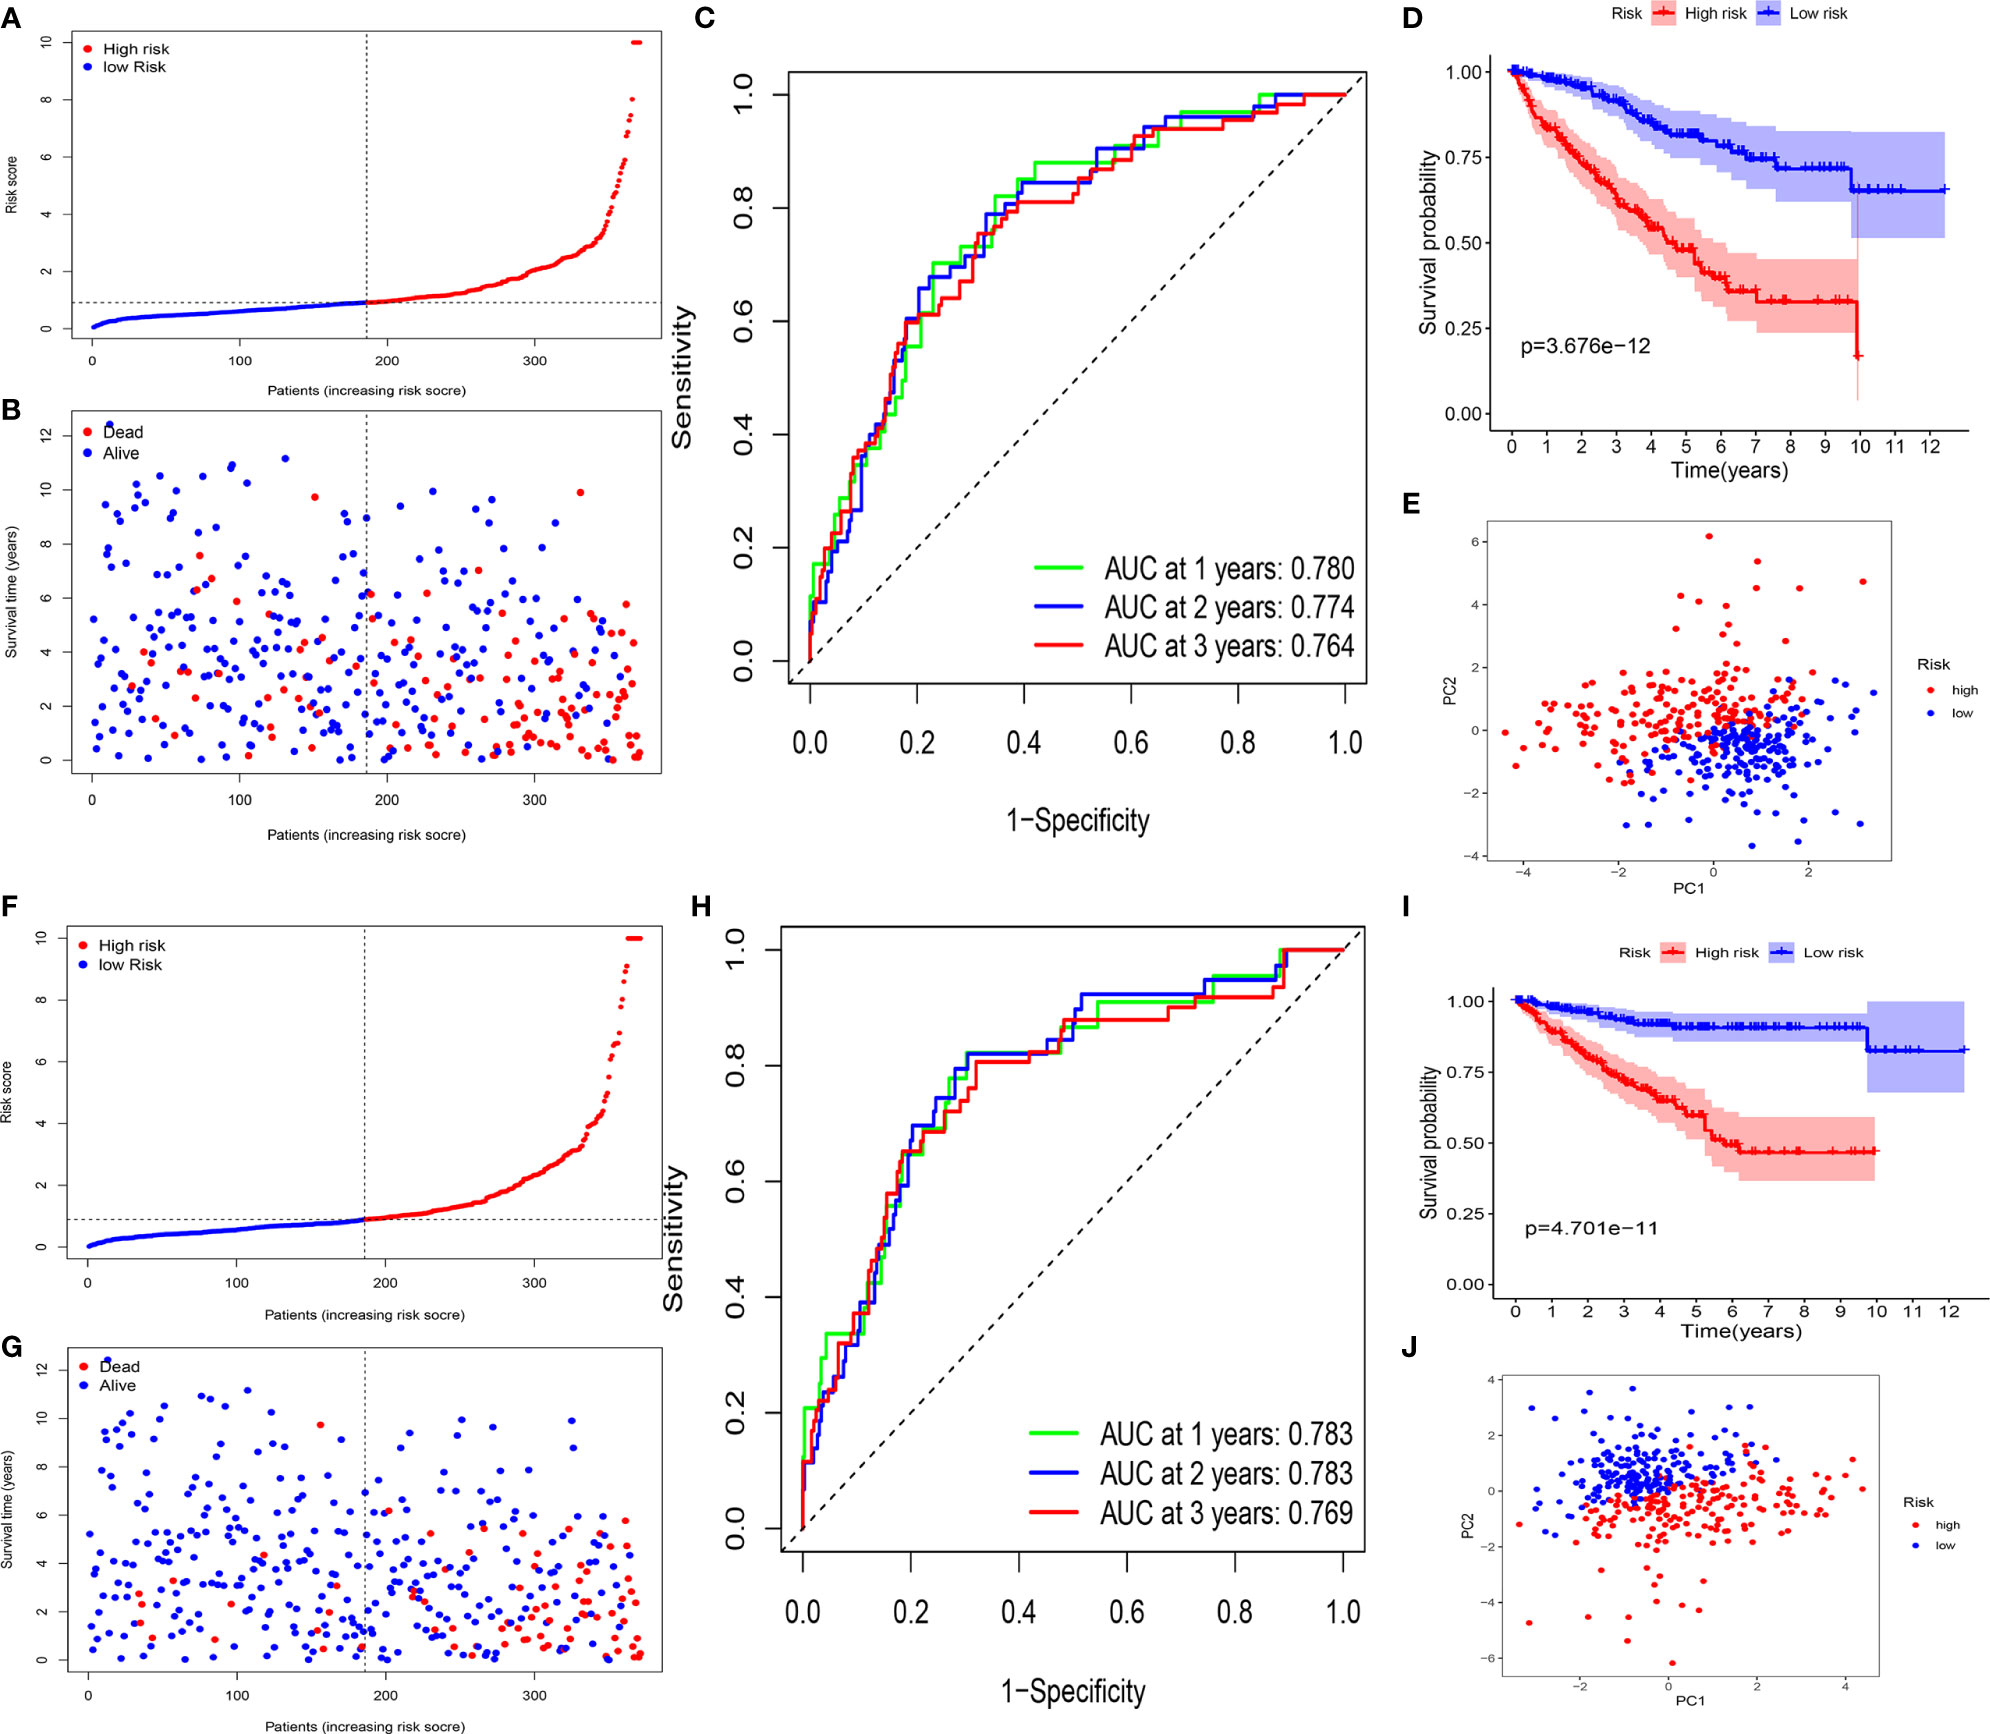
Figure 5 Survival analyses of the signature in the training cohort. (A–E) Survival analyses for patients with OS. (A) Risk score distribution of patients. (B) Survival status scatter plot. (C) Time-dependent ROC curve. (D) Kaplan–Meier curve. (E) PCA plot based on the risk score. (F–J). Survival analyses for patients with CSS. (F) Risk score distribution of patients. (G) Survival status scatter plot. (H) Time-dependent ROC curve. (I) Kaplan–Meier curve. (J) PCA plot based on the risk score.
To validate it, the risk score was also calculated in the testing cohort (n = 155) and the entire TCGA cohort (n = 576). In the testing cohort, 77 patients were classified as high-risk and 78 as low-risk, respectively (Figure 7A). Likewise, in the entire TCGA cohort, 263 patients were classified as high-risk and 263 patients as low-risk, respectively (Figure 7D). In line with the training cohort, lower OS could be found in patients with high-risk in both the testing cohort and the entire TCGA cohort (P <0.05) (Figures 6A, B). Next, the AUC of the 8-FRG risk model in the testing cohort was 0.801 in the 1st year, 0.682 in the 2nd year, and 0.749 in the 3rd year (Figure 6C). Accordingly, in the entire TCGA cohort, the AUC was 0.787 in the 1st year, 0.738 in the 2nd year, and 0.747 in the 3rd year (Figure 6D). All these ROC data were in line with the results of the training cohort. In addition, both the survival status scatter and PCA plots were shown in Figures 7B, C, E, F, respectively. All these data suggest that our model may contribute to the prognosis prediction of ccRCC patients.
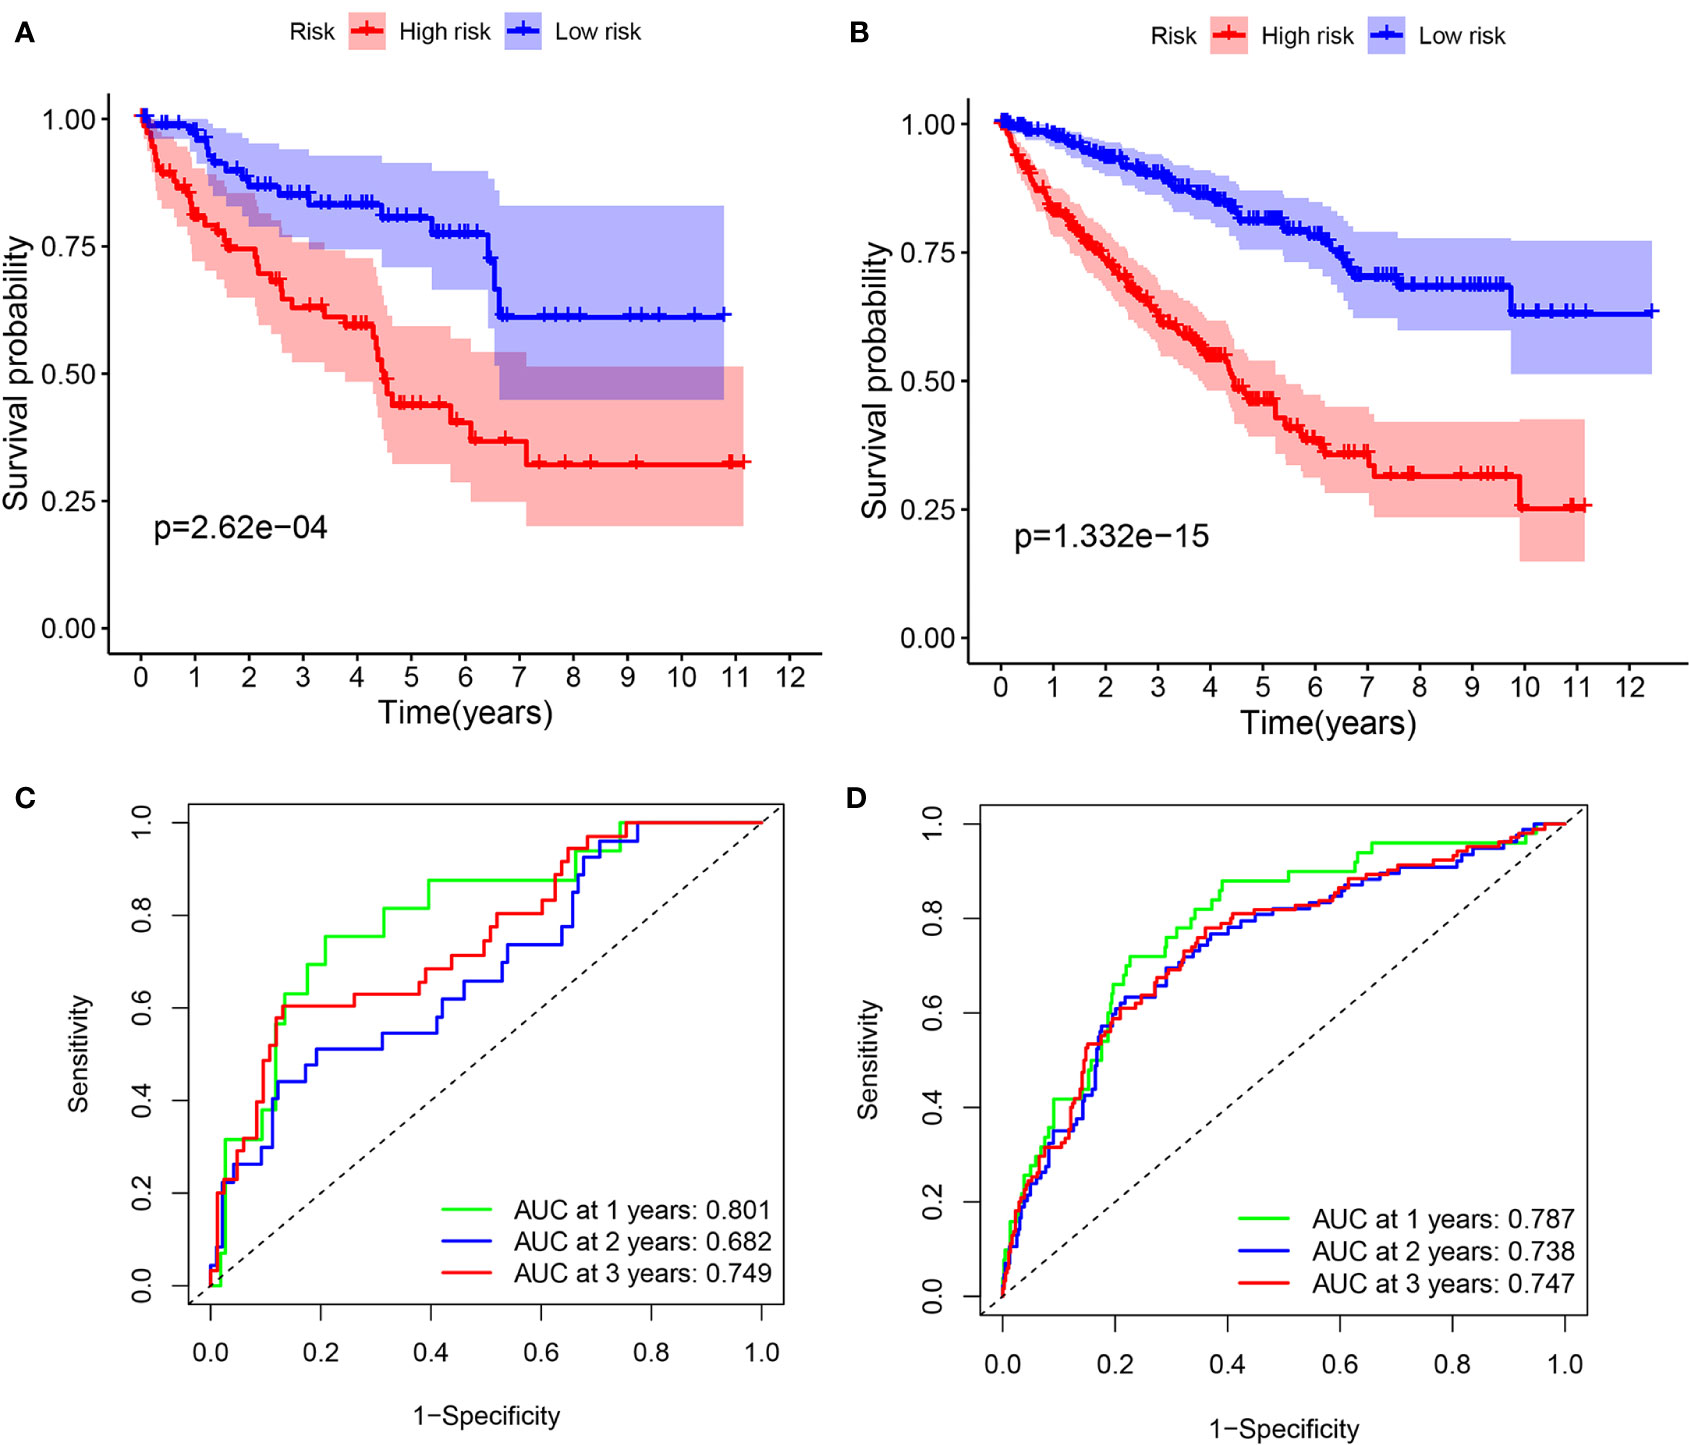
Figure 6 Survival analyses in the validation cohorts. (A, B) Kaplan–Meier curve of the testing cohort (A) and the entire TCGA cohort (B). (C, D) Time-dependent ROC curve of the testing cohort (C) and the entire TCGA cohort (D).
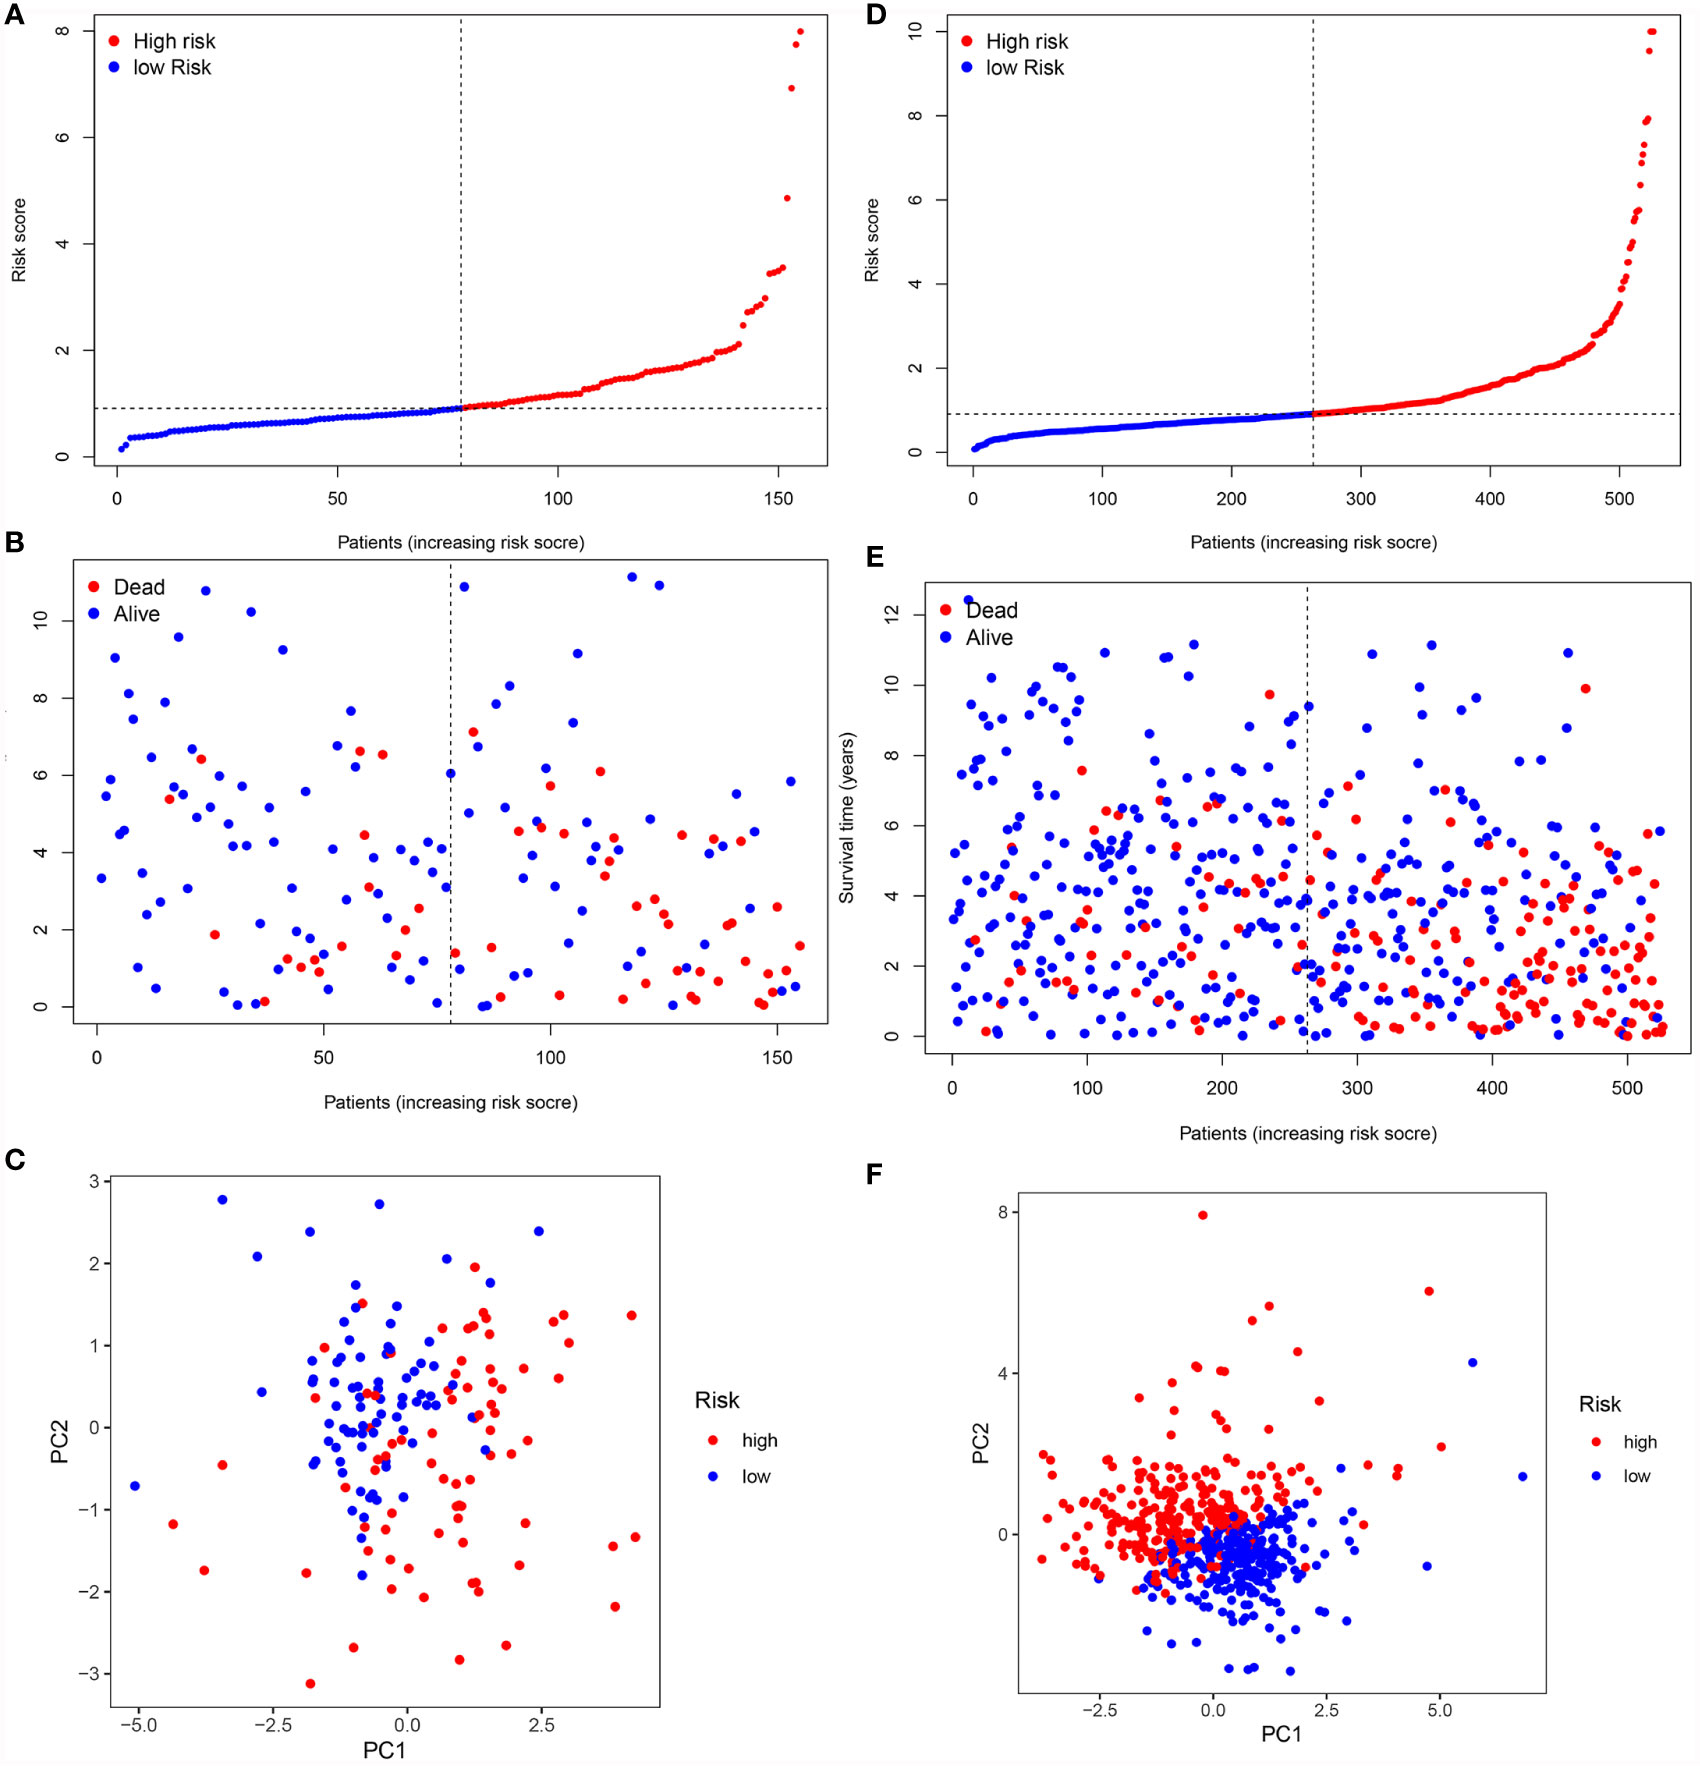
Figure 7 Validation of the signature in the validation cohorts. (A, D) Risk score distribution of patients in the testing cohort (A) and the entire TCGA cohort (D). (B, E). Survival status scatter plot of patients in the testing cohort (B) and the entire TCGA cohort (E). (C, F) PCA plot in the testing cohort (C) and the entire TCGA cohort (F).
In the entire TCGA cohort, the univariate and multivariate Cox regression analyses were performed to identify the independent prognostic factors among the risk score and clinical parameters (age, gender, grade, stage T, stages N and M). The univariate analysis indicated that clinical parameters (age, stages T and M) and risk score were correlated with ccRCC prognosis (P <0.05) (Figure 8A). The multivariate Cox regression analysis revealed that the risk score was independently associated with OS (P <0.05) (Figure 8B). Moreover, clinical variables such as age, stages T and M were also identified as the independent prognostic factors (P <0.05).
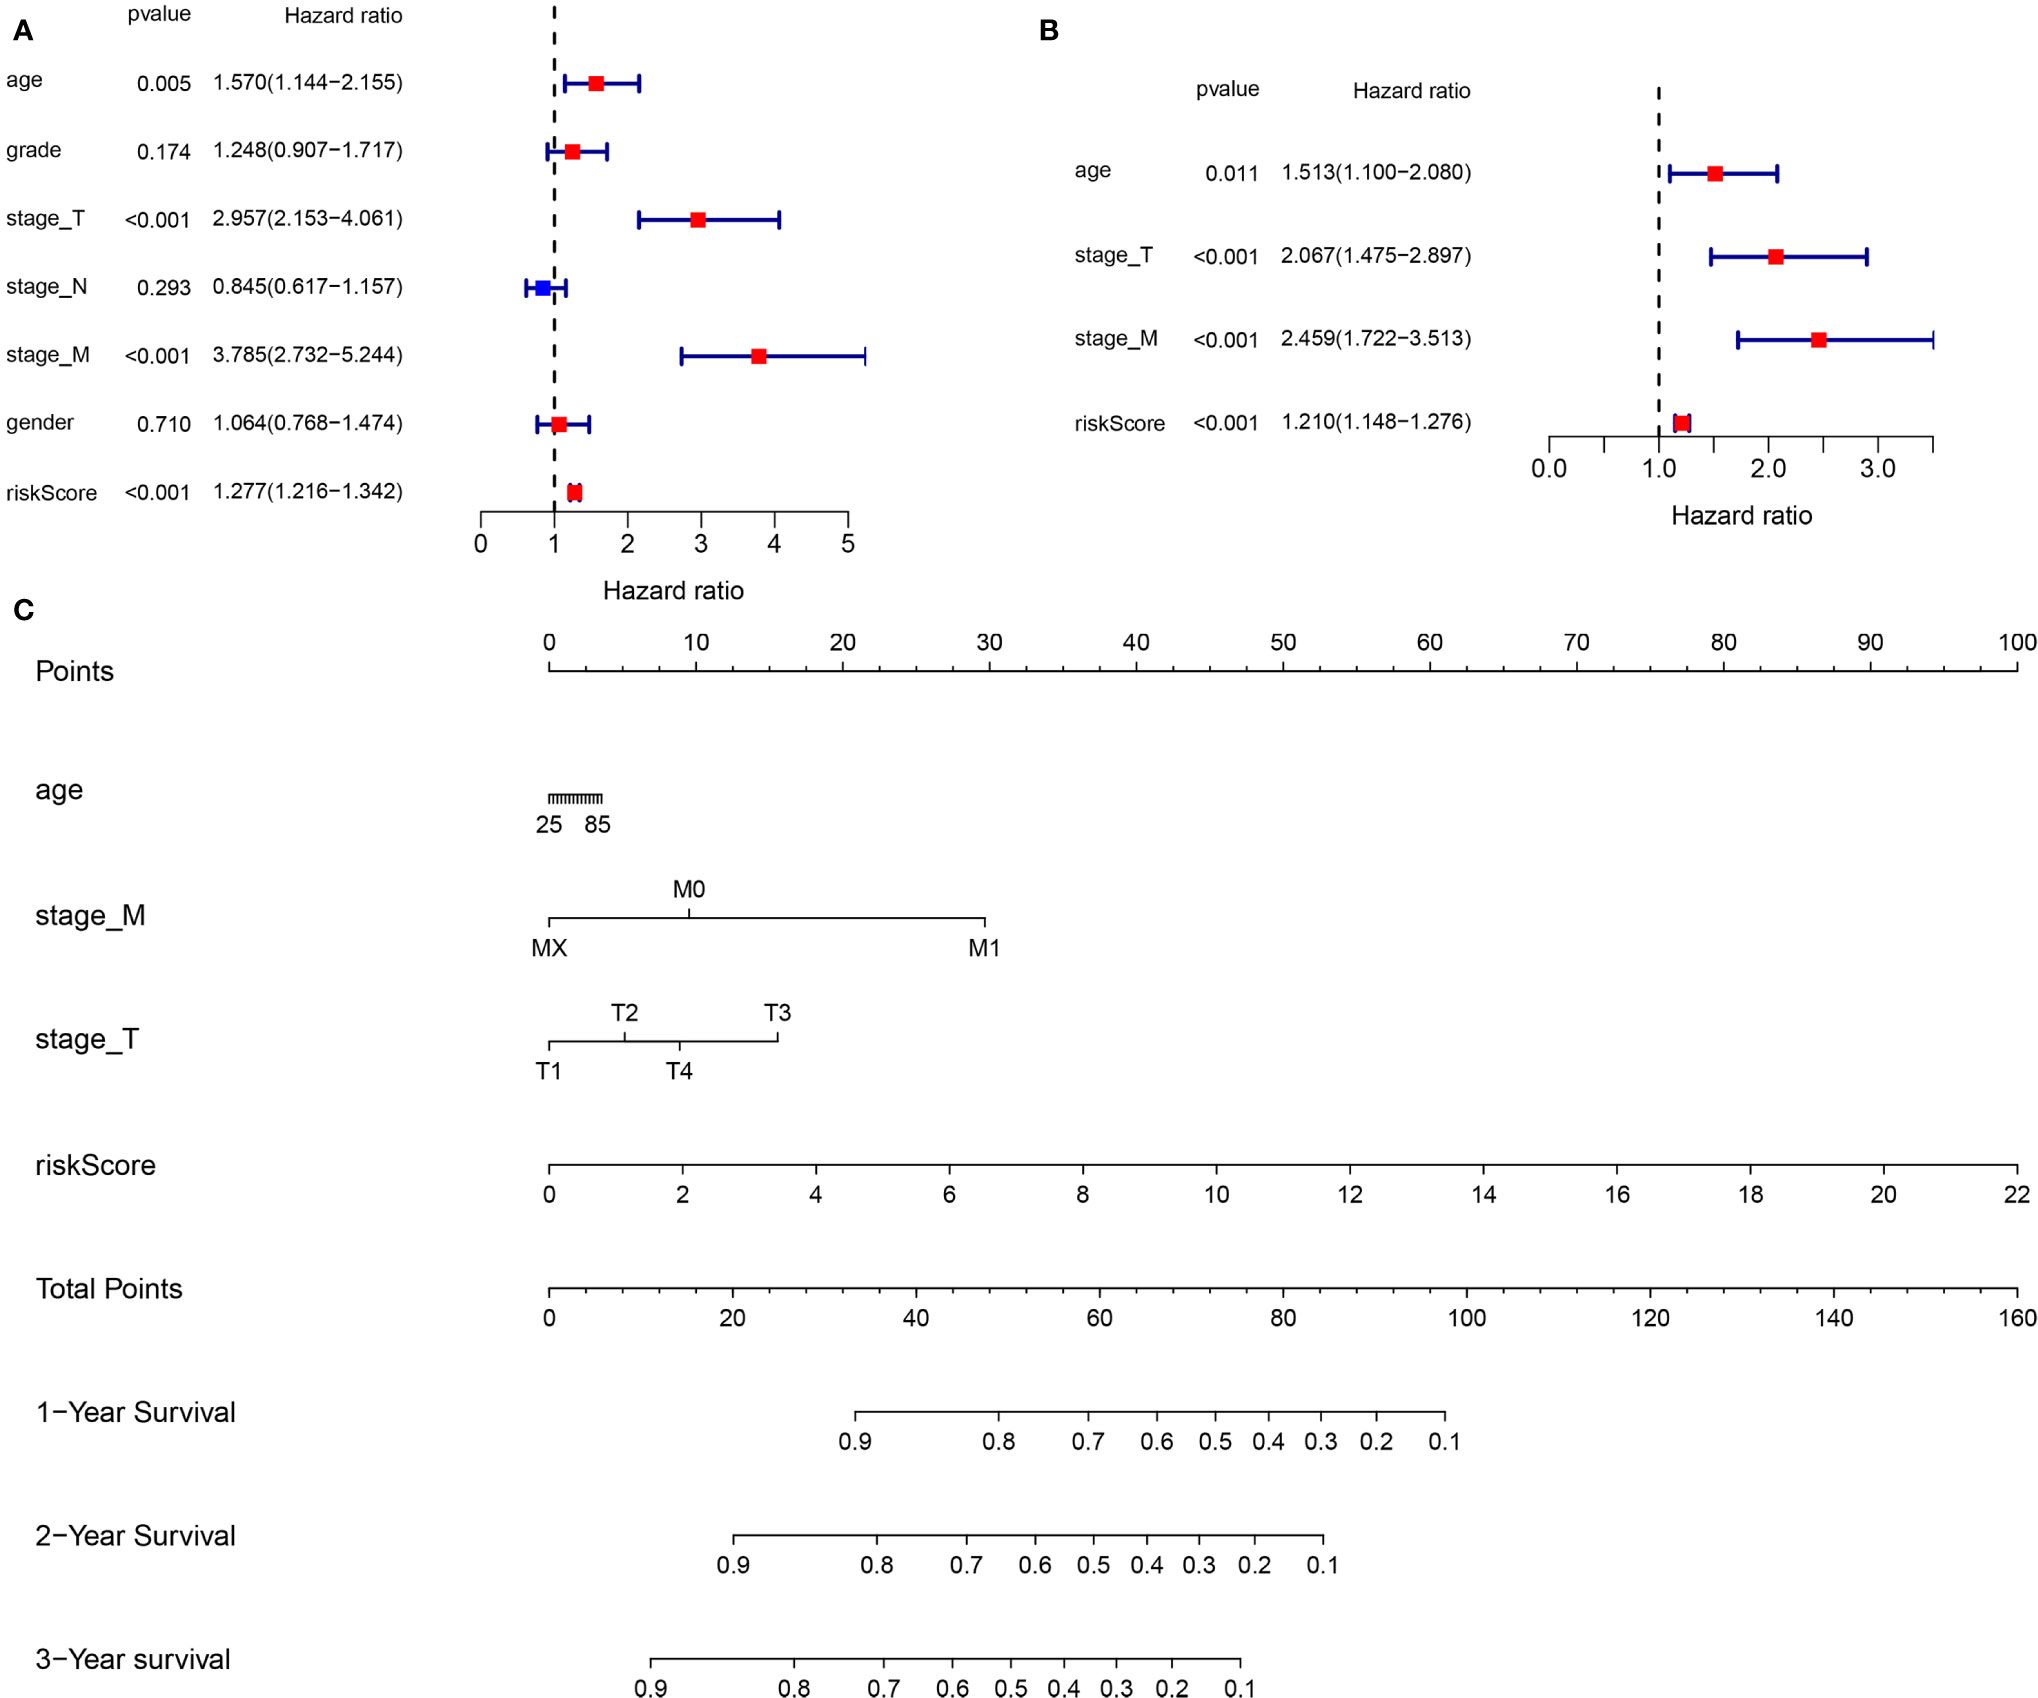
Figure 8 Construction of a new prognostic nomogram. (A) Univariate Cox regression analyses (B) Multivariate Cox regression analyses (C) Nomogram analyses of the selected prognostic factors.
Base on the clinical features (age, stage T and stage M) and the risk score, a new prognostic nomogram was constructed to further predict ccRCC prognosis (Figure 8C). As validated by the calibrate curves and DCA curves, the nomogram had a favorable prognostic effect (Figures 9A–F).
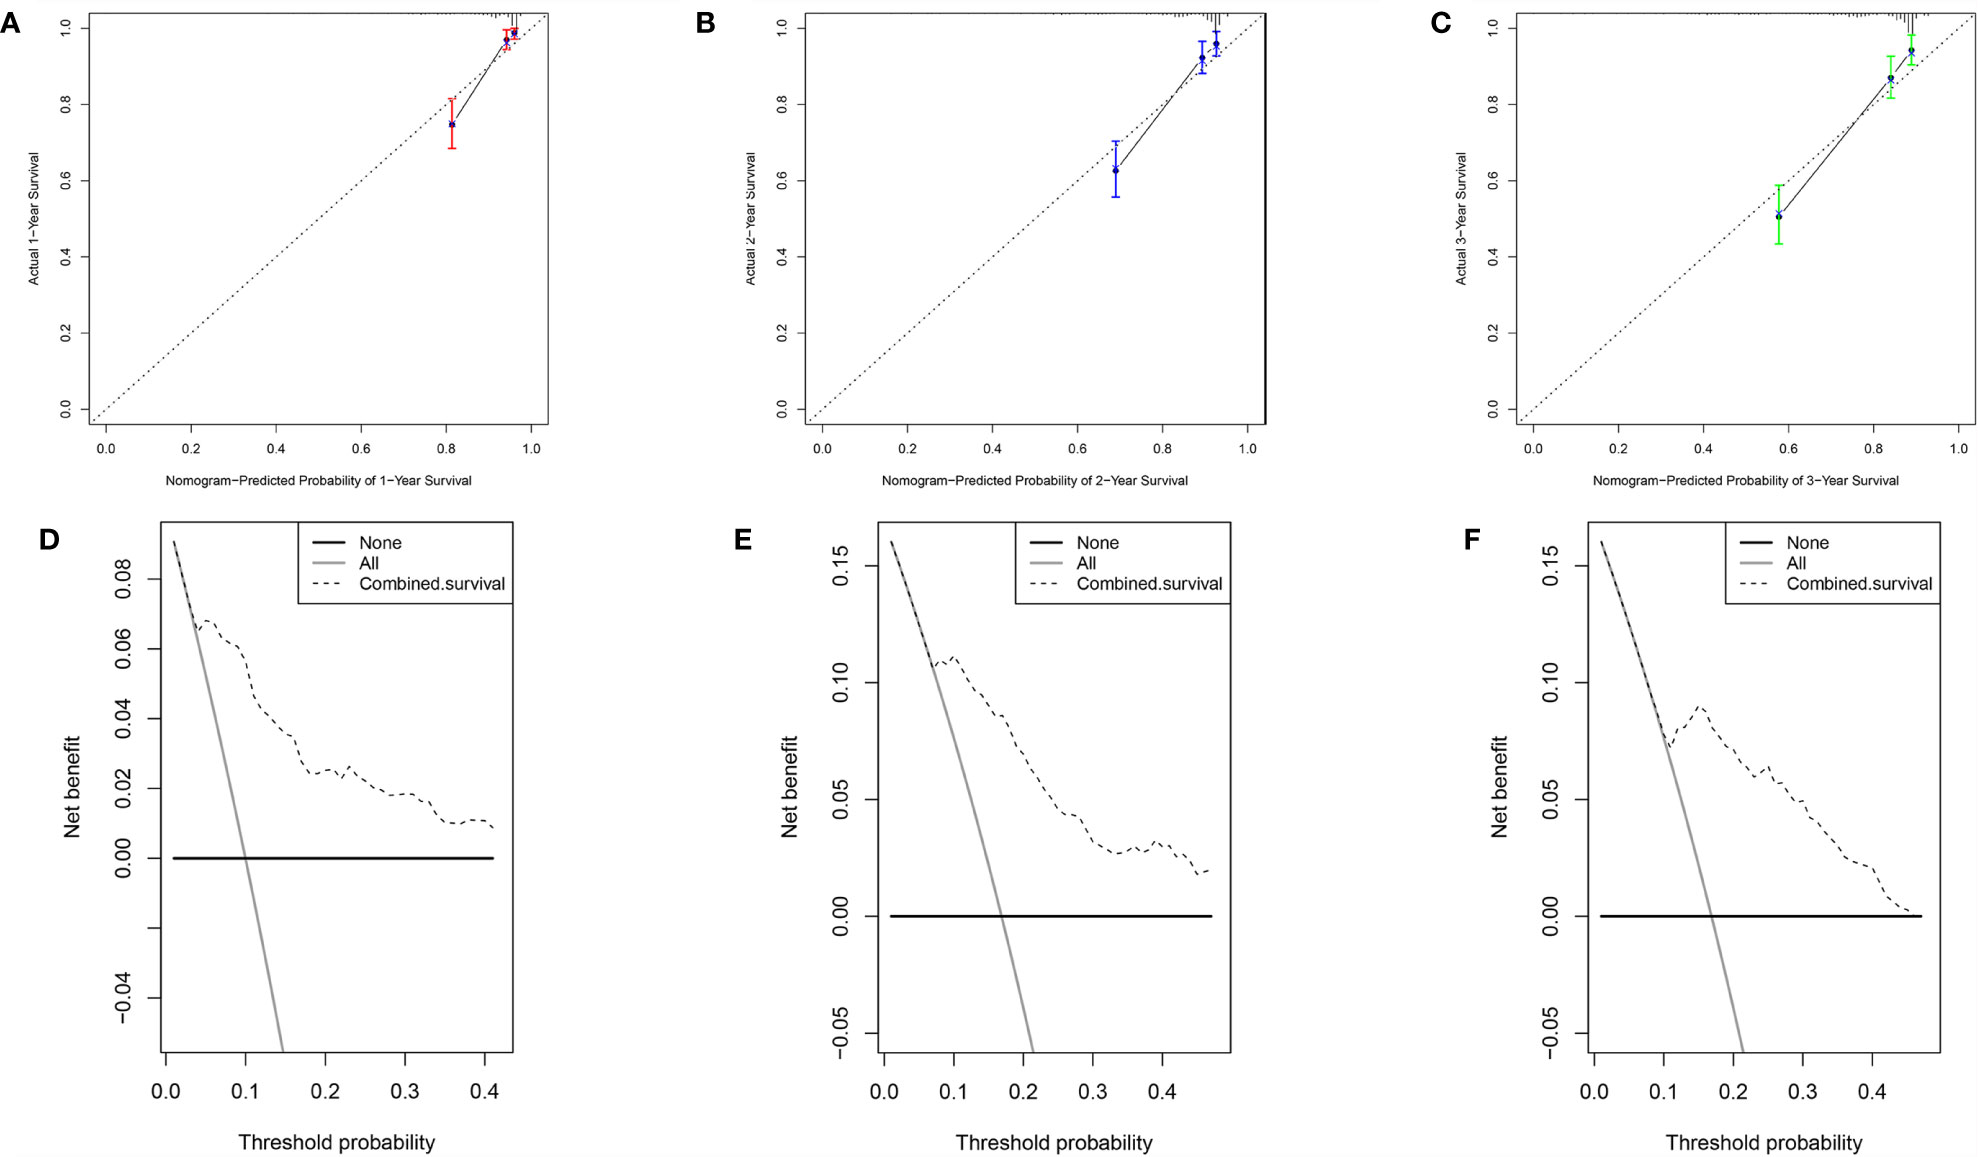
Figure 9 Verification of the nomogram performance. (A) The calibrate curve of 1st year. (B) The calibrate curve of 2nd year. (C) The calibrate curve of 3rd year. (D) The DCA plot of 1st year. (E) The DCA plot of 2nd year. (F) The DCA plot of 3rd year.
The immune correlation analysis revealed that this signature had a significant correlation with the levels of certain immune cells (CD4_T cell, CD8_T cell, neutrophils, macrophages and dendritic cells) in ccRCC (P <0.05) (Figures 10A–F). As per the enrichment scores based on the ssGSEA analyses, the levels of several immune cells, including the score of aDCs, iDCs, macrophages, mast_cells, Neutrophils, T helper_cells, Tfh, Th1_cells, Th2_cells, and TIL were significantly different between the different risk groups (P <0.05, Figure 11A). Immune pathway analysis showed that the score of type II IFN response had a negative association with the risk score of patients, while the T_cell_co-stimulation and parainflammation had the opposite effect (P <0.05, Figure 11B). Our results suggest that the signature significantly correlates with immune infiltration.
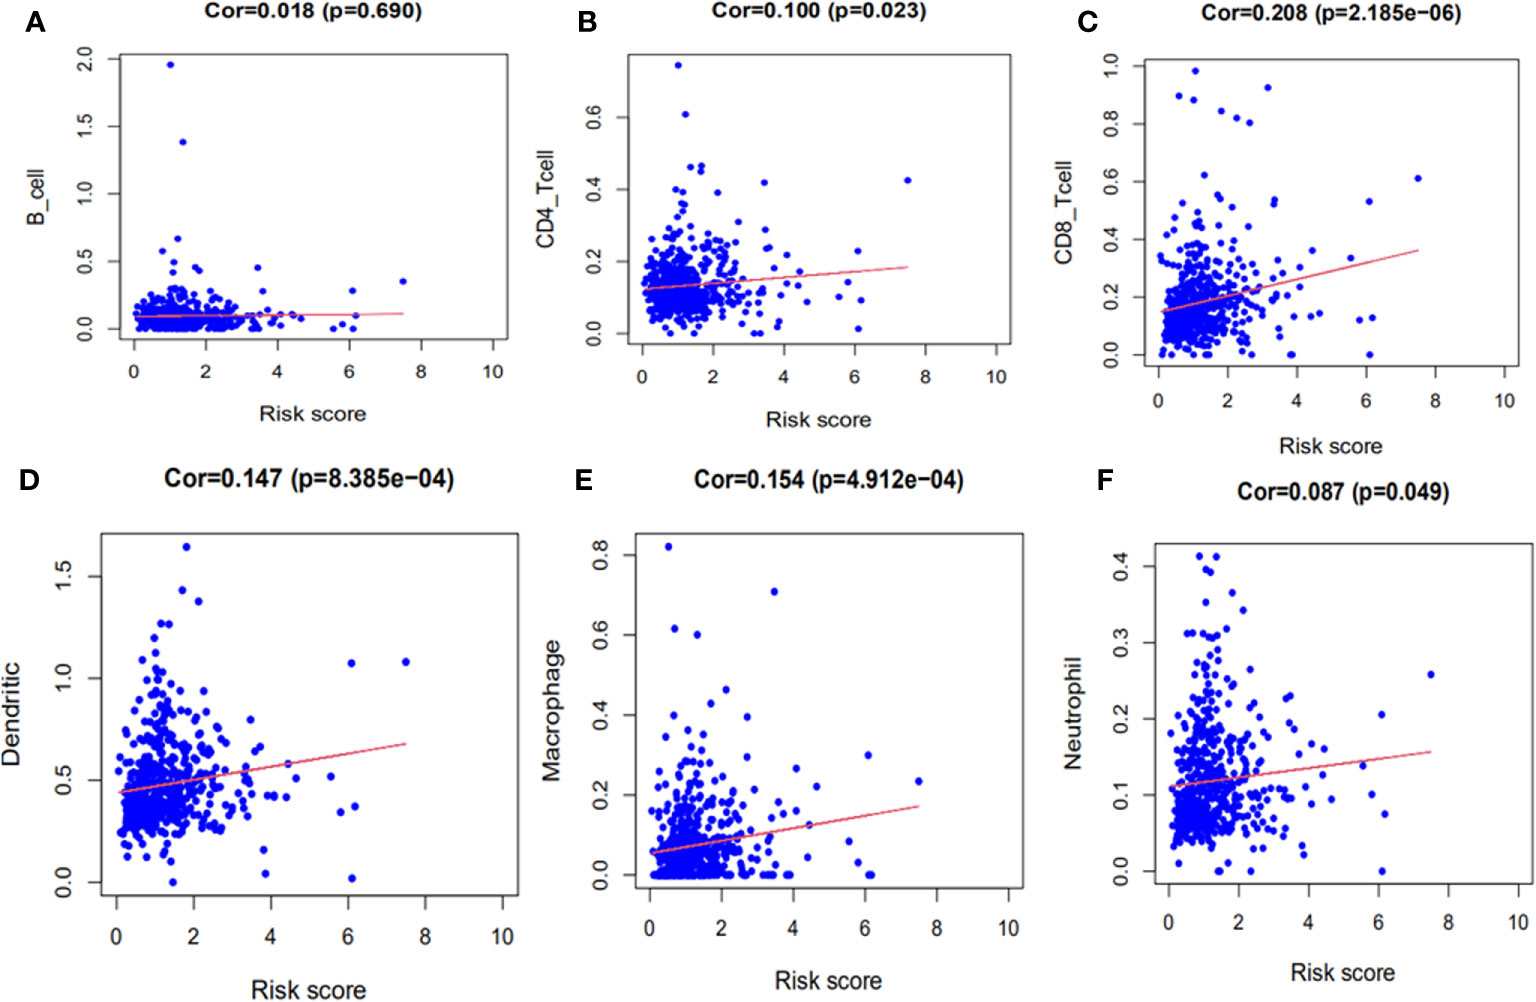
Figure 10 The immune correlation analyses of the signature. (A) B cells. (B) CD4+ T cells. (C) CD8+ T cells. (D) Dendritic cells. (E) Macrophages. (F) Neutrophils.
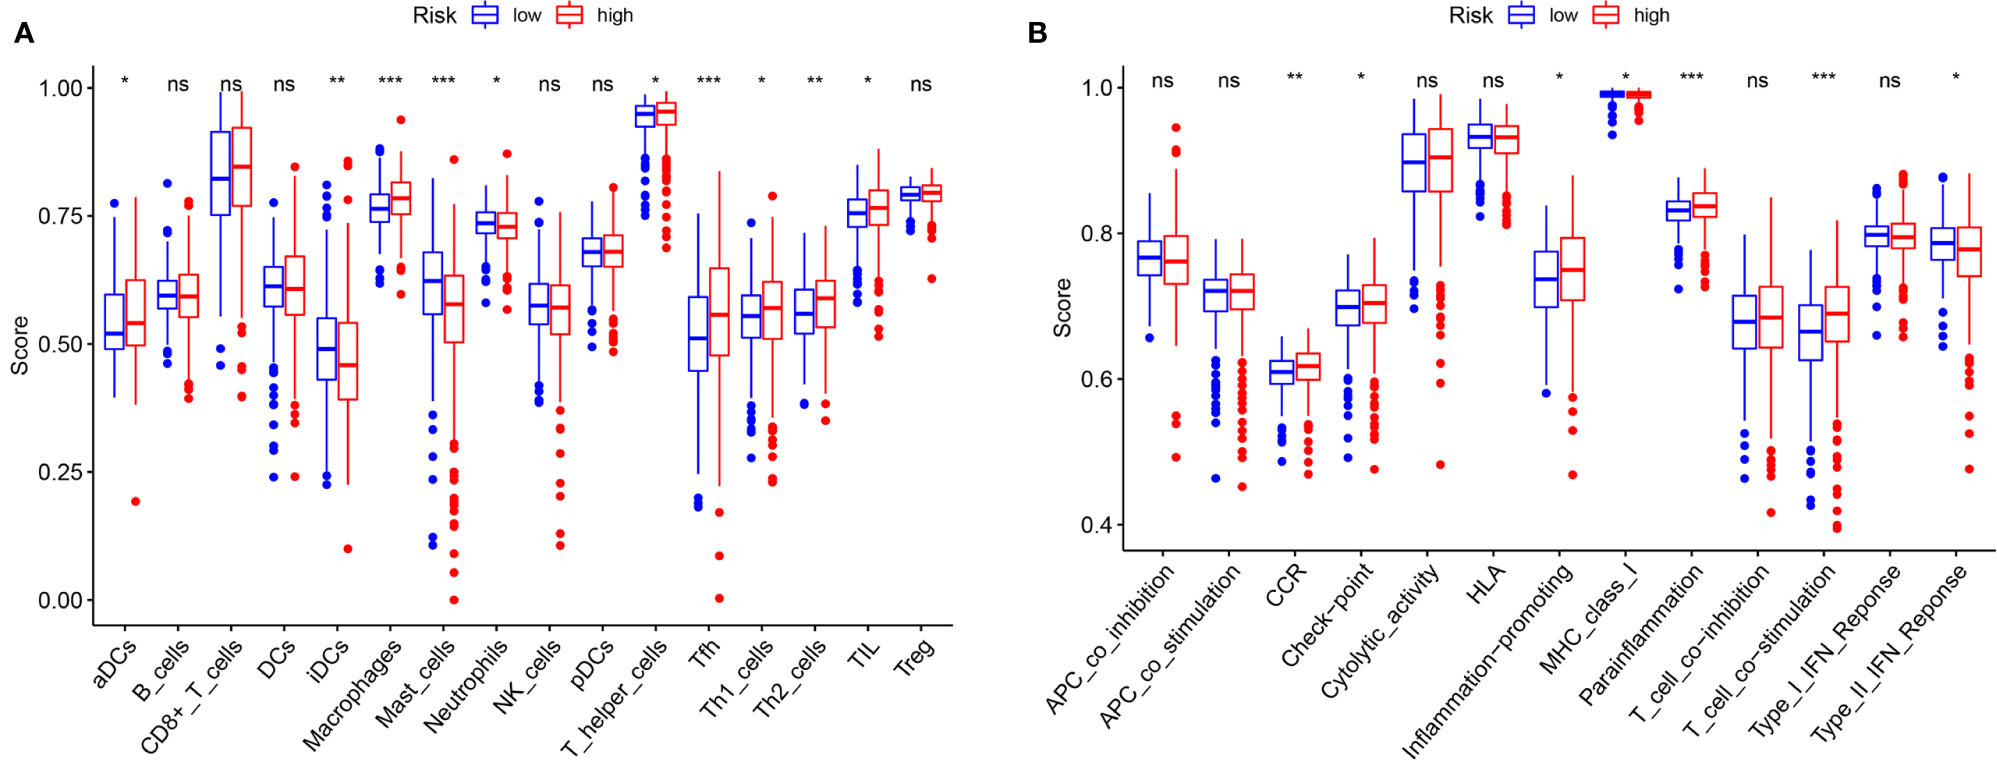
Figure 11 Comparison of the ssGSEA scores. (A) The scores of 16 immune cells are displayed in boxplots. (B) The scores of 13 immune-related functions are displayed in boxplots. Adjusted P values were showed as: ns, not significant; *P < 0.05; **P < 0.01; ***P < 0.001.
The K–M survival curves indicated that in most subgroups categorized based on the TMN stage, the OS of low-risk patients was significantly better than the OS of those with high-risk (Figure 12, P <0.05). Only these patients with T4 stage were not eligible, which may be related to the low number of samples.
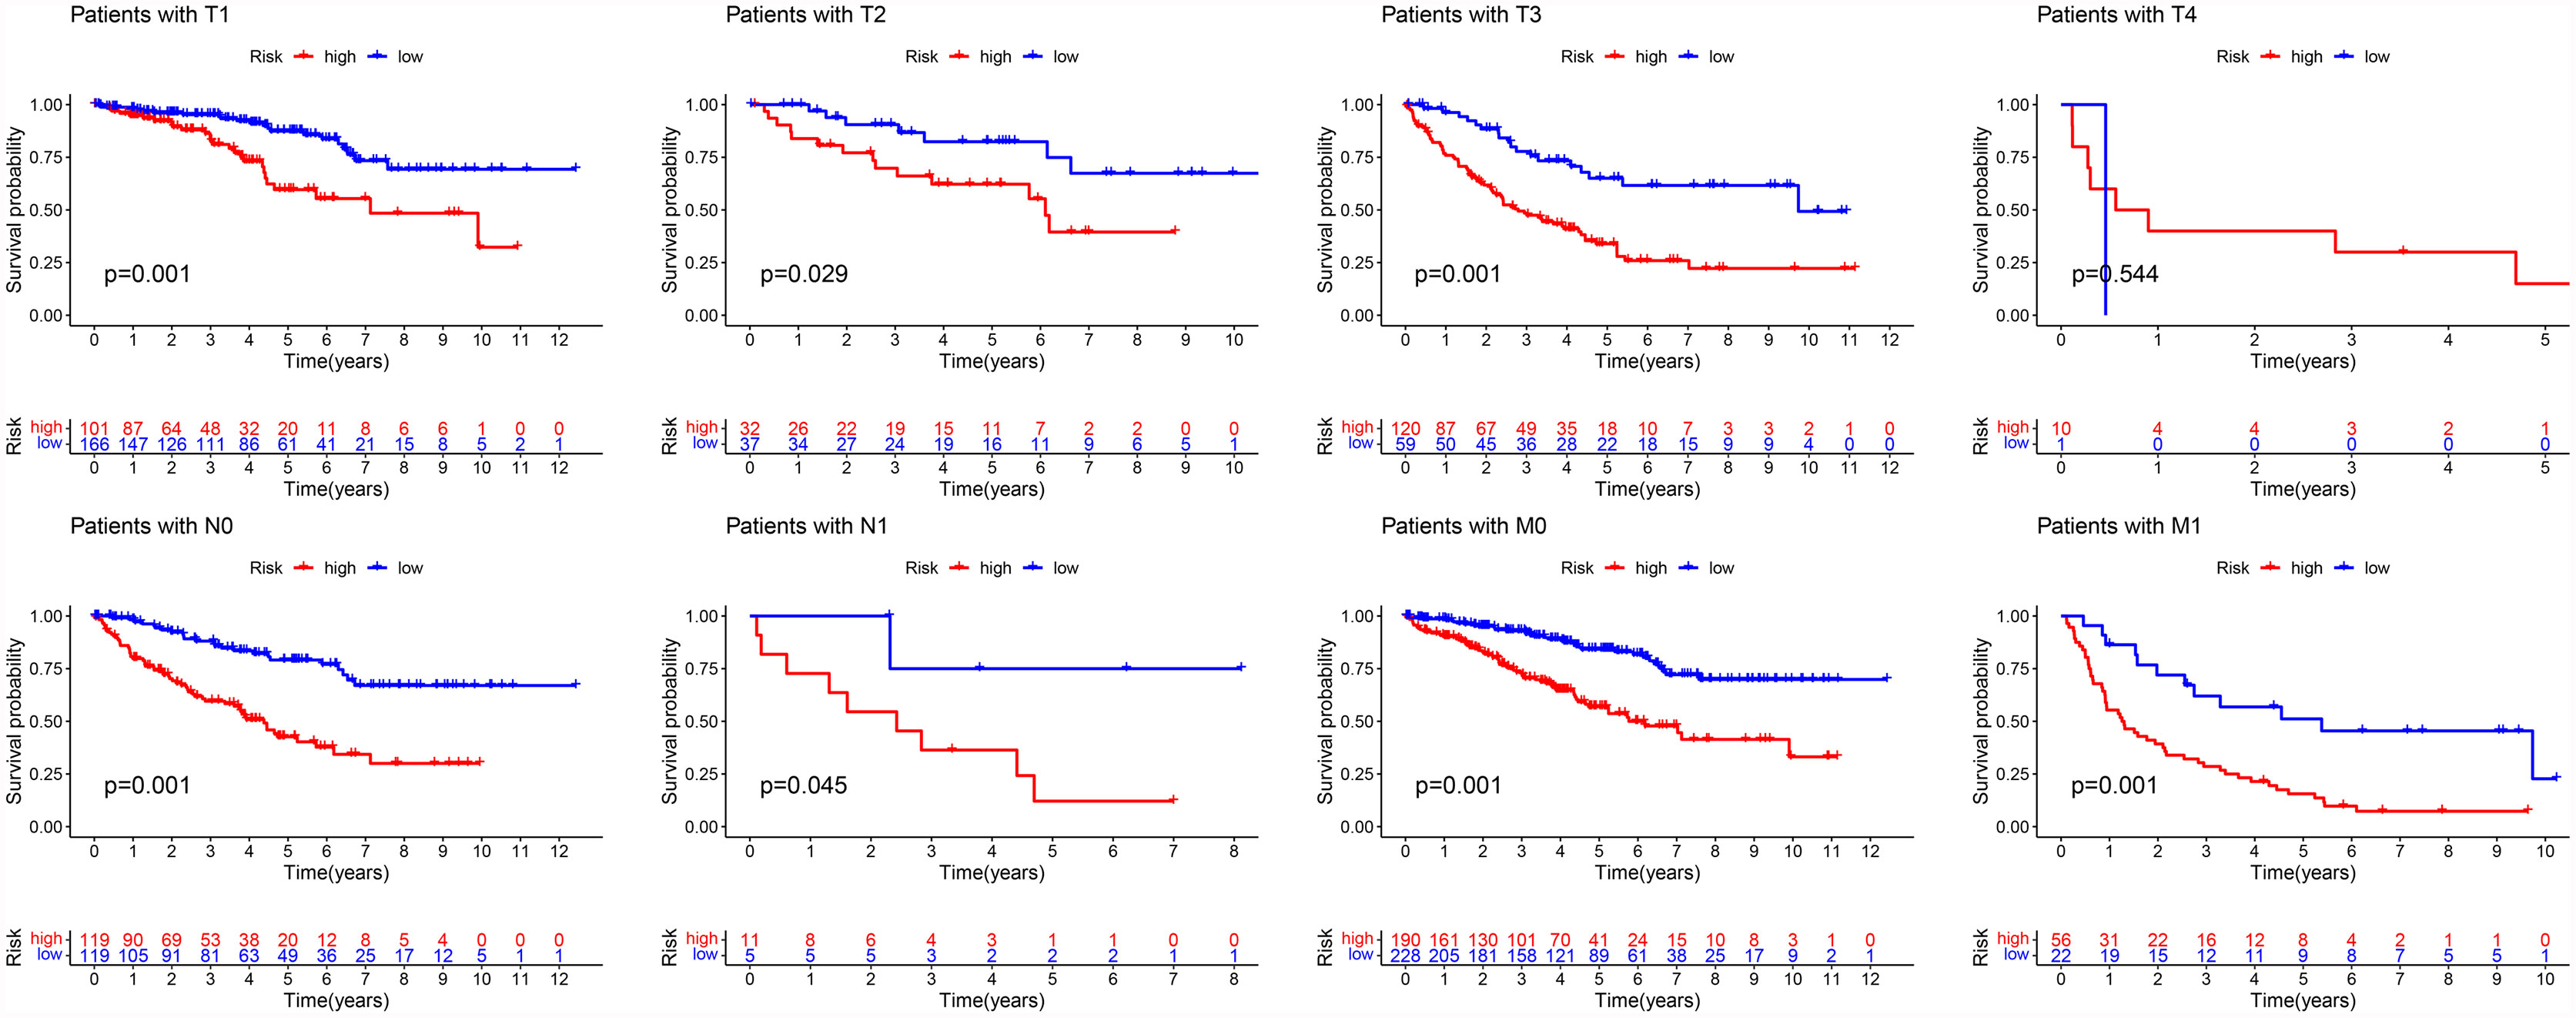
Figure 12 Stratified survival analysis of patients with different TMN stage.
qRT-PCR was performed to examine the mRNA expression levels of eight FRGs in 20 paired ccRCC and adjacent non-tumorous tissues. We found increased CARS1, CRYAB and FADS2 expression in ccRCC tissues as compared with adjacent non-tumorous tissues, while the expression of other five FRGs was reduced in ccRCC (Figure 13).
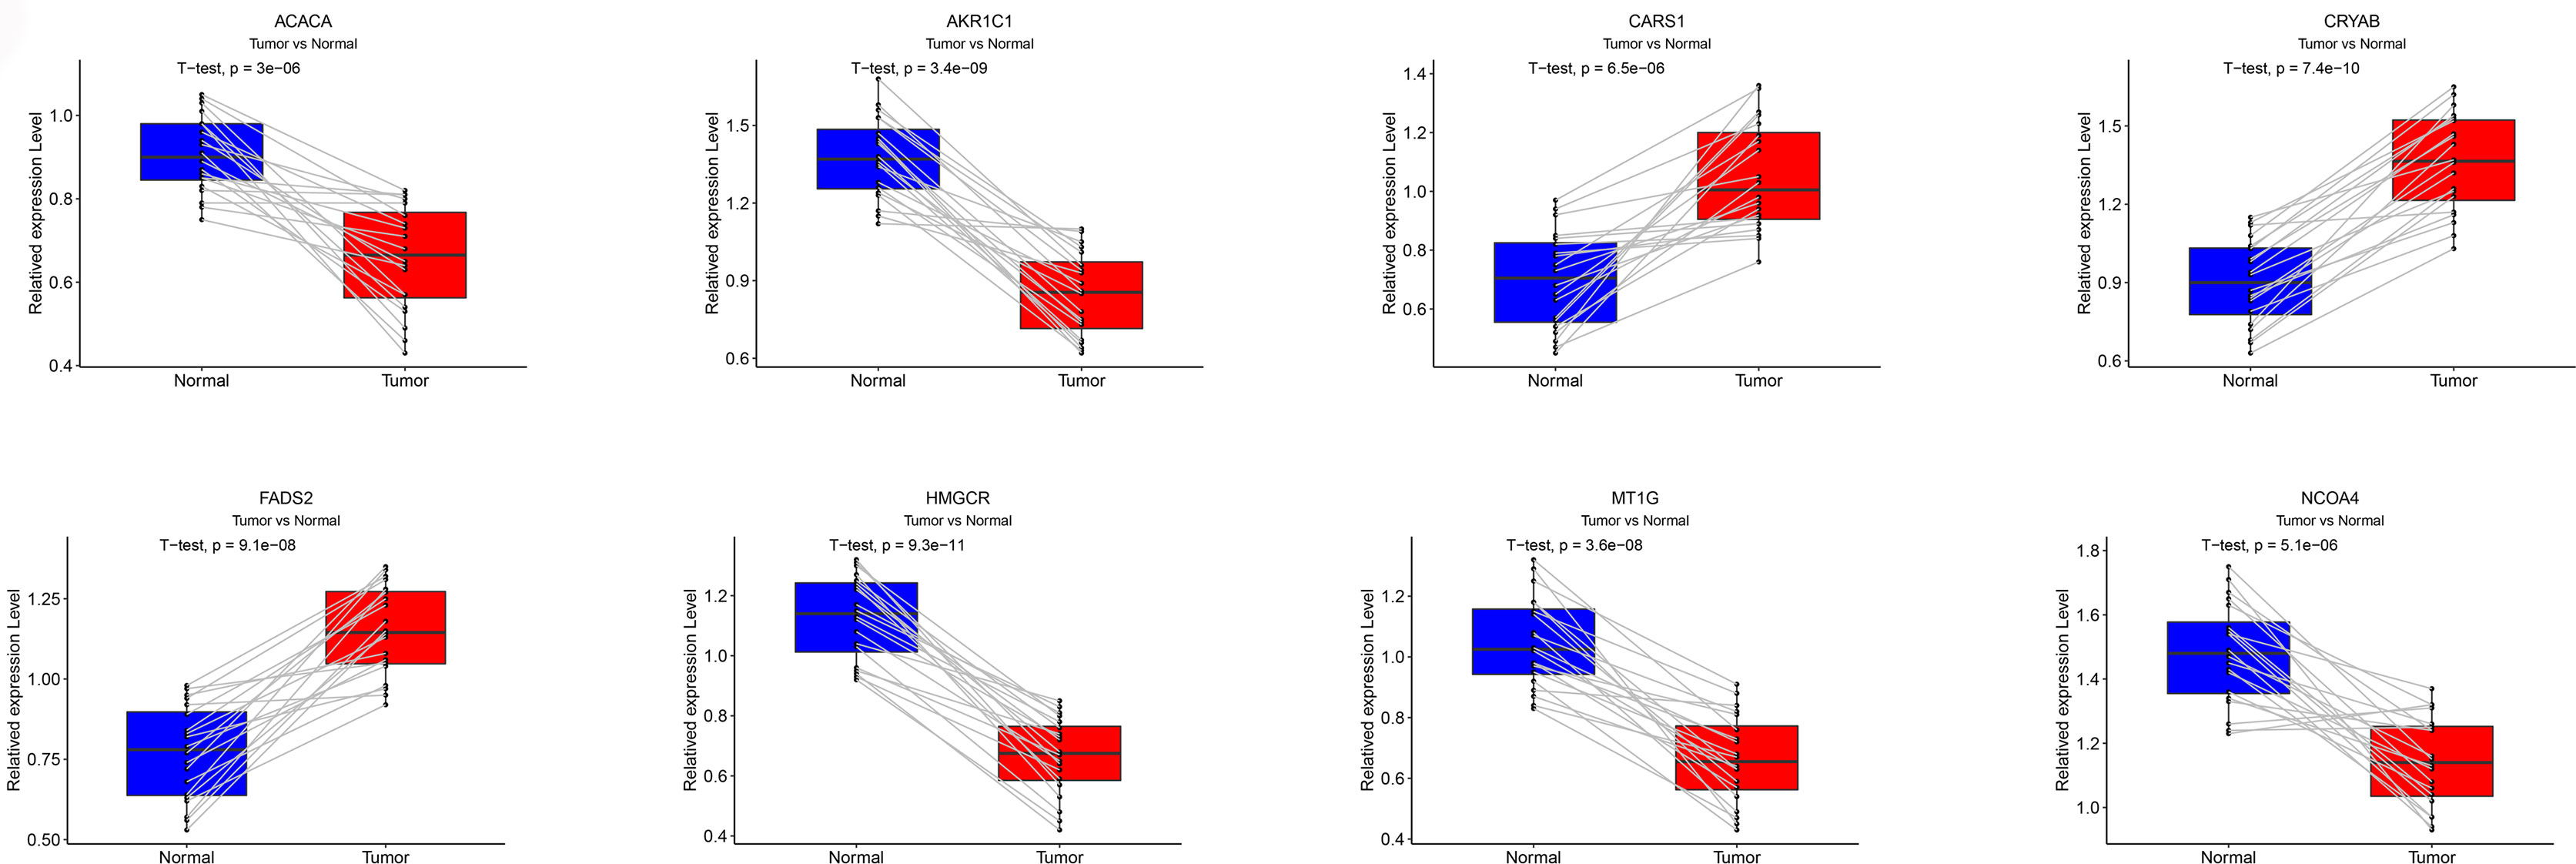
Figure 13 Validation of qRT-PCR. The mRNA expression levels for each FRG in the signature was verified by qRT-PCR.
With the increase in the novel treatment options for ccRCC, promising biomarkers for monitoring the ccRCC prognosis are urgently needed (22). Disorders of FRGs have been reported in numerous malignant tumors, suggesting a vital role of FRGs in tumor progression (23, 24). The abnormal FRGs are reported to be involved in the initiation and progression of ccRCC (12, 25). However, the comprehensive understanding of FRGs and ccRCC prognosis remains largely unknown.
The results of the present study established a novel ferroptosis-related prognostic gene signature for ccRCC patients. We systemically explored the prognosis and function of significant FRGs and identified 26 PDEFRGs in ccRCC. Further, we constructed the signature of eight FRGs. This signature contributed to a better prediction of ccRCC prognosis and provided potential therapeutic targets for ccRCC.
AKR1C1, CARS1, HMGCR, CRYAB, MT1G, NCOA4, ACACA and FADS2 are the FGRs included in the eight-FRG signature. AKR1C1 plays a key role in the regulation of autophagy and oxidative stress in the non-small cell lung cancer (26). Down regulation of ACACA expression is associated with the inhibition of malignant progression of prostate cancer (27). Nie et al. constructed a novel prognostic signature involving CARS1, which effectively predicted the prognosis of colon cancer (28). CRYAB has been reported to be a potential therapeutic target for nasopharyngeal carcinoma (29). The inhibition of HMGCR stabilizes the glycolytic enzyme PKM2 and promotes the growth of RCC (30). MT1G is reported to be hypermethylated in RCC (31). Low expression of NCOA4 is associated with ccRCC progression, and poor prognosis and immune infiltration in ccRCC patients (12). Wu et al. developed an 11 metabolic gene signature-based prognostic model in ccRCC (32). Interestingly, FADS2, which is incorporated in our model, was also incorporated in their model. But, only HMGCR and NCOA4 were explored in RCC, whereas the other six FRGs were not investigated. Herein, we examined the expression of eight FRGs using qRT-PCR in paired ccRCC and adjacent non-tumorous tissues.
Recently, lines of evidence have demonstrated that the immune infiltration participates in the progression of ccRCC. For instance, Chakiryan et al. found that common somatic mutations in ccRCC may correlate with immune infiltration (33). Bai et al. also found that various types of immune cells and the immune functions are correlated with ccRCC progression (34). It is known that ferroptosis could trigger dendritic cell maturation to exert their anti-tumor immune effects (35). T-cells play an important role in the tumor topology and efficacy of various therapeutic strategies for ccRCC (36). In addition, ccRCC with high expression of C4-activating enzyme C1s, may involve the infiltration of macrophages and T cells (37). Therefore, whether the risk score of our prognosis model is associated with immune cell infiltration was explored. Interestingly, with the increase in risk score, the levels of immune cells (CD4_T cell, CD8_T cell, neutrophils, macrophages and dendritic cells) were also increased. Our data suggest that the signature of eight FRGs is associated with immune cell infiltration.
Recently, the prognosis prediction potential of FRGs has been explored in many human cancers. For example, Zhu et al. demonstrated the utility of a 4-FRGs model in predicting the prognosis of esophageal adenocarcinoma (38). Zheng et al. developed a 12-FRGs model to better predict the prognosis of patients with lower-grade gliomas (39). Jiang and his colleagues constructed an eight-gene ferroptosis-related prognostic model to predict the prognosis of gastric cancer patients (40). Our study has many advantages. Firstly, a novel 8-FRG prognostic risk signature for ccRCC was constructed, which contributes to the ccRCC prognosis prediction. Secondly, clinical features are integrated into the 8-FRG model to construct a nomogram, which improves the prognosis prediction ability in ccRCC. Finally, this signature is significantly correlated with immune cell infiltration. More clinical databases should be used to verify the accuracy of this 8-FRG prognostic risk signature in the future studies.
In conclusion, we disclose a novel 8-FRG prognostic risk signature for ccRCC, contributing to the prognosis prediction of ccRCC patients.
Publicly available datasets were analyzed in this study. This data can be found here: https://portal.gdc.cancer.gov/ and http://cistrome.org/.
The studies involving human participants were reviewed and approved by the Human Research Ethics Committee in The First Affiliated Hospital of Wenzhou Medical University. The patients/participants provided their written informed consent to participate in this study. Written informed consent was obtained from the individual(s) for the publication of any potentially identifiable images or data included in this article.
JC and YL designed the study and analyzed the data. YZ, RZ, BC and JH revised the images. WZ, YW and YG performed the literature search and collected data for the manuscript. CL and JZ revised the manuscript. All authors contributed to the article and approved the submitted version.
The project was supported by the National Natural Science Foundation of China (No. 81873576), the Medical Health Science and Technology Project of Zhejiang Provincial Health Commission (No. 2020RC081) and the project of Wenzhou Medical University Basic Scientific Research (No. KYYW201904).
The authors declare that the research was conducted in the absence of any commercial or financial relationships that could be construed as a potential conflict of interest.
The Supplementary Material for this article can be found online at: https://www.frontiersin.org/articles/10.3389/fonc.2021.700084/full#supplementary-material
RCC, renal cell carcinoma; ccRCC, clear cell renal cell carcinoma; TCGA, The Cancer Genome Atlas; FRGs, ferroptosis-related genes; Lasso, Least absolute shrinkage and selection operator; DEFRGs, differentially expressed ferroptosis-related genes; PDEFRGs, prognostic differentially expressed ferroptosis-related genes; TFs, transcription factors; FDR, false-discovery rate; OS, overall survival; AUC, area under the curve; ROC, receiver operating characteristic; ssGSEA, Single-sample gene set enrichment analysis; PCA, Principal component analysis; Tfh, T follicular helper cell; TIL, Tumor Infiltrating Lymphocyte; aDC, Activated dendritic cell; iDC, Immature dendritic cell; PPI, protein–protein interaction; CSS, cancer specific survival; qRT-PCR, Quantitative Real-time PCR.
1. Capitanio U, Montorsi FJL. Renal Cancer. Lancet (2016) 387(10021):894–906. doi: 10.1016/s0140-6736(15)00046-x
2. Motzer R, Jonasch E, Agarwal N, Bhayani S, Bro WP, Chang SS, et al. Kidney Cancer, Version 2.2017, Nccn. Clin Pract Guidelines Oncol (2017) 15(6):804–34. doi: 10.6004/jnccn.2017.0100
3. Motzer R, Bander N, Nanus DM. Renal-cell carcinoma. N Engl J Med (1996) 335(12):865–75. doi: 10.1056/nejm199609193351207
4. Miller K, Nogueira L, Mariotto A, Rowland JH, Yabroff KR, Alfano CM, et al. Cancer Treatment and Survivorship Statistics, 2019. CA Cancer J Clin (2019) 69(5):363–85. doi: 10.3322/caac.21565
5. Haas N, Manola J, Dutcher J, Flaherty KT, Uzzo RG, Atkins MB, et al. Adjuvant Treatment for High-Risk Clear Cell Renal Cancer: Updated Results of a High-Risk Subset of the ASSURE Randomized Trial. JAMA Oncol (2017) 3(9):1249–52. doi: 10.1001/jamaoncol.2017.0076
6. Yu H, Guo P, Xie X, Wang Y, Chen G. Medicine M. Ferroptosis, a New Form of Cell Death, and its Relationships With Tumourous Diseases. Medicine (2017) 21(4):648–57. doi: 10.1111/jcmm.13008
7. Hassannia B, Vandenabeele P, Vanden Berghe T. Targeting Ferroptosis to Iron Out Cancer. Cancer Cell (2019) 35(6):830–49. doi: 10.1016/j.ccell.2019.04.002
8. Liang C, Zhang X, Yang M, Dong X. Recent Progress in Ferroptosis Inducers for Cancer Therapy. Adv Mater (2019) 31(51):e1904197. doi: 10.1002/adma.201904197
9. Tang Y, Li C, Zhang Y, Wu Z. Ferroptosis-Related Long non-Coding RNA Signature Predicts the Prognosis of Head and Neck Squamous Cell Carcinoma. Int J Biol Sci (2021) 17(3):702–11. doi: 10.7150/ijbs.55552
10. Wu G, Wang Q, Xu Y, Li Q, Cheng L. A New Survival Model Based on Ferroptosis-Related Genes for Prognostic Prediction in Clear Cell Renal Cell Carcinoma. Aging (Albany NY) (2020) 12(14):14933–48. doi: 10.18632/aging.103553
11. Homma T, Kobayashi S, Fujii J. Cysteine Preservation Confers Resistance to Glutathione-Depleted Cells Against Ferroptosis Via CDGSH Iron Sulphur Domain-Containing Proteins (Cisds). Free Radic Res (2020) 54(6):397–407. doi: 10.1080/10715762.2020.1780229
12. Mou Y, Wu J, Zhang Y, Abdihamid O, Duan C, Li B. Low Expression of Ferritinophagy-Related NCOA4 Gene in Relation to Unfavorable Outcome and Defective Immune Cells Infiltration in Clear Cell Renal Carcinoma. BMC Cancer (2021) 21(1):18. doi: 10.1186/s12885-020-07726-z
13. Sun X, Niu X, Chen R, He W, Chen D, Kang R, et al. Metallothionein-1G Facilitates Sorafenib Resistance Through Inhibition of Ferroptosis. Hepatology (2016) 64(2):488–500. doi: 10.1002/hep.28574
14. Bhattacharya S, Andorf S, Gomes L, Dunn P, Schaefer H, Pontius J, et al. ImmPort: Disseminating Data to the Public for the Future of Immunology. Immunol Res (2014) 58:234–9. doi: 10.1007/s12026-014-8516-1
15. Reiner-Benaim A. FDR Control by the BH Procedure for Two-Sided Correlated Tests With Implications to Gene Expression Data Analysis. Biom J (2007) 49(1):107–26. doi: 10.1002/bimj.200510313
16. Szklarczyk D, Franceschini A, Kuhn M, Simonovic M, Roth A, Minguez P, et al. The STRING Database in 2011: Functional Interaction Networks of Proteins, Globally Integrated and Scored. Nucleic Acids Res (2011) 39:D561–8. doi: 10.1093/nar/gkq973
17. Tibshirani R. The Lasso Method for Variable Selection in the Cox Model. Stat Med (1997) 16(4):385–95. doi: 10.1002/(sici)1097-0258(19970228)16:4<385::aid-sim380>3.0.co;2-3
18. Simon N, Friedman J, Hastie T, Tibshirani R. Regularization Paths for Cox’s Proportional Hazards Model Via Coordinate Descent. J Stat Softw (2011) 39(5):1–13. doi: 10.18637/jss.v039.i05
19. Cho S, Pak K, Jeong D, Han M, Oh S, Kim Y. The AP2M1 Gene Expression is a Promising Biomarker for Predicting Survival of Patients With Hepatocellular Carcinoma. J Cell Biochem (2019) 120(3):4140–6. doi: 10.1002/jcb.27699
20. Han ME, Kim JY, Kim GH, Park SY, Kim YH, Oh SO. SAC3D1: A Novel Prognostic Marker in Hepatocellular Carcinoma. Sci Rep (2018) 8(1):15608. doi: 10.1038/s41598-018-34129-9
21. Rooney MS, Shukla SA, Wu CJ, Getz G, Hacohen N. Molecular and Genetic Properties of Tumors Associated With Local Immune Cytolytic Activity. Cell (2015) 160:48–61. doi: 10.1016/j.cell.2014.12.033
22. Koh M, Sayegh N, Agarwal N. Seeing the Forest for the Trees-Single-Cell Atlases Link CD8 T Cells and Macrophages to Disease Progression and Treatment Response in Kidney Cancer. Cancer Cell (2021) 39(5):594–6. doi: 10.1016/j.ccell.2021.03.008
23. Zhang J, Xi J, Huang P, Zeng S. Comprehensive Analysis Identifies Potential Ferroptosis-Associated Mrna Therapeutic Targets in Ovarian Cancer. Front Med (Lausanne) (2021) 8:644053. doi: 10.3389/fmed.2021.644053
24. Liu X, Guo X, Li H, Chen J, Han H. Effects of KAI Gene Expression on Ferroptosis in Pancreatic Cancer Cells. Mol Med Rep (2021) 23(2):1. doi: 10.3892/mmr.2020.11802
25. Wang J, Yin X, He W, Xue W, Zhang J, Huang Y. SUV39H1 Deficiency Suppresses Clear Cell Renal Cell Carcinoma Growth by Inducing Ferroptosis. Acta Pharm Sin B (2021) 11(2):406–19. doi: 10.1016/j.apsb.2020.09.015
26. Chang L, Li Y, Zhao C, Zeng CM, Ge FJ, Du JM, et al. AKR1C1 Connects Autophagy and Oxidative Stress by Interacting With SQSTM1 in a Catalytic-Independent Manner. Acta Pharmacol Sin (2021). doi: 10.1038/s41401-021-00673-w
27. Zhang H, Liu S, Cai Z, Dong W, Ye J, Cai Z, et al. Down-Regulation of ACACA Suppresses the Malignant Progression of Prostate Cancer Through Inhibiting Mitochondrial Potential. J Cancer (2021) 12(1):232–43. doi: 10.7150/jca.49560
28. Nie J, Shan D, Li S, Zhang S, Zi X, Xing F, et al. A Novel Ferroptosis Related Gene Signature for Prognosis Prediction in Patients With Colon Cancer. Front Oncol (2021) 11:654076. doi: 10.3389/fonc.2021.654076
29. Wu A, Zhang L, Zhang L, Li L, Liu Q. Limb-Bud and Heart (LBH) Inhibits Cellular Migration, Invasion and Epithelial-Mesenchymal Transition in Nasopharyngeal Carcinoma Via Downregulating αb-Crystallin Expression. Cell Signal (2021) 85:110045:. doi: 10.1016/j.cellsig.2021.110045
30. Huang J, Zhao X, Li X, Peng J, Yang W, Mi S. HMGCR Inhibition Stabilizes the Glycolytic Enzyme PKM2 to Support the Growth of Renal Cell Carcinoma. PLoS Biol (2021) 19(4):e3001197. doi: 10.1371/journal.pbio.3001197
31. Dalgin G, Drever M, Williams T, King T, DeLisi C, Liou L. Identification of Novel Epigenetic Markers for Clear Cell Renal Cell Carcinoma. J Urol (2008) 180(3):1126–30. doi: 10.1016/j.juro.2008.04.137
32. Wu Y, Wei X, Feng H, Hu B, Liu B, Luan Y, et al. An Eleven Metabolic Gene Signature-Based Prognostic Model for Clear Cell Renal Cell Carcinoma. Aging (Albany NY) (2020) 12(22):23165–86. doi: 10.18632/aging.104088
33. Chakiryan NH, Hajiran A, Kim Y, Aydin AM, Zemp L, Katende E, et al. Correlating Immune Cell Infiltration Patterns With Recurrent Somatic Mutations in Advanced Clear Cell Renal Cell Carcinoma. Eur Urol Focus (2021). doi: 10.1016/j.euf.2021.04.014
34. Bai D, Feng H, Yang J, Yin A, Qian A, Sugiyama H. The Landscape of Immune Cell Infiltration in Clear Cell Renal Cell Carcinoma to Aid Immunotherapy. Cancer Sci (2021) 112(6):2126–39. doi: 10.1111/cas.14887
35. Tang D, Kepp O, Kroemer GJO. Ferroptosis Becomes Immunogenic: Implications for Anticancer Treatments. Oncoimmunology (2020) 10(1):1862949. doi: 10.1080/2162402x.2020.1862949
36. Krishna C, DiNatale R, Kuo F, Srivastava RM, Vuong L, Chowell D, et al. Single-Cell Sequencing Links Multiregional Immune Landscapes and Tissue-Resident T Cells in ccRCC to Tumor Topology and Therapy Efficacy. Cancer Cell (2021) 39(5):662–77.e6. doi: 10.1016/j.ccell.2021.03.007
37. Daugan MV, Revel M, Russick J, Dragon-Durey MA, Gaboriaud C, Robe-Rybkine T, et al. Complement C1s and C4d as Prognostic Biomarkers in Renal Cancer: Emergence of Non-Canonical Functions of C1s. Cancer Immunol Res (2021). doi: 10.1158/2326-6066.CIR-20-0532
38. Zhu L, Yang F, Wang L, Dong L, Huang Z, Wang G, et al. Identification the Ferroptosis-Related Gene Signature in Patients With Esophageal Adenocarcinoma. Cancer Cell Int (2021) 21(1):124. doi: 10.1186/s12935-021-01821-2
39. Zheng Y, Ji Q, Xie L, Wang C, Yu CN, Wang YL, et al. Ferroptosis-Related Gene Signature as a Prognostic Marker for Lower-Grade Gliomas. J Cell Mol Med (2021) 25(6):3080–90 doi: 10.1111/jcmm.16368
Keywords: TCGA database, ferroptosis, ccRCC, prognosis signature, immune infiltration
Citation: Chen J, Zhan Y, Zhang R, Chen B, Huang J, Li C, Zhang W, Wang Y, Gao Y, Zheng J and Li Y (2021) A New Prognostic Risk Signature of Eight Ferroptosis-Related Genes in the Clear Cell Renal Cell Carcinoma. Front. Oncol. 11:700084. doi: 10.3389/fonc.2021.700084
Received: 25 April 2021; Accepted: 10 June 2021;
Published: 25 June 2021.
Edited by:
Daniela Terracciano, University of Naples Federico II, ItalyReviewed by:
Matteo Manfredi, University of Turin, ItalyCopyright © 2021 Chen, Zhan, Zhang, Chen, Huang, Li, Zhang, Wang, Gao, Zheng and Li. This is an open-access article distributed under the terms of the Creative Commons Attribution License (CC BY). The use, distribution or reproduction in other forums is permitted, provided the original author(s) and the copyright owner(s) are credited and that the original publication in this journal is cited, in accordance with accepted academic practice. No use, distribution or reproduction is permitted which does not comply with these terms.
*Correspondence: Jianjian Zheng, MTIwMzc4MTk2QHFxLmNvbQ==; Yeping Li, bGl5cHd6QDEyNi5jb20=
†These authors have contributed equally to this work
Disclaimer: All claims expressed in this article are solely those of the authors and do not necessarily represent those of their affiliated organizations, or those of the publisher, the editors and the reviewers. Any product that may be evaluated in this article or claim that may be made by its manufacturer is not guaranteed or endorsed by the publisher.
Research integrity at Frontiers
Learn more about the work of our research integrity team to safeguard the quality of each article we publish.