 Jiahao Gao
 Fang Han
 Xiaoshuang Wang
 Shaofeng Duan
 Jiawen Zhang
- 1Department of Radiology, Huashan Hospital North, Fudan University, Shanghai, China
- 2Department of Radiology, Huashan Hospital, Fudan University, Shanghai, China
- 3Department of Life Sciences, GE Healthcare, Shanghai, China
Purpose: This study aimed to develop and verify a multi-phase (MP) computed tomography (CT)-based radiomics nomogram to differentiate pancreatic serous cystic neoplasms (SCNs) from mucinous cystic neoplasms (MCNs), and to compare the diagnostic efficacy of radiomics models for different phases of CT scans.
Materials and Methods: A total of 170 patients who underwent surgical resection between January 2011 and December 2018, with pathologically confirmed pancreatic cystic neoplasms (SCN=115, MCN=55) were included in this single-center retrospective study. Radiomics features were extracted from plain scan (PS), arterial phase (AP), and venous phase (VP) CT scans. Algorithms were performed to identify the optimal features to build a radiomics signature (Radscore) for each phase. All features from these three phases were analyzed to develop the MP-Radscore. A combined model comprised the MP-Radscore and imaging features from which a nomogram was developed. The accuracy of the nomogram was evaluated using receiver operating characteristic (ROC) curves, calibration tests, and decision curve analysis.
Results: For each scan phase, 1218 features were extracted, and the optimal ones were selected to construct the PS-Radscore (11 features), AP-Radscore (11 features), and VP-Radscore (12 features). The MP-Radscore (14 features) achieved better performance based on ROC curve analysis than any single phase did [area under the curve (AUC), training cohort: MP-Radscore 0.89, PS-Radscore 0.78, AP-Radscore 0.83, VP-Radscore 0.85; validation cohort: MP-Radscore 0.88, PS-Radscore 0.77, AP-Radscore 0.83, VP-Radscore 0.84]. The combination nomogram performance was excellent, surpassing those of all other nomograms in both the training cohort (AUC, 0.91) and validation cohort (AUC, 0.90). The nomogram also performed well in the calibration and decision curve analyses.
Conclusions: Radiomics for arterial and venous single-phase models outperformed the plain scan model. The combination nomogram that incorporated the MP-Radscore, tumor location, and cystic number had the best discriminatory performance and showed excellent accuracy for differentiating SCN from MCN.
Introduction
Pancreatic cystic neoplasms (PCNs) have been increasingly diagnosed in recent years as a direct result of the extensive use of abdominal cross-sectional imaging. The prevalence of incidentally discovered PCNs in the general population has been reported to range from 2.6 to 19.6% (1, 2). Considerable attention has been focused on serous cystic neoplasms (SCNs) and mucinous cystic neoplasms (MCNs) because of the significant difference in the probability of malignant transformation between the two (3). SCNs have an extremely low incidence of malignancy (4). The current management strategy for SCN is conservative, based on regular surveillance with rare interventions performed only because of symptoms (5, 6). MCNs are diagnosed almost exclusively in middle-aged women, but with a very definite potential for malignant transformation (7–9). In contrast to SCN, surgical resection has been advocated for many, if not most, MCN patients. Recognizing the marked difference in the risk of malignancy and the consequent nearly opposite clinical management strategies between these cystic neoplasms, it is vital to correctly discriminate between the two.
Currently, even the high-quality imaging modalities such as computed tomography (CT) and ultrasound do not provide adequate discrimination between SCN and MCN (10, 11). Clearly, radiological imaging approaches, especially multi-detector computed tomography (MDCT), play a pivotal role in the preoperative diagnosis of PCNs. It has been reported that the discrimination efficacy of CT for SCNs was ranged from 27 to 91% (12, 13). Compared with CT, MRI/magnetic resonance cholangiopancreatography (MRCP) could further improve the diagnostic accuracy of PCNs, with an accuracy of 40–95% (14, 15) providing a better view of the pancreatic duct system and allowing to detect the presence of a solid component or mural nodule. Endoscopic ultrasound with fine-needle aspiration (EUS-FNA) has become a promising tool for classifying specific subtypes of PCNs. Adding EUS-FNA to CT and MRI has improved the diagnostic accuracy by 36% and 54%, respectively (16). Balanced against these potential benefits is the invasive nature of EUS and the variable risk of FNA-associated complications (17). These limitations and the significant cost curtail their application for the routine evaluation of PCNs (18).
Radiomics is an emerging and rapidly developing method for advanced image analysis. Relative to PCNs, radiomics has been successfully applied to the entire spectrum of the disease process, including differential diagnosis, malignant assessment, and prognosis prediction (19–21). Most radiomics studies utilizing MDCT pancreatic scans have been limited to the venous phase (VP) for feature extraction. Clearly, the different phases reflect unique vascular enhancement and texture information. Logically, a radiomics model constructed from a plain scan (PS) or arterial phase (AP) scan would augment diagnostic efficiency. To the best of our knowledge, no prior studies have reported feature extraction of all three phases of contrast-enhanced CT to discriminate PCN subtypes.
Our aim was to compare the predictive efficacy of each single-phase radiomics model, and then to construct a combination nomogram, incorporating a multi-phase (MP) radiomics model with clinical imaging factors that would noninvasively and accurately discriminate SCNs from MCNs.
Materials and Methods
Patient Population
The Institutional Review Board of Huashan Hospital of Fudan University approved this retrospective study, and the requirement for informed consent was waived. Patients who were diagnosed with SCNs or MCNs for whom surgical resection was performed in our hospital between January 2011 and December were enrolled in this study. The inclusion criteria were: (1) SCNs or MCNs with surgical pathologic confirmation; (2) contrast-enhanced CT scans (slice thickness: 1.5 mm) performed within one month prior to pancreatic surgery. The exclusion criteria were: (1) CT images with serious artifacts and (2) patients whose radiomics features could not be successfully extracted from the CT images. The details of patient enrollment are shown in Figure S1 in Supplementary Materials. The final study group comprised 115 patients with SCNs and 55 with MCNs. Patients were randomly grouped in a ratio of 7:3, with 120 and 50 patients in the training and validation cohorts, respectively.
Patient demographic and clinical information was collected from the hospital medical record system. Demographic information (age and sex) and eight imaging factors known to be valuable in distinguishing SCNs from MCNs from previous studies were selected as the basis for constructing the clinical model (22, 23). Two radiologists with considerable experience in abdominal imaging (13 and 6 years, respectively) evaluated the features in consensus including: (1) lesion size, (2) tumor location (head, neck, body, and tail), (3) cyst number (single or multiple), (4) calcification (absent or present), (5) septation (absent or present), (6) lesion shape (oval or irregular lobulation), (7) wall enhancement (absent or present), and (8) mural nodules (absent or present). Both radiologists were blinded to the correlative pathological details. Among these, the lesion size was outlined and decided unanimously by two doctors simultaneously, while the other features were assessed by each doctor, and the results were derived separately. If the two radiologists did not agree on a specific feature in the same patient, a third expert with 23 years’ experience in abdominal radiology reviewed the features and helped establish the final decision. The inter-reader agreement of imaging factors was also assessed, as shown in Supplementary Materials (Table S1). The framework of the study is shown in Figure 1.
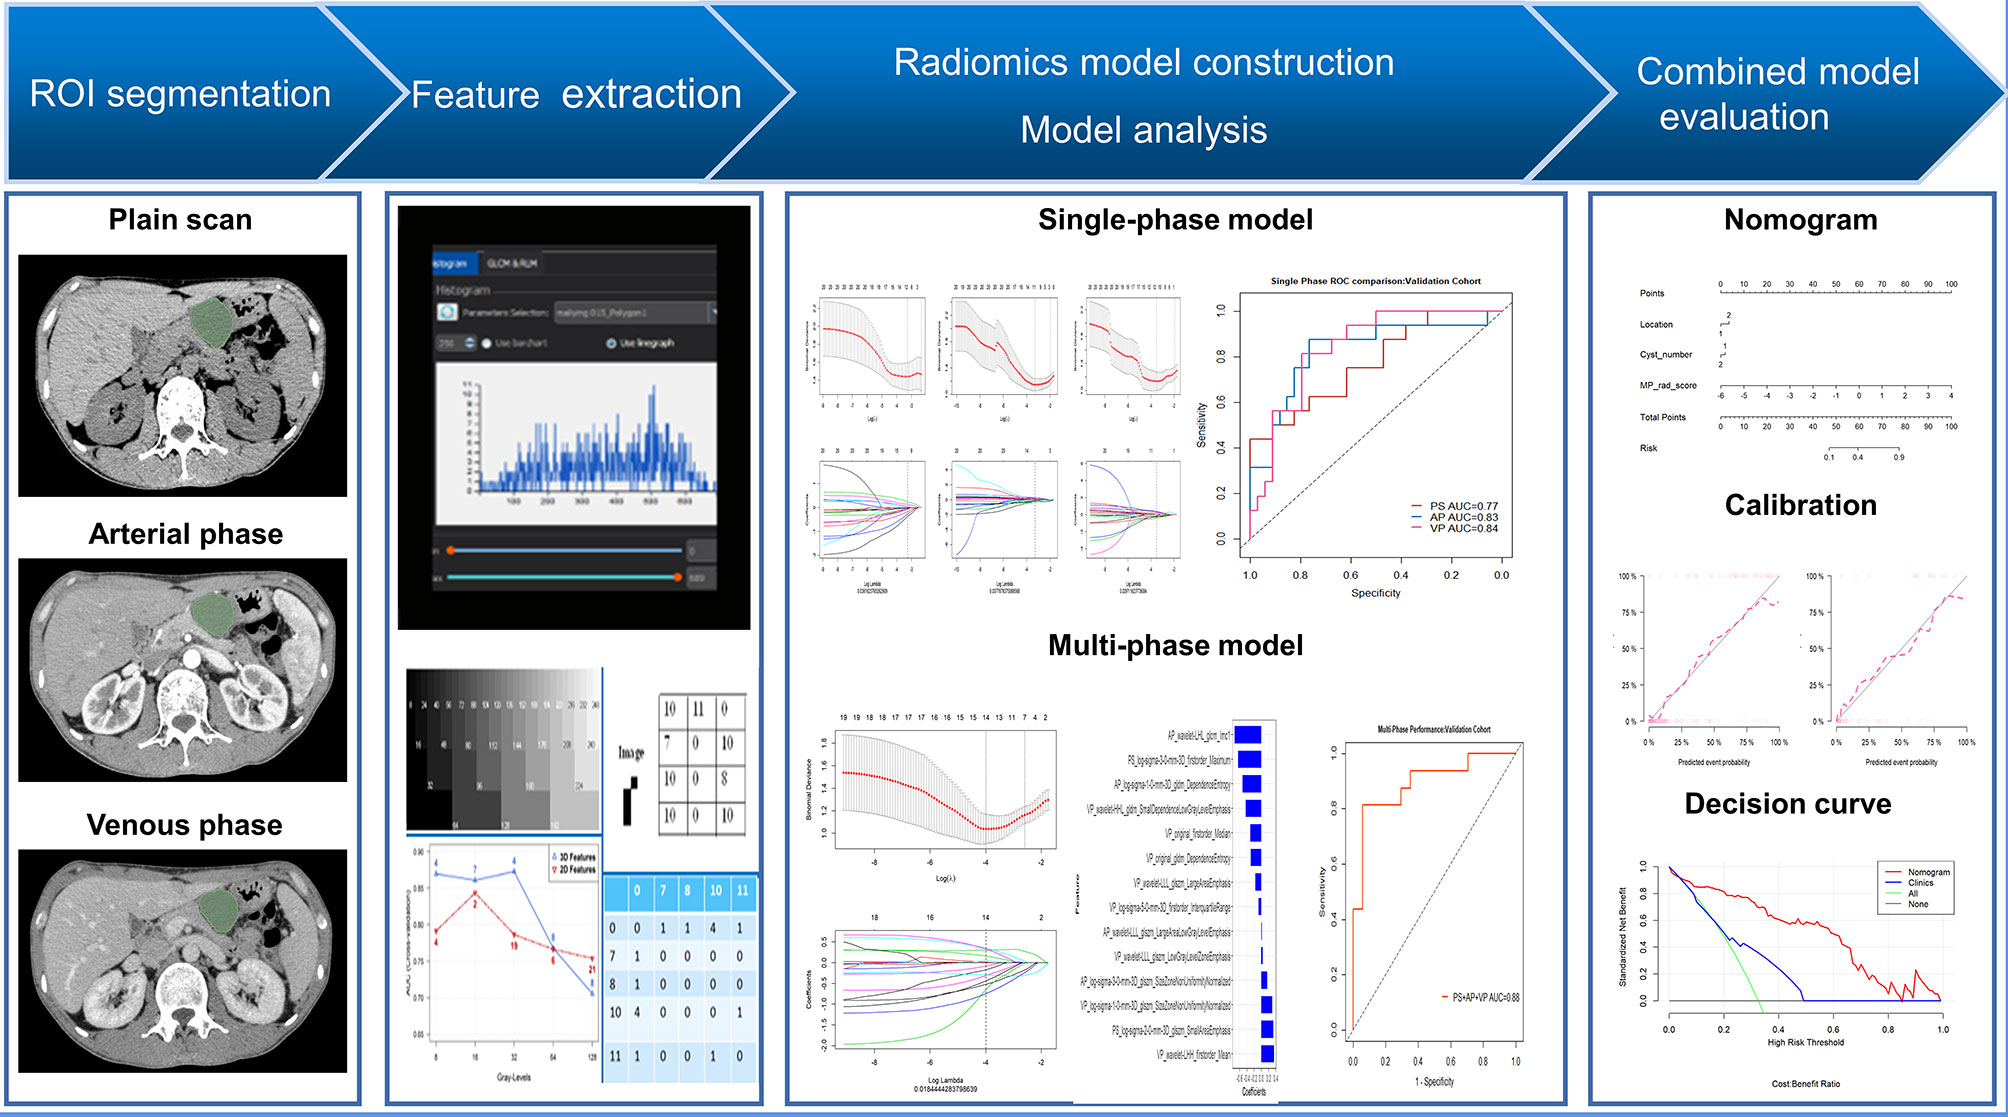
Figure 1 Radiomics workflow.
Image Acquisition
CT examinations of all patients were performed using the same 256-slice CT system (Brilliance iCT, Philips Medical Systems, The Netherlands). All pancreatic CT images were acquired using a standard dual-phase scanning protocol. The CT scan parameters were as follows: 120 kV; 150–200 mAs; rotation time, 0.5-0.75 s; collimation, 128×0.625 mm; matrix, 512×512; and slice thickness, 1.5 mm. An anionic contrast agent (370 mgI/mL, Iopamidol-370, GEhealthcare, Princeton, NJ) was administered at a dose of 1.5 mL/kg, 3.0 mL/s. AP images were obtained 30 s after the injection of contrast agent, and VP images were obtained 45 s after the AP acquisition. All images were downloaded from the hospital archives.
Tumor Segmentation and Single-Phase Radiomics Feature Extraction
PS, AP, and VP CT images in each patient were used for feature extraction. The window width and window level were 300 and 40 HU, respectively. For each phase, one radiologist (13 years’ experience in abdominal imaging) segmented the lesion contour on each slice using open-source software (3D Slicer version 4.11.0; Boston, MA). With the technical support of a radiomics software based on Python (Pyradiomics version 3.0.0; https://github.com/Radiomics/pyradiomics) (24), radiomics features were extracted in three-dimensional volume for each phase. The extracted features were classified into six categories: (1) shape features, (2) first order statistics, (3) gray level co-occurrence matrix features, (4) gray-level run length matrix features, (5) gray-level size zone matrix features, and (6) gray-level dependence matrix features. Details of the features are provided in Supplementary Materials I.
To estimate both intra- and inter-observer reproducibility of extracted features, 60 patients were randomly chosen for a repeat region of interest (ROI) segmentation at 30 days following the initial segmentation, performed by the same radiologist and an additional one (with 6 years’ experience in abdominal imaging). The radiologists were blinded to the associated clinical and pathological information. The intra- and inter-class correlation coefficients (ICCs) were used to evaluate feature reliability (25).
Feature Selection, Single-Phase Radiomics Signature Construction, and Performance Comparison
In the training cohort, a three-step procedure was developed to select the radiomics features extracted in each phase. First, features with both intra- and inter-ICC less than 0.75, were excluded from this process. The mRMR method and the least absolute shrinkage and selection operator (LASSO) algorithm were used to select the most robust and optimal features to construct the single-phase radiomics model. The selected optimal features were then combined with its coefficient in the LASSO regression to construct the radiomics signature: Radscores (including PS-Radscore, AP-Radscore, VP-Radscore). The Mann-Whitney U test was used to evaluate the discrimination capability of the each-phase Radscore. We also used receiver operating characteristic (ROC) curve analysis and area under the curve (AUC) values to compare the performance of the single-phase radiomics signature. The detailed performance of each of the radiomics signatures is shown in Figure 2 and Supplementary Materials II. We also constructed and evaluated the two-phase combined radiomics model (Supplementary Materials III).
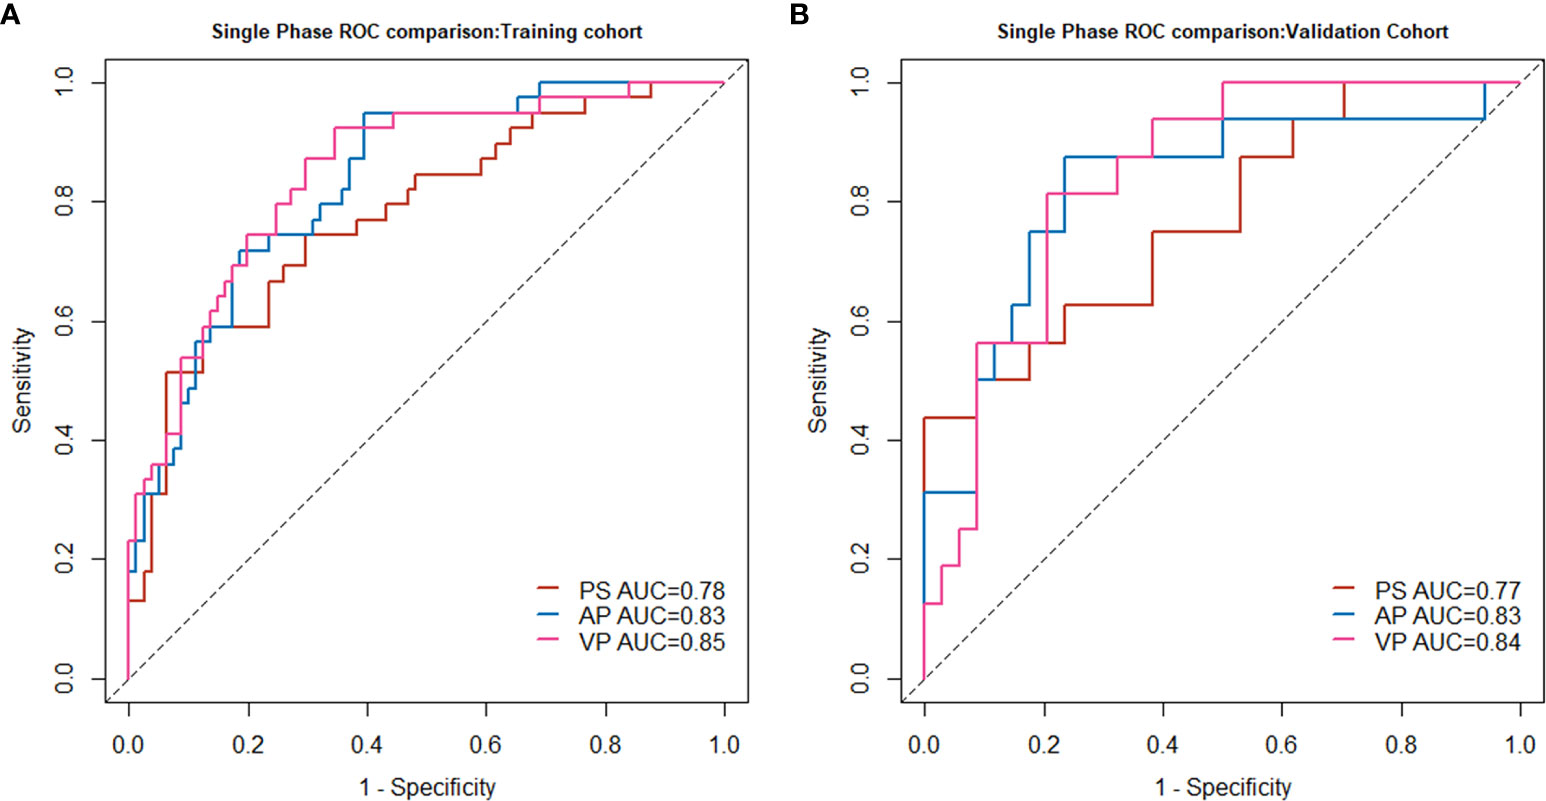
Figure 2 Single-phase radiomics model performance in the training cohort (A) and validation cohort (B).
Combined Model Building and Nomogram Development
A MP radiomics feature set was developed by integrating all 3654 (1218*3) features of the three phases. We then used the same three-step feature extraction method to obtain an MP radiomics signature, MP-Radscore. The discrimination capability of the MP radiomics model was also evaluated using the Mann-Whitney U test and ROC curve analysis. Univariate analysis was conducted to estimate the differences between SCN and MCN patients for each clinical and imaging feature. In the training cohort, variables with P < 0.100, in the univariate regression, were then allocated to a multivariable logistic regression. The clinical model was constructed by incorporating factors with P < 0.100 in the multivariate analysis (26). Finally, a combination multivariate logistic model was constructed using MP-Radscores together with selected clinical imaging factors. Variance inflation factor (VIF) analysis was performed on the combination model to further reduce the probability of overfitting. The nomogram was developed to visualize the optimal model, specifically to score each patient and quantify the degree of disease tendency.
Model Validation and Clinical Use Evaluation
The combination model was first evaluated in the training cohort (n = 120) and subsequently confirmed in the validation cohort (n = 50). ROC curves and AUC values were used to evaluate the discriminatory performance of the combined models. Calibration curves and the Hosmer-Lemeshow test were conducted to estimate the consistency between the predictive results of the combination model and expected probabilities. We also used the Delong test to compare the predictive efficiency between the combination model and the venous radiomics approach to confirm the advances of our combination model.
Decision curve analysis (DCA) was performed to determine the clinical value of the nomogram and calculate the net benefits of the models at different threshold probabilities (27).
Statistical Analysis
Continuous variables are presented as means and standard deviations. Student’s t-test and chi-square test were employed to evaluate the statistical differences in continuous and discrete variables, respectively. In the ROC test, accuracy, sensitivity, and specificity at the cutoff value were calculated to evaluate the efficiency of the radiomics model, clinical model, and the combination model. The inter-reader agreement of imaging factors was assessed using the kappa test, and the simple kappa coefficient was used as an assessment criterion for consistency. A two-tailed P value less than 0.05, was deemed as statistically significant. All statistical analyses were performed using the R software (version 3.6.3). The R packages and the main code used are included in Supplementary Materials V.
Results
Patients Characteristics
Patient characteristics are summarized in Table 1. There were 120 patients (SCN: 81, MCN: 39) in the training cohort and 50 (SCN: 34, MCN: 16) in the validation cohort. No significant differences were found in the clinical and imaging features between the two cohorts.
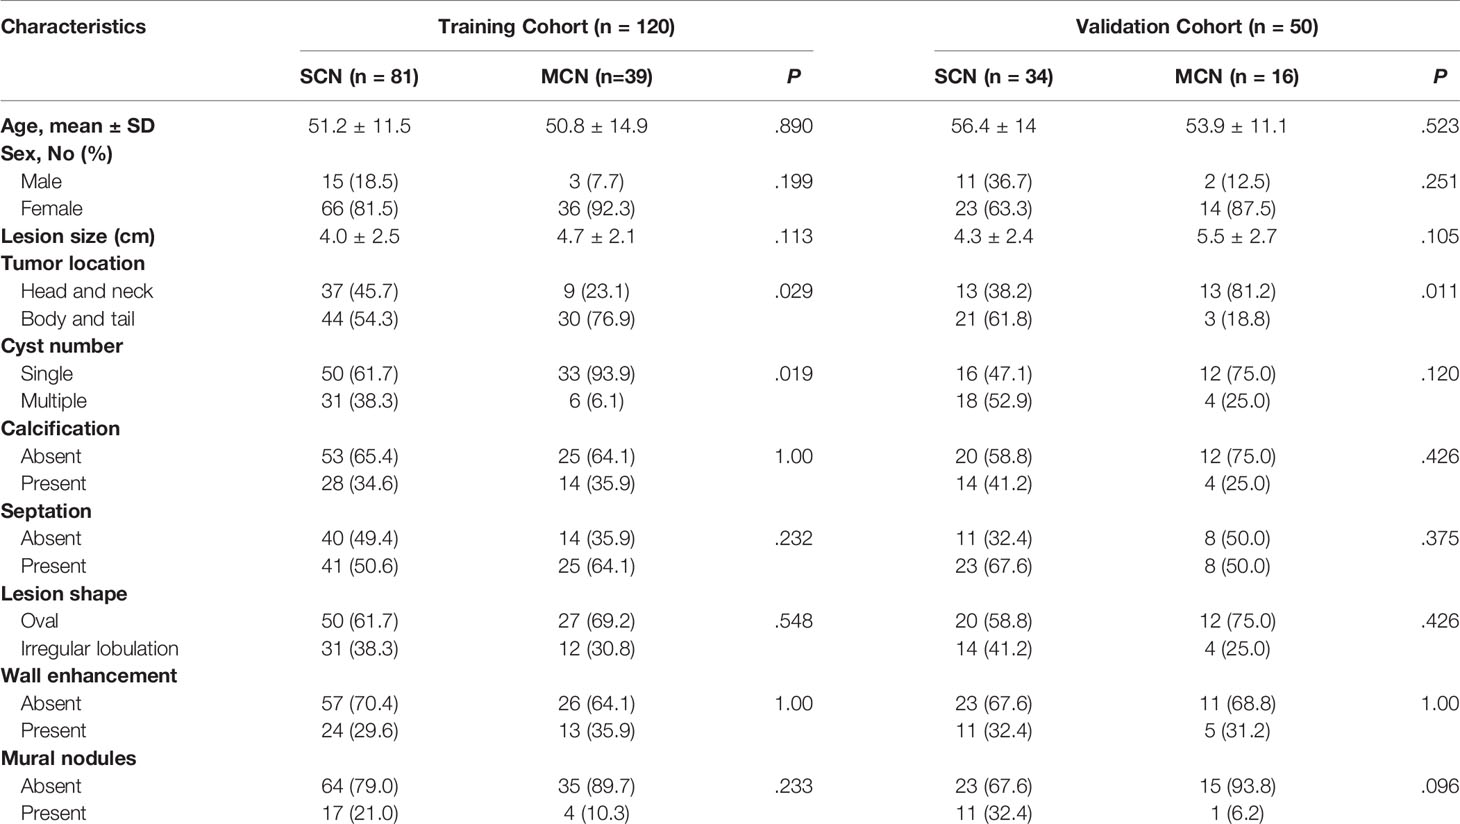
Table 1 Characteristics of Patients in the Training and Validation Cohorts.
Feature Selection, Single-Phase Radiomics Signature Construction, and Performance Comparison
From each phase of contrast-enhanced CT scans, 1218 features were extracted. After ICC assessment applying the minimum criteria for intra- or inter-ICC values, 0.75, 765, 922, and 840 features remained from the PS, AP, and VP CT images, respectively. Of these, 30 features from each phase were retained using the mRMR algorithm for LASSO regression. Finally, 11,11, and 12 radiomics features were selected to construct the radiomics signature for the radiomics model of PS, AP, and VP CT scans, respectively. Features were identified using multivariate logistic regression analysis to construct single-phase radiomics signatures (PS-Radscore, VP-Radscore, and AP-Radscore). The formulas for calculating the Radscores and features selected for the single-phase radiomics model are presented in Supplementary Materials II.
In all three single-phase Radscores, there was a significant difference between SCN and MCN patients in the training cohort (P < 0.010), and importantly, this was confirmed in the independent validation cohort (P < 0.010). The PS, AP, and VP radiomics models yielded AUC values of 0.78, 0.83, and 0.85, respectively, for the training cohort, and 0.77, 0.83, and 0.84, respectively, for the validation cohort. The AUC values in the radiomics model in AP and VP were similar and higher than those in the radiomics model of the plain scan. The performance of the single-phase radiomics model is shown in Figure 2.
Combined Model Building and Nomogram Development
Using the three-step selection process described above for single-phase radiomics model construction, 14 features (including 2 in PS, 4 in AP, and 8 in VP) were similarly selected from the MP radiomics feature set (Figure 3). The MP-Radscore was built to improve the discrimination efficacy of the MP radiomics model. ROC curves showed that the MP radiomics model performed better than the models based on single CT phase (AUC: 0.89 and 0.88 in the training and validation cohorts, respectively). The performance of the MP radiomics model in the Mann-Whitney U test and ROC curves are shown in Figure 4. The detailed calculation formulas of the MP-Radscore and combined nomogram are included in Supplementary Materials IV.
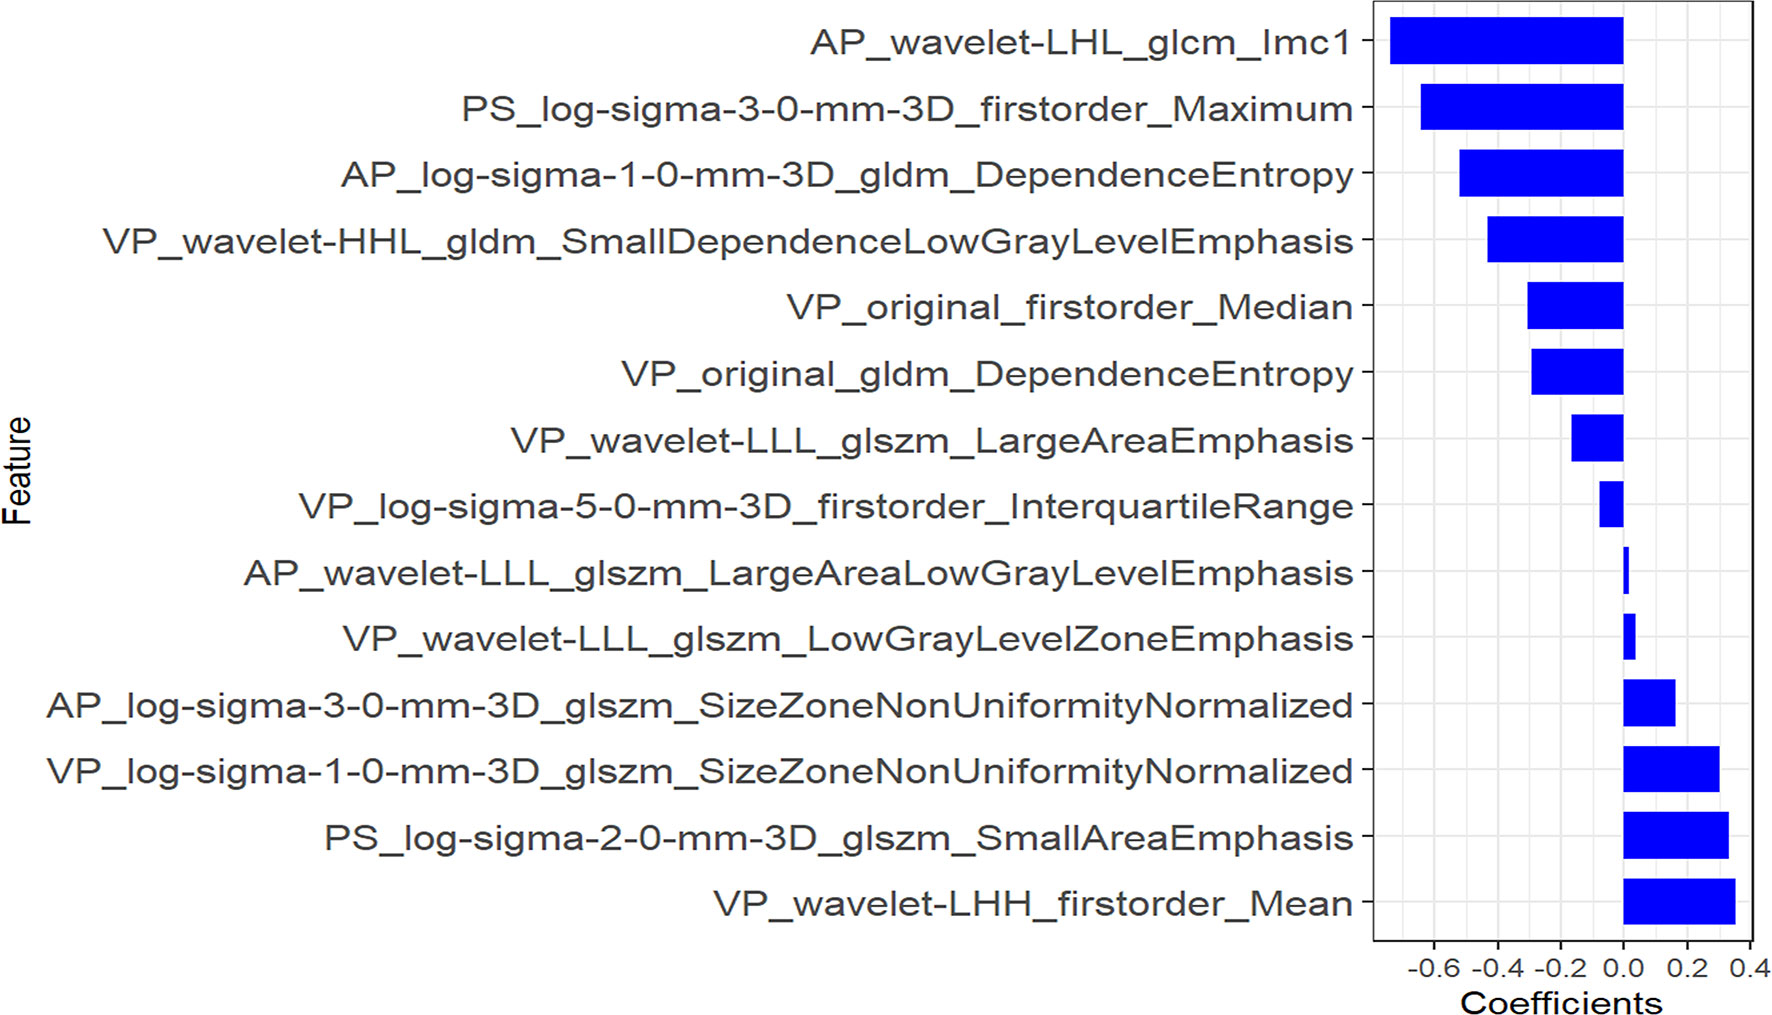
Figure 3 Features selected for multi-phase radiomics model construction.
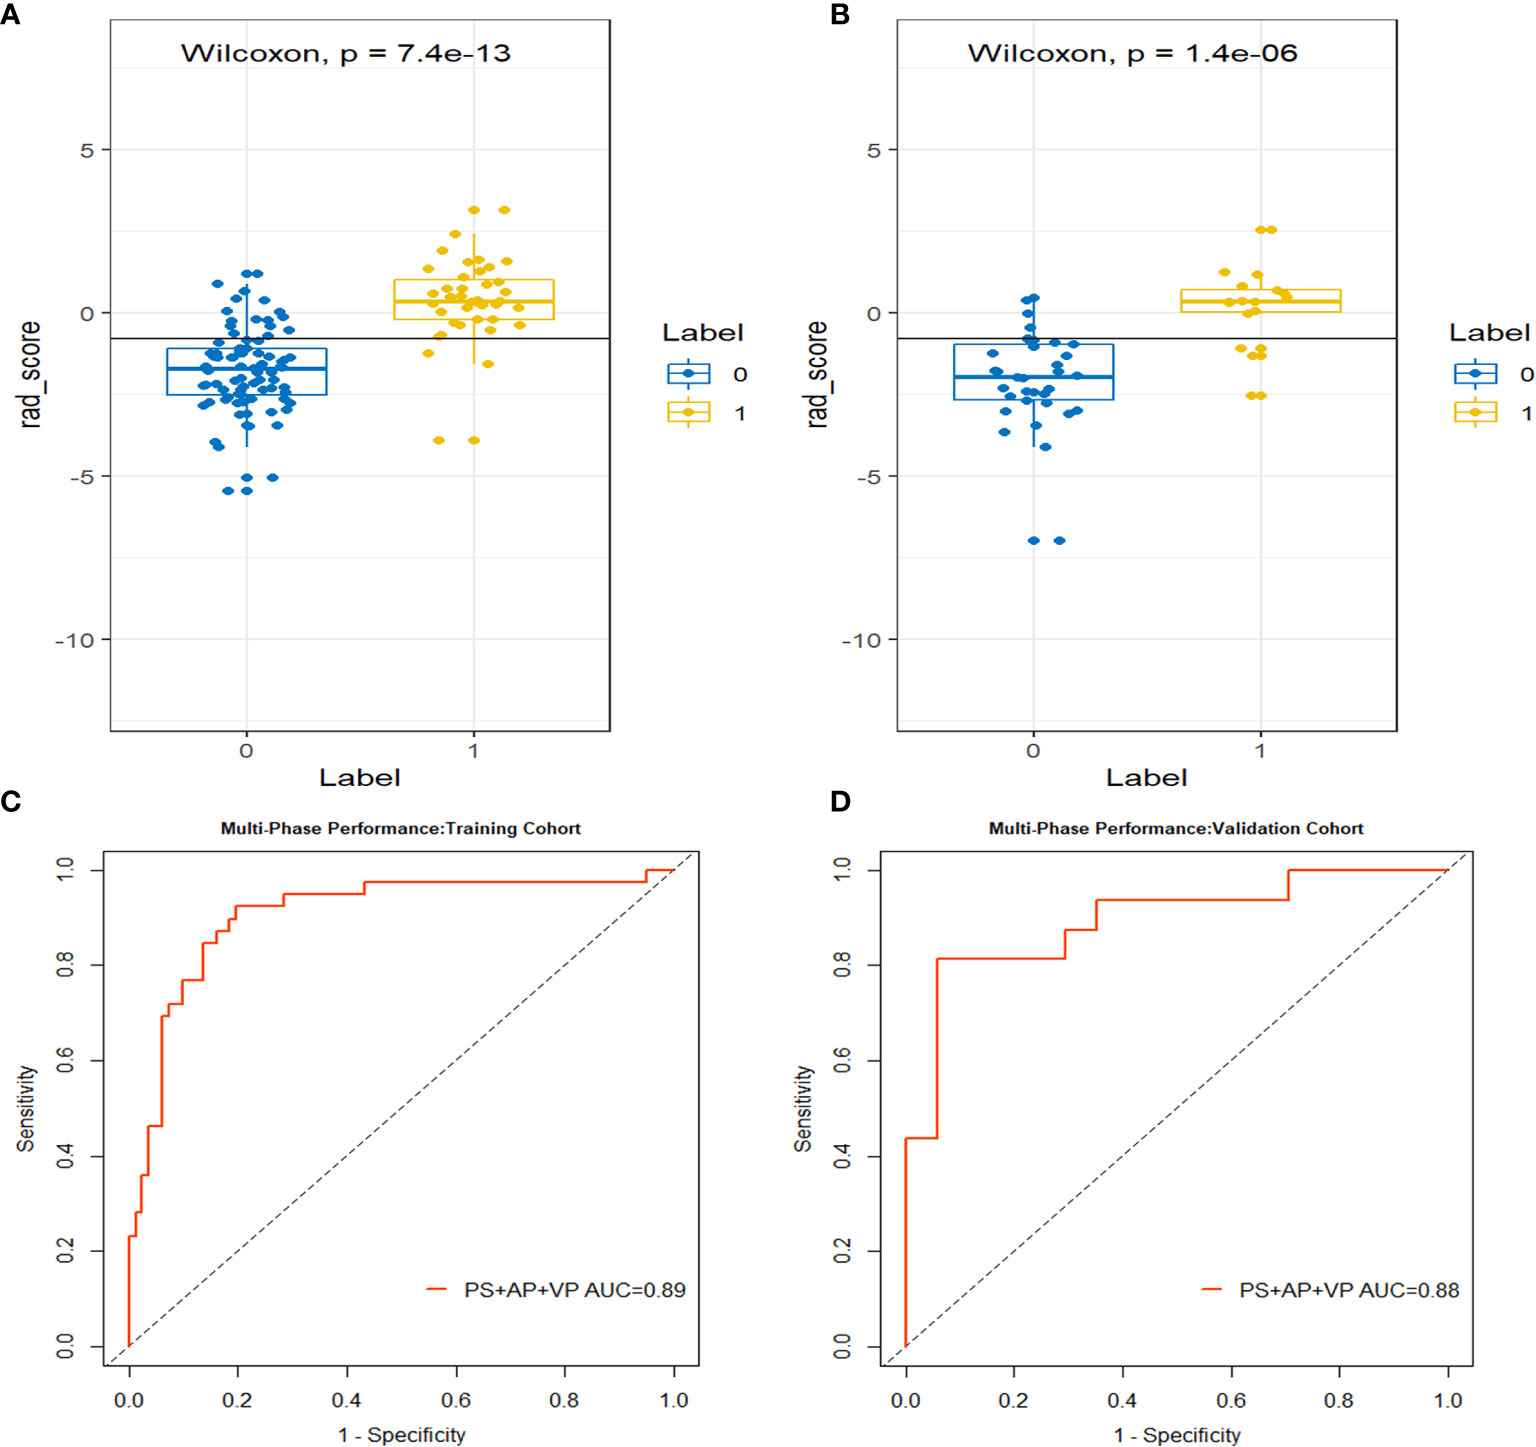
Figure 4 The box-dot plots of the multi-phase radiomics model in the training cohort (A) and the validation cohort (B). The orange markers indicate patients with MCN while the blue markers indicate patients with SCN. The ROC curves for the multi-phase radiomics model in the training cohort (C) and the validation cohort (D).
In the univariate analysis of the clinical model building, only tumor location and cyst number were significantly correlated with pathologic results (P < 0.100). Tumor location and cyst number were statistically significant (P < 0.100) in the multivariate logistic regression analysis, therefore comprising the clinical model. The results of the univariate and multivariate logistic regression analyses are shown in Table 2. The combination model was constructed by incorporating the MP-Radscore, tumor location, and cyst number. A nomogram was established to visualize the combined model (Figure 5A).
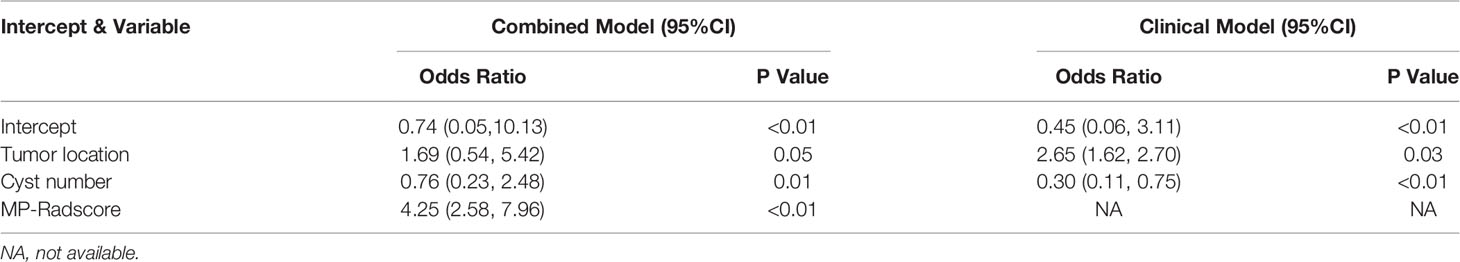
Table 2 Variables Elected for Combined Model and Clinical Model.
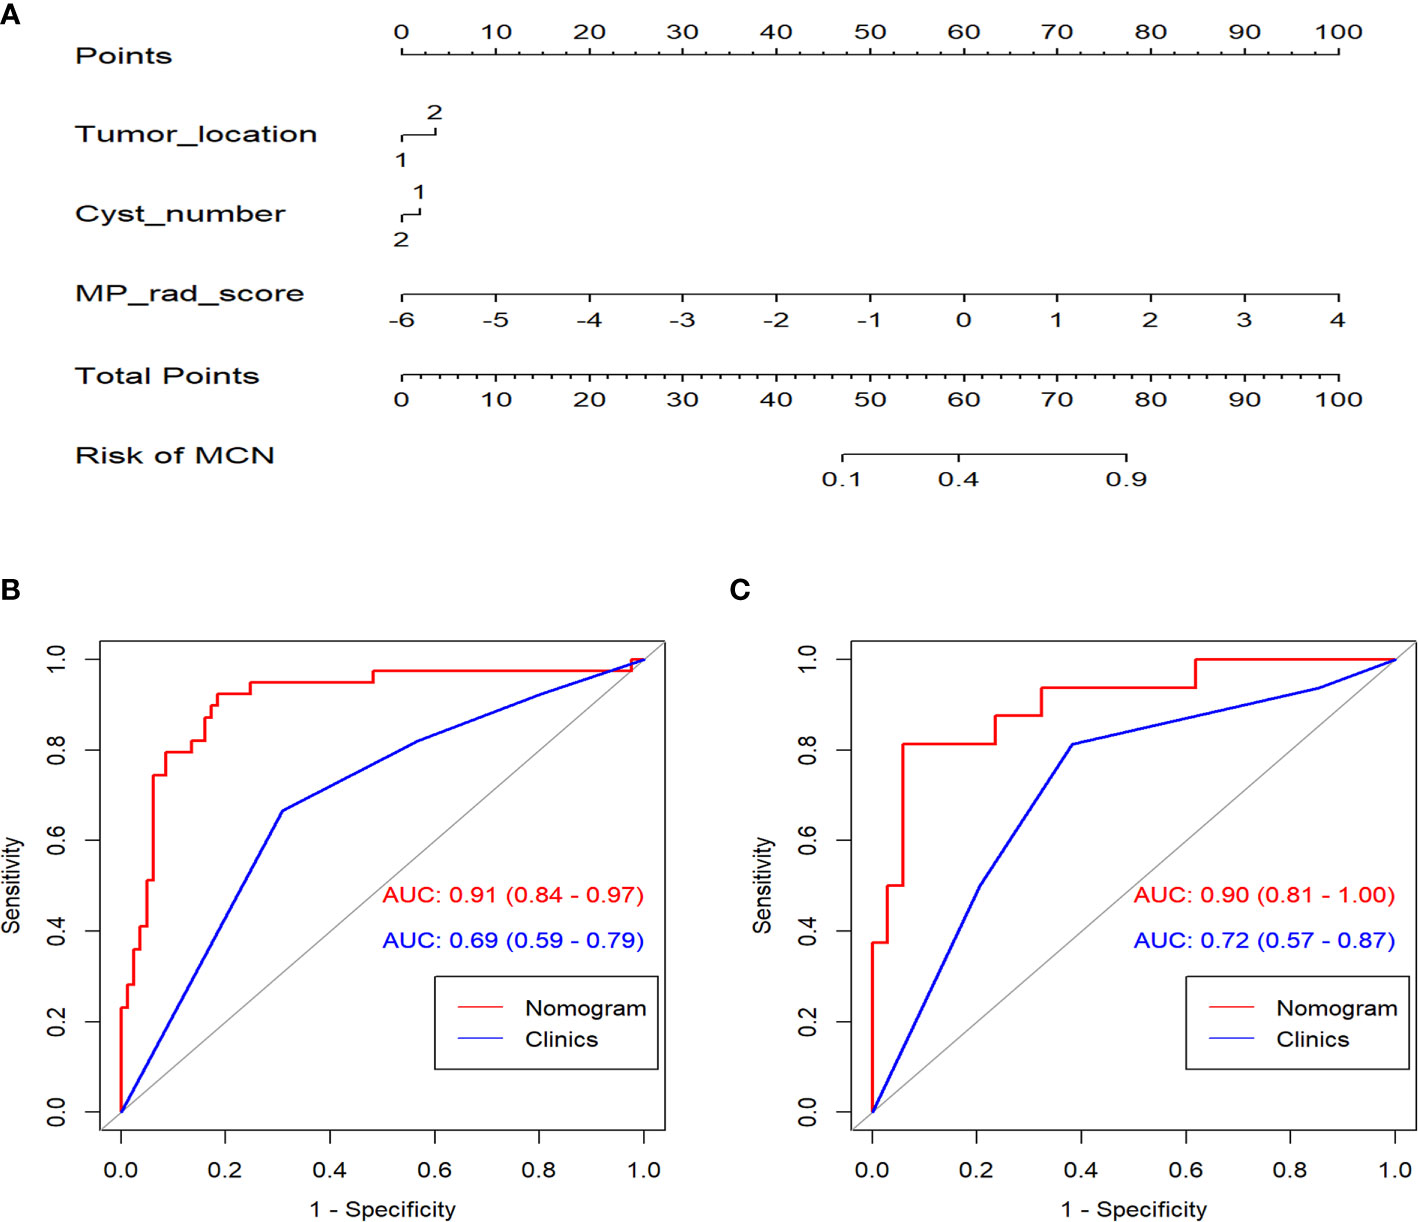
Figure 5 (A) The nomogram established for the combined model. ROC curves comparison between the nomogram and clinical model in the training (B) and validation cohorts (C).
Combination Model Validation and Clinical Use Evaluation
The combination nomogram exhibited best predictive performance (AUC: 0.91 and 0.90 in the training and validation cohorts, respectively) for the discrimination between SCNs and MCNs (Figures 5B, C and Table 3). The Delong test demonstrated statistical differences in AUC values between the combination nomogram and the clinical model (P < 0.010). Significant differences were also found in the ROC curves between the combination nomogram and VP model (Z = 1.962, P = 0.0497 < 0.0500) in the validation cohort. Calibration curves (Figure S6) revealed good agreement between the predictive and observation probabilities of our combination nomogram (P = 0.480 and 0.582 for the training and validation cohorts, respectively).
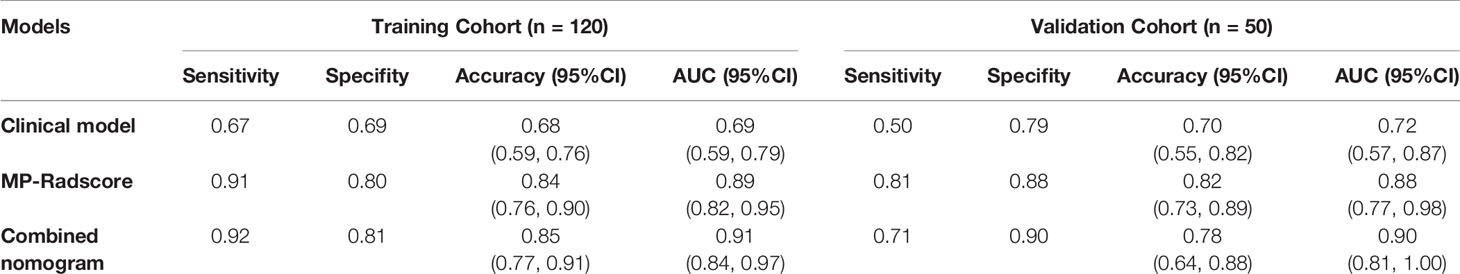
Table 3 Diagnostic performance of models in the training and validation cohorts.
The decision curve analysis indicated that the combination nomogram provided a net benefit over either a “treat-all” or “treat-none” strategy, and the clinical model at a threshold probability over 10% (Figure 6). The combination nomogram demonstrated excellent clinical practicality.
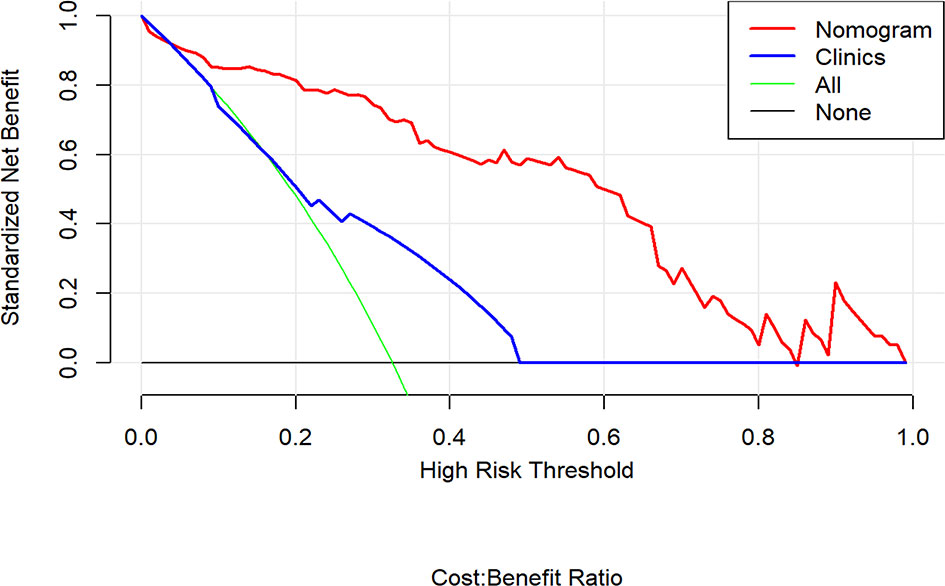
Figure 6 Decision curve analysis for the nomogram compared with clinical model in the validation cohort. It can be concluded that when the threshold probability is over 10% approximately, the nomogram could provide extra profit over the “treat-all” or “treat-none” scheme and the clinical model.
Discussion
In this retrospective study, we constructed and validated an MP CT-based radiomics nomogram to differentiate SCN from MCN. The combination model, incorporating the MP radiomics model plus clinical imaging factors, exhibited better diagnostic performance than any of the single-phase radiomics models or a clinical model alone did. The decision curve analysis also confirmed that the combination model achieved better discriminatory accuracy than the clinical model did. Relating specifically to the single-phase performance comparison, the radiomics model of the AP and the VP performed better than the PS model in terms of AUC values.
The exact morphologic details of MDCT are crucial to exclude tumor invasion of PCNs. Key imaging morphologic factors (tumor size, location, lesion shape, calcification, segmentation, etc.) derived from pathologic characteristics form the basis for radiologic differentiation of PCN subtypes (28, 29). Nevertheless, the diagnostic accuracy of cross-sectional imaging, such as MDCT, still falls short of ideal discrimination (30). Therefore, intrusive methods, such as EUS-FNA, have been developed to add diagnostic precision for preoperative PCN subtyping. Clearly, achieving this degree of accuracy requires highly skilled endoscopists and cytologists (31, 32).
Apart from the invasive techniques described above, radiomics offers a promising noninvasive technology intended to achieve similar results. We successfully established a combination radiomics model and achieved superior capacity to differentiate SCNs from MCNs. Among numerous clinical imaging factors, only cyst number and tumor location were statistically essential to be included in the combination model. Considering that the clinical and imaging features of PCNs pathologically diagnosed as SCN in the study were not consistent with typical SCN manifestations, we also analyzed and modeled these features. These results are consistent with a number of previous CT imaging studies. The differences in morphology that discriminate between SCNs and MCNs are limited to tumor location, lobular contour, and a large number of cysts (30, 33). The prediction accuracy of the clinical model alone was poor, with AUC values of only 0.69 and 0.63 in the training group and validation group, respectively. Even with high-quality CT scans interpreted by skilled radiologists, the accuracy of PCN subclassification remains disappointing.
A recent study assessed the discriminatory efficacy of conventional CT imaging features in distinguishing SCN from MCN and presented it by building a nomogram based on multivariate logistic regression (34). In contrast, our study not only considered conventional clinic-radiological features, but also incorporated radiomics features that reflected the deeper dimensional information of the images to construct a comprehensive model. The results showed that the combined model demonstrated better predictive ability than the clinical model alone. Several previous studies have applied radiomics to the differentiation of PCNs and have achieved good results (35, 36). However, further validation is required because of the limited amount of data (N < 80) and the high risk of overfitting. Moreover, a nomogram has not yet been established to visualize the radiomics model. Finally, they performed feature extraction almost uniquely on VP CT images. In the present study, in addition to VP CT scans, we also investigated the radiomics signatures on plain and AP CT images. The VP-Radscore AUC value was the best among the three single-phase radiomics models; similarly, the radiomics models of both the VP and AP had superior AUC values compared to those of the PS model. These results require verification, because they rely heavily on the experience of the radiologist performing manual segmentation (22). Interestingly, several radiomics studies have constructed radiomics models from only PS and have achieved good results in disease prediction (37, 38). The feature composition of the MP radiomics model included 8 features (57.1%) in the VP, 4 in the AP (28.6%), and only 2 (14.3%) in the PS. Our highest quantitative ranking of the VP is consistent with most previously published pancreatic radiomics research, while the PS was used less frequently. Therefore, this study is also significant in that it provides preliminary insight into the effect of contrast-enhanced CT scan phase on the predictive efficacy of imaging histology models and establishes a more comprehensive model to summarize various types of risk factors for prediction.
Our study has some limitations. First, this was a retrospective study that was conducted in a single center with a relatively small sample size. Large-scale external validation is needed to further demonstrate the clinical efficacy of the nomogram constructed here. Second, while our method of manual segmentation set the basis for excellent results, this was possible because of our relatively small number of cases. For widespread application of this technique, more research employing automatic or semi-automatic image segmentation is likely to be necessary. Third, the patients included in this study all had SCN or MCN confirmed using surgical pathology, and there may have been a selection bias. IPMN or other pancreatic cystic diseases need to be further studied to broaden the clinical application of this algorithm.
In conclusion, our study has established a novel multi-phase CT-based radiomics nomogram for a noninvasive preoperative differentiation of SCNs from MCNs. The nomogram could provide a reference basis for an accurate diagnosis, thereby avoiding unnecessary surgical resection in clinical practice. We also preliminarily explored the influence of specific feature extraction phases on the predictive efficacy of the radiomics model; the results may be enlightening to subsequent radiomics studies.
Data Availability Statement
The raw data supporting the conclusions of this article will be made available by the authors, without undue reservation.
Ethics Statement
The studies involving human participants were reviewed and approved by the Institutional Review Board of Huashan Hospital, Fudan University. Written informed consent for participation was not required for this study in accordance with the national legislation and the institutional requirements.
Author Contributions
JG and FH: made the same effort in study, designed and carried out the experiments. XW: collected and sorted the data. SD: technology support. JZ: guided and modified the manuscript. All authors contributed to the article and approved the submitted version.
Funding
The study was funded by National Key Research and Development Project in China (No. 2017YFC0113405), Launching Fund of Huashan Hospital (North Hospital) Affiliated to Fudan University (No. HSBY2020003).
Conflict of Interest
Author SD was employed by GE Healthcare.
The remaining authors declare that the research was conducted in the absence of any commercial or financial relationships that could be construed as a potential conflict of interest.
Publisher’s Note
All claims expressed in this article are solely those of the authors and do not necessarily represent those of their affiliated organizations, or those of the publisher, the editors and the reviewers. Any product that may be evaluated in this article, or claim that may be made by its manufacturer, is not guaranteed or endorsed by the publisher.
Supplementary Material
The Supplementary Material for this article can be found online at: https://www.frontiersin.org/articles/10.3389/fonc.2021.699812/full#supplementary-material
References
1. Laffan TA, Horton KM, Klein AP, Berlanstein B, Siegelman SS, Kawamoto S, et al. Prevalence of Unsuspected Pancreatic Cysts on MDCT. AJR Am J Roentgenol (2008) 191:802–7. doi: 10.2214/AJR.07.3340
2. Zhang X, Mitchell DG, Dohke M, Holland GA, Parker L. Pancreatic Cysts: Depiction on Single-Shot Fast Spin-Echo MR Images. Radiology (2002) 223:547–53. doi: 10.1148/radiol.2232010815
3. Gaujoux S, Brennan MF, Gonen M, D'Angelica MI, DeMatteo R, Fong Y, et al. Cystic Lesions of the Pancreas: Changes in the Presentation and Management of 1,424 Patients at a Single Institution Over a 15-Year Time Period. J Am Coll Surgeons (2011) 212:590–600, 600-603. doi: 10.1016/j.jamcollsurg.2011.01.016
4. Chatelain D, Hammel P, O'Toole D, Terris B, Vilgrain V, Palazzo L, et al. Macrocystic Form of Serous Pancreatic Cystadenoma. Am J Of Gastroenterol (2002) 97:2566–71. doi: 10.1111/j.1572-0241.2002.06024.x
5. Hwang HK, Kim H, Kang CM, Lee WJ. Serous Cyst Adenoma of the Pancreas: Appraisal of Active Surgical Strategy Before It Causes Problems. Surg Endoscopy (2012) 26:1560–5. doi: 10.1007/s00464-011-2070-x
6. Strobel O, Z'graggen K, Schmitz-Winnenthal FH, Friess H, Kappeler A, Zimmermann A, et al. Risk of Malignancy in Serous Cystic Neoplasms of the Pancreas. Digestion (2003) 68:24–33. doi: 10.1159/000073222
7. Singhi AD, Nikiforova MN, Fasanella KE, McGrath KM, Pai RK, Ohori NP, et al. Preoperative GNAS and KRAS Testing in the Diagnosis of Pancreatic Mucinous Cysts. Clin Cancer Res an Off J Am Assoc Cancer Res (2014) 20:4381–9. doi: 10.1158/1078-0432.CCR-14-0513
8. Matthaei H, Wylie D, Lloyd MB, Dal Molin M, Kemppainen J, Mayo SC, et al. MiRNA Biomarkers in Cyst Fluid Augment the Diagnosis and Management of Pancreatic Cysts. Clin Cancer Res an Off J Am Assoc Cancer Res (2012) 18:4713–24. doi: 10.1158/1078-0432.CCR-12-0035
9. Nikiforova MN, Khalid A, Fasanella KE, McGrath KM, Brand RE, Chennat JS, et al. Integration of KRAS Testing in the Diagnosis of Pancreatic Cystic Lesions: A Clinical Experience of 618 Pancreatic Cysts. Mod Pathol (2013) 26:1478–87. doi: 10.1038/modpathol.2013.91
10. Correa-Gallego C, Ferrone CR, Thayer SP, Wargo JA, Warshaw AL, Fernández-Del Castillo C. Incidental Pancreatic Cysts: Do We Really Know What We are Watching? Pancreatol Off J Int Assoc Pancreatol (IAP) (2010) 10:144–50. doi: 10.1159/000243733
11. Curry CA, Eng J, Horton KM, Urban B, Siegelman S, Kuszyk BS, et al. CT of Primary Cystic Pancreatic Neoplasms: Can CT be Used for Patient Triage and Treatment? AJR Am J roentgenol (2000) 175:99–103. doi: 10.2214/ajr.175.1.1750099
12. Katz DS, Friedel DM, Kho D, Georgiou N, Hines JJ. Relative Accuracy of CT and MRI for Characterization of Cystic Pancreatic Masses. AJR Am J Roentgenol (2007) 189:657–61. doi: 10.2214/AJR.07.2772
13. Visser BC, Yeh BM, Qayyum A, Way LW, McCulloch CE, Coakley FV. Characterization of Cystic Pancreatic Masses: Relative Accuracy of CT and MRI. AJR Am J Roentgenol (2007) 189:648–56. doi: 10.2214/AJR.07.2365
14. Jang DK, Song BJ, Ryu JK, Chung KH, Lee BS, Park JK, et al. Preoperative Diagnosis of Pancreatic Cystic Lesions: The Accuracy of Endoscopic Ultrasound and Cross-Sectional Imaging. Pancreas (2015) 44:1329–33. doi: 10.1097/MPA.0000000000000396
15. Lee H, Kim M, Choi J, Hong H, Kim KA. Relative Accuracy of CT and MRI in the Differentiation of Benign From Malignant Pancreatic Cystic Lesions. Clin Radiol (2011) 66:315–21. doi: 10.1016/j.crad.2010.06.019
16. Khashab MA, Kim K, Lennon AM, Shin EJ, Tignor AS, Amateau SK, et al. Should We do EUS/FNA on Patients With Pancreatic Cysts? The Incremental Diagnostic Yield of EUS Over CT/MRI for Prediction of Cystic Neoplasms. Pancreas (2013) 42:717–21. doi: 10.1097/MPA.0b013e3182883a91
17. Guo J, Sahai AV, Teoh A, Arcidiacono PG, Larghi A, Saftoiu A, et al. An International, Multi-Institution Survey on Performing EUS-FNA and Fine Needle Biopsy. Endosc Ultrasound (2020) 9:319–28. doi: 10.4103/eus.eus_56_20
18. Blaszczak AM, Krishna SG. Endoscopic Diagnosis of Pancreatic Cysts. Curr Opin Gastroen (2019) 35:448–54. doi: 10.1097/MOG.0000000000000558
19. Carmicheal J, Patel A, Dalal V, Atri P, Dhaliwal AS, Wittel UA, et al. Elevating Pancreatic Cystic Lesion Stratification: Current and Future Pancreatic Cancer Biomarker(s). Biochim Biophys Acta Rev Cancer (2020) 1873:188318. doi: 10.1016/j.bbcan.2019.188318
20. Chakraborty J, Midya A, Gazit L, Attiyeh M, Langdon-Embry L, Allen PJ, et al. CT Radiomics to Predict High-Risk Intraductal Papillary Mucinous Neoplasms of the Pancreas. Med Phys (2018) 45:5019–29. doi: 10.1002/mp.13159
21. Shen X, Yang F, Yang P, Yang M, Xu L, Zhuo J, et al. A Contrast-Enhanced Computed Tomography Based Radiomics Approach for Preoperative Differentiation of Pancreatic Cystic Neoplasm Subtypes: A Feasibility Study. Front Oncol (2020) 10:248. doi: 10.3389/fonc.2020.00248
22. Jais B, Rebours V, Malleo G, Salvia R, Fontana M, Maggino L, et al. Serous Cystic Neoplasm of the Pancreas: A Multinational Study of 2622 Patients Under the Auspices of the International Association of Pancreatology and European Pancreatic Club (European Study Group on Cystic Tumors of the Pancreas). Gut (2016) 65:305–12. doi: 10.1136/gutjnl-2015-309638
23. Barthet M, Napoléon B, Palazzo L, Chemali M, Letard J, Laugier R, et al. Management of Cystic Pancreatic Lesions Found Incidentally. Endoscopy (2007) 39:926–8. doi: 10.1055/s-2007-966786
24. van Griethuysen JJM, Fedorov A, Parmar C, Hosny A, Aucoin N, Narayan V, et al. Computational Radiomics System to Decode the Radiographic Phenotype. Cancer Res (2017) 77:e104–7. doi: 10.1158/0008-5472.CAN-17-0339
25. Barry WT, Kernagis DN, Dressman HK, Griffis RJ, Hunter JD, Olson JA, et al. Intratumor Heterogeneity and Precision of Microarray-Based Predictors of Breast Cancer Biology and Clinical Outcome. J Clin Oncol (2010) 28:2198–206. doi: 10.1200/JCO.2009.26.7245
26. Collins GS, Reitsma JB, Altman DG, Moons KG. Transparent Reporting of a Multivariable Prediction Model for Individual Prognosis or Diagnosis (TRIPOD): The TRIPOD Statement. BMJ (2015) 350:g7594. doi: 10.1161/CIRCULATIONAHA.114.014508
27. Van Calster B, Wynants L, Verbeek JFM, Verbakel JY, Christodoulou E, Vickers AJ, et al. Reporting and Interpreting Decision Curve Analysis: A Guide for Investigators. Eur Urol (2018) 74:796–804. doi: 10.1016/j.eururo.2018.08.038
28. Sahani DV, Sainani NI, Blake MA, Crippa S, Mino-Kenudson M, del-Castillo CF. Prospective Evaluation of Reader Performance on MDCT in Characterization of Cystic Pancreatic Lesions and Prediction of Cyst Biologic Aggressiveness. Ajr Am J Roentgenol (2011) 197:W53–61. doi: 10.2214/AJR.10.5866
29. Brugge WR, Lewandrowski K, Lee-Lewandrowski E, Centeno BA, Szydlo T, Regan S, et al. Diagnosis of Pancreatic Cystic Neoplasms: A Report of the Cooperative Pancreatic Cyst Study. Gastroenterology (2004) 126:1330–6. doi: 10.1053/j.gastro.2004.02.013
30. Kim SY, Lee JM, Kim SH, Shin K, Kim YJ, An SK, et al. Macrocystic Neoplasms of the Pancreas: CT Differentiation of Serous Oligocystic Adenoma From Mucinous Cystadenoma and Intraductal Papillary Mucinous Tumor. AJR Am J Roentgenol (2006) 187:1192–8. doi: 10.2214/AJR.05.0337
31. Weiss MJ. The Value of Cytology in the Management of Patients With Pancreatic Cysts. Cancer Cytopathol (2019) 127:141–2. doi: 10.1002/cncy.22095
32. Chang Y, Tung C, Chang M, Wu C, Chen B, Jan I. Age and Cystic Size are Associated With Clinical Impact of Endoscopic Ultrasonography-Guided Fine-Needle Aspiration on the Management of Pancreatic Cystic Neoplasms. Scand J Gastroenterol (2019) 54:506–12. doi: 10.1080/00365521.2019.1601254
33. Goh BKP, Tan Y, Yap W, Cheow P, Chow PKH, Chung YA, et al. Pancreatic Serous Oligocystic Adenomas: Clinicopathologic Features and a Comparison With Serous Microcystic Adenomas and Mucinous Cystic Neoplasms. World J Surg (2006) 30:1553–9. doi: 10.1007/s00268-005-0749-7
34. Xie H, Ma S, Guo X, Zhang X, Wang X. Preoperative Differentiation of Pancreatic Mucinous Cystic Neoplasm From Macrocystic Serous Cystic Adenoma Using Radiomics: Preliminary Findings and Comparison With Radiological Model. Eur J Radiol (2020) 122:108747. doi: 10.1016/j.ejrad.2019.108747
35. Yang J, Guo X, Ou X, Zhang W, Ma X. Discrimination of Pancreatic Serous Cystadenomas From Mucinous Cystadenomas With CT Textural Features: Based on Machine Learning. Front Oncol (2019) 9:494. doi: 10.3389/fonc.2019.00494
36. Kocak B, Durmaz ES, Ates E, Kaya OK, Kilickesmez O. Unenhanced CT Texture Analysis of Clear Cell Renal Cell Carcinomas: A Machine Learning-Based Study for Predicting Histopathologic Nuclear Grade. AJR Am J Roentgenol (2019) 10:W1–8. doi: 10.2214/AJR.18.20742
37. Takahashi N, Leng S, Kitajima K, Gomez-Cardona D, Thapa P, Carter RE, et al. Small (< 4 Cm) Renal Masses: Differentiation of Angiomyolipoma Without Visible Fat From Renal Cell Carcinoma Using Unenhanced and Contrast-Enhanced Ct. AJR Am J Roentgenol (2015) 205:1194–202. doi: 10.2214/AJR.14.14183
Keywords: pancreatic cystic neoplasm, radiomics, nomogram, contrast-enhanced computed tomography (CECT), texture analysis
Citation: Gao J, Han F, Wang X, Duan S and Zhang J (2021) Multi-Phase CT-Based Radiomics Nomogram for Discrimination Between Pancreatic Serous Cystic Neoplasm From Mucinous Cystic Neoplasm. Front. Oncol. 11:699812. doi: 10.3389/fonc.2021.699812
Received: 24 April 2021; Accepted: 15 November 2021;
Published: 01 December 2021.
Edited by:
Joseph Ross Mitchell, Independent Researcher, Tampa, FL, United StatesReviewed by:
Jingqin Fang, Army Medical University, ChinaGerardo Blanco-Fernández, Universidad de Extremadura, Spain
Copyright © 2021 Gao, Han, Wang, Duan and Zhang. This is an open-access article distributed under the terms of the Creative Commons Attribution License (CC BY). The use, distribution or reproduction in other forums is permitted, provided the original author(s) and the copyright owner(s) are credited and that the original publication in this journal is cited, in accordance with accepted academic practice. No use, distribution or reproduction is permitted which does not comply with these terms.
*Correspondence: Jiawen Zhang, emhhbmdqdzIwMDBAMTI2LmNvbQ==
†These authors have contributed equally to this work