 Shi Yun Sun
 Yingying Ding1
- 1Department of Radiology, Yunnan Cancer Center, The Third Affiliated Hospital of Kunming Medical University, Yunnan Cancer Hospital, Kunming, China
- 2Magnetic Resonance Imaging Research, General Electric Healthcare (China), Beijing, China
- 3Department of Radiology, Third People's Hospital of Yunnan Province, Kunming, China
Objectives: To evaluate the value of synthetic magnetic resonance imaging (syMRI), diffusion-weighted imaging (DWI), DCE-MRI, and clinical features in breast imaging–reporting and data system (BI-RADS) 4 lesions, and develop an efficient method to help patients avoid unnecessary biopsy.
Methods: A total of 75 patients with breast diseases classified as BI-RADS 4 (45 with malignant lesions and 30 with benign lesions) were prospectively enrolled in this study. T1-weighted imaging (T1WI), T2WI, DWI, and syMRI were performed at 3.0 T. Relaxation time (T1 and T2), apparent diffusion coefficient (ADC), conventional MRI features, and clinical features were assessed. “T” represents the relaxation time value of the region of interest pre-contrast scanning, and “T+” represents the value post-contrast scanning. The rate of change in the T value between pre- and post-contrast scanning was represented by ΔT%.
Results: ΔT1%, T2, ADC, age, body mass index (BMI), menopause, irregular margins, and heterogeneous internal enhancement pattern were significantly associated with a breast cancer diagnosis in the multivariable logistic regression analysis. Based on the above parameters, four models were established: model 1 (BI-RADS model, including all conventional MRI features recommended by BI-RADS lexicon), model 2 (relaxation time model, including ΔT1% and T2), model 3 [multi-parameter (mp)MRI model, including ΔT1%, T2, ADC, margin, and internal enhancement pattern], and model 4 (combined image and clinical model, including ΔT1%, T2, ADC, margin, internal enhancement pattern, age, BMI, and menopausal state). Among these, model 4 has the best diagnostic performance, followed by models 3, 2, and 1.
Conclusions: The mpMRI model with DCE-MRI, DWI, and syMRI is a robust tool for evaluating the malignancies in BI-RADS 4 lesions. The clinical features could further improve the diagnostic performance of the model.
Introduction
The breast imaging–reporting and data system magnetic resonance imaging (BI-RADS-MRI) lexicon proposed by the American College of Radiology (ACR) is a reference for MRI interpretation of breast lesions. It provides MRI descriptors, such as signal intensity, morphology, and enhancement kinetics, which are recommended in combination to evaluate the final BI-RADS classification (1). The lesions that do not have typical malignant signs but have sufficient suspicious manifestations are classified as BI-RADS 4 (>2% but <95% likelihood of malignancy). Such a wide range prompts the patients to undergo an unnecessary histological biopsy.
Several studies have confirmed that dynamic contrast-enhanced magnetic resonance imaging (DCE-MRI) is an effective “problem-solving” tool for further evaluation of BI-RADS category 4 findings that are classified by mammography or ultrasonography (US) (2–5). When mammography or/and US remains inconclusive yet suspicious, additional imaging with MRI is the next recommended plan. However, most descriptors recommended by BI-RADS are based on the subjective qualitative evaluation depending on the experience and level of different observers. In particular, the judgment of signal strength is affected by the subjective difference and image contrast. On the other hand, due to an overlap of morphological and kinetic enhancement features between benign and malignant lesions, the specificity is limited (6, 7). When MRI becomes the last step of non-invasive imaging examination, patients still judged as BI-RADS 4 can only choose biopsy for diagnosis (8).
Diffusion-weighted imaging (DWI), magnetic resonance spectroscopy (MRS), and other quantitative imaging techniques in diagnosing breast BI-RADS 3–5 lesions have been explored extensively to aid in diagnosis specificity. Relaxation time could be another quantitative MR method for the diagnosis of breast diseases (9–15). Previous studies have shown that quantitative longitudinal relaxation time (T1) and transverse relaxation time (T2) values could assess the histopathology of breast diseases and, thus, be used as a potential biomarker of biopsy (16, 17). Some studies have explored the use of quantitative relaxation time in breast disease diagnosis, histopathological grading, neoadjuvant chemotherapy evaluation, and Ki-67 status prediction (18–23). However, only a few studies have focused on the relaxation time in breast BI-RADS 4 lesions, and the diagnostic value of relaxation time in this specific population needs further investigation.
Recently, a promising quantitative imaging technique, synthetic MRI (syMRI), has been proposed. It is based on the quantification of relaxation times by multi-echo acquisition of a saturation-recovery using the turbo spin-echo readout (QRAPMASTER) method. In addition, a multi-delay multi-echo (MDME) approach, magnetic resonance image compilation (MAGiC), and a slice shift between the saturation pulse and acquisition facilitate efficient quantification of T1 and T2 by syMRI in a single scan, as well as the subsequent synthesis of multiple contrast-weighted images. The quality of these synthetic images is sufficient for diagnosis (24), and the acquisition time of syMRI is only one-third of the traditional quantitative technology (18) as it applies the multi-echo spin-echo (MESE) method to quantify the relaxation time. A previous study pointed out that syMRI is useful for the evaluation of breast cancer by simultaneous acquisition of several quantitative physical properties. Moreover, the relaxation time obtained by syMRI has shown an excellent correlation with that by traditional mapping (18). Herein, we analyzed the contribution of conventional MR features recommended by BI-RADS, quantitative relaxation time provided by syMRI, apparent diffusion coefficient (ADC) obtained by DWI, and clinical features in the diagnosis of breast BI-RADS type 4 lesions. Additionally, we aim to establish a multi-parameter (mp) combination model and present it with a visual nomogram and develop an efficient method for diagnosing BI-RADS 4 breast lesions to avoid unnecessary biopsies in patients.
Materials and Methods
Study Population
The present study was conducted on 255 female patients who underwent breast MRI in our institution at the Yunnan Cancer Hospital from July 2019 to September 2019. The study was approved by the institutional ethics board of the hospital (No. KY2019102), and informed consent was obtained from all individual participants. The inclusion criteria were as follows: (1) no previous operation or any treatment; (2) before and after contrast injection, all patients underwent complete syMRI and routine MRI examination; and (3) BI-RADS final assessment as category 4 at MRI. The exclusion criteria were as follows: (1) patients with incomplete clinical or pathological data; (2) patients with insufficient MRI image quality for quantitative measurement; (3) non-mass lesions; and (4) patients with both benign and malignant lesions.
MRI Acquisition
All MR examinations were performed on a 3.0-T MRI system (Signa Pioneer, GE Healthcare, Milwaukee, WI, USA) using a 16-channel phased-array breast surface coil, with the patient in the prone position. The imaging protocols are described in Appendix 1. Firstly, before contrast injection, all patients underwent conventional MRI (including T1WI, T2WI, and DWI), followed by syMRI (MAGiC). Secondly, 20 ml of Gd-DTPA-BMA (Omni-Scan, GE Healthcare, Ireland) was injected at a rate of 2.0 ml/s and then flushed with 20 ml of saline. Next, DCE-MRI was performed, followed by syMRI. The scanning parameters of syMRI pre- and post-contrast injection were identical. The scan parameters of all sequences are listed in Table 1.
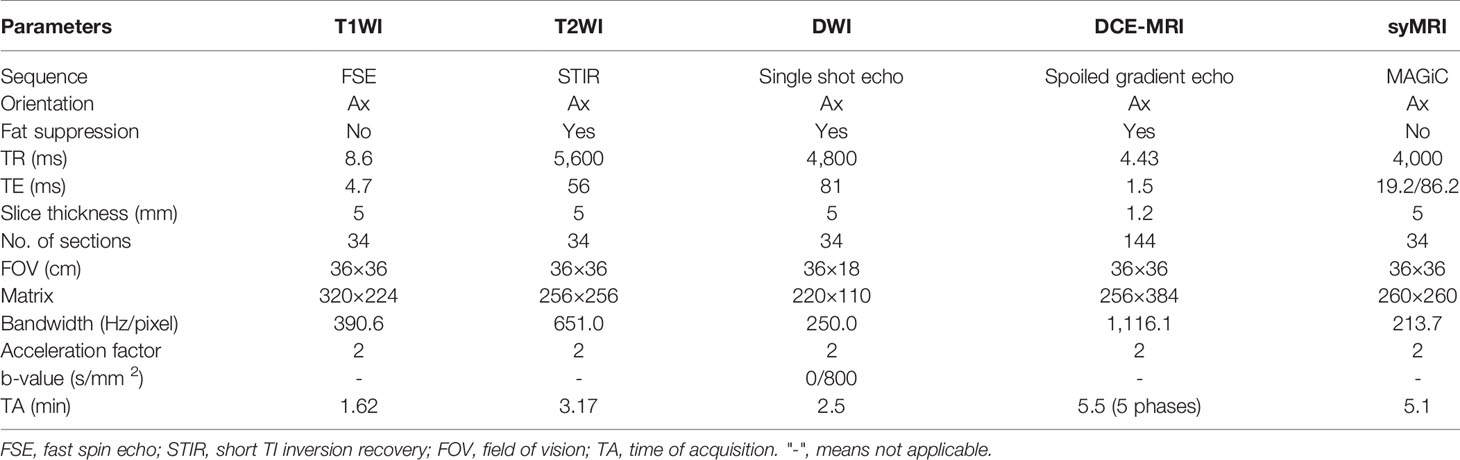
Table 1 Scan parameters for all sequences.
Image Analysis
Quantitative MRI Characteristics
Two radiologists (A and B, with 10 and 8 years of experience in breast imaging, respectively), blinded to the pathology results, clinical data, and other imaging findings, reviewed all the images. The syMRI data were further processed using syMRI 8.0 software (SyMR, Linköping, Sweden) to generate T1 and T2 relaxation maps. All the images have been processed on the Advantage Windows workstation (GE Healthcare, AW 4.4) as follows: (1) The relaxation maps and conventional MRI weighted images were observed to determine the location of the lesion, and a region of interest (ROI) was drawn manually on one of the relaxation maps along the margin of the tumor on a single section image with maximum diameter to cover the largest area of the lesion. (2) Then, the ROI was mapped to the other relaxation maps through the automatic alignment of MAGiC software to ensure the consistency of the ROI range. T1 and T2 relaxation maps were obtained simultaneously in one scan by syMRI, and the scanning parameters of syMRI were altered pre- and post-contrast injection. (3) The sections of DWI and syMRI scanning were identical, and hence, the number of ADC and relaxation maps was also similar. The ROI was drawn on the ADC map by manual alignment, the delineated area was consistent with the area on the relaxation map, and the area error was controlled within 0.1 cm 2. (4) The values of quantitative parameters (T1, T2, and ADC) of the ROIs were calculated automatically via MAGiC and DWI post-processing software, and the median values were utilized for statistical analysis. “T” represents the relaxation time value of the ROI pre-contrast scanning, and the “T+” represents the value post-contrast scanning. ΔT% (ΔT%=[(“T”–”T+”)/”T”]×100) represented the relative change rate in T value between pre- and post-contrast scanning. The area of ROI was 1–6.5 cm 2 according to the size of the tumor. The largest lesion would be involved in this study when more than one lesion was detected in the breasts. After 2 weeks, both observers, blinded to their previous results, independently remeasured the data similarly.
Conventional MRI Characteristics
According to the 5th edition BI-RADS MRI lexicon (1), the two observers independently evaluated the conventional MRI characteristics including size (longest diameter), shape (round or oval and irregular), margin (circumscribed, irregular, and spiculated), internal enhancement pattern (homogeneous, heterogeneous, rim enhancement, and dark internal septations), the initial phase of time-intensity curves (TIC) (slow, medium, and fast), delayed phase of TIC [persistent (I), plateau (II), and washout (III)], breast composition defined by the amount of fibroglandular tissue (FGT) (fat, scattered, heterogeneous, or extreme), background parenchymal enhancement (BPE) (minimal, mild, moderate, and marked), peritumoral edema (yes or no), and associated features (lymph nodes enlargement, nipple retraction and invasion, skin retraction and invasion, pretoralis muscle invasion, and architectural distortion). In the case of discrepancy in the opinions of the two observers, the judgment of the third doctor with higher qualifications prevails.
Clinical Characteristics
Clinical data, such as age, menarche age, body mass index (BMI), menopausal state, fertile state, and family history (first-degree or second-degree relatives with breast cancer), were obtained from patients’ medical records. Other characteristics were obtained by reviewing patients’ biochemical reports, including the status of carcinoembryonic antigen (CEA), carbohydrate antigen 125 (CA125), CA153, and ferritin (positive or negative).
Statistical Analysis
All statistical analyses were carried out using the statistical packages R (The R Foundation; http://www.r-project.org; version 3.4.3) and Empower (R) (www.empowerstats.com, X&Y solutions, Inc. Boston, MA, USA). Firstly, the Kolmogorov–Smirnov test was applied to assess the normality of continuous data. Categorical data were presented as frequencies and percentages (N and %, respectively). Continuous data were summarized as means ± standard deviation (M ± SD) or median and interquartile ranges M (Q1, Q3), depending on the distribution.
Construction of the Prediction Models
The variables between benign and malignant groups were compared using the Mann-Whitney U test, Student’s t-test, chi-square test, and Fisher’s exact test. The variables with p < 0.05 in univariate analysis were entered into the multivariable logistic regression analysis. Based on the minimal Akaike’s information criterion (AIC), the multivariable logistic regression analysis was used to screen the independent variables associated with malignancy. Thus, various predictive models were constructed based on these independent variables.
Evaluation of Model Effectiveness
The discriminative ability of variables was examined using the area under the receiver operating characteristics (ROC) curve (AUC). The maximum of Youden’s index = (sensitivity + specificity) −1 was used as a critical point to identify benign and malignant breast lesions. The net reclassification index (NRI) was used to evaluate the diagnostic efficiency among the models. The decision curve analysis (DCA) evaluated the clinical utility of the model, while the calibration curve assessed the fitness of the model. Limited by the small sample size, the bootstrap resampling method (1,000 times) was used for internal verification of the model.
The interobserver and intraobserver consistencies for all quantitative parameters between the two radiologists were evaluated with the intraclass correlation coefficient (ICC) and the Bland–Altman analysis.
Results
According to the above inclusion and exclusion criteria, a total of 75 patients (45 with malignant lesions and 30 with benign lesions) were included in this study (Appendix 2). All the lesions were confirmed by biopsy or pathology after surgery (Appendix 3).
Imaging and Clinical Characteristics to Distinguish Breast Cancer From Benign Diseases in BI-RADS 4 Lesions
Univariate analysis showed significant differences in T1, ΔT1%, T2, T2+, ΔT2%, ADC, age, BMI, menopausal state, CA153, margin, FGT, and internal enhancement pattern between benign and malignant groups (Table 2). ΔT1%, T2, ADC, age, BMI, menopause, irregular margins, and heterogeneous internal enhancement pattern were identified as independent variables for breast cancer diagnosis in the multivariable logistic regression analysis (Table 3).
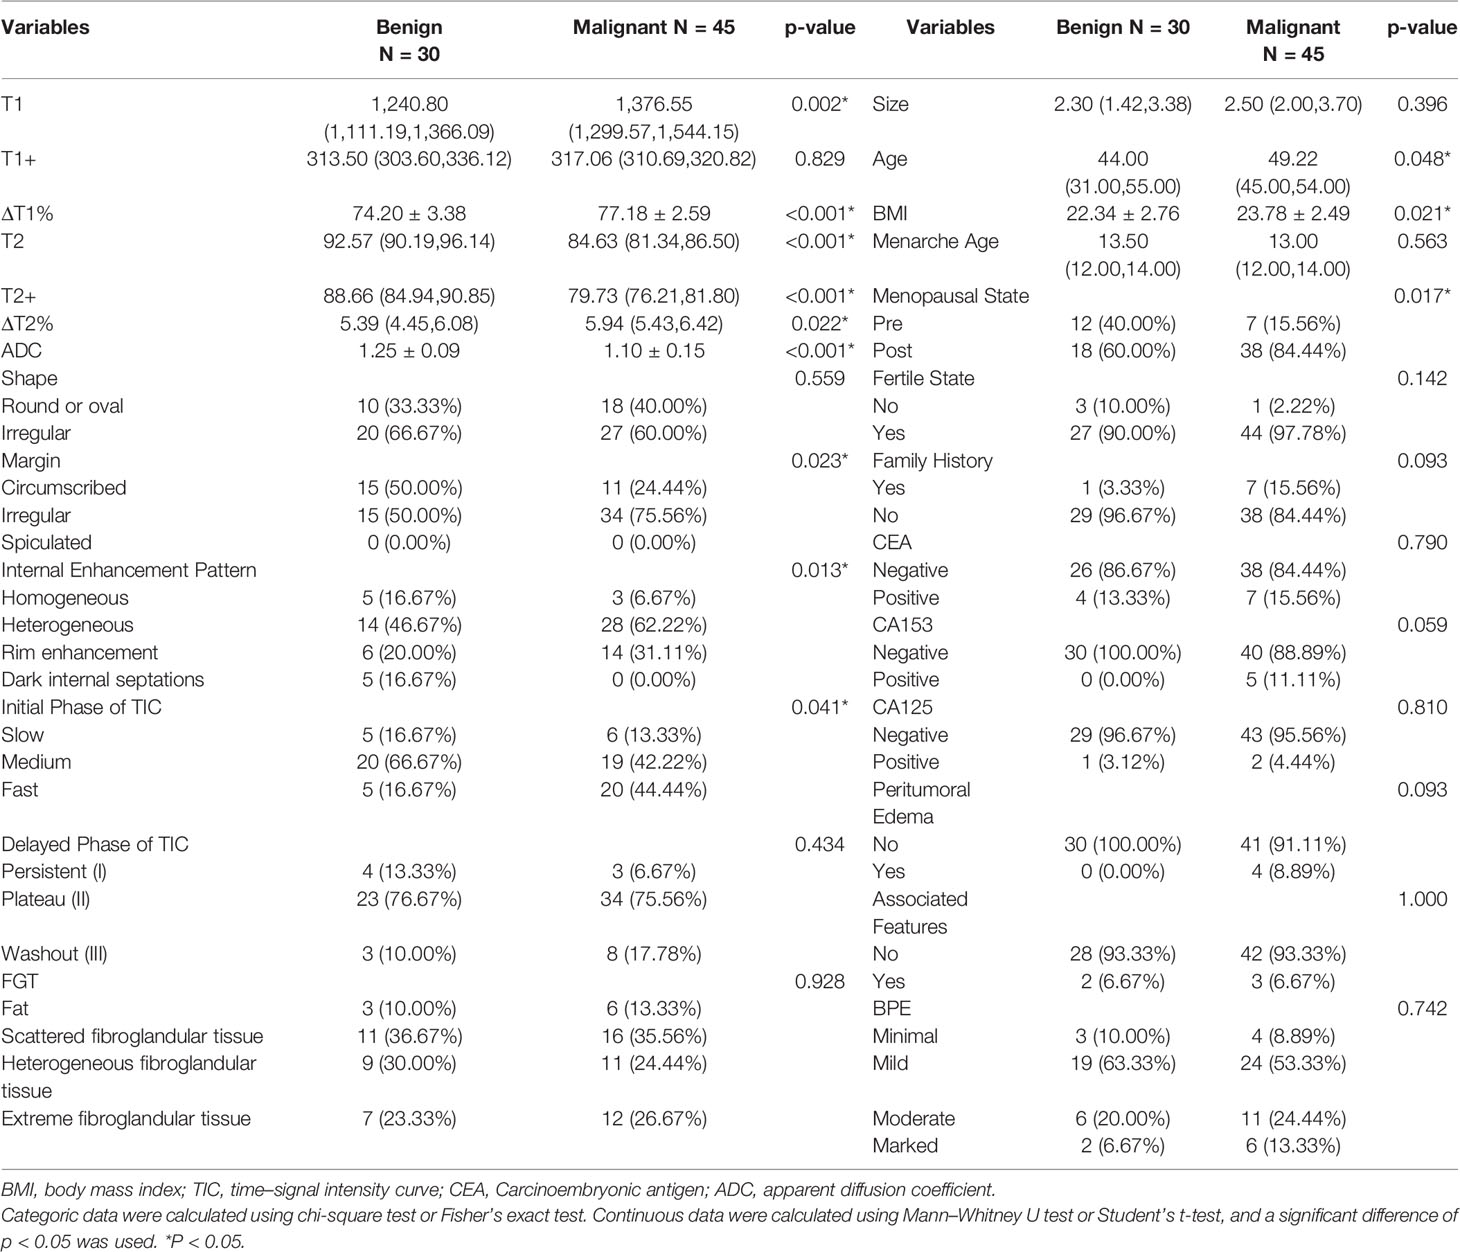
Table 2 Comparison of clinical and imaging characteristics between benign and malignant groups.
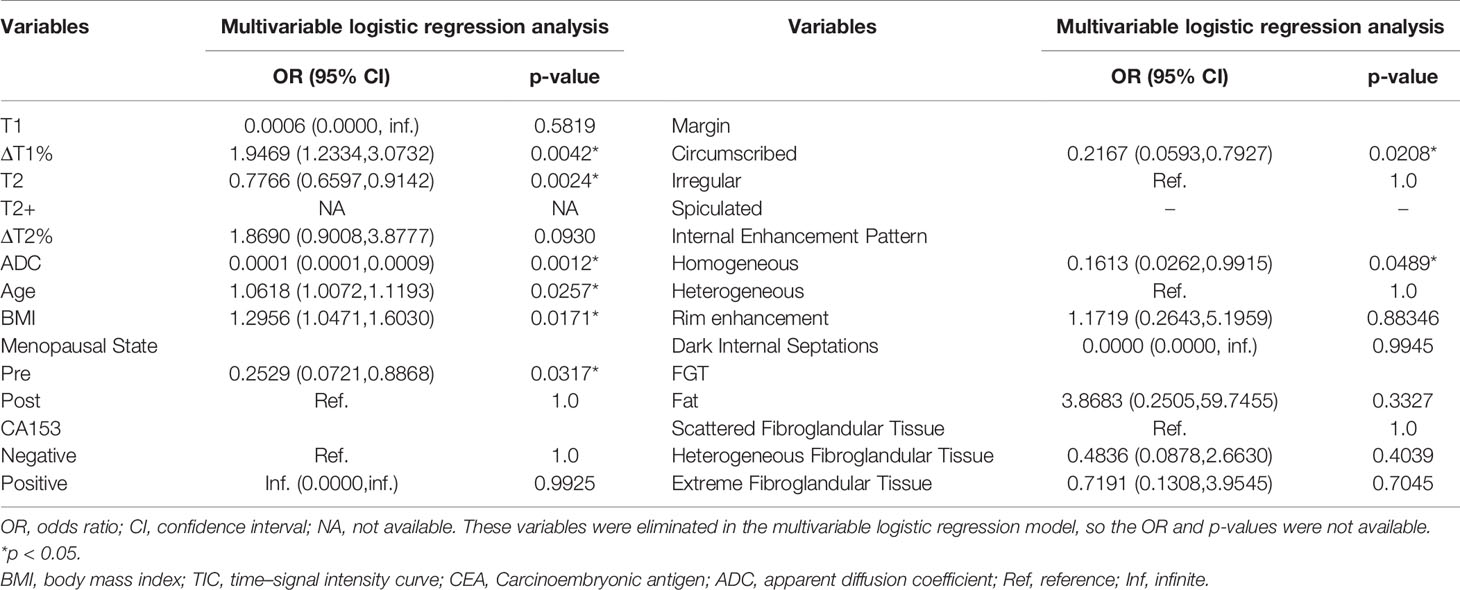
Table 3 Parameters associated with breast cancer diagnosis in multivariable logistic regression analysis.
Diagnostic Performance of Various MRI Parameters and Prediction Models in the Diagnosis of Breast Cancer and Benign Diseases
The diagnostic performance of each independent variable is listed in Table 4. Among the MRI quantitative parameters, T2 and ΔT1% were equivalent to ADC value (AUC = 0.798, 0.793, and 0.818; p = 0.809, 0.863). Four prediction models were established by combining the above independent parameters: model 1 (BI-RADS model, including all conventional MRI features recommended by BI-RADS lexicon), model 2 (relaxation time model, including ΔT1% and T2), model 3 (mpMRI model, including ΔT1%, T2, ADC, margin, and internal enhancement pattern), and model 4 (combined image and clinical model, including ΔT1%, T2, ADC, margin, internal enhancement pattern, age, BMI, and menopausal state). Table 5 and Figure 1 shows that model 4 has the best diagnostic performance (AUC = 0.989), followed by models 3, 2, and 1 (AUC = 0.962, 0.872, 0.856; all p < 0.05). Moreover, model 2 (relaxation model) showed higher diagnostic performance than ADC value alone (AUC = 0.872 vs. 0.818, p = 0.046), but similar to that of model 1 (AUC = 0.872 vs. 0.856, p = 0.814). DCA showed that the net benefit of model 4 was better than that of the other models between threshold probabilities of 0%–100% (Figure 2). The nomogram based on model 4 is shown in Appendix 4. The calibration curve of the nomogram provided evidence of optimal calibration (Figure 3, P = 1.21). The bootstrap resampling showed that the AUC was 0.979, and the sensitivity, specificity, positive predictive value (PPV), negative predictive value (NPV), and the accuracy of model 4 were 94.11%, 93.75%, 95.35%, 88.24%, and 92.21%, respectively. Typical cases are described in Figures 4, 5.
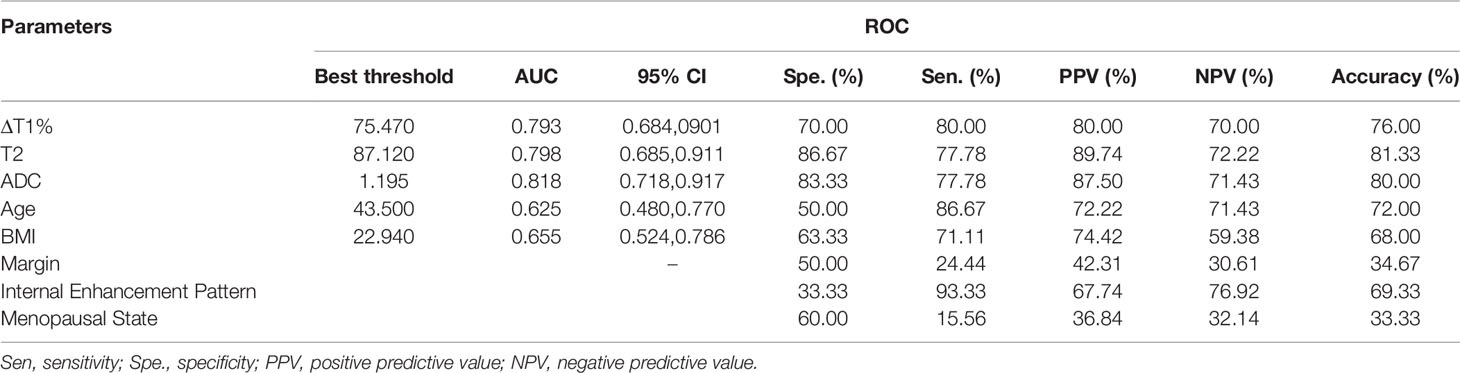
Table 4 Diagnostic performance of different MRI parameters in the diagnosis of breast cancer and benign diseases.
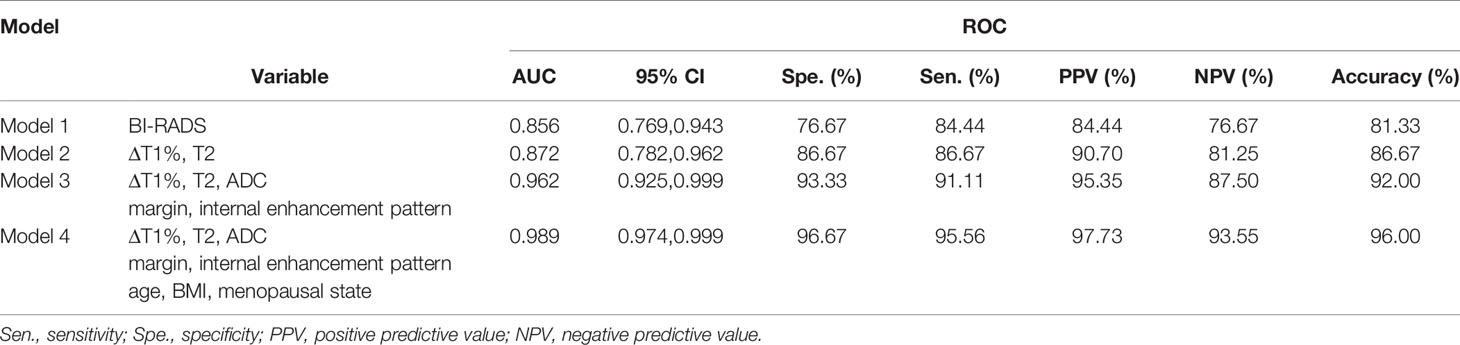
Table 5 Diagnostic performance of different prediction models in the diagnosis of breast cancer and benign diseases.
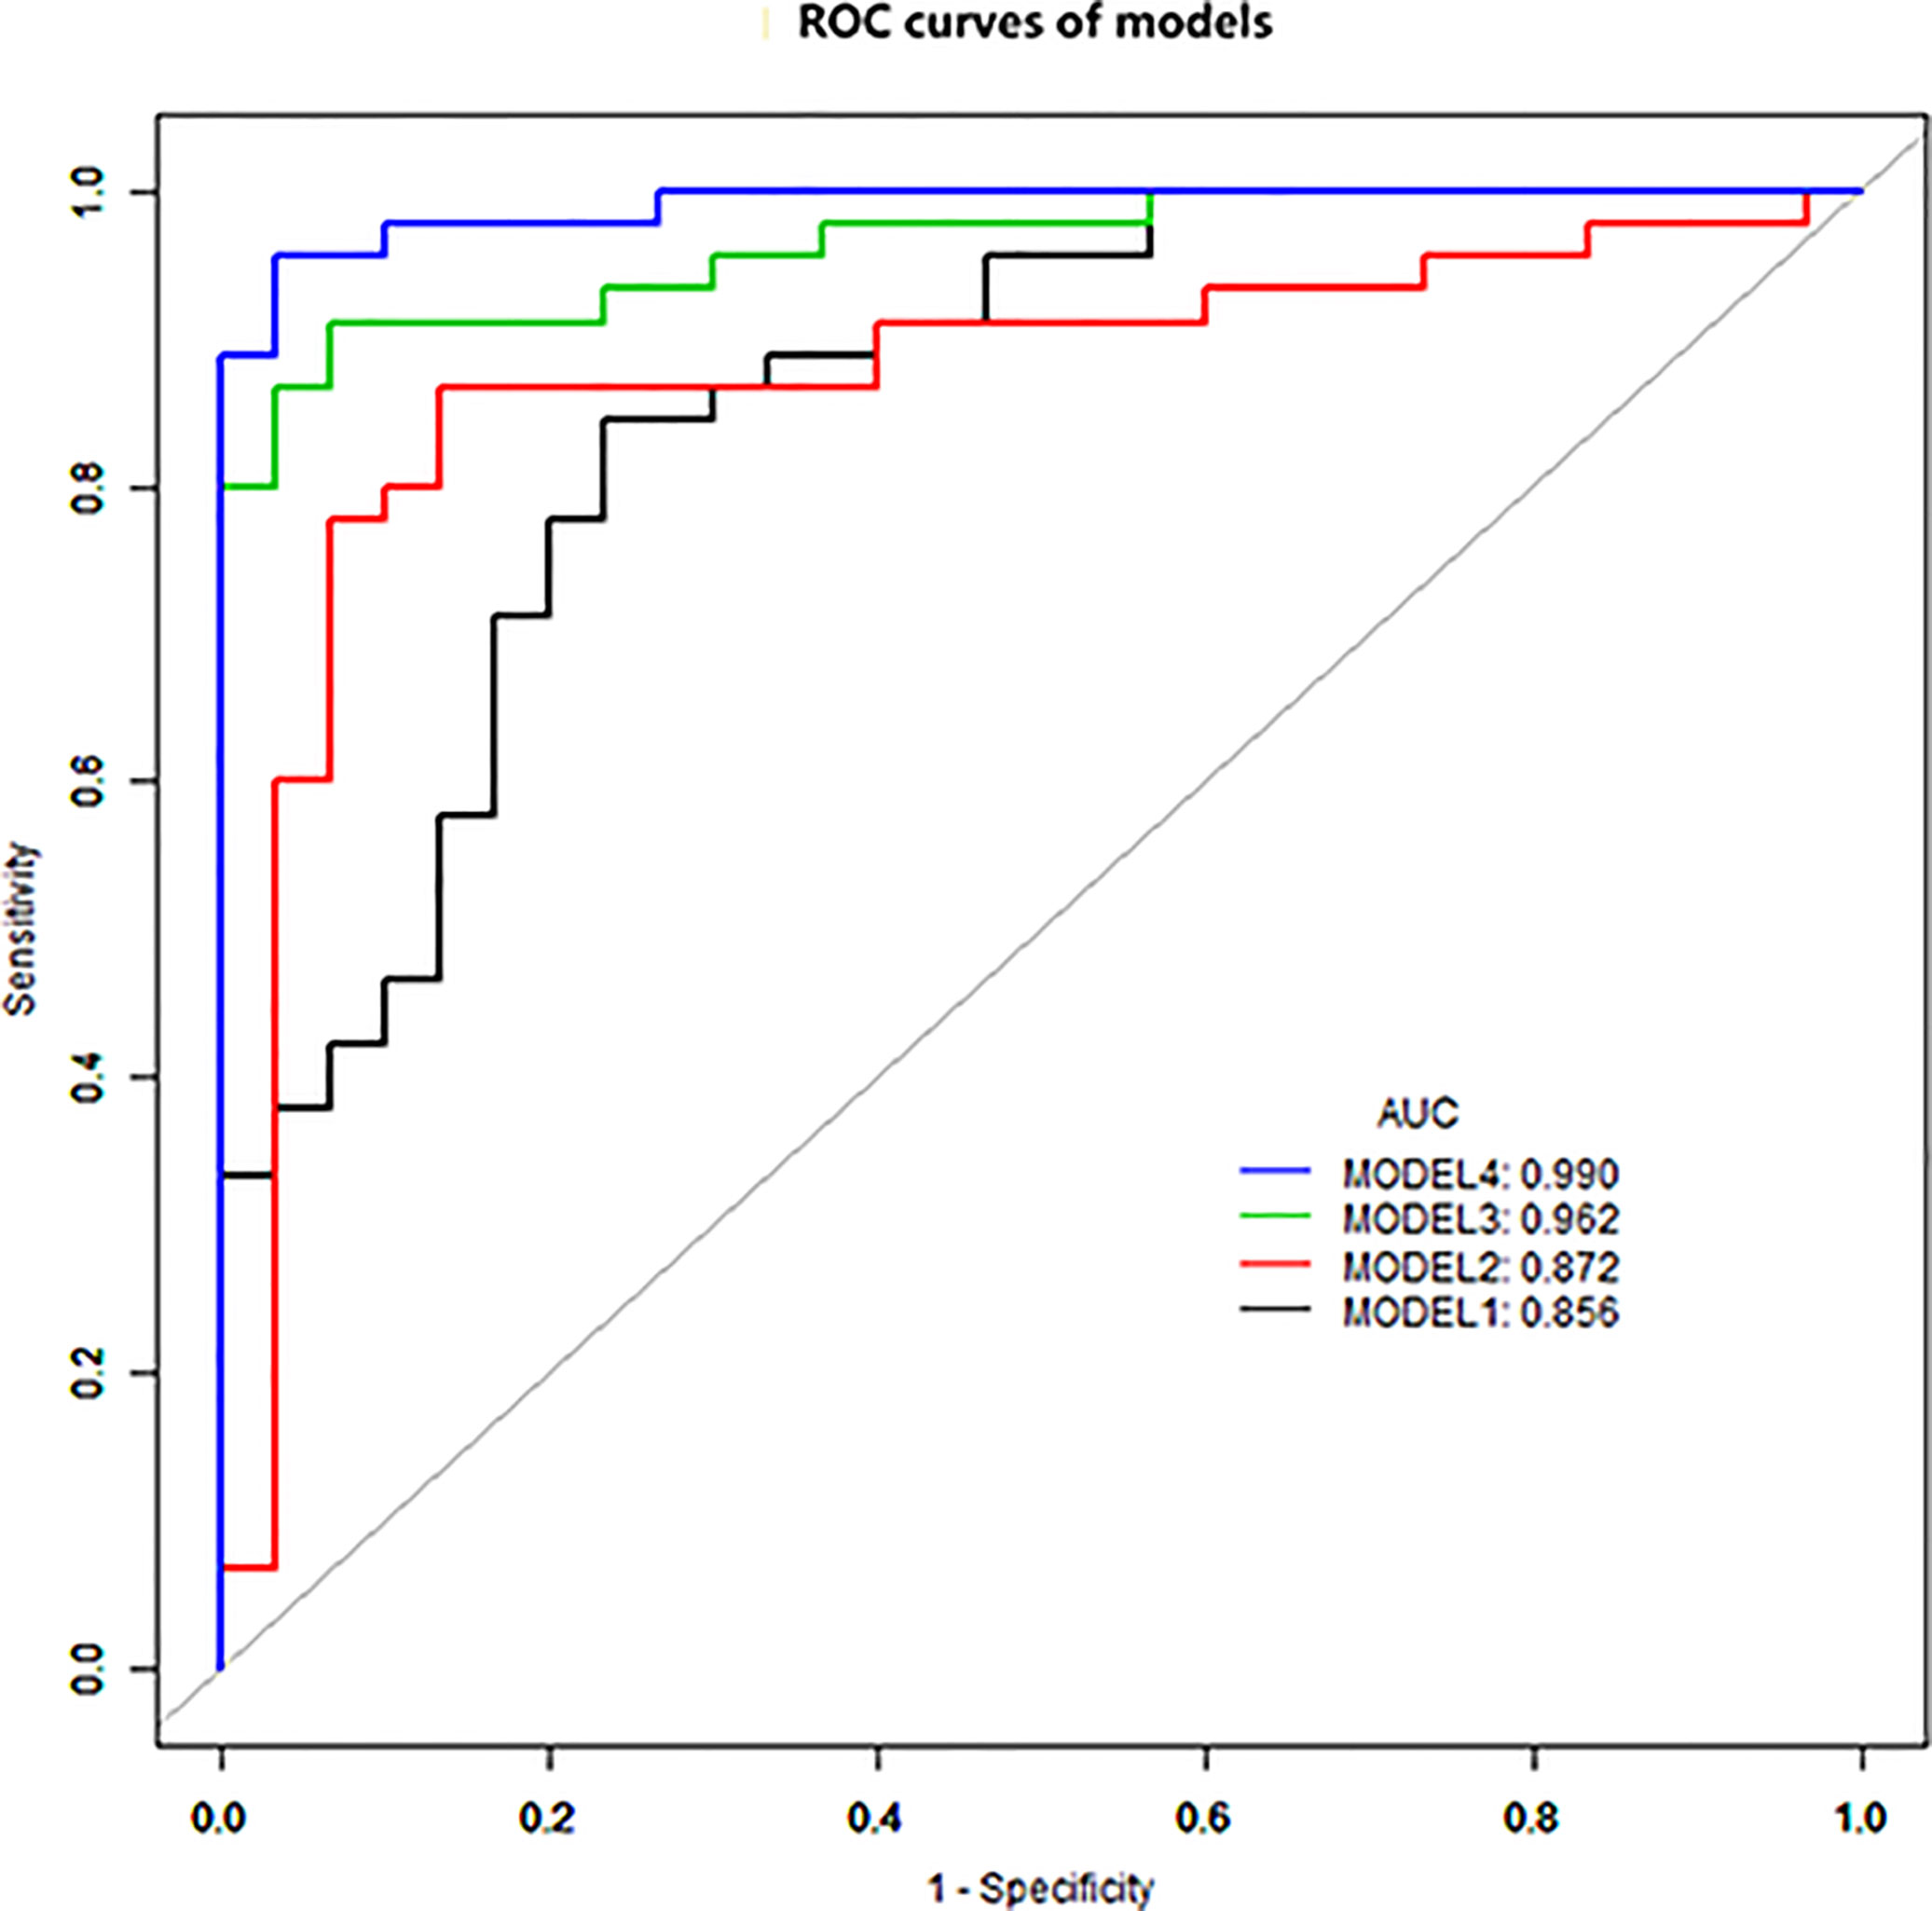
Figure 1 ROC curve analysis. Model 4 has the best diagnostic performance (AUC = 0.989), followed by models 3, 2, and 1 (AUC = 0.962, 0.872, and 0.856, all p < 0.05).
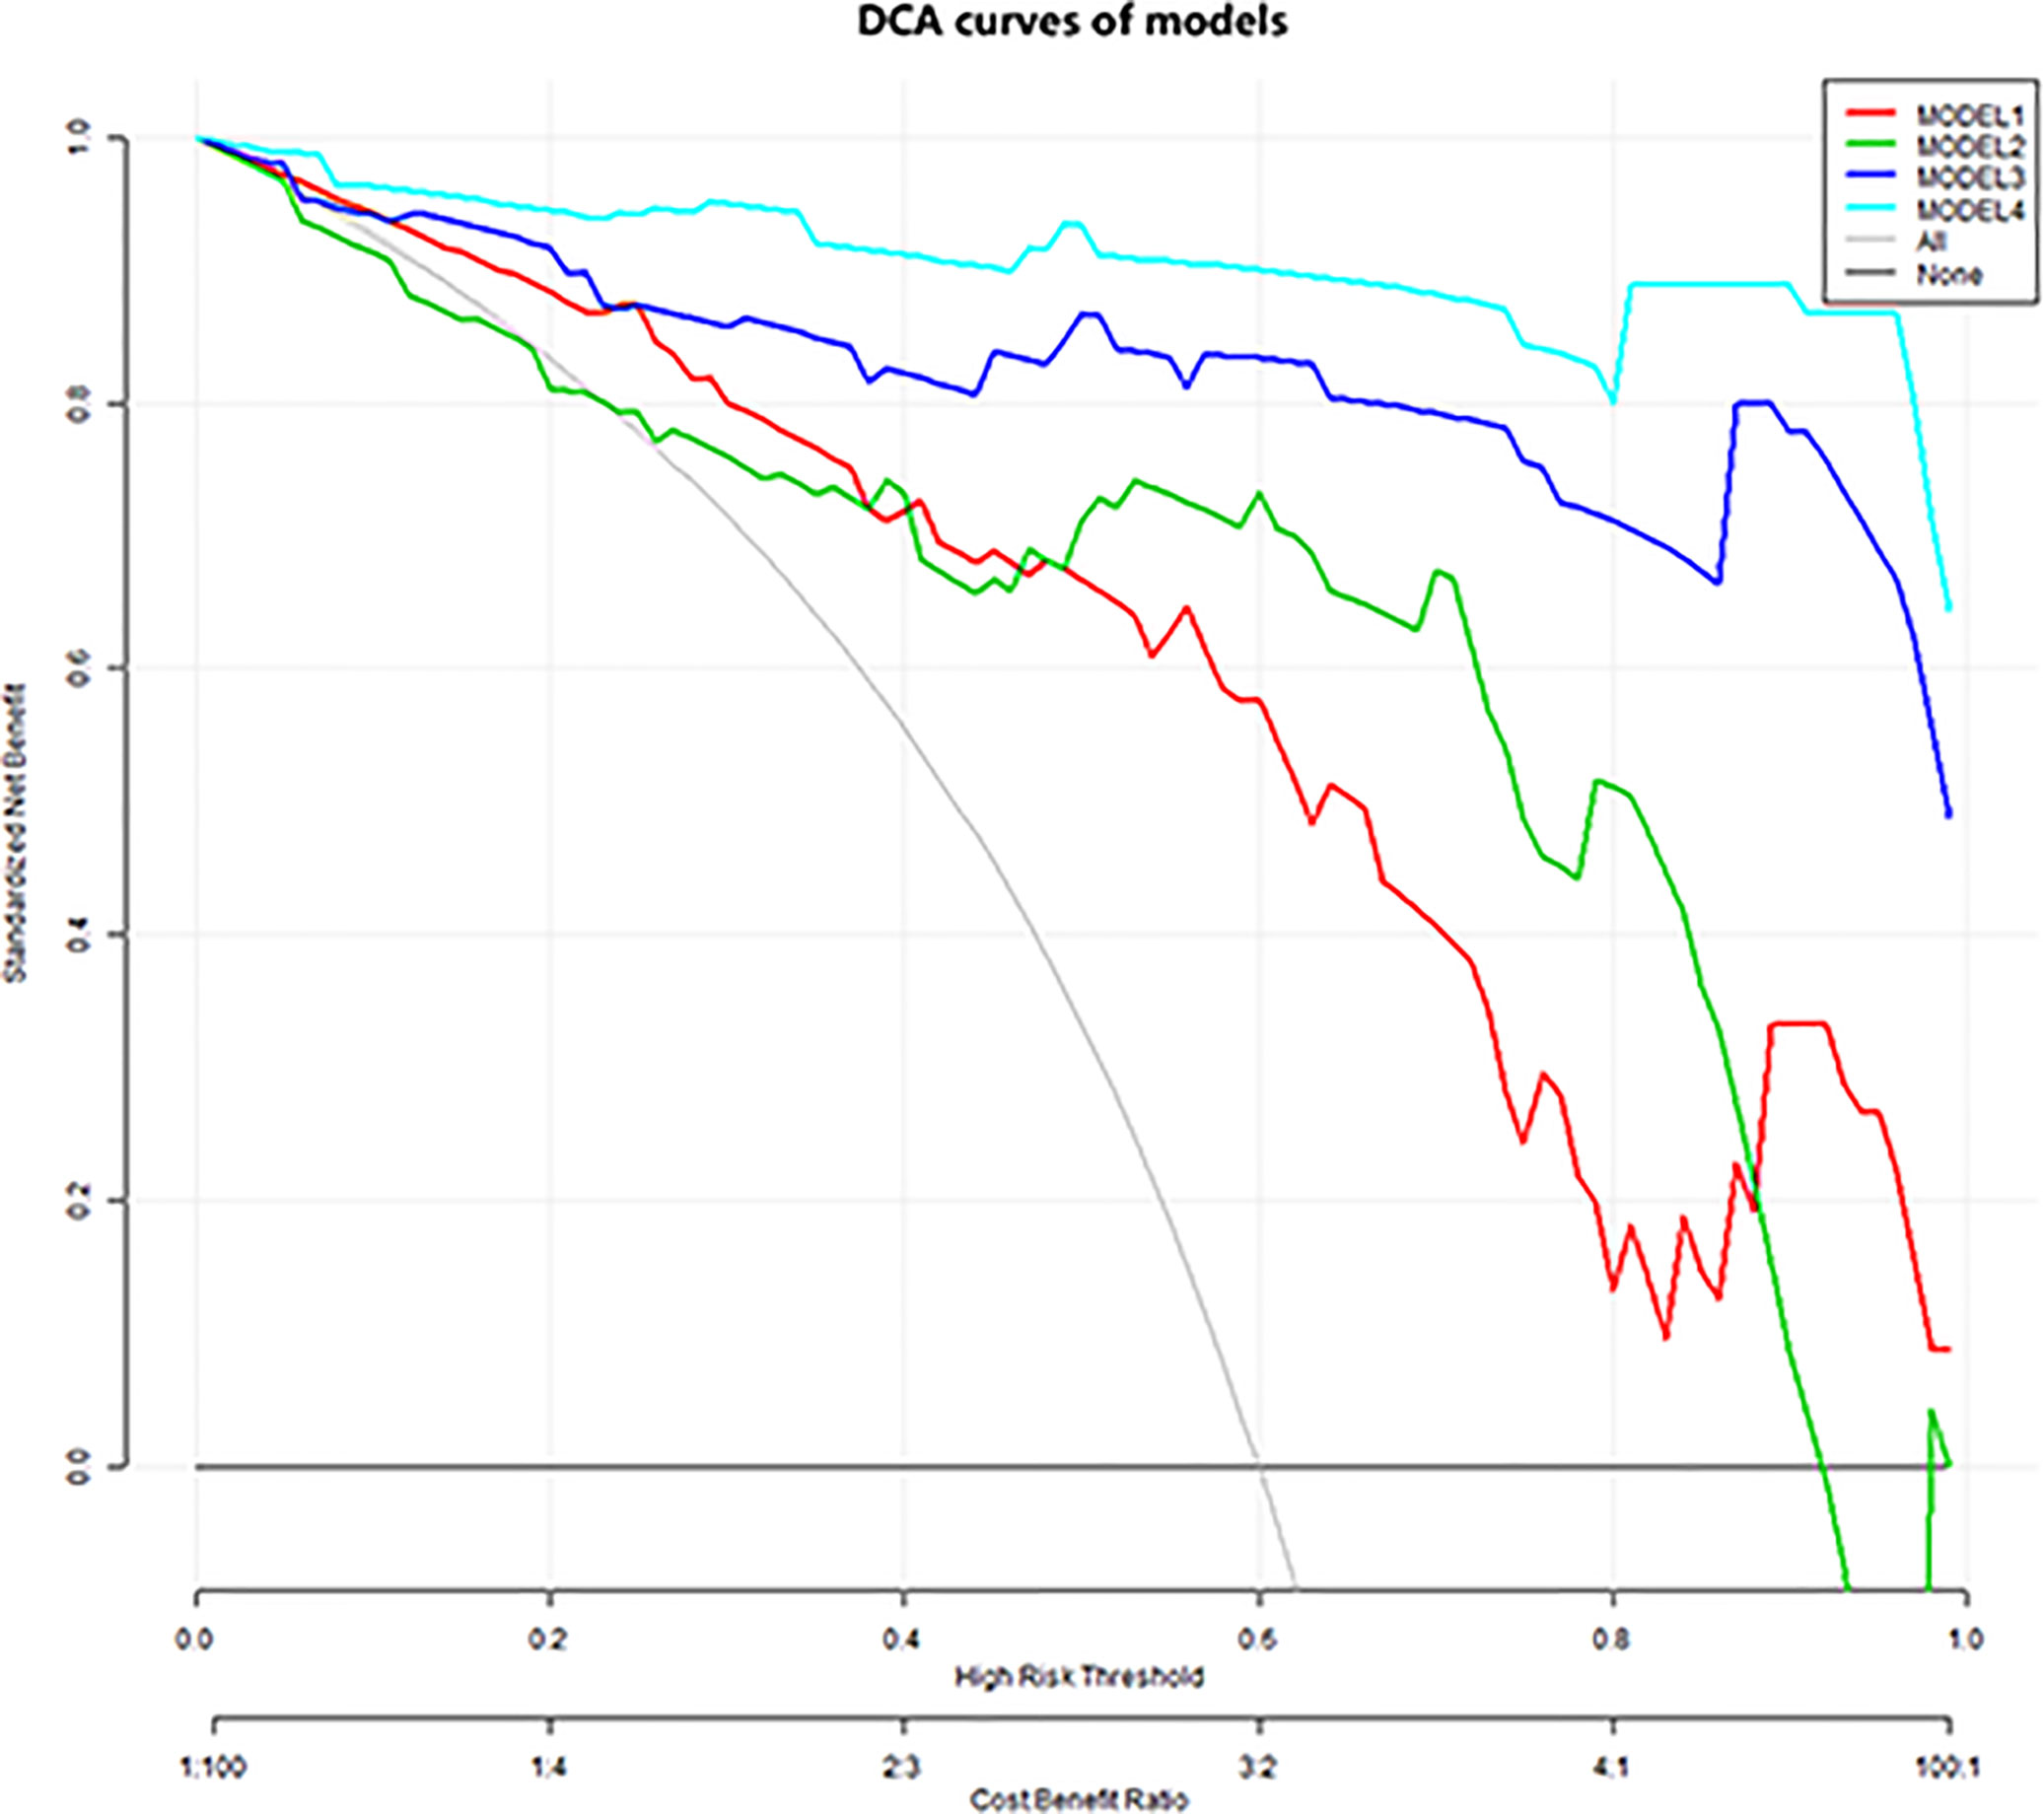
Figure 2 Decision curve analysis. The y-axis indicates net benefits to patients. The colorful lines represent the models, the gray line represents the hypothesis that all patients had breast cancer, and the black horizontal line represents the hypothesis that no patients had breast cancer. As showed in the curve, the net benefit of model 4 was better than that of the other models between threshold probabilities of 0% and 100%.
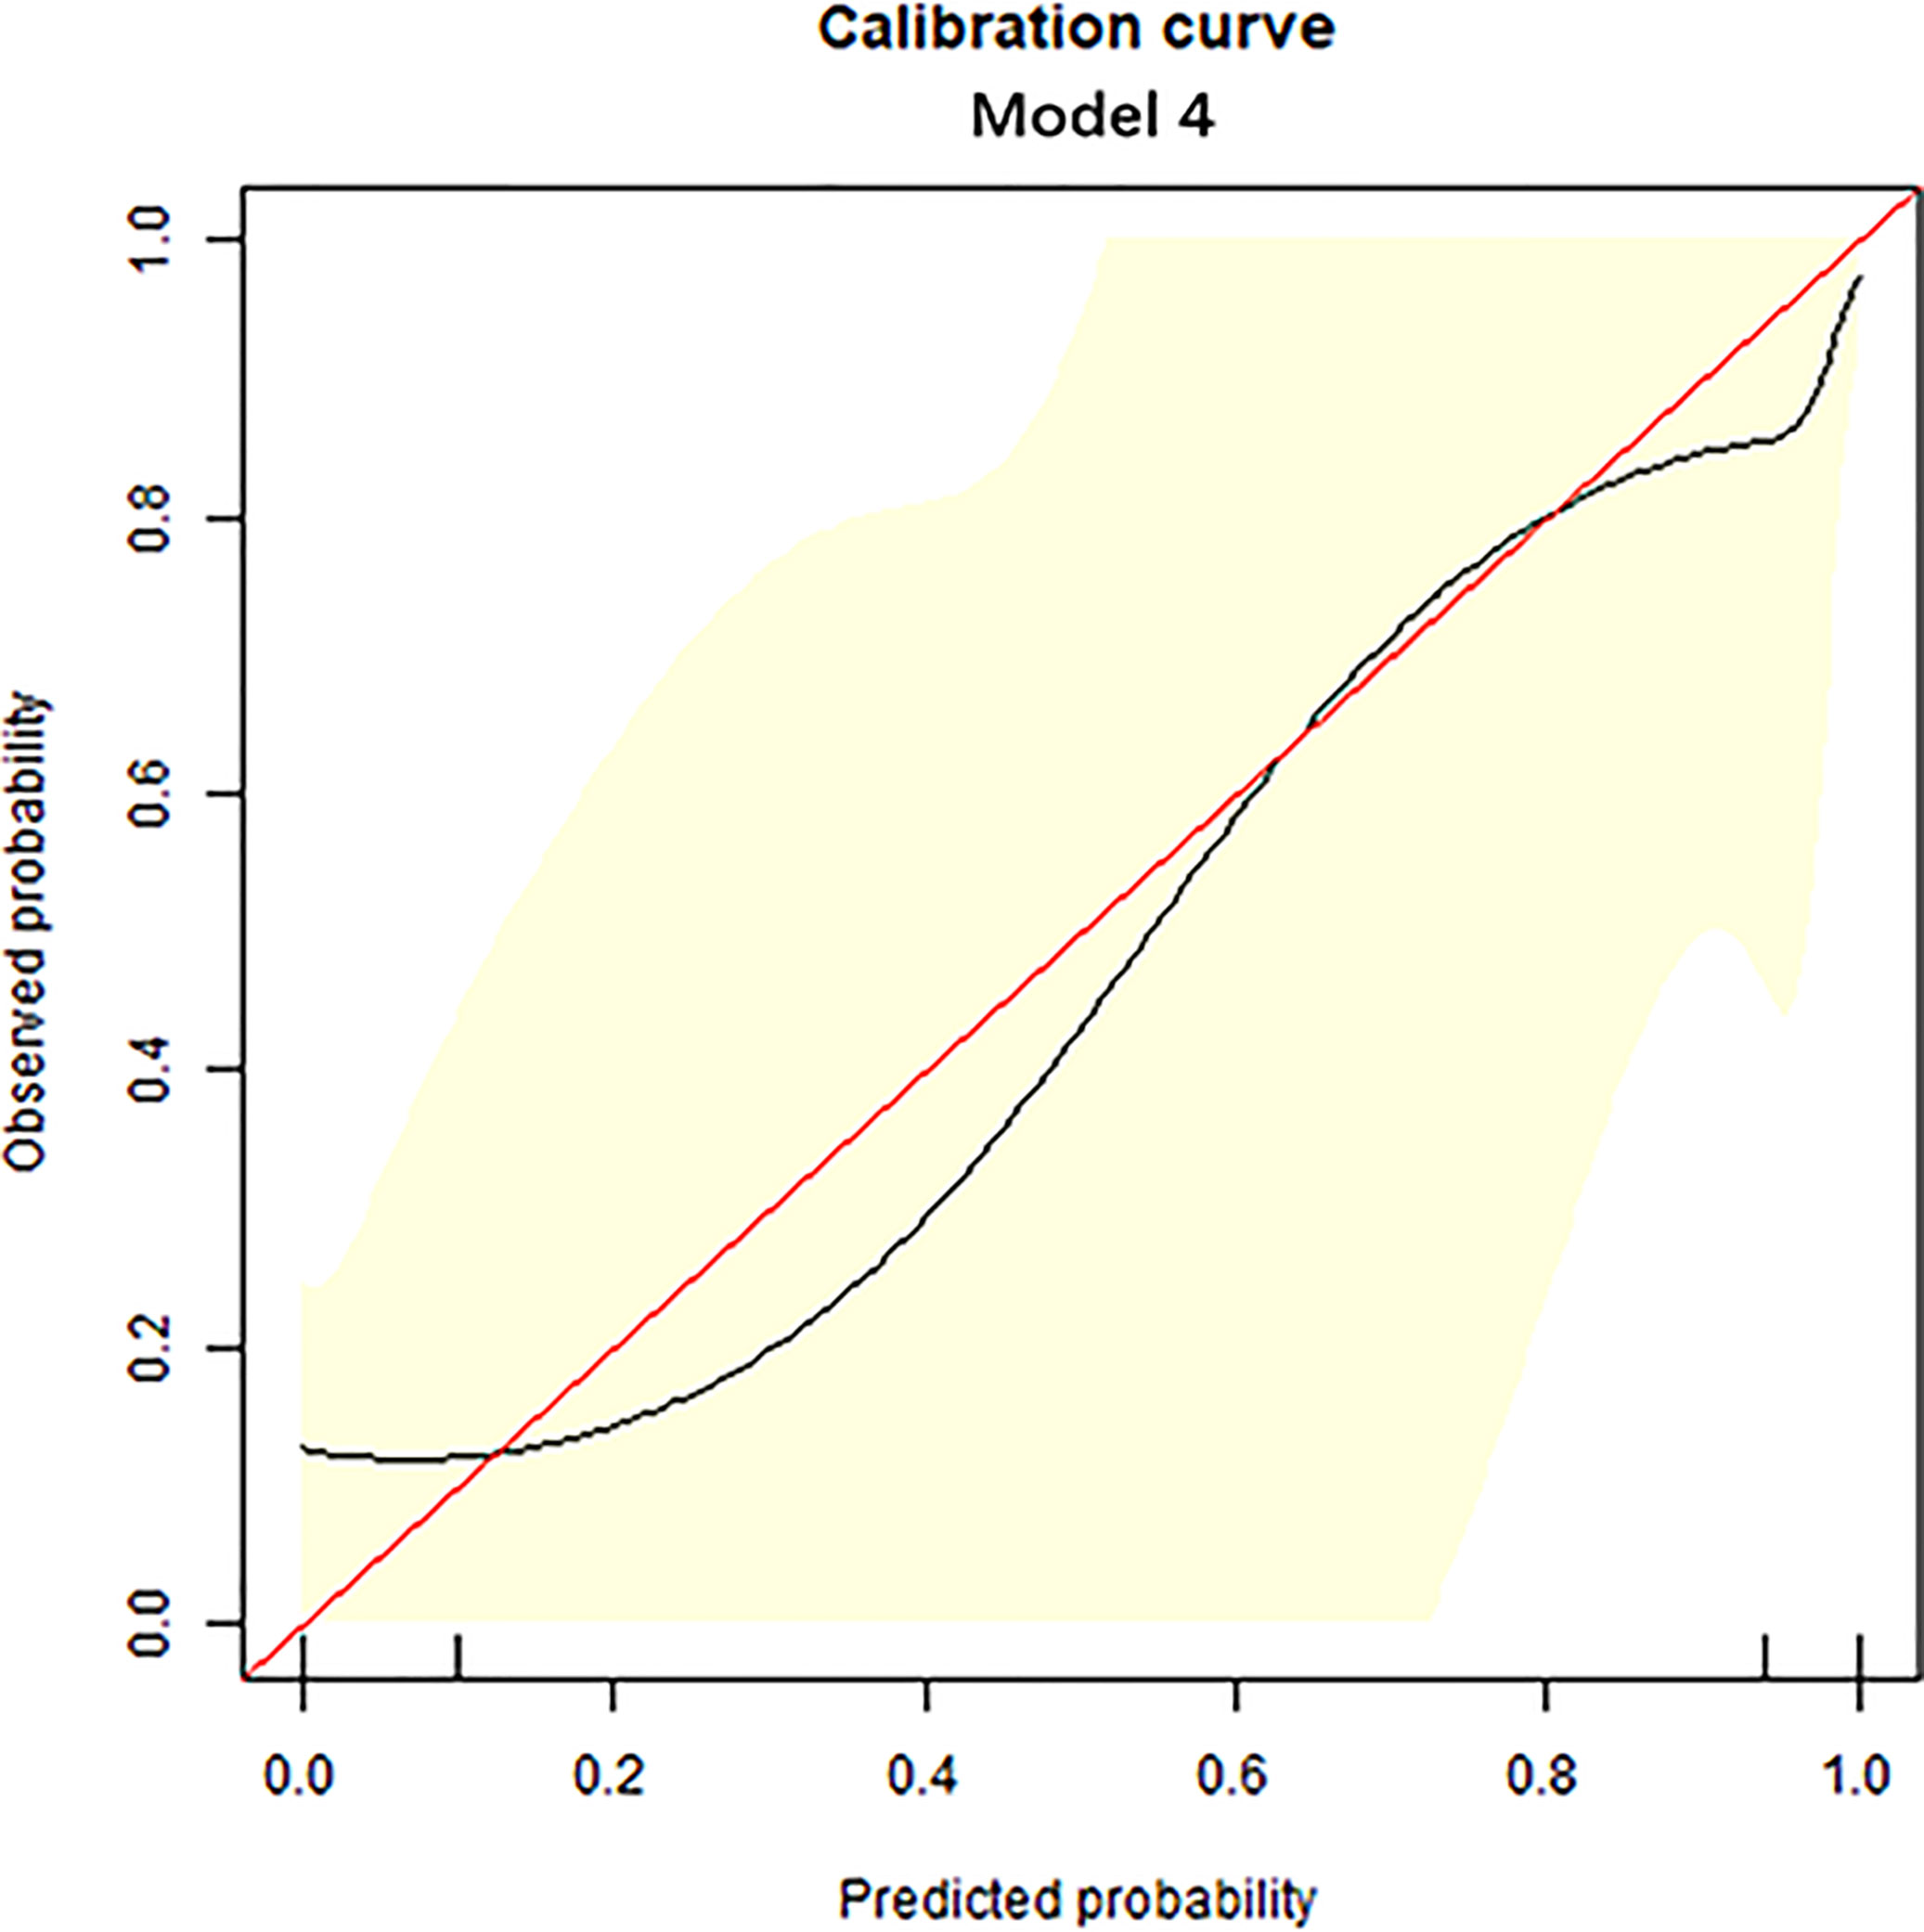
Figure 3 Calibration curve analysis. The calibration curve was used to show the relationship between the predicted value and the true value. The x-axis represents the predicted probability, while the y-axis represents observed probability. The red line represents the ideal calibration line, and the black line represents the predictive power of the nomogram. The closer the black line is to the red line, the better the predictive power of the model.
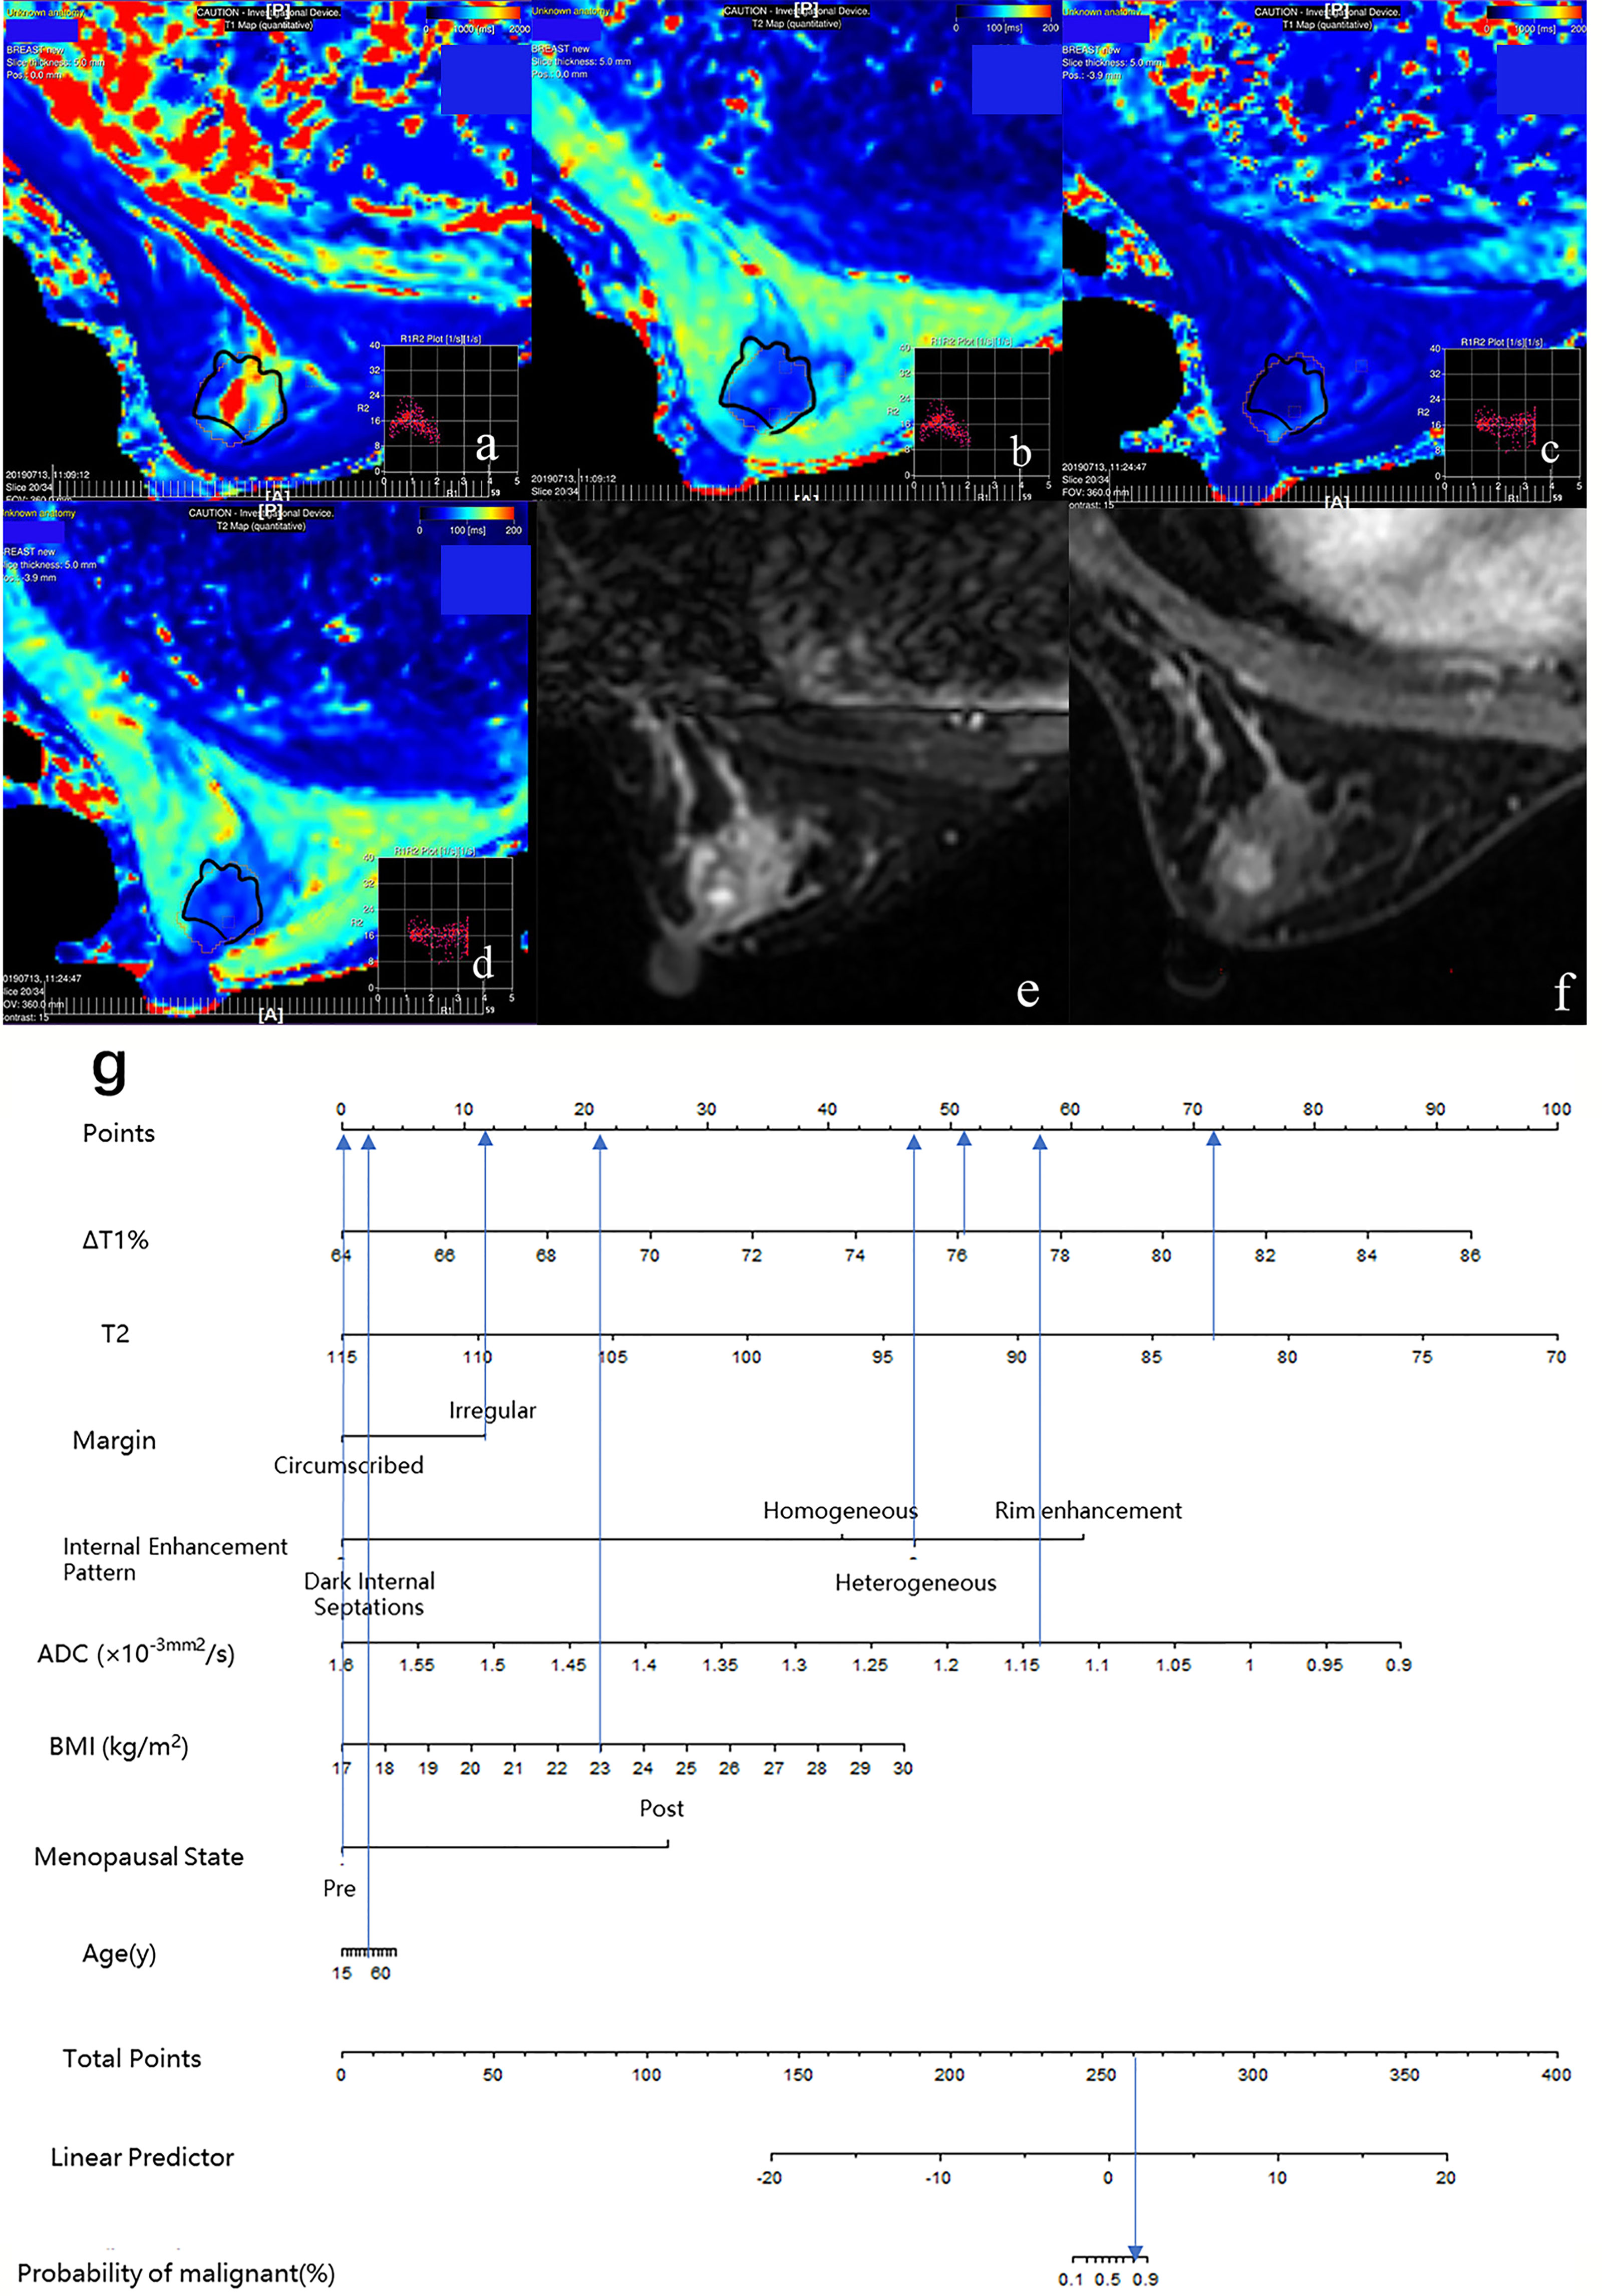
Figure 4 Case 1: Application of prediction model 4 with nomogram in distinguishing breast cancer and benign diseases in BI-RADS 4 lesions. Female, 46 years, premenopausal, BMI = 23, breast cancer, a–g. Image reconstruction with MAGiC, T1 map (A), T2 map (B), T1 enhancement map (C), T2 enhancement map (D), T2WI (E), DCE (F), Nomogram (G). T1 = 1,349.77 ms, T1+ = 323.05 ms, ΔT1% = 76.07, T2 = 83.01 ms, T2+ = 78.03 ms, ΔT2% = 6.00%, ADC = 1.14 × 10⁻³ mm 2/s, irregular margin, and heterogeneous internal enhancement pattern. Total points = 261.80. Probability of malignant = 82.00%.
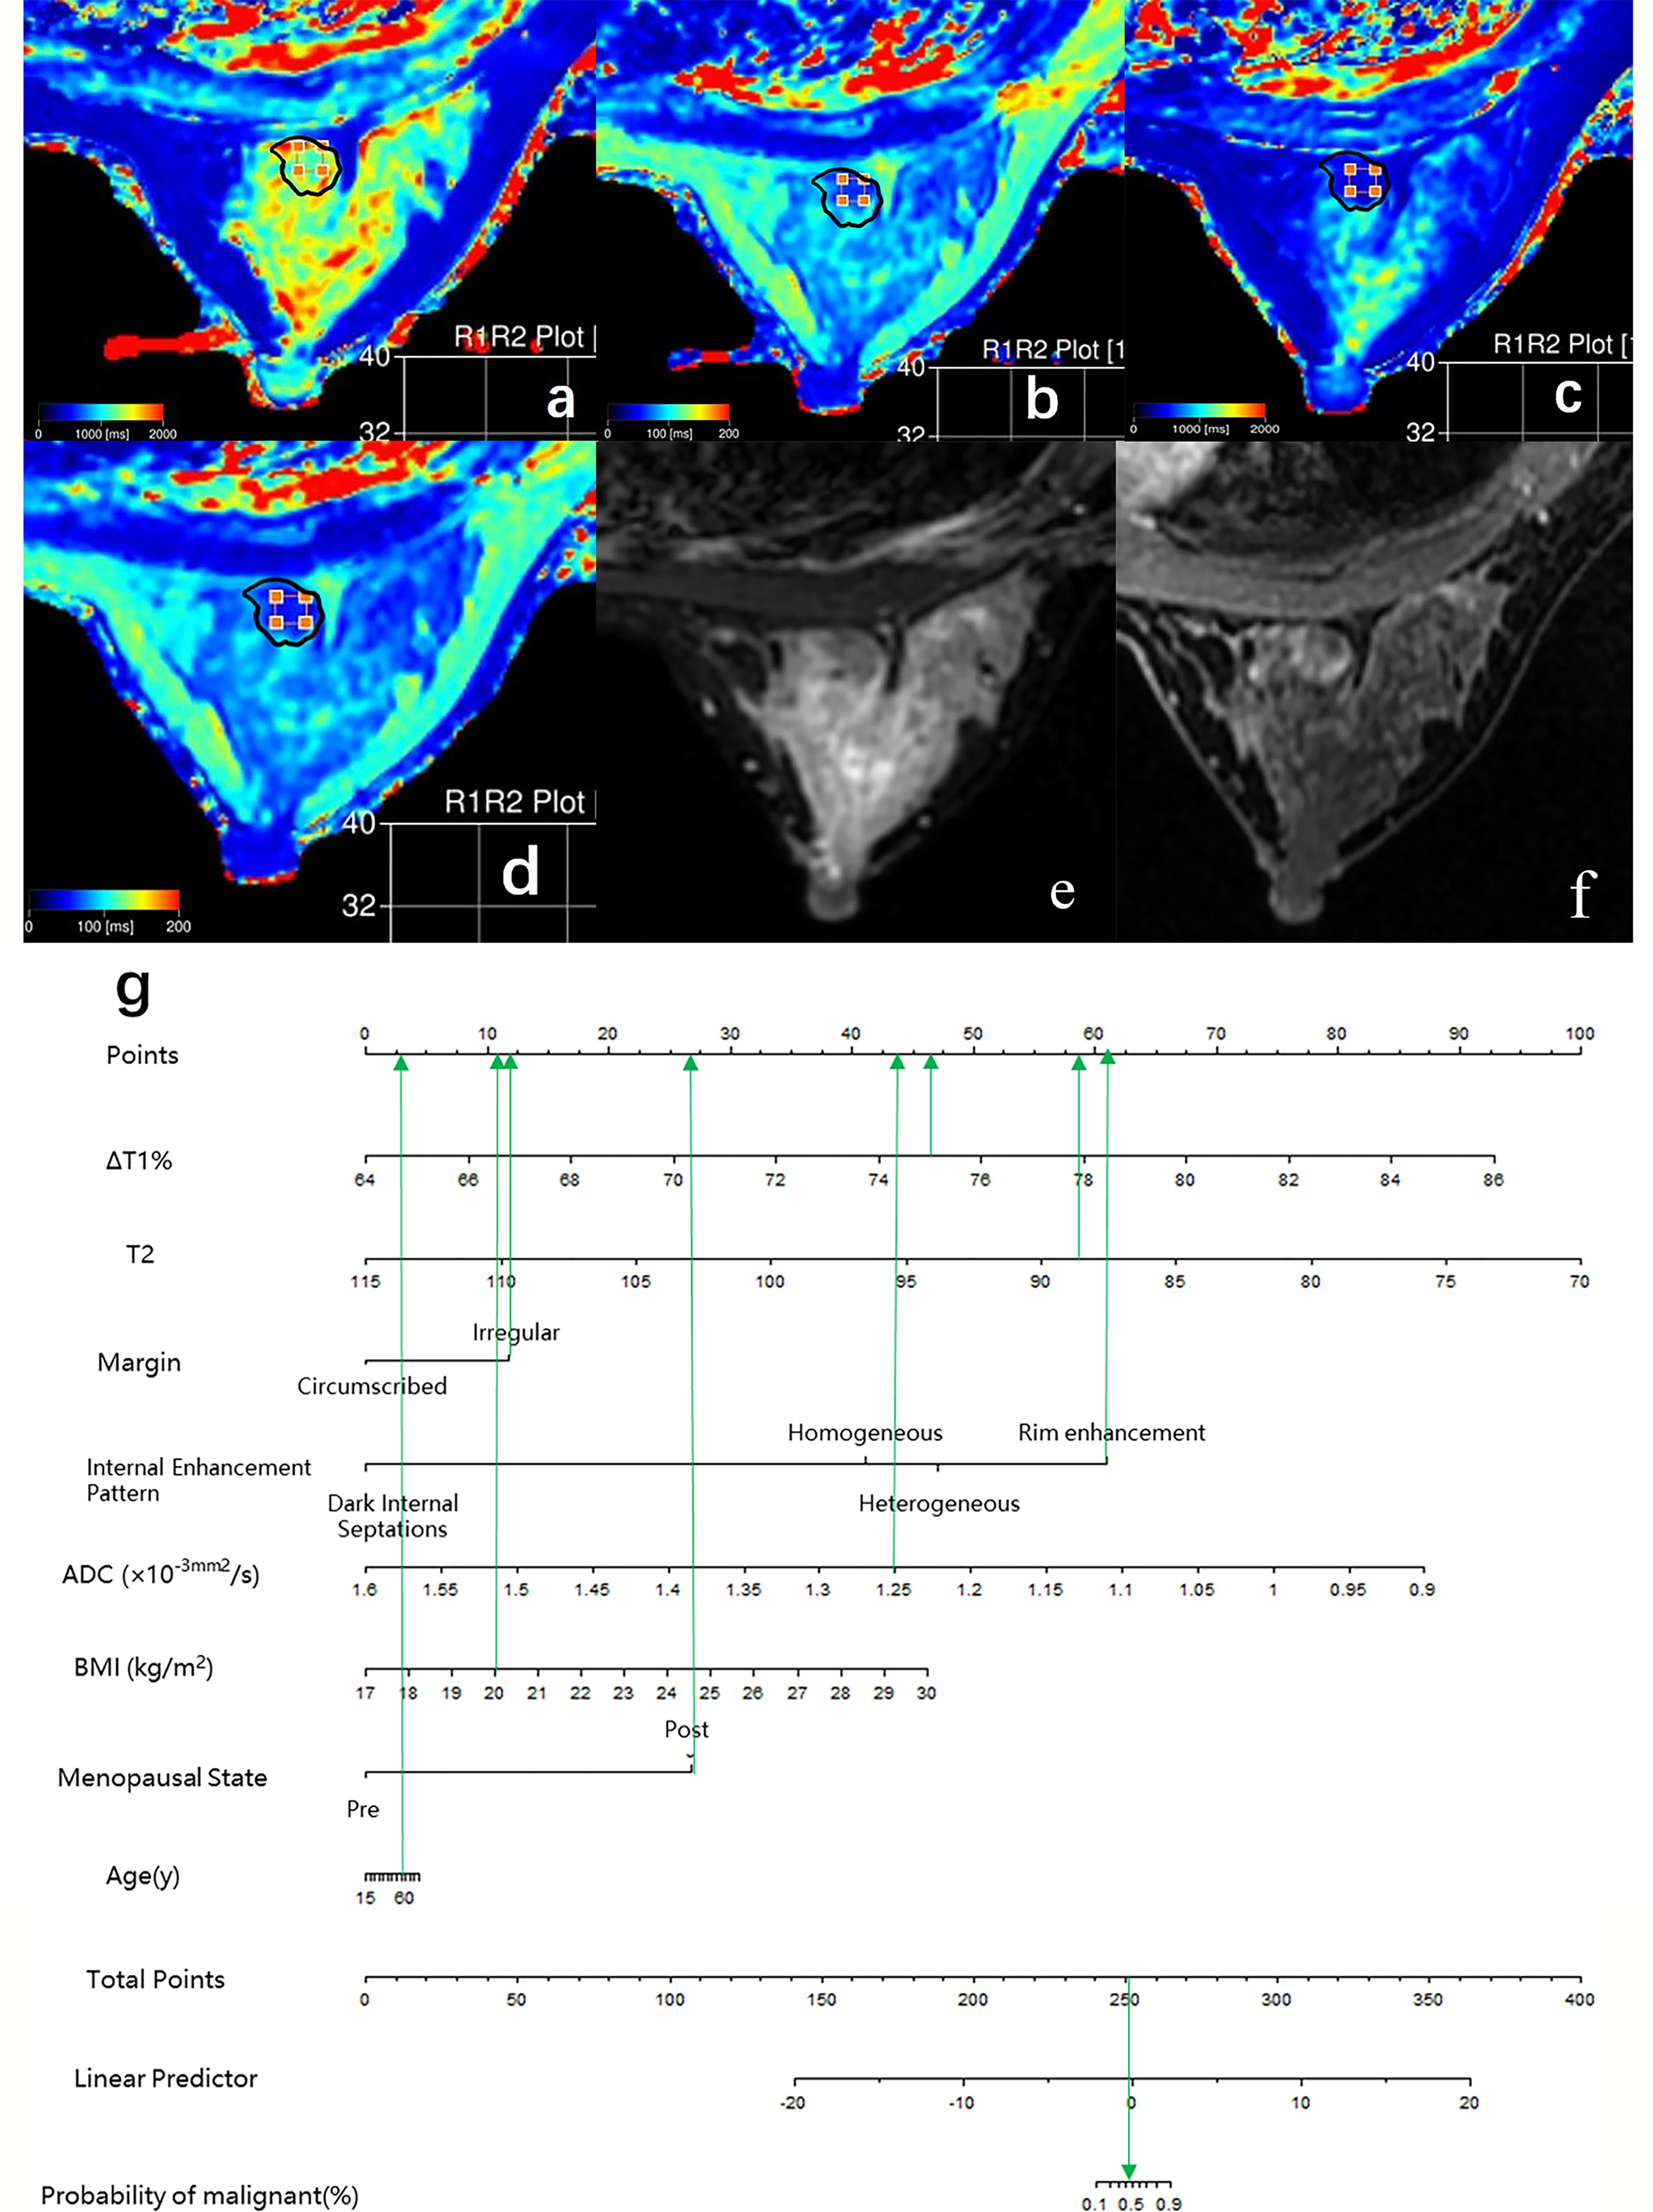
Figure 5 Case 2: Application of prediction model 4 with nomogram in distinguishing breast cancer and benign diseases in BI-RADS 4 lesions. Female, 50 years, postmenopausal, BMI = 20, fibroadenoma, a–g. Image reconstruction with MAGiC, T1 map (A), T2 map (B), T1 enhancement map (C), T2 enhancement map (D), T2WI (E), DCE (F), Nomogram (G). T1 = 1,275.43 ms, T1+ = 315.03 ms, ΔT1% = 75.30, T2 = 88.75 ms, T2+ = 83.90 ms, ΔT2% = 5.46%, ADC = 1.25 × 10⁻³ mm 2/s, irregular margin and rim enhancement pattern. Total points = 253.18. Probability of malignant = 46.00%.
Excellent intraobserver and interobserver agreement was noted for each parameter (intra/interclass coefficient (ICC)intra and ICCinter ≥ 0.995). The outcomes of the Bland–Altman plots and ICC were similar. All measurement points of the repeatability and reproducibility tests were within 2.5–97.5% limit of agreement (Appendix 5).
Discussion
This study comprehensively analyzed the role of clinical and imaging features in identifying breast BI-RADS 4 lesions. Combining the variables from DCE-MRI, DWI, and syMRI, the mpMRI model (model 3) showed a good diagnostic performance for breast BI-RADS 4 lesions in this study. The sensitivity and specificity of diagnosis could be improved by adding clinical features. The combination model (model 4) could help the patients in avoiding unnecessary breast biopsies.
Conventional MRI Characteristics in Differentiating Breast Cancer From Other Benign Diseases
The lesions that do not have typical malignant signs but sufficient suspicious manifestations are classified as BI-RADS 4. Kuhl et al. (25) pointed out that the following cases should be classified as BI-RADS 4. The shape (round or oval) and margin (circumscribed) of the lesion are not suspicious, but type III TIC curve (i.e., washout) is observed, or if the shape (irregular) and margin (irregular, spiculated) are suspicious, but kinetics enhancement is benign or borderline (the initial phase of TIC is slow to medium inflow, and the delayed phase is persistent enhancement or plateau, i.e., type I or II). Due to an overlap of the morphological and enhanced kinetic features, DCE-MRI cannot diagnose BI-RADS 4 lesions satisfactorily. In the current study, the AUC value of model 1, which combined the breast MRI descriptors recommended by BI-RADS lexicon, was only 0.856, and the sensitivity and specificity were 84.44% and 76.67%, respectively. The intraductal carcinoma in situ, low-grade invasive ductal carcinoma, and specific types of breast cancer accounted for about 57.78% of the lesions in this study. These low malignancy lesions did not show typical malignant signs, such as spiculated margin and fast heterogeneous contrast enhancement followed by a washout. On the contrary, fibroadenoma with rich blood supply or mucoid degeneration, intraductal papilloma, atypical ductal hyperplasia (ADH), and fibroadenomatous hyperplasia exhibited suspicious signs, such as irregular shape or margin, heterogeneous or rim enhancement pattern, and II or III TIC curve. These phenomena might lead to false positives and false negatives in the diagnosis.
Conventional MRI features have limitations in the diagnosis of BI-RADS 4 lesions. The current research showed that only irregular margins and the heterogeneous internal enhancement pattern on DCE-MRI were significantly associated with a breast cancer diagnosis. Lesions with irregular margins presented a 4.6-fold risk of malignancy [odds ratio (OR) = 1/0.217; 95% confidence interval (CI): 1.26–16.86] than regular lesions (p = 0.021). Lesions with heterogeneous internal enhancement pattern presented a 6.2-fold risk of malignancy (OR = 1/0.161; 95% CI: 1.01–38.17) than lesions with homogeneity (p = 0.049). We also observed that the malignant group showed more rim enhancement patterns than the benign group (31.11% vs. 20.00%). In addition, the dark internal septations only appeared in benign lesions, which were mainly characterized in the fibroadenoma with irregular margin, fast or medium enhancement in the initial phase of DCE, and plateau or washout in the delayed phase.
Quantitative MRI Characteristics in Differentiating Breast Cancer From Other Benign Diseases
ΔT1%, T2, and ADC were discovered as independent variables for breast cancer in the multivariable logistic regression analysis. Thus, the degree of diffusion restriction of free water molecules and the ADC values are valuable in differentiating between benign and malignant lesions (6, 26–28). Due to continuous cell proliferation, the increased synthesis of macromolecular substances, such as proteins in the cytoplasm, and the release of a large number of necrotic substances, the extracellular space reduces, the content of bound water increases, and the diffusion of free water molecules is restricted. These factors decrease the ADC value of breast cancer. A meta-analysis of 14 articles showed that the cutoff range of ADC for differentiating between benign and malignant breast lesions was 0.92–1.61 × 10⁻³ mm 2/s (6), while another meta-analysis suggested a threshold of 1.23×10⁻³ mm 2/s (29). Also, the ADC value of the malignant lesion group was significantly lower than that of the benign lesion group (1.10 vs. 1.25 × 10⁻³ mm 2/s, p < 0.001). The best threshold of ADC is 1.195 × 10⁻³ mm (2)/s in our study, which is consistent with that of the previous study.
Furthermore, the difference in cell composition and microstructure also affects the magnetization characteristics of the tissue, which might be characterized by the relaxation time (T1 and T2). Some studies have shown that the difference in relaxation time was related to the content of free water (30–33). The higher the free water content, the longer the relaxation time. As described above, under the combined action of various factors, the ratio of free water and bound water is out of balance, resulting in decreased free water content and relaxation time (20, 21, 31). Previous studies have shown that relaxation times could distinguish between the breast neoplasms and other diseases or normal tissues, where the T2 relaxation time may be more distinctive than T1 (34). Reportedly, the T2 value of breast cancer is about 75.00–84.75 ms, which is lower than that of benign lesions (6, 21, 30, 35). Due to the difference in field strength, acquisition method, ROI, and pathological type, the T2 values obtained in each study were not identical but showed a similar trend. Liu et al. (20) showed that the T2 value of breast cancer was significantly lower than that of benign lesions (82.69 ms vs. 95.48 ms). Marina et al. (17) found that the T1/T2 rate of malignant lesions was significantly higher than that of benign lesions. The current study also showed that the T2 value of breast cancer was significantly lower than that of benign lesions (84.63 ms vs. 92.57 ms, p < 0.001), which was consistent with similar research results. With each unit (ms) increase in T2 value, the odds of the lesion being cancer decreased significantly (CI: 0.660–0.914; p = 0.002). Our results were consistent with those of Jung et al. as both studies used syMRI for imaging at 3.0 T, and a similar method was used for ROI delineation; therefore, the data were similar (84.34 ms vs. 84.75 ms).
Previous quantitative breast studies focused on the relaxation time before the injection of contrast agent (18, 20–23). One of the highlights of the present study is that we measured the T1 and T2 values pre- and post-contrast injection and calculated the relative change in T value between the two injections (ΔT%) to quantify the enhancement degree of the lesions. This method reduced the influence between different scanning devices, reflected the enhancement degree of the lesion, and provided more information than plain scanning. Especially for BI-RADS type 4 lesions, this method differentiated between benign and malignant lesions. Typically, breast cancer shows a rapid and stronger signal intensity increment after injection of contrast agents compared to most benign diseases (23, 36), which was confirmed by our study. ΔT1% in the malignant lesions group was significantly higher than that in the benign group (77.18% vs. 74.20%, p < 0.001). With each unit increase in ΔT1%, the odds of the lesion being cancer increased by 1.95-fold (OR = 1.947; 95% CI: 1.233–3.073; p = 0.004). The varied microcirculation structure of the tumor determines the difference in relaxation time before after contrast injection. A previous study has shown that breast cancer releases vascular endothelial growth factor (VEGF) and induces the formation of a large number of new capillary networks (37). These immature capillaries are disordered and tortuous with large diameter and high wall permeability, resulting in a large volume of contrast-carrying blood flow into the tumor. Therefore, breast cancer shows a shorter relaxation time value and a higher enhancement ratio.
Furthermore, we explored the role of relaxation time in the evaluation of BI-RADS 4 lesions. In terms of the contribution of a single variable to the diagnosis of breast cancer, T2 and ΔT1% were equivalent to ADC values (AUC = 0.798, 0.793, and 0.818; p > 0.05). The relaxation model (model 2) combined with T2 and ΔT1% showed a higher diagnostic performance than ADC value alone (AUC = 0.872 vs. 0.818, p = 0.046). The comparison between relaxation time and conventional MR features revealed that model 2 (relaxation time model) had a larger AUC than model 1 (0.872 vs. 0.856, p = 0.814) (BI-RADS model), albeit not significantly. However, when the acquisition time of syMRI and conventional MRI is similar—the total time of T1WI, T2WI, and DCE-T1WI is 10.3 min, the syMRI is 10.2 min—this finding is encouraging. SyMRI can obtain the synthetic contrast-weighted images of T1 and T2 pre- and post-contrast injection, which exhibit the shape and enhancement kinetic characteristics of lesions, and thus quantitative images for measuring a relaxation time. Thus, the qualitative and quantitative features could be obtained in 10 min using syMRI. Compared to the traditional breast MRI, this method simplifies the operation process of radiologists and provides additional quantitative relaxation information for differential diagnosis.
Since various imaging features can provide different aspects of information, the combination of multiple MRI features is called mpMRI, which has the potential to improve breast disease assessment and is being increasingly implemented in clinical settings (11, 14, 38). Several studies have proven that mpMRI combined with DCE-MRI, DWI, and MRS can further improve the specificity in the assessment of BI-RADS 4 lesions and avoid up to 36% of breast biopsies (29, 39–41). Our study showed that mpMRI (model 3) with DCE-MRI, DWI, and syMRI achieved a significantly higher diagnostic performance (0.962) compared to model 1 (0.856), model 2 (0.872), and ADC alone (0.818). These findings have gained increasing attention from the researchers interested in the role of MRI in the subdivision of BI-RADS 4 lesions. The mpMRI model has better diagnostic performance and provides objective quantitative parameters that facilitate the subdivision of BI-RADS 4 lesions.
Clinical Characteristics in Differentiating Breast Cancer From Other Benign Diseases
Since the mpMRI model is useful, we considered adding clinical features to explore whether it could further improve the diagnostic performance. Several studies have shown that age, family history, obesity, and menopause are risk factors for breast cancer (42–44). The current study showed that age and BMI are significantly positively associated with the risk of breast cancer. With each unit (age, kg/m 2) increase in age and BMI, the odds of the lesion being cancer decreased significantly (95% CI: 1.007–1.119; 1.047–1.603; p = 0.026, 0.017). The risk of breast cancer in postmenopausal patients (OR = 1/0.217; 95 CI%: 1.26–16.86) was 3.95-fold higher than that in premenopausal patients (p = 0.032).
Previous studies have shown that endogenous steroid hormone (mainly estrogen) levels of sex steroids are associated with the risk of breast cancer and sustained tumor growth in women (45). Compared to the benign breast tissue, there is an increased uptake of estradiol by breast cancer cells from the circulation accompanied by increased androgen conversion in postmenopausal breast cancer tissue (46–49). In addition, a large amount of aromatase in adipose tissue further promotes the conversion of androgen. Both factors elevate the estrogen level in breast tissue, providing an optimal environment for the proliferation and growth of breast cancer cells and explaining the current results.
Prediction Models in Differentiating Breast Cancer From Other Benign Diseases
With the addition of clinical features, the mp combination model (model 4) obtained the highest diagnostic performance (AUC = 0.989, all p < 0.05), and the sensitivity, specificity, PPV, NPV, and accuracy were improved to varying degrees. DCA was performed to evaluate the clinical utility of the models. As shown in Figure 2, the net benefit of model 4 was better than that of other models between a threshold probability of 0% and 100%. In order to increase the applicability in the clinical setting, this model was presented with a nomogram. Then, the malignancy probability of each lesion could be quantified by calculating the scores of each variable and adding these to obtain a total score. Thus, the contribution of each variable to breast cancer could be reflected intuitively and comprehensively. Finally, to verify the calibration of the nomogram, we applied a calibration curve. As shown in Figure 3, the true and the predicted curves are closely connected, indicating optimal predictability of the combined model in breast cancer.
Limitations
Although the final results are gratifying, the present study has some limitations. First, the model established by multivariable logistic regression analysis is prone to overfitting, which could be addressed by setting up an independent model validation group but was limited by the sample size. Therefore, we adopted a bootstrap resampling method (1,000 times) for internal cross-verification and obtained satisfactory results. Nonetheless, the applicability of this model needs further verification. Second, although three-dimensional (3D) ROI contains a large amount of information, delineating two-dimensional (2D) ROI is efficient and clinically applicable considering the clinical work. In addition, similar studies have pointed out that for MAGiC images, 2D ROI from the single section of the lesion has better clinical efficacy than partial section, three sections, and whole lesion (50). Hence, we drew the 2D ROI along the margin of the tumor on a single section image with maximum tumor diameter. Third, to ensure the consistency and accuracy of the ROI delineation, only the lesions that appear as masses were included in this study. In future studies, we will explore the diagnostic value of relaxation time in non-mass lesions. Fourth, compared to the majority of invasive ductal carcinoma and fibroadenoma, our study is limited to a small number of ductal carcinoma in situ (DCIS), intraductal papilloma (IDP), and adenosis. This might limit the general applicability of the model in these subgroups.
Conclusion
In conclusion, the mpMRI model with DCE-MRI, DWI, and syMRI is a robust tool for evaluating the malignant findings in BI-RADS 4 lesions. The addition of clinical features can further improve the diagnostic performance of this model.
Data Availability Statement
The raw data supporting the conclusions of this article will be made available by the authors, without undue reservation.
Ethics Statement
The study was approved by the Institutional Ethics Board of Yunnan Cancer Hospital (No. KY2019102). The patients/participants provided their written informed consent to participate in this study.
Author Contributions
Conception and design: SS. Administrative support: YD and CL. Provision of study materials or patients: DZ and JZ. Collection and assembly of data: SS and LN. Data analysis and interpretation: SS, LN, and YL. Manuscript writing: All authors. Final approval of manuscript: All authors. All authors contributed to the article and approved the submitted version.
Funding
This work was supported by (I) the Science and Technology Project of Yunnan Provincial Department of Science and Technology—Big Data Research on Breast Cancer Heterogeneity Using Magnetic Resonance Image Texture Analysis. NO.2018FE001(-066) and (II) the Scientific Research Project of Yunnan Provincial Department of Education—Multimodal functional imaging markers to predict the normalization of breast cancer tumor blood vessels. No. 2019J1280.
Conflict of Interest
The authors declare that the research was conducted in the absence of any commercial or financial relationships that could be construed as a potential conflict of interest.
Publisher’s Note
All claims expressed in this article are solely those of the authors and do not necessarily represent those of their affiliated organizations, or those of the publisher, the editors and the reviewers. Any product that may be evaluated in this article, or claim that may be made by its manufacturer, is not guaranteed or endorsed by the publisher.
Supplementary Material
The Supplementary Material for this article can be found online at: https://www.frontiersin.org/articles/10.3389/fonc.2021.699127/full#supplementary-material
Supplementary Table 1 | Histopathological Subtypes of the Patient Population.
Supplementary Table 2 | Repeatability of relaxation time measurements by the same observer & Reproducibility of relaxation time measurements by two observers.
Supplementary Figure 1 | The imaging protocol of MRI scanning.
Supplementary Figure 2 | The flowchart of patient enrollment.
Supplementary Figure 3 | Nomogram for prediction of breast cancer.
References
1. American College of Radiology ACR BI-RADS Ultrasound. ACR Breast Imaging Reporting and Data System, Breast Imaging Atlas. 5th ed. Reston VA: American College of Radiology (2013) p. 123–32.
2. Bennani-Baiti B, Dietzel M, Baltzer PA. MRI for the Assessment of Malignancy in BI-RADS 4 Mammographic Microcalcifications. PloS One (2017) 12(11):e0188679–e0188679. doi: 10.1371/journal.pone.0188679
3. Hrkac Pustahija A, Ivanac G, Brkljacic B. US and MRI in the Evaluation of Mammographic BI-RADS 4 and 5 Microcalcifications. Diagn Interventional Radiol (Ankara Turkey) (2018) 24(4):187–94. doi: 10.5152/dir.2018.17414
4. Stehouwer BL, Merckel LG, Verkooijen HM, Peters NH, Mann RM, Duvivier KM, et al. 3-T Breast Magnetic Resonance Imaging in Patients With Suspicious Microcalcifications on Mammography. Eur Radiol (2014) 24(3):603–9. doi: 10.1007/s00330-013-3029-1
5. Strobel K, Schrading S, Hansen NL, Barabasch A, Kuhl CK, et al. Assessment of BI-RADS Category 4 Lesions Detected With Screening Mammography and Screening US: Utility of MR Imaging. Radiology (2015) 274(2):343–51. doi: 10.1148/radiol.14140645
6. Zhang L, Tang M, Min Z, Lu J, Lei X, Zhang X. Accuracy of Combined Dynamic Contrast-Enhanced Magnetic Resonance Imaging and Diffusion-Weighted Imaging for Breast Cancer Detection: A Meta-Analysis. Acta Radiol (2016) 57(6):651–60. doi: 10.1177/0284185115597265
7. Mann RM, Balleyguier C, Baltzer PA, Bick U, Colin C, Cornford E, et al. Breast MRI: EUSOBI Recommendations for Women's Information. Eur Radiol (2015) 25(12):3669–78. doi: 10.1007/s00330-015-3807-z
8. Newell MS, Birdwell RL, D'Orsi CJ, Bassett LW, Mahoney MC, Bailey L, et al. ACR Appropriateness Criteria® on Nonpalpable Mammographic Findings (Excluding Calcifications). J Am Coll Radiol JACR (2010) 7(12):920–30. doi: 10.1016/j.jacr.2010.07.006
9. Maltez de Almeida JR, Gomes AB, Barros TP, Fahel PE, de Seixas Rocha M. Subcategorization of Suspicious Breast Lesions (BI-RADS Category 4) According to MRI Criteria: Role of Dynamic Contrast-Enhanced and Diffusion-Weighted Imaging. AJR Am J Roentgenol (2015) 205(1):222–31. doi: 10.2214/AJR.14.13834
10. Milos RI, Pipan F, Kalovidouri A, Clauser P, Kapetas P, Bernathova M, et al. The Kaiser Score Reliably Excludes Malignancy in Benign Contrast-Enhancing Lesions Classified as BI-RADS 4 on Breast MRI High-Risk Screening Exams. Eur Radiol (2020) 30(11):6052–61. doi: 10.1007/s00330-020-06945-z
11. Zhang M, Horvat JV, Bernard-Davila B, Marino MA, Leithner D, Ochoa-Albiztegui RE, et al. Multiparametric MRI Model With Dynamic Contrast-Enhanced and Diffusion-Weighted Imaging Enables Breast Cancer Diagnosis With High Accuracy. J Magn Reson Imaging (2019) 49(3):864–74. doi: 10.1002/jmri.26285
12. de Almeida JRM, Gomes AB, Barros TP, Fahel PE, Rocha MS. Diffusion-Weighted Imaging of Suspicious (BI-RADS 4) Breast Lesions: Stratification Based on Histopathology. Radiol Bras (2017) 50(3):154–61. doi: 10.1590/0100-3984.2015.0224
13. Dijkstra H, Dorrius MD, Wielema M, Pijnappel RM, Oudkerk M, Sijens PE. Quantitative DWI Implemented After DCE-MRI Yields Increased Specificity for BI-RADS 3 and 4 Breast Lesions. J Magn Reson Imaging (2016) 44(6):1642–9. doi: 10.1002/jmri.25331
14. Goto M, Le Bihan D, Yoshida M, Sakai K, Yamada K. Adding a Model-Free Diffusion MRI Marker to BI-RADS Assessment Improves Specificity for Diagnosing Breast Lesions. Radiol (2019) 292(1):84–93. doi: 10.1148/radiol.2019181780
15. Montemezzi S, Cavedon C, Camera L, Meliadò G, Caumo F, Baglio I, et al. 1h-MR Spectroscopy of Suspicious Breast Mass Lesions at 3T: A Clinical Experience. Radiol Med (2017) 122(3):161–70. doi: 10.1007/s11547-016-0713-7
16. Stanisz GJ, Odrobina EE, Pun J, Escaravage M, Graham SJ, Bronskill MJ, et al. T1, T2 Relaxation and Magnetization Transfer in Tissue at 3T. Magn Reson Med (2005) 54(3):507–12. doi: 10.1002/mrm.20605
17. Malikova MA, Tkacz JN, Slanetz PJ, Guo CY, Aakil A, Jara H. Evaluation of T1/T2 Ratios in a Pilot Study as a Potential Biomarker of Biopsy: Proven Benign and Malignant Breast Lesions in Correlation With Histopathological Disease Stage. Future Sci OA (2017) 3(3):FSO197. doi: 10.4155/fsoa-2016-0063
18. Jung Y, Gho SM, Back SN, Ha T, Kang DK, Kim TH. The Feasibility of Synthetic MRI in Breast Cancer Patients: Comparison of T2 Relaxation Time With Multiecho Spin Echo T2 Mapping Method. Br J Radiol (2018) 92(1093):20180479. doi: 10.1259/bjr.20180479
19. Matsuda M, Kido T, Tsuda T, Okada K, Shiraishi Y, Suekuni H, et al. Utility of Synthetic MRI in Predicting the Ki-67 Status of Oestrogen Receptor-Positive Breast Cancer: A Feasibility Study. Clin Radiol (2020) 75(5):398.e1–8. doi: 10.1016/j.crad.2019.12.021
20. Liu L, Yin B, Shek K, Geng D, Lu Y, Wen J, et al. Role of Quantitative Analysis of T2 Relaxation Time in Differentiating Benign From Malignant Breast Lesions. J Int Med Res (2018) 46(5):1928–35. doi: 10.1177/0300060517721071
21. Seo M, Ryu JK, Jahng GH, Sohn YM, Rhee SJ, Oh JH, et al. Estimation of T2* Relaxation Time of Breast Cancer: Correlation With Clinical, Imaging and Pathological Features. Korean J Radiol (2017) 18(1):238–48. doi: 10.3348/kjr.2017.18.1.238
22. Tan PC, Pickles MD, Lowry M, Manton DJ, Turnbull LW. Lesion T(2) Relaxation Times and Volumes Predict the Response of Malignant Breast Lesions to Neoadjuvant Chemotherapy. Magn Reson Imaging (2008) 26(1):26–34. doi: 10.1016/j.mri.2007.04.002
23. Liu L, Yin B, Geng DY, Lu YP, Peng WJ. Changes of T2 Relaxation Time From Neoadjuvant Chemotherapy in Breast Cancer Lesions. Iran J Radiol (2016) 13(3):e24014. doi: 10.5812/iranjradiol.24014
24. Blystad I, Warntjes J, Smedby O, Landtblom AM, Lundberg P, Larsson EM, et al. Synthetic MRI of the Brain in a Clinical Setting. Acta Radiol (2012) 53:1158–63. doi: 10.1258/ar.2012.120195
25. Kuhl CK, Schild HH, Morakkabati N. Dynamic Bilateral Contrast-Enhanced MR Imaging of the Breast: Trade-Off Between Spatial and Temporal Resolution. Radiol (2005) 236(3):789–800. doi: 10.1148/radiol.2363040811
26. Dorrius MD, Dijkstra H, Oudkerk M, Sijens PE. Effect of B Value and Pre-Admission of Contrast on Diagnostic Accuracy of 1.5-T Breast DWI: A Systematic Review and Meta-Analysis. Eur Radiol (2014) 24(11):2835–47. doi: 10.1007/s00330-014-3338-z
27. Chen X, Li WL, Zhang YL, Wu Q, Guo YM, Bai ZL. Meta-Analysis of Quantitative Diffusion-Weighted MR Imaging in the Differential Diagnosis of Breast Lesions. BMC Cancer (2010) 10:693. doi: 10.1186/1471-2407-10-693
28. Wielema M, Dorrius MD, Pijnappel RM, De Bock GH, Baltzer PAT, Oudkerk M, et al. Diagnostic Performance of Breast Tumor Tissue Selection in Diffusion Weighted Imaging: A Systematic Review and Meta-Analysis. PloS One (2020) 15(5):e0232856. doi: 10.1371/journal.pone.0232856
29. Partridge SC, McDonald ES. Diffusion Weighted Magnetic Resonance Imaging of the Breast: Protocol Optimization, Interpretation, and Clinical Applications. Magn Reson Imaging Clin N Am (2013) 21(3):601–24. doi: 10.1016/j.mric.2013.04.007
30. Biagini C. Role of Magnetic Resonance Imaging in the Tissue Characterization of Tumors. La Radiol Med (1986) 72(6):379.
31. Bottomley PA, Hardy CJ, Argersinger RE, Allen-Moore G. A Review of 1H Nuclear Magnetic Resonance Relaxation in Pathology: Are T1 and T2 Diagnostic? Med Phys (1987) 14(1):33. doi: 10.1118/1.596111
32. Lüssea S, Claassen H, Gehrke T, Hassenpflug J, Schünke M, Heller M, et al. Evaluation of Water Content by Spatially Resolved Transverse Relaxation Times of Human Articular Cartilage. Magn Reson Imaging 18(4):423–30. doi: 10.1016/S0730-725X(99)00144-7
33. Merchant TE, Thelissen GRP, De Graaf PW, Nieuwenhuizen CW, Kievit HC, Den Otter W, et al. Application of a Mixed Imaging Sequence for MR Imaging Characterization of Human Breast Disease. Acta Radiol 34(4):356–61. doi: 10.1080/02841859309173257
34. Medina D, Hazlewood CF, Cleveland GG, Chang DC, Spjut HJ, Moyers R, et al. Nuclear Magnetic Resonance Studies on Human Breast Dysplasias and Neoplasms. J Natl Cancer Inst (1975) 54(4):813.
35. Kim PK, Hong YJ, Im DJ, Suh YJ, Park CH, Kim JY, et al. Myocardial T1 and T2 Mapping: Techniques and Clinical Applications. Korean J Radiol (2017) 18(1):113–31. doi: 10.3348/kjr.2017.18.1.113
36. Kvistad KA, Rydland J, Vainio J, Smethurst HB, Lundgren S, Fjøsne HE, et al. Breast Lesions: Evaluation With Dynamic Contrast-Enhanced T1-Weighted MR Imaging and With T2*-Weighted First-Pass Perfusion MR Imaging. Radiology (2000) 216(2):545–53. doi: 10.1148/radiology.216.2.r00au36545
37. Boné B, Wiberg MK, Parrado C, Falkmer U, Aspelin P, Gad A. Mechanism of Contrast Enhancement in Breast Lesions at MR Imaging. Acta Radiol (1998) 39(5):494–500. doi: 10.1080/02841859809172214
38. Yadav P, Chauhan S. Effectivity of Combined Diffusion-Weighted Imaging and Contrast-Enhanced MRI in Malignant and Benign Breast Lesions. Pol J Radiol (2018) 83:e82–93. doi: 10.5114/pjr.2018.74363
39. Kul S, Cansu A, Alhan E, Dinc H, Gunes G, Reis A. Contribution of Diffusion-Weighted Imaging to Dynamic Contrast-Enhanced MRI in the Characterization of Breast Tumors. AJR Am J Roentgenol (2011) 196(1):210–7. doi: 10.2214/AJR.10.4258
40. Pinker K, Bickel H, Helbich TH, Gruber S, Dubsky P, Pluschnig U, et al. Combined Contrast-Enhanced Magnetic Resonance and Diffusion-Weighted Imaging Reading Adapted to the "Breast Imaging Reporting and Data System" for Multiparametric 3-T Imaging of Breast Lesions. Eur Radiol (2013) 23(7):1791–802. doi: 10.1007/s00330-013-2771-8
41. Baltzer A, Dietzel M, Kaiser CG, Baltzer PA. Combined Reading of Contrast Enhanced and Diffusion Weighted Magnetic Resonance Imaging by Using a Simple Sum Score. Eur Radiol (2016) 26(3):884–91. doi: 10.1007/s00330-015-3886-x
42. Veronesi U, Boyle P, Goldhirsch A, Orecchia R, Viale G. Breast Cancer. Lancet (London England) (2005) 365(9472):1727–41. doi: 10.1016/S0140-6736(05)66546-4
44. Sun Y-S, Zhao Z, Yang Z-N, Xu F, Lu HJ, Zhu ZY, et al. Risk Factors and Preventions of Breast Cancer. Int J Biol Sci (2017) 13(11):1387–97. doi: 10.7150/ijbs.21635
45. Key T, Appleby P, Barnes I, Reeves G, Endogenous Hormones and Breast Cancer Collaborative Group. Endogenous Sex Hormones and Breast Cancer in Postmenopausal Women: Reanalysis of Nine Prospective Studies. J Natl Cancer Inst (2002) 94(8):606–16. doi: 10.1093/jnci/94.8.606
46. Stanczyk FZ, Mathews BW, Sherman ME. Relationships of Sex Steroid Hormone Levels in Benign and Cancerous Breast Tissue and Blood: A Critical Appraisal of Current Science. Steroids (2015) 99(Pt A):91–102. doi: 10.1016/j.steroids.2014.12.011
47. Lønning PE, Helle H, Duong NK, Ekse D, Aas T, Geisler J. Tissue Estradiol is Selectively Elevated in Receptor Positive Breast Cancers While Tumour Estrone Is Reduced Independent of Receptor Status. J Steroid Biochem Mol Biol (2009) 117(1-3):31–41. doi: 10.1016/j.jsbmb.2009.06.005
48. Lønning PE, Haynes BP, Straume AH, Dunbier A, Helle H, Knappskog S, et al. Recent Data on Intratumor Estrogens in Breast Cancer. Steroids (2011) 76(8):786–91. doi: 10.1016/j.steroids.2011.02.040
49. Lonning PE, Haynes BP, Straume AH, Dunbier A, Helle H, Knappskog S, et al. Exploring Breast Cancer Estrogen Disposition: The Basis for Endocrine Manipulation. Clin Cancer Res Off J Am Assoc Cancer Res (2011) 17(15):4948–58. doi: 10.1158/1078-0432.CCR-11-0043
50. Meng T, He H, Liu H, Lv X, Huang C, Zhong L, et al. Investigation of the Feasibility of Synthetic MRI in the Differential Diagnosis of Non-Keratinising Nasopharyngeal Carcinoma and Benign Hyperplasia Using Different Contoured Methods for Delineation of the Region of Interest. Clin Radiol (2021) 76(3):238.e9–15. doi: 10.1016/j.crad.2020.10.010
Keywords: breast cancer, synthetic magnetic resonance imaging (syMRI), mapping, relaxation time, quantitative imaging
Citation: Sun SY, Ding Y, Li Z, Nie L, Liao C, Liu Y, Zhang J and Zhang D (2021) Multiparameter MRI Model With DCE-MRI, DWI, and Synthetic MRI Improves the Diagnostic Performance of BI-RADS 4 Lesions. Front. Oncol. 11:699127. doi: 10.3389/fonc.2021.699127
Received: 29 April 2021; Accepted: 27 September 2021;
Published: 15 October 2021.
Edited by:
Pilar López-Larrubia, Consejo Superior de Investigaciones Científicas (CSIC), SpainReviewed by:
Meinrad Beer, Ulm University Medical Center, GermanyYunsong Peng, University of Science and Technology of China, China
Copyright © 2021 Sun, Ding, Li, Nie, Liao, Liu, Zhang and Zhang. This is an open-access article distributed under the terms of the Creative Commons Attribution License (CC BY). The use, distribution or reproduction in other forums is permitted, provided the original author(s) and the copyright owner(s) are credited and that the original publication in this journal is cited, in accordance with accepted academic practice. No use, distribution or reproduction is permitted which does not comply with these terms.
*Correspondence: Zhuolin Li, bGl6aHVvbGluMDMyN0AxNjMuY29t