 Mikhail S Chesnokov1†
 Soheila Borhani1†
 Marianna Halasi1,2Zarema Arbieva3
 Irum Khan1*
 Andrei L. Gartel1*
- 1Department of Medicine, University of Illinois at Chicago, Chicago, IL, United States
- 2Department of Surgery, Massachusetts General Hospital, Boston, MA, United States
- 3Genome Research Core, University of Illinois at Chicago, Chicago, IL, United States
Forkhead box protein M1 (FOXM1) is a crucial regulator of cancer development and chemoresistance. It is often overexpressed in acute myeloid leukemia (AML) and is associated with poor survival and reduced efficacy of cytarabine therapy. Molecular mechanisms underlying high FOXM1 expression levels in malignant cells are still unclear. Here we demonstrate that AKT and FOXM1 constitute a positive autoregulatory loop in AML cells that sustains high activity of both pro-oncogenic regulators. Inactivation of either AKT or FOXM1 signaling results in disruption of whole loop, coordinated suppression of FOXM1 or AKT, respectively, and similar transcriptomic changes. AML cells with inhibited AKT activity or stable FOXM1 knockdown display increase in HOXA genes expression and BCL2L1 suppression that are associated with prominent sensitization to treatment with Bcl-2 inhibitor venetoclax. Taken together, our data indicate that AKT and FOXM1 in AML cells should not be evaluated as single independent regulators but as two parts of a common FOXM1-AKT positive feedback circuit. We also report for the first time that FOXM1 inactivation can overcome AML venetoclax resistance. Thus, targeting FOXM1-AKT loop may open new possibilities in overcoming AML drug resistance and improving outcomes for AML patients.
Introduction
Forkhead box protein M1 (FOXM1) has emerged as a key contributor to cell proliferation and renewal as well as tumorigenesis. FOXM1 overexpression occurs in many human cancers, including hematopoietic malignancies, and plays a crucial role in cancer development and progression, serving both as a potent effector of tumor development and prognostic indicator for patients (1–3). High FOXM1 levels are generally associated with chemoresistance of malignant cells, aggressive tumor phenotype, and poor prognosis due to decreased efficacy of common therapeutic strategies (2, 3).
Acute myeloid leukemia (AML) accounts for the majority of all acute leukemia cases in adults and manifests significant clinical and biological heterogeneity. High FOXM1 expression in AML cells is directly associated with treatment resistance and inferior survival in AML patients (4, 5). Our discovery of interaction between FOXM1 and nucleophosmin (NPM, encoded by NPM1 gene) suggested that high chemosensitivity of AML cells expressing mutant NPM (NPMmut) may be closely associated with FOXM1 inactivation due to its relocalization to cytoplasm (4–6). Thus, FOXM1 is a promising target in AML, and its inactivation may potentially be used to overcome drug resistance (7).
The molecular mechanisms contributing to high FOXM1 levels in cancer, including AML, are still not completely understood. The data accumulated from a variety of solid tumors demonstrated that FOXM1 expression is substantially controlled by phosphoinositide-3-kinase (PI3K)-AKT-Forkhead box protein O3 (FOXO3) pathway. AKT is a well-known oncogenic kinase that phosphorylates and inactivates FOXO3 protein, thus promoting FOXM1 expression (8). High activity of AKT pathway is observed in most AML cases and is associated with chemoresistance and adverse prognosis. AKT activation is often caused by activating mutations or amplifications of upstream AKT regulators (with fms like tyrosine kinase 3 internal tandem duplications (FLT3-ITD) being most common), but it can occur in the absence of clear driver events (9). A growing body of evidence suggests that FOXM1 may reciprocally promote AKT activation, thus establishing a positive feedback loop (1). Such loop could potentially sustain elevated activity of both regulators and ultimately promote AML chemoresistance. However, the existence of FOXM1-AKT positive feedback circuit was never confirmed in AML.
In the present study we report a positive autoregulatory loop between FOXM1 and AKT in human AML cell lines and demonstrate that inhibition of either of the two regulators exerts similar effects upon gene expression patterns. We also report for the first time that FOXM1 inactivation in AML cells can sensitize them to Bcl-2 inhibitor venetoclax that is considered as a very promising agent for AML treatment.
Materials and Methods
Cell Cultures
KG-1 human AML cell line was purchased from American Type Culture Collection (ATCC, Manassas, VA, USA). THP-1 human AML cell line was provided by Dr. Nadim Mahmud (University of Illinois at Chicago, Chicago, IL, USA). KG-1 cells were cultured in IMDM medium (Thermo Fisher Scientific, Waltham, MA, USA) supplemented with 10% fetal bovine serum (Thermo Fisher Scientific), 100 U/mL penicillin (Lonza, Basel, Switzerland), and 100 μg/mL streptomycin (Lonza). THP-1 cells were cultured in RPMI-1640 medium supplemented with 50 μM β-mercaptoethanol (Bio-Rad, Hercules, CA, USA), 10% fetal bovine serum (Thermo Fisher Scientific), 100 U/mL penicillin (Lonza), and 100 μg/mL streptomycin (Lonza). All cell lines were confirmed to be mycoplasma-negative by routine testing using PCR detection. Cells were subcultured upon reaching the concentration of 1 000 000 cells/mL of growth medium.
Chemical Compounds and Drugs
MK-2206 (APExBIO Technology, Houston, TX, USA), LY294002 (APExBIO Technology), RCM-1 (R&D Systems, Minneapolis, MN, USA), and venetoclax (Selleck Chemicals, Houston, TX, USA) were dissolved in DMSO. Puromycin (LKT Laboratories, St Paul, MN, USA) was dissolved in water.
Drug Treatment of Cultured Cells
Cells were harvested by centrifugation at 200 g for 5 minutes and viable cells were counted in presence of 0.4% Trypan Blue (Thermo Fisher Scientific). Cell treatment was performed by resuspending 2 000 000 viable cells in growth medium containing selected concentrations of drugs. Control samples were treated with vehicle only, vehicle concentration did not exceed 0.3%. After incubation for the desired periods of time, the cells were immediately harvested by centrifugation at 200 g for 5 minutes, washed once with cold phosphate-buffered saline (PBS), pelleted by centrifugation at 200 g for 5 minutes, and processed as described below.
FOXM1 Expression Knockdown in KG-1 Cells
KG-1 cells were harvested by centrifugation, washed once with Hank’s balanced salt solution and resuspended in fresh IMDM medium supplemented with 10% fetal bovine serum (Thermo Fisher Scientific). Cells were seeded into 12-well tissue culture plates and incubated with MISSION lentiviral particles carrying pLKO.1 vector encoding control non-target shRNA or shRNA against human FOXM1 transcripts (MilliporeSigma, Burlington, MA, USA) in presence of 10 mg/mL polybrene (MilliporeSigma) for manufacturer. Transduced cells were selected by cultivation in presence of puromycin for 7 days and then cultured as described above. These stable FOXM1-deficient KG-1 cells were previously described and characterized (5).
Protein Immunoblotting
Total protein samples were purified from cells using Pierce RIPA lysis buffer (Thermo Fisher Scientific) supplemented with Halt protease inhibitor cocktail (Thermo Fisher Scientific), 2 mM sodium orthovanadate (New England Biolabs Inc., Ipswich, MA, USA), and 5 mM sodium fluoride (MilliporeSigma) according to manufacturer’s protocol. Protein concentrations were estimated using Bio-Rad Protein Assay (Bio-Rad). 15-30 μg of total protein were mixed with Laemmli sample buffer (Bio-Rad) containing β-mercaptoethanol (Bio-Rad, final concentration 2.5%), heated at 98°C for 10 minutes, and separated in hand-cast 12% SDS-polyacrylamide gels. After the electrophoretic separation, the proteins were transferred to Immobilon-Psq PVDF membrane (MilliporeSigma). Membranes were washed with tris-buffered saline (TBS, Alfa Aesar, Haverhill, MA, USA) for 10 minutes, blocked with 5% bovine serum albumin (BSA, MilliporeSigma) in TBS with 0.1% Tween-20 (TBST, Thermo Fisher Scientific), and probed with the primary antibodies diluted in 5% BSA in TBST overnight at 4°C (see Supplementary Table 1 for the list of antibodies used). Membranes were washed with TBST 3 times, 10 minutes each, and probed with HRP-conjugated secondary antibodies diluted in 5% skim milk (Research Products International, Mt Prospect, IL, USA) in TBST for 1 hour at room temperature. Membranes were washed with TBST 3 times, 10 minutes each, protein bands were developed using SuperSignal West Pico PLUS substrate (Thermo Fisher Scientific) and detected using ChemiDoc MP System (Bio-Rad). Protein band quantitation was performed using ImageLab software package (Bio-Rad).
RT-qPCR Analysis of Gene Expression
Total RNA was isolated from cells using TRIzol reagent (Thermo Fisher Scientific) and the PureLink RNA Mini Kit (Thermo Fisher Scientific) with additional on-column DNAse treatment according to manufacturer’s instructions. RNA samples were quantified using NanoDrop One Spectrophotometer (Thermo Fisher Scientific). Reverse transcription was performed using High-Capacity cDNA Reverse Transcription Kit with RNase Inhibitor (Thermo Fisher Scientific), 500 ng of total RNA were used per reaction. Quantitative PCR analysis of gene expression levels was performed in ViiA 7 Real-Time PCR System (Thermo Fisher Scientific) using PowerUp SYBR Green Master Mix (Thermo Fisher Scientific) and primers listed in Supplementary Table 2. Amplification was performed according to manufacturer’s Fast Mode recommendations for 35 cycles, reaction specificity was checked by melt curve analysis and agarose electrophoresis. Reaction efficiency was evaluated using standard curve approach and was within 95-105% for all primers. Transcript abundance was estimated using Pfaffl’s method (10), GAPDH was used as reference gene for normalization.
Full Transcriptome RNA-Seq
RNA samples were analyzed for integrity using Agilent 4200 TapeStation (Agilent Technologies, Santa Clara, CA, USA). Levels of remaining DNA were checked using Qubit fluorometer (Thermo Fisher Scientific). DNA amounts did not exceed 10% of the total amount of nucleic acid.
Sequencing libraries for Illumina sequencing were prepared in one batch in 96-well plate using Stranded CORALL total RNAseq library prep kit with RiboCop HMR rRNA Depletion Kit (Lexogen, Vienna, Austria). In brief, 260-660 nanograms of total RNA were used for the first rRNA depletion step, then followed by library generation initiated with random oligonucleotide primer hybridization and reverse transcription. No prior RNA fragmentation was done, as the insert size was determined by proprietary size restricting method. Next, the 3’ ends of first-strand cDNA fragments were ligated with a linker containing Illumina-compatible P5 sequences and Unique Molecular Identifiers. During the following steps of second strand cDNA synthesis and dual-strand cDNA amplification, i7 and i5 indices as well as complete adapter sequences required for cluster generation were added. A number of PCR amplification cycles was 12, as determined by qPCR using a small pre-amplification library aliquot for each individual sample.
Final amplified libraries were purified, quantified, and average fragment sizes confirmed to be 330 bp by gel electrophoresis using Agilent 4200 TapeStation (Agilent Technologies). Concentration of the final library pool was confirmed by qPCR, and then subjected to test sequencing in order to check sequencing efficiencies and adjust accordingly proportions of individual libraries. Sequencing was carried out on NovaSeq 6000, S4 flowcell (Illumina, San Diego, CA, USA), approximately 30 M 2x150 bp clusters per sample.
Bioinformatical Analysis of RNA-Seq Data
Analysis of raw RNA-seq data was performed by Research Informatics Core at the University of Illinois at Chicago. Raw reads were aligned to the human hg38 reference genome in a splice-aware manner using the STAR aligner (11). ENSEMBL gene and transcript annotations including non-coding RNAs were used. Expression level of features, i.e. genes and non-coding RNAs, were quantified using FeatureCounts as raw read counts (12).
Differential expression statistics (fold-change and p-value) were computed using edgeR on raw expression counts obtained from quantification (13, 14). Raw expression counts were normalized within edgeR using TMM normalization. Nominal p-values were adjusted for multiple testing using the false discovery rate (FDR) correction of Benjamini and Hochberg (15). Significant genes were determined based on fold-changes lower than 0.5 and higher than 2.0, FDR threshold of 10% (q-value<0.1) in the multi-group comparison. Processed data on gene expression levels are provided in Supplementary Table 3.
Regulatory pathway analysis was performed in Gene Set Enrichment Analysis (GSEA) software (University of California San Diego and Broad Institute, USA) (16, 17) using the list of genes displaying significant differential expression in KG-1 cells treated with MK-2206. Input data contained Log2-fold-change values. GSEAPreranked algorithm was used to analyze data using Pathway Interaction Database collection of gene signatures (18) with number of permutations set to 1 000. Pathways with FDR<0.05 were considered significantly enriched.
Annexin V-Based Detection of Apoptotic Cells
Cells were treated with drugs as described above in 60 mm cell culture dishes (Thermo Fisher Scientific). After treatment the cells were harvested by centrifugation, washed twice with ice-cold PBS, and 500 000 cells were resuspended in 100 μL of Annexin V Binding Buffer (BD Biosciences, San Jose, CA, USA). Cells were stained by incubating with 2.5 μL of APC-conjugated Annexin V recombinant protein (Thermo Fisher Scientific) for 15 minutes in the dark, pelleted by centrifugation at 200 g for 5 minutes, and resuspended in 300 μL of Annexin V Binding Buffer containing 0.1 μg/mL DAPI (R&D Systems). Samples were analyzed using CytoFLEX flow cytometer and CytExpert software (Beckman Coulter, Brea, CA, USA).
Statistical Analysis
At least three independent biological replicates were used for all quantitative experiments describing cell treatment with drugs, excluding RNA-seq, where two biological replicates were used, and confirmatory Annexin V assay, where only one experiment was performed. RT-qPCR experiments were performed with two technical replicates for each biological replicate, gene expression levels were considered to be log-normally distributed (19) and differences between sample groups were evaluated using two-tailed Student’s t-test with Welch’s correction for unequal variances after logarithmic transformation of data. Protein levels estimated via immunoblotting were compared using Mann-Whitney U test. Correlation analysis of transcriptomic changes in “FOXM1-KD” and “MK-2206” genesets was performed for Log2-transformed fold-change data using Spearman’s correlation coefficient. Statistical significance was accepted with p<0.05. Statistical analysis was performed in OriginPro 2016 software (OriginLab Corporation, Northampton, MA, USA). Plots were generated using GraphPad Prism 6 software (GraphPad Software, San Diego, CA, USA).
Clustering of RNA sequencing data and heatmap plot generation were performed in Morpheus software (https://software.broadinstitute.org/morpheus, Broad Institute, USA) using Euclidean metrics and Complete linkage settings for clustering.
Results
We investigated the role of FOXM1-AKT interconnection in AML using FLT3-wild-type KG-1 and THP-1 human AML cell lines, as FLT3-ITD mutation can promote AKT activity regardless of FOXM1 status. Using pharmacological inhibitors of AKT signaling pathway and FOXM1 function and stable shRNA-mediated FOXM1 knockdown (KD), we probed both “AKT-to-FOXM1” and “FOXM1-to-AKT” segments of FOXM1-AKT regulatory loop. We next compared the effects of AKT and FOXM1 inactivation using full transcriptomic RNA-seq analysis.
Treatment with an allosteric pan-AKT inhibitor MK-2206 resulted in prominent inhibition of activating AKT phosphorylation at S473 site in both KG-1 and THP-1 cell lines (Figure 1A). We additionally confirmed that loss of AKT S473 phosphorylation correctly reflects the suppression of AKT pathway activity by demonstrating a decrease in T246 phosphorylation of direct AKT target protein PRAS40. In agreement with effects reported for solid cancers (8), AKT inhibition decreased FOXM1 protein levels in both examined cell lines (Figure 1A) and resulted in correspondent downregulation of established FOXM1 target genes (AURKB, PLK1, CDK1, UBE2C, CENPF) (Figure 1B).
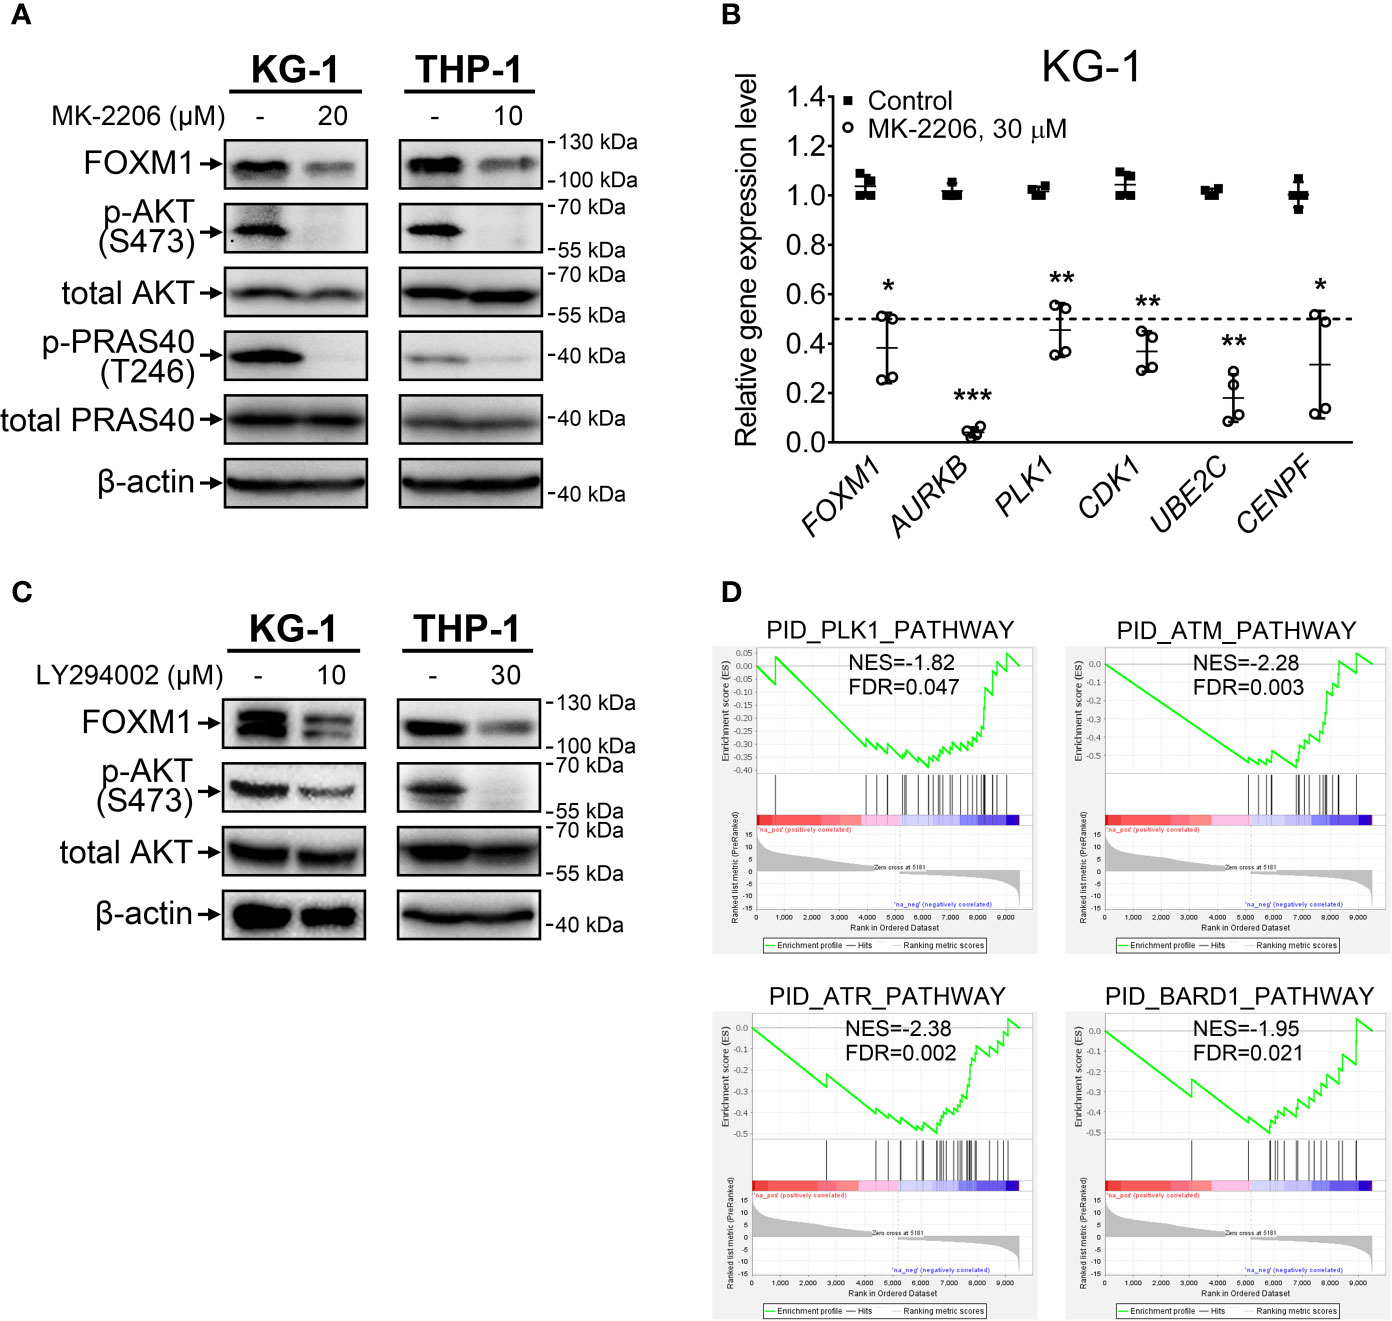
Figure 1 FOXM1 expression is regulated by the AKT pathway in AML. (A) Direct inhibition of AKT with MK-2206 results in FOXM1 suppression. Cells were treated with indicated concentrations of MK-2206 for 24 hours, total protein samples were purified immediately after treatment and analyzed via immunoblotting with indicated antibodies, β-actin was used as an internal loading control. (B) AKT inhibition causes downregulation of FOXM1 target genes expression. KG-1 cells were treated with 30 μM MK-2206 for 24 hours, total RNA was purified immediately after treatment and analyzed via RT-qPCR. Data are presented as individual data points and means ± S.D., statistical significance is evaluated for Log2-transformed data using two-tailed Student’s t-test with Welch’s correction (*p < 0.05, **p < 0.01, ***p < 0.001 for N = 4). (C) Inhibition of PI3K with LY294002 results in suppression of both AKT phosphorylation and FOXM1 levels. Cells were treated with indicated concentrations of LY294002 for 24 hours, total protein samples were purified immediately after treatment and analyzed via immunoblotting with indicated antibodies, β-actin was used as an internal loading control. (D) MK-2206 treatment of KG-1 cells suppresses genetic signatures of FOXM1 target PLK1 and DNA damage response regulators. KG-1 cells were treated with 30 μM MK-2206 for 24 hours, total RNA was purified immediately after treatment and analyzed via RNA-seq. NES, normalized expression score; FDR, false discovery rate.
To exclude the possibility that MK-2206 affects FOXM1 expression through a non-specific AKT-independent mechanism, we additionally treated cells with LY294002, a selective inhibitor of AKT upstream activator PI3K, and observed similar effects on phosphorylated AKT and FOXM1 protein levels (Figure 1C). These results for the first time experimentally confirm that activity of PI3K-AKT pathway is crucial for the maintenance of high FOXM1 expression levels in AML cells.
We next investigated the overall impact of AKT inhibition on gene expression patterns in AML via RNA-seq analysis of protein-coding transcriptome in KG-1 cells treated with MK-2206. We detected significant (at least 2-fold change, FDR<0.1) downregulation of 4 299 genes and upregulation of 5 181 genes (Supplementary Table 3). GSEA analysis performed using the list of significantly affected genes indicated suppression of PLK1 signature, providing additional evidence of FOXM1 suppression (Figure 1D). Moreover, we observed suppression of ATM, ATR, and BARD1 pathways involved in DNA damage response (DDR). Regulation of DDR via AKT pathway is well-established (20) and it can be partially facilitated through FOXM1 regulating the ATM-ATR signaling (21). The involvement of FOXM1 into DDR regulation emphasizes the importance of FOXM1-AKT loop in promoting AML cell survival and chemoresistance. Loss of the ATM-ATR signatures also suggest that AML cells with inhibited FOXM1/AKT activity may display higher sensitivity to anti-cancer therapy.
Since the positive regulation of FOXM1 by AKT pathway described in solid tumors was reproduced in AML cells, we hypothesized that reciprocal regulation of AKT by FOXM1 could also take place. To investigate this question, we treated KG-1 and THP-1 cells with a novel FOXM1 inhibitor RCM-1 (22, 23) and observed prominent decrease in both FOXM1 expression (5-fold or more) and AKT S473 phosphorylation (4-fold or more) levels. Moreover, we also detected slight (to 60-75% of control sample) suppression of total AKT protein levels in response to RCM-1 treatment (Figure 2A and Supplementary Figure 1). Published data on RCM-1 treatment effects in several different models suggest that it does not inhibit AKT phosphorylation in general (22). We therefore conclude that RCM-1-dependent inhibition of AKT pathway in AML cells may be mediated through FOXM1 suppression.
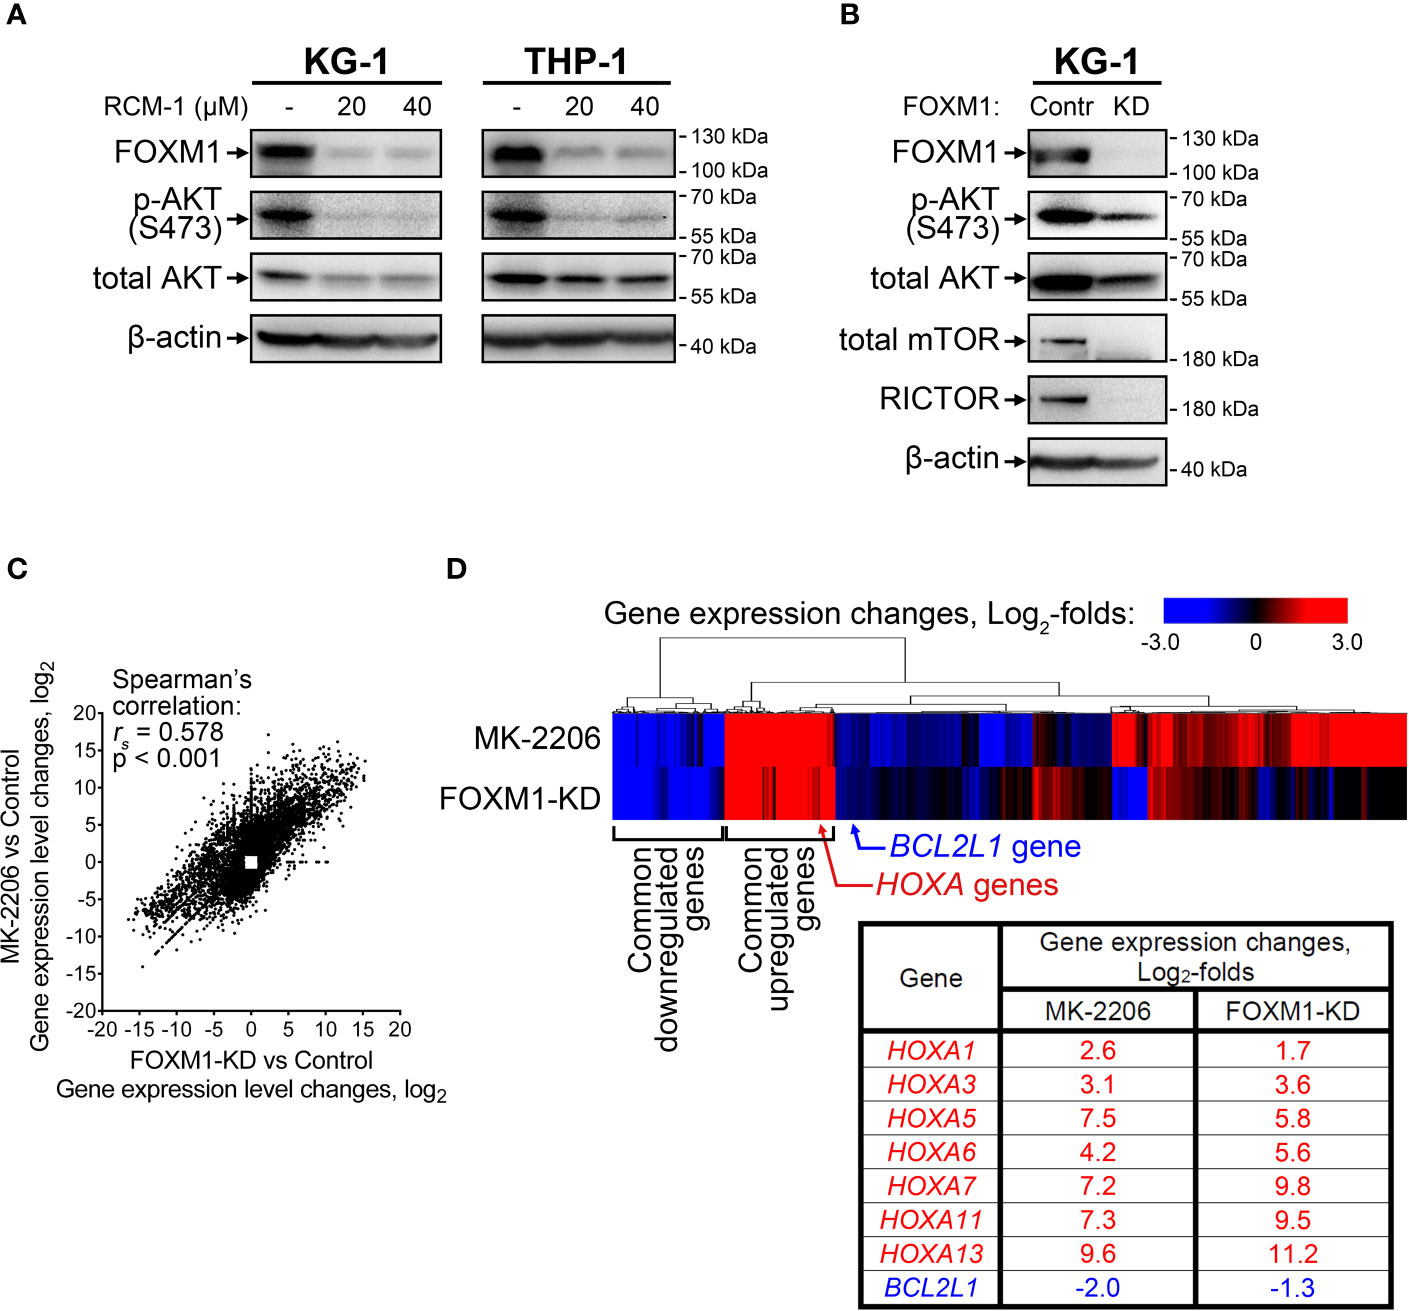
Figure 2 FOXM1 inactivation in AML cells decreases AKT activity and results in gene expression changes associated with venetoclax sensitivity. (A) FOXM1 inhibition with RCM-1 reduces phosphorylation and total protein levels of AKT. Cells were treated with indicated concentrations of RCM-1 for 72 hours, total protein samples were purified immediately after treatment and analyzed via immunoblotting with indicated antibodies, β-actin was used as an internal loading control. (B) Stable shRNA-mediated knockdown of FOXM1 in KG-1 cells suppresses the activity of mTORC2-AKT signaling axis. KG-1 cells were infected with lentiviral particles carrying a control or anti-FOXM1 shRNA-expressing vectors and selected in presence of puromycin. Total protein samples were purified after the selection and analyzed via immunoblotting with indicated antibodies, β-actin was used as an internal loading control. (C) Correlation between gene expression changes in KG-1 cells caused by MK-2206 treatment and FOXM1 knockdown effects. KG-1 cells were treated with 30 μM MK-2206 for 24 hours or transduced with FOXM1-KD or control lentiviral particles, RNA samples were purified from control, treated, and transduced cell cultures and subjected to RNA-seq, non-protein-coding genes were excluded from analysis. Data represent genes displaying significant (q<0.1) 2-fold or higher expression changes in at least one of the examined samples, average of two biological replicates for each condition. (D) Heatmap representation of MK-2206 treatment and FOXM1 knockdown effects on global gene expression patterns in KG-1 cells.
RCM-1 is a new drug and therefore may have unknown non-specific effects. To confirm that the observed RCM-1 treatment effects on AKT are mediated through FOXM1, we performed stable shRNA-mediated FOXM1 knockdown in KG-1 cells using lentiviral transduction approach. Similar to cells treated with RCM-1, FOXM1-deficient KG-1 cells displayed reduced levels of both phosphorylated and total AKT (Figure 2B and Supplementary Figure 2), confirming that FOXM1 positively regulates AKT on both protein and phosphorylation levels. To further explore possible regulatory mechanisms mediating FOXM1 effects on AKT, we evaluated levels of RICTOR, total mTOR and phosphorylated mTOR proteins in control and FOXM1-deficient KG-1 cells. Surprisingly, KG-1-FOXM1-KD cells displayed complete loss of both RICTOR and mTOR proteins (Figure 2B and Supplementary Figures 2, 3), indicating that FOXM1 may be involved into regulation of their synthesis or degradation. Taken together with the data described above, our results indicate that AKT and FOXM1 in AML are organized into an autoregulatory loop that sustains elevated levels of FOXM1 and AKT activity.
To provide an additional confirmation of AKT-activating FOXM1 effect, we treated KG-1 cells with cytarabine (AraC), a drug commonly used in AML therapy. We previously demonstrated that AraC treatment increases FOXM1 level in KG-1 cells (4). As we expected, AraC-treated KG-1 cells also displayed increase in phospho-AKT levels. More importantly, addition of RCM-1 to AraC prevented both FOXM1 and phospho-AKT upregulation (Supplementary Figure 4).
We then compared gene expression changes induced in KG-1 cells by either AKT inhibition (“MK-2206” geneset) or stable FOXM1 knockdown (“FOXM1-KD” geneset) using RNA-seq. A total of 10 698 protein-coding genes were significantly affected in either one or both examined samples with 3 578 genes (33.4%) displaying co-directional changes in both samples (Supplementary Table 3). “MK-2206” and “FOXM1-KD” genesets exhibited prominent positive correlation (Figure 2C) with two clearly discernible groups of common up- and down-regulated genes identified by unsupervised hierarchical clustering (Figure 2D). This overlap of transcriptomic effects caused by inactivation of either AKT or FOXM1 confirms the idea that these two regulators share several common downstream effectors and strongly implies that FOXM1 and AKT are incorporated into a single regulatory network. We analyzed the clusters of overexpressed and repressed genes common to both “MK-2206” and “FOXM1-KD” genesets looking for genes potentially associated with AML drug sensitivity and detected increase in the expression of multiple genes belonging to HOXA family (HOXA1, HOXA3, HOXA5, HOXA6, HOXA7, HOXA11, HOXA13) (Figure 2D). The expression changes of the most abundant HOXA variants were additionally confirmed by RT-qPCR (Supplementary Figure 5). We also detected suppression of BCL2L1 (encodes anti-apoptotic Bcl-xL protein), but the extent of this change was less than in case of HOXA genes (Figure 2D).
High HOXA expression in AML was recently reported to be associated with increased sensitivity to venetoclax treatment, while increased BCL2L1 level confer resistance to this drug (24, 25). We therefore evaluated its cytotoxic effects in control and FOXM1-deficient KG-1 cells using immunoblotting and Annexin V assay. KG-1-Control cells were resistant to venetoclax (up to 200 nM), while KG-1-FOXM1-KD cells demonstrated prominent activation of caspase-3 after 24 hours of treatment (Figure 3A). Immunoblotting results were verified using Annexin V assay that confirmed high percentage (60+%) of cells undergoing early and late apoptosis in FOXM1-deficient cells treated with venetoclax, but not in KG-1-Control cells (Figure 3B). Based on these results, we conclude that the positive regulatory loop existing between FOXM1 and AKT pathway is involved in the maintenance of venetoclax resistance in AML.
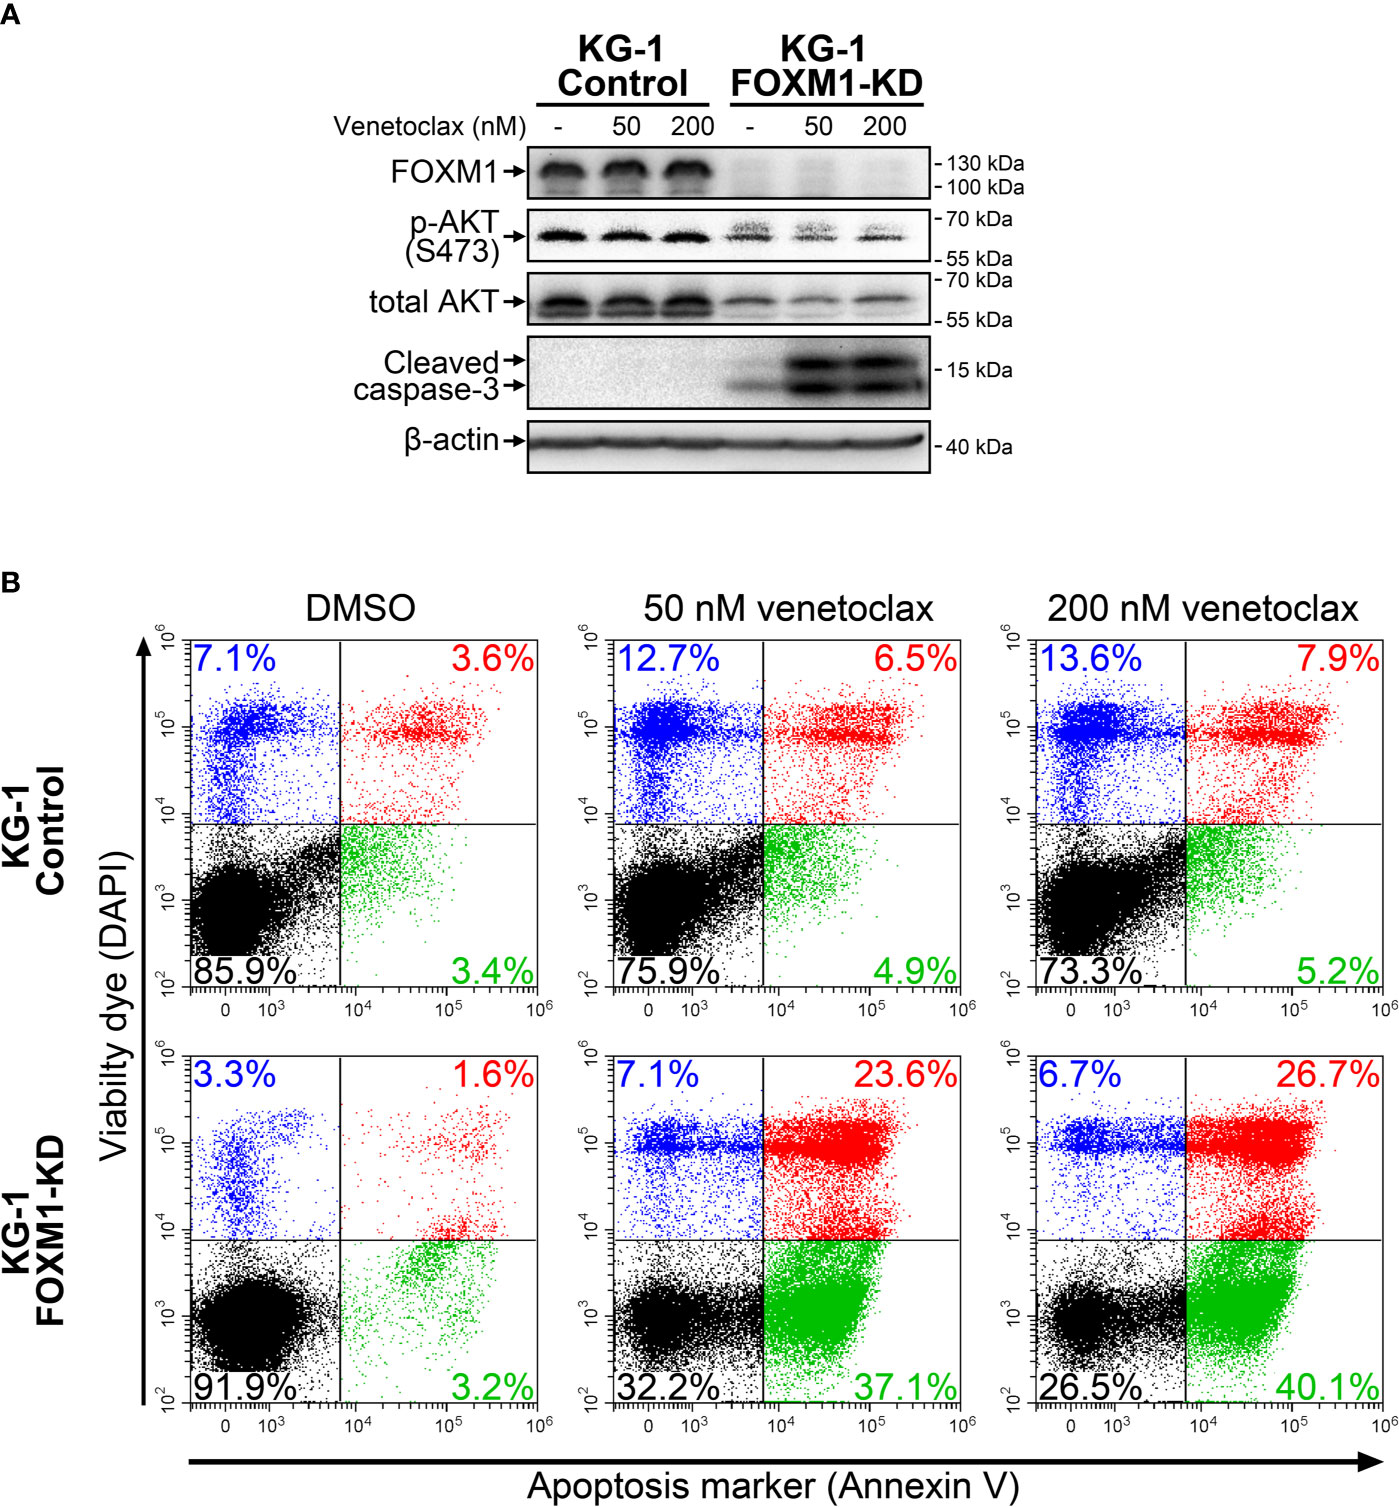
Figure 3 FOXM1 knockdown in KG-1 cells increases their sensitivity to venetoclax. KG-1-Control and KG-1-FOXM1-KD cells were treated with indicated concentrations of venetoclax for 24 hours. (A) Total protein samples were purified immediately after treatment and analyzed via immunoblotting with indicated antibodies. Apoptotic activity was evaluated based on caspase-3 cleavage, β-actin was used as an internal loading control. (B) Cells were harvested immediately after treatment and stained with Annexin V and DAPI. Flow cytometry-based Annexin V assay was performed to identify viable (DAPIlow/Annexin Vlow, black), early apoptotic (DAPIlow/Annexin Vhigh, green), early necrotic (DAPIhigh/Annexin Vlow, blue) and dead (DAPIhigh/Annexin Vhigh, red) cells.
Discussion
Present study was focused on the potential role of reciprocal regulation of FOXM1 and AKT in AML. Positive regulatory loop responsible for maintenance of high AKT and FOXM1 activity was described in multiple solid tumors but never in AML (1). We demonstrated for the first time that FOXM1-AKT loop exists in AML cells, and that the inactivation of either AKT or FOXM1 results in coordinated inhibition of its counterpart. Positive regulation of FOXM1 by AKT is in agreement with prior report of FOXM1 overexpression in AML being dependent on FLT3-ITD mutation that results in constitutive activation of AKT pathway (26). In contrast, a positive feedback link leading from FOXM1 back to AKT in AML is a completely new finding that reinforces FOXM1 as a promising therapeutic target.
While the exact regulatory pathways facilitating FOXM1 effects on AKT signaling are currently unknown, our surprising discovery of mTOR and RICTOR loss in FOXM1-deficient KG-1 cells may shed some light on this area. To our knowledge, this is the first known evidence of FOXM1 regulating mTOR-RICTOR-AKT axis by affecting total protein levels, since the activity of these proteins is usually controlled through phosphorylation. None of MTOR, RICTOR, or AKT genes were ever reported as FOXM1 targets; moreover, none of these genes display significant expression changes in our RNA-seq data (Supplementary Table 3). We therefore suppose that FOXM1 inactivation may result in either reduced translation or increased degradation of mTOR, RICTOR, and AKT proteins, but this hypothesis requires extensive additional studies.
AKT promotes FOXM1 expression via phosphorylating and inactivating FOXO3, another Forkhead box transcription factor that competes with FOXM1 for the same DNA sites. Phosphorylated FOXO3 protein is translocated to the cytoplasm and degraded, leaving its binding sites available for FOXM1 (8). One such site is situated in FOXM1 promoter and establishes self-activating loop involved in FOXM1 overexpression (27). In normal cells, FOXO3 re-accumulates in nucleus after AKT pathway inactivation, occupies FOXM1 promoter, and thus suppresses FOXM1 expression. However, the formation of FOXM1-AKT loop in AML cells likely results in constitutive hyperactivation of AKT pathway (even in absence of activating mutations) and constant inactivation of FOXO3, disabling this mechanism of FOXM1 overexpression prevention.
FOXM1 overexpression is known for its association with resistance to anti-cancer drugs, especially to DNA-damaging agents (21, 28). AML is not an exception, since nuclear FOXM1 promotes its resistance to AraC (5). Moreover, AKT pathway is also a regulator of DDR (20), and this fact is supported by our RNA-seq data for MK-2206-treated cells. Interestingly, FOXM1 itself can regulate the ATM-ATR signaling (21) and therefore is likely involved in facilitating AKT-dependent regulation of DDR. These complex connections between FOXM1, AKT and DDR emphasizes the importance of FOXM1-AKT loop in promoting AML cell survival and chemoresistance.
While FOXM1 role in general chemoresistance is well established, the sensitization of FOXM1-deficient cells to venetoclax, a specific Bcl-2-targeting agent, was unpredicted. Currently known mechanisms of venetoclax resistance development include loss of Bcl-2 (due to mutations or transcriptional repression) and overexpression of Bcl-xL and MCL-1 proteins (25). Our transcriptomic data indicate that KG-1 cells express moderate levels of BCL2, while no significant decrease in MCL1 expression levels occurs upon MK-2206 treatment or FOXM1 knockdown (Supplementary Table 3). However, BCL2L1 expression is decreased in KG-1 cells after FOXM1 or AKT inactivation, and this effect may be a potential mechanism for sensitization toward venetoclax. The information on possible FOXM1 and Bcl-xL connections is very scarce and is limited to two reports describing positive correlation between these proteins in thyroid cancer (29) and pancreatic β-cells (30). On the other hand, the involvement of AKT-Bcl-xL axis in venetoclax resistance in leukemia was reported before (31, 32), and AKT pathway inhibition may facilitate the suppression of BCL2L1 in KG-1-FOXM1-KD cells. We therefore suggest that the whole FOXM1-AKT feedback loop is involved in AML venetoclax sensitivity regulation, while disruption of this loop at any point (AKT, FOXM1, or intermediate regulators) may help to overcome drug resistance. Elucidating this mechanism further has the potential to improve the therapeutic efficacy of Bcl-2 targeting strategies.
Mutations of NPM1 are associated with a favorable outcome for AML patients. This effect could be partially explained by relocalization of FOXM1-NPMmut complex to the cytoplasm, resulting in functional FOXM1 inactivation, disruption of FOXM1-AKT loop, and increased chemosensitivity (4, 5). AML cases harboring NPM1mut also display sensitivity to hypomethylating agents and venetoclax (33). NPM1 mutations in AML are also associated with high expression of HOX genes (34) that has been reported as a marker of venetoclax sensitivity in primary AML samples (24). Importantly, our data demonstrate a very similar pattern of HOXA genes overexpression in KG-1 cells with FOXM1 deficiency or inhibited AKT (Figure 2D). Furthermore, FOXM1 knockdown in KG-1 cells sensitizes them to venetoclax (Figure 3). Thuswise, a very prominent association between FOXM1-AKT loop inactivation, HOXA genes expression, treatment sensitivity and NPM1 mutations is reproduced in multiple AML model systems and sample sets, implying that these aspects are regulated by a common circuit. Our data suggest that strong HOX gene expression in NPM1mut AML cells (28) may be partly explained by inactivation of FOXM1-AKT loop (Figure 2D). We therefore propose that FOXM1-AKT positive regulatory loop acts as an important mechanism contributing to AML treatment resistance, and its disruption may be a universal way to induce drug sensitivity.
AKT pathway is an attractive target due to its involvement in multiple cancer-related processes. However, direct AKT inhibitors displayed subpar efficacy in clinical trials, probably due to high toxicity exerted by complete inhibition of AKT signaling (35). We propose that FOXM1-AKT positive feedback is responsible for maintenance of elevated AKT activity in AML. The disruption of this regulatory circuit in cells that do not have other mechanisms of constitutive AKT activation (e.g. FLT3-ITD mutation) may return AKT pathway activity back to baseline levels. Such effect would potentially avoid the risk for high toxicity of complete AKT inactivation and would not affect non-malignant cells that typically do not display high FOXM1 levels, while still providing anti-cancer effects of the AKT activity suppression. Specific pharmacological inhibition of FOXM1 activity is still a challenging task, but further investigation of molecular mechanisms facilitating AKT pathway regulation by FOXM1 may provide new approaches to inhibition of FOXM1-AKT regulatory loop and overcoming AML treatment resistance.
Data Availability Statement
The datasets presented in this study can be found in online repositories. The names of the repository/repositories and accession number(s) can be found below: GEO, GSE172189.
Author Contributions
MC conceptualized experimental part of the study, designed and performed experiments, acquired, analyzed, and interpreted data, drafted and revised the manuscript. SB designed and performed the experiments, acquired, analyzed, and interpreted data, drafted and revised the manuscript. MH designed and performed the experiments, acquired and analyzed data, revised the manuscript. ZA performed RNA sequencing experiments, drafted the manuscript. IK conceptualized experimental part of the study, analyzed and interpreted data, revised the manuscript, provided funding, supervised the study. AG proposed original idea, conceptualized the study, interpreted data, drafted and revised the manuscript, provided funding, supervised the study. All authors contributed to the article and approved the submitted version.
Funding
The study was supported by LRF grant awarded to IK and UIC Cancer Center 2020 grant awarded to ALG.
Conflict of Interest
The authors declare that the research was conducted in the absence of any commercial or financial relationships that could be construed as a potential conflict of interest.
Publisher’s Note
All claims expressed in this article are solely those of the authors and do not necessarily represent those of their affiliated organizations, or those of the publisher, the editors and the reviewers. Any product that may be evaluated in this article, or claim that may be made by its manufacturer, is not guaranteed or endorsed by the publisher.
Acknowledgments
The authors would like to thank Research Informatics Core team (University of Illinois at Chicago, USA) for their help in processing RNA-seq data.
Supplementary Material
The Supplementary Material for this article can be found online at: https://www.frontiersin.org/articles/10.3389/fonc.2021.696532/full#supplementary-material
References
1. Borhani S, Gartel AL. FOXM1: A Potential Therapeutic Target in Human Solid Cancers. Expert Opin Ther Targets (2020) 24(3):205–17. doi: 10.1080/14728222.2020.1727888
2. Halasi M, Gartel AL. FOX(M1) News–it is Cancer. Mol Cancer Ther (2013) 12(3):245–54. doi: 10.1158/1535-7163.MCT-12-0712
3. Gentles AJ, Newman AM, Liu CL, Bratman SV, Feng W, Kim D, et al. The Prognostic Landscape of Genes and Infiltrating Immune Cells Across Human Cancers. Nat Med (2015) 21(8):938–45. doi: 10.1038/nm.3909
4. Khan I, Halasi M, Patel A, Schultz R, Kalakota N, Chen YH, et al. FOXM1 Contributes to Treatment Failure in Acute Myeloid Leukemia. JCI Insight (2018) 3(15): e121583. doi: 10.1172/jci.insight.121583
5. Khan I, Halasi M, Zia MF, Gann P, Gaitonde S, Mahmud N, et al. Nuclear FOXM1 Drives Chemoresistance in AML. Leukemia (2017) 31(1):251–5. doi: 10.1038/leu.2016.270
6. Bhat UG, Jagadeeswaran R, Halasi M, Gartel AL. Nucleophosmin Interacts With FOXM1 and Modulates the Level and Localization of FOXM1 in Human Cancer Cells. J Biol Chem (2011) 286(48):41425–33. doi: 10.1074/jbc.M111.270843
7. Khan I, Eklund EE, Gartel AL. Therapeutic Vulnerabilities of Transcription Factors in AML. Mol Cancer Ther (2021) 20(2):229–37. doi: 10.1158/1535-7163.MCT-20-0115
8. Yao S, Fan LY, Lam EW. The FOXO3-FOXM1 Axis: A Key Cancer Drug Target and a Modulator of Cancer Drug Resistance. Semin Cancer Biol (2018) 50:77–89. doi: 10.1016/j.semcancer.2017.11.018
9. Nepstad I, Hatfield KJ, Gronningsaeter IS, Reikvam H. The PI3K-Akt-Mtor Signaling Pathway in Human Acute Myeloid Leukemia (AML) Cells. Int J Mol Sci (2020) 21(8): 2907. doi: 10.3390/ijms21082907
10. Pfaffl MW. A New Mathematical Model for Relative Quantification in Real-Time RT-PCR. Nucleic Acids Res (2001) 29(9):e45. doi: 10.1093/nar/29.9.e45
11. Dobin A, Davis CA, Schlesinger F, Drenkow J, Zaleski C, Jha S, et al. STAR: Ultrafast Universal RNA-Seq Aligner. Bioinformatics (2013) 29(1):15–21. doi: 10.1093/bioinformatics/bts635
12. Liao Y, Smyth GK, Shi W. Featurecounts: An Efficient General Purpose Program for Assigning Sequence Reads to Genomic Features. Bioinformatics (2014) 30(7):923–30. doi: 10.1093/bioinformatics/btt656
13. McCarthy DJ, Chen Y, Smyth GK. Differential Expression Analysis of Multifactor RNA-Seq Experiments With Respect to Biological Variation. Nucleic Acids Res (2012) 40(10):4288–97. doi: 10.1093/nar/gks042
14. Robinson MD, McCarthy DJ, Smyth GK. Edger: A Bioconductor Package for Differential Expression Analysis of Digital Gene Expression Data. Bioinformatics (2010) 26(1):139–40. doi: 10.1093/bioinformatics/btp616
15. Benjamini Y, Hochberg Y. Controlling the False Discovery Rate: A Practical and Powerful Approach to Multiple Testing. J R Stat Soc Ser B (Methodol) (1995) 57(1):289–300. doi: 10.1111/j.2517-6161.1995.tb02031.x
16. Subramanian A, Tamayo P, Mootha VK, Mukherjee S, Ebert BL, Gillette MA, et al. Gene Set Enrichment Analysis: A Knowledge-Based Approach for Interpreting Genome-Wide Expression Profiles. Proc Natl Acad Sci USA (2005) 102(43):15545–50. doi: 10.1073/pnas.0506580102
17. Mootha VK, Lindgren CM, Eriksson KF, Subramanian A, Sihag S, Lehar J, et al. PGC-1alpha-Responsive Genes Involved in Oxidative Phosphorylation Are Coordinately Downregulated in Human Diabetes. Nat Genet (2003) 34(3):267–73. doi: 10.1038/ng1180
18. Schaefer CF, Anthony K, Krupa S, Buchoff J, Day M, Hannay T, et al. PID: The Pathway Interaction Database. Nucleic Acids Res (2009) 37(Database issue):D674–9. doi: 10.1093/nar/gkn653
19. Bengtsson M, Stahlberg A, Rorsman P, Kubista M. Gene Expression Profiling in Single Cells From the Pancreatic Islets of Langerhans Reveals Lognormal Distribution of Mrna Levels. Genome Res (2005) 15(10):1388–92. doi: 10.1101/gr.3820805
20. Liu Q, Turner KM, Alfred Yung WK, Chen K, Zhang W. Role of AKT Signaling in DNA Repair and Clinical Response to Cancer Therapy. Neuro Oncol (2014) 16(10):1313–23. doi: 10.1093/neuonc/nou058
21. Zona S, Bella L, Burton MJ, Nestal de Moraes G, Lam EW. FOXM1: An Emerging Master Regulator of DNA Damage Response and Genotoxic Agent Resistance. Biochim Biophys Acta (2014) 1839(11):1316–22. doi: 10.1016/j.bbagrm.2014.09.016
22. Sun L, Ren X, Wang IC, Pradhan A, Zhang Y, Flood HM, et al. The FOXM1 Inhibitor RCM-1 Suppresses Goblet Cell Metaplasia and Prevents IL-13 and STAT6 Signaling in Allergen-Exposed Mice. Sci Signal (2017) 10(475): eaai8583. doi: 10.1126/scisignal.aai8583
23. Shukla S, Milewski D, Pradhan A, Rama N, Rice K, Le T, et al. The FOXM1 Inhibitor RCM-1 Decreases Carcinogenesis and Nuclear Beta-Catenin. Mol Cancer Ther (2019) 18(7):1217–29. doi: 10.1158/1535-7163.MCT-18-0709
24. Kontro M, Kumar A, Majumder MM, Eldfors S, Parsons A, Pemovska T, et al. HOX Gene Expression Predicts Response to BCL-2 Inhibition in Acute Myeloid Leukemia. Leukemia (2017) 31(2):301–9. doi: 10.1038/leu.2016.222
25. Guerra VA, DiNardo C, Konopleva M. Venetoclax-Based Therapies for Acute Myeloid Leukemia. Best Pract Res Clin Haematol (2019) 32(2):145–53. doi: 10.1016/j.beha.2019.05.008
26. Liu LL, Zhang DH, Mao X, Zhang XH, Zhang B. Over-Expression of Foxm1 is Associated With Adverse Prognosis and FLT3-ITD in Acute Myeloid Leukemia. Biochem Biophys Res Commun (2014) 446(1):280–5. doi: 10.1016/j.bbrc.2014.02.094
27. Halasi M, Gartel AL. A Novel Mode of Foxm1 Regulation: Positive Auto-Regulatory Loop. Cell Cycle (2009) 8(12):1966–7. doi: 10.4161/cc.8.12.8708
28. Halasi M, Gartel AL. Suppression of FOXM1 Sensitizes Human Cancer Cells to Cell Death Induced by DNA-Damage. PloS One (2012) 7(2):e31761. doi: 10.1371/journal.pone.0031761
29. Ahmed M, Uddin S, Hussain AR, Alyan A, Jehan Z, Al-Dayel F, et al. Foxm1 and its Association With Matrix Metalloproteinases (MMP) Signaling Pathway in Papillary Thyroid Carcinoma. J Clin Endocrinol Metab (2012) 97(1):E1–E13. doi: 10.1210/jc.2011-1506
30. Zhang H, Zhang J, Pope CF, Crawford LA, Vasavada RC, Jagasia SM, et al. Gestational Diabetes Mellitus Resulting From Impaired Beta-Cell Compensation in the Absence of Foxm1, A Novel Downstream Effector of Placental Lactogen. Diabetes (2010) 59(1):143–52. doi: 10.2337/db09-0050
31. Choudhary GS, Al-Harbi S, Mazumder S, Hill BT, Smith MR, Bodo J, et al. MCL-1 and BCL-Xl-Dependent Resistance to the BCL-2 Inhibitor ABT-199 Can be Overcome by Preventing PI3K/AKT/Mtor Activation in Lymphoid Malignancies. Cell Death Dis (2015) 6(1):e1593. doi: 10.1038/cddis.2014.525
32. Ricciardi MR, Mirabilii S, Licchetta R, Piedimonte M, Tafuri A. Targeting the Akt, GSK-3, Bcl-2 Axis in Acute Myeloid Leukemia. Adv Biol Regul (2017) 65:36–58. doi: 10.1016/j.jbior.2017.05.002
33. Lachowiez CA, Loghavi S, Kadia TM, Daver N, Borthakur G, Pemmaraju N, et al. Outcomes of Older Patients With NPM1-Mutated AML: Current Treatments and the Promise of Venetoclax-Based Regimens. Blood Adv (2020) 4(7):1311–20. doi: 10.1182/bloodadvances.2019001267
34. Mullighan CG, Kennedy A, Zhou X, Radtke I, Phillips LA, Shurtleff SA, et al. Pediatric Acute Myeloid Leukemia With NPM1 Mutations Is Characterized by a Gene Expression Profile With Dysregulated HOX Gene Expression Distinct From MLL-Rearranged Leukemias. Leukemia (2007) 21(9):2000–9. doi: 10.1038/sj.leu.2404808
Keywords: FOXM1, AKT pathway, acute myeloid leukemia, positive feedback loop, drug resistance, HOXA gene family, venetoclax
Citation: Chesnokov MS, Borhani S, Halasi M, Arbieva Z, Khan I and Gartel AL (2021) FOXM1-AKT Positive Regulation Loop Provides Venetoclax Resistance in AML. Front. Oncol. 11:696532. doi: 10.3389/fonc.2021.696532
Received: 16 April 2021; Accepted: 08 July 2021;
Published: 26 July 2021.
Edited by:
Robert Ohgami, University of California, San Francisco, United StatesReviewed by:
Emiliano Fabiani, University of Rome Tor Vergata, ItalyMarek Mraz, Central European Institute of Technology (CEITEC), Czechia
Copyright © 2021 Chesnokov, Borhani, Halasi, Arbieva, Khan and Gartel. This is an open-access article distributed under the terms of the Creative Commons Attribution License (CC BY). The use, distribution or reproduction in other forums is permitted, provided the original author(s) and the copyright owner(s) are credited and that the original publication in this journal is cited, in accordance with accepted academic practice. No use, distribution or reproduction is permitted which does not comply with these terms.
*Correspondence: Andrei L. Gartel, YWdhcnRlbEB1aWMuZWR1; Irum Khan, aXJ1bWtoYW5AdWljLmVkdQ==
†These authors have contributed equally to this work and share first authorship