
94% of researchers rate our articles as excellent or good
Learn more about the work of our research integrity team to safeguard the quality of each article we publish.
Find out more
ORIGINAL RESEARCH article
Front. Oncol., 12 October 2021
Sec. Cancer Imaging and Image-directed Interventions
Volume 11 - 2021 | https://doi.org/10.3389/fonc.2021.672265
 Yan Bai1†
 Taiyuan Liu1†
 Lijuan Chen1Haiyan Gao1Wei Wei1
 Ge Zhang1Lifu Wang2Lingfei Kong2Siyun Liu3Huan Liu3Neil Roberts4
 Meiyun Wang1*
Objectives: To explore the efficacy of diffusion weighted imaging (DWI)-derived metrics under different models as surrogate indicators for molecular biomarkers and tumor microenvironment in gliomas.
Methods: A retrospective study was performed for 41 patients with gliomas. The standard apparent diffusion coefficient (ADCst) and ADC under ultra-high b values (ADCuh) (b values: 2500 to 5000 s/mm2) were calculated based on monoexponential model. The fraction of fast diffusion (f), pseudo ADC (ADCfast) and true ADC (ADCslow) were calculated by bi-exponential model (b values: 0 to 2000 s/mm2). The apparent diffusional kurtosis (Kapp) was derived from the simplified diffusion kurtosis imaging (DKI) model (b values: 200 to 3000 s/mm2). Potential correlations between DWI parameters and immunohistological indices (i.e. Aquaporin (AQP)1, AQP4, AQP9 and Ki-67) were investigated and DWI parameters were compared between high- and low-grade gliomas, and between tumor center and peritumor. Receiver operator characteristic (ROC) curve and area under the curve (AUC) were calculated to determine the performance of independent or combined DWI parameters in grading gliomas.
Results: The ADCslow and ADCuh at tumor center showed a stronger correlation with Ki-67 than other DWI metrics. The ADCst, ADCslow and ADCuh at tumor center presented correlations with AQP1 and AQP4 while AQP9 did not correlate with any DWI metric. Kapp showed a correlation with Ki-67 while no significant correlation with AQPs. ADCst (p < 0.001) and ADCslow (p = 0.001) were significantly lower while the ADCuh (p = 0.006) and Kapp (p = 0.005) were significantly higher in the high-grade than in the low-grade gliomas. ADCst, f, ADCfast, ADCslow, ADCuh, Kapp at the tumor center had significant differences with those in peritumor when the gliomas grade became high (p < 0.05). Involving ADCuh and Kapp simultaneously into an independent ADCst model (AUC = 0.833) could further improve the grading performance (ADCst+ADCuh+Kapp: AUC = 0.923).
Conclusion: Different DWI metrics fitted within different b-value ranges (low to ultra-high b values) have different efficacies as a surrogate indicator for molecular expression or microstructural complexity in gliomas. Further studies are needed to better explain the biological meanings of these DWI parameters in gliomas.
Gliomas are the most common primary brain tumors in adults and according to World Health Organization (WHO) guidelines are classified into four grades, which reflect increasing malignancy and worse prognosis (1). Assays of histopathology and molecular pathology based on tumor samples obtained by resection or biopsy are the gold standard for determining the pathological grade and molecular subtype. Accurate assessment of glioma grade, as well as phenotype and genotype, is of potential importance for the optimization of personalized treatment. However, inherently high heterogeneity of gliomas means that biopsy or localized resection may not be representative of the tumor as a whole.
Improving the non-invasive characterization of glioma physiology or pathology might help to improve the image-guided biopsy and therapy. Considering different regimes of b-value could control the degree of diffusion-weighting in the diffusion weighted imaging (DWI), different tissue properties reflected by the water diffusion could be encoded into DWI signals. Therefore, DWI is one of the potential tools to provide surrogate noninvasive imaging biomarkers for microenvironment in gliomas as the water diffusion coefficients could intermediately reflect the microstructure, perfusion or water exchange effects associated with transmembrane transport, such as facilitated diffusion (2, 3).
As the cell proliferation and the water transportation are highly suspected to influence the water diffusion properties in gliomas at extracellular, intracellular or transcellular space, Ki-67 or aquaporin (AQP) subtypes (AQP1, AQP4, AQP9) were welcomed molecular targets quantified by different DWI diffusion metrics (4, 5). Ki-67 is an immunohistochemical marker for the proliferation in gliomas which is known to correlate with tumor grading (4) and prognosis (6). AQPs provide a major pathway for the water transportation through cell membrane (7). And AQP subtypes, including AQP1, AQP4 and AQP9, are overexpressed in glioma cells and correlated with tumor grade and malignancy (8–12). AQP1, AQP4 and AQP9 were reported to be related to angiogenesis, invasion and peritumoral edema in gliomas. AQP1 predominantly locates in the perivascular space and it has been reported that increased AQP1 might induce vasogenic brain edema (13) and acceleration of cell migration and invasion (10, 14). AQP4 are mainly expressed by astrocytes and its redistribution is thought to control water mobility at the blood-brain interface and progress along with blood-brain barrier disturbance and vascular proliferation (11, 15, 16). Increased expression of AQP9 has been observed in glioma tissue near vessels and might promote the invasion and motility of cells (17, 18).
Several studies have demonstrated that some diffusion coefficients derived from intravoxel incoherent motion (IVIM), diffusion kurtosis imaging (DKI) or stretched-exponential models such as slow apparent diffusion coefficient (ADCslow), axial kurtosis and heterogeneity index α could correlate with Ki-67 expression in gliomas (4, 19, 20), whilst the DKI-derived mean kurtosis, diffusion tensor imaging-derived mean diffusivity, the apparent ADC and ADC derived from ultra-high b-value model showed different correlation tendency with AQP in gliomas (5, 21). However, the levels of the correlations seemed to be diverse and few studies have compared the efficacy of different kinds of model-derived parameters for indicating Ki-67 and AQP in gliomas among the same dataset.
Considering more DWI models to select more rational or efficient diffusion surrogate biomarkers for indicating molecular expression or phenomenologically depicting the gliomas microenvironment is necessary at present. In the current study, the diffusion metrics derived from mono-exponential model, IVIM model, DKI model and ultra-high b-value model, and their efficacy for quantifying Ki-67, AQP1, AQP4, and AQP9 were analyzed and compared. Among these models, the mono-exponential model could reflect apparent diffusion combining diffusion and perfusion; IVIM model could separate the slow diffusion in response to intra- or extracellular water molecules from the fast diffusion in response to tubular or vascular perfusion; DKI model could help provide general structure information and quantitative information about diffusion deviation from freely gaussian diffusion; and ultra-high b-value model could provide the diffusion information in the specific high b-value range which is potential to indicate transmembrane diffusion (2, 3). By comprehensively considering these models covering gaussian or non-gaussian assumption and b-value compartment, we expected to contribute as many shreds of evidence as possible during the formation of DWI biomarkers for the gliomas microenvironment. In addition, as the AQPs distribution indicates the disease progression (9, 22), the spatial distribution of the diffusion coefficients might noninvasively indicate physiological or pathological conditions related to the change of water exchange or transportation. Therefore, the same set of diffusion metrics from central and peritumoral regions of low- and high-grade gliomas were also analyzed and compared to help depict a more complete tumor microenvironment picture.
This retrospective study was approved by the local institutional review board, and written informed consent was obtained from each patient. A total of 45 patients with pathologically proven gliomas diagnosed between October 2014 and May 2016 were enrolled in the study. The inclusion criteria were as follows: (a) MRI examinations were performed on patients prior to treatments of tumors and (b) the pathological diagnoses and histological indices were acquired by surgical resections of gliomas. Four patients were excluded due to the presence of head movement artifacts in the DWI images. The final analysis was performed for a total of 41 patients with gliomas.
MRI investigations were performed for all patients by using a Discovery MR 750 3 T MRI system (GE Healthcare, Milwaukee, Wisconsin, USA). Firstly, T1-weighted (T1w) images were acquired using an Inversion-Recovery Fast Spin-Echo sequence with repetition time (TR) of 1593 msec and echo time (TE) of 24 msec, and T2-weighted (T2w) images were obtained by using a FSE sequence (TR/TE, 4600 msec/110 msec). Next, DWI was performed using a single-shot, echo-planar sequence (TR/TE, 4000 msec/112 msec; matrix, 128 × 128; Field of View (FOV), 24 × 24 cm2; and slice thickness, 4 mm). A total of 16 b values were acquired in three orthogonal directions at 0, 50, 100, 150, 200, 300, 400, 500, 800, 1000, 1500, 2000, 2500, 3000, 4000 and 5000 sec/mm2. Total acquisition time for DWI was 5 minutes 32 seconds. Finally, the T1w sequence was repeated after intravenous administration of 0.1 mmol/kg gadopentetate dimeglumine.
Two radiologists, blinded to the reports concerning tumor pathology, reviewed and analyzed all the MR images independently on a remote workstation. The radiologists independently drew three different regions of interests (ROIs) on the T2w echo-planar image for each tumor in the solid parts and regions within 1 cm peritumoral parts, respectively. Each MRI parameter in the solid parts or peritumoral region were determined by the averaged value of three ROIs, respectively. Areas of necrosis, hemorrhage and cerebrospinal fluid were excluded to ensure accurate measurements.
DWI data were transferred to a workstation (Advantage Workstation 4.5; GE Healthcare) for processing.
ADCst was calculated from b values of 0 and 1000 sec/mm2 by using a monoexponential DWI model (23) as Equation (1):
where S(b) represents the signal intensity in the presence of diffusion sensitization, and S(0) represents the signal intensity in the absence of diffusion sensitization. This model used the least square fit for linear fitting (24).
ADCslow was obtained from IVIM model with b values from 0 to 2000 sec/mm2 (23) as Equation (2):
where f represents the fraction of fast diffusion component, ADCfast represents the pseudo-diffusion coefficient, and ADCslow represents the slow diffusion coefficient. The Levenberg-Marquardt fit was used for nonlinear fitting (24).
ADCuh under ultra-high b values was calculated from b values of 2500, 3000, 4000 and 5000 sec/mm2 by using the above monoexponential DWI model (25) as Equation (1).
Apparent diffusional kurtosis (Kapp) was calculated from DKI model (26) according to Equation (3) with b-value ranging from 200 to 3000 sec/mm2:
where Dapp (unit: ×10-3 mm2/s) is the apparent diffusion coefficient fitted in low b-value range of 200-1000 sec/mm2, Kapp (unitless) is the apparent diffusional kurtosis which is fitted with b-value up to 3000 sec/mm2.
Specimens acquired from surgical resections were embedded in paraffin. AQP1, AQP4, AQP9 and Ki-67 immunohistostainings were conducted for quantification analyses. Slides were rinsed in phosphate buffer saline and blocked with 5% normal goat serum, followed by incubation with primary mouse monoclonal anti-AQP1 antibodies (ab9566, Abcam, Cambridge, UK), mouse monoclonal anti-AQP4 antibodies (ab11026, Abcam, Cambridge, UK), rabbit polyclonal anti-AQP9 antibodies (ab85910, Abcam, Cambridge, UK) or mouse monoclonal mouse anti-Ki-67 (ZM0165, Zhongshan Biotechnology Co., Ltd., Beijing, China) for 2 hours at 37°C. Slides were then incubated with horseradish peroxidase-conjugated secondary antibody diamino-benzidine (Fuzhou Maixin Biotechnology Development Co., Ltd., Fuzhou, China) for 10 minutes at 37°C, and visualized with diaminobenzidine substrate (Fuzhou Maixin Biotechnology Development Co., Ltd., Fuzhou, China).
Specimens acquired from surgical resections were embedded in paraffin and immunohistochemistry stains were applied for quantification of AQP1, AQP4, AQP9 and Ki-67. Histological indices of AQP1, AQP4, AQP9 and Ki-67 were independently measured by two pathologists by using a HMIAS-2000 Medical Color Image Analysis System (Champion Image Engineering Co., Ltd., Wuhan, China). The pathologists independently placed three different ROIs in the solid parts of each tumor for each patient. The ROIs excluded the areas of necrosis and hemorrhage. The IODs were measured for AQP1, AQP4, AQP9 and Ki-67, which were averaged from three delineated ROIs.
MedCalc software (version 19.0, MedCalc, Belgium) and R software (version 3.5.1) were used for statistical analyses. Correlations between DWI-derived parameters and histological indices were computed by using the Pearson’s correlation analysis. Steiger’s Z-test was used for comparing each two correlation coefficients (27). A correlation coefficient (r) of 0.75–1.00 was set to indicate very good to excellent correlation; 0.50–0.74, moderate to good correlation; 0.25–0.49, fair correlation; and 0.24 or lower indicate little or no correlation (28, 29). The Mann-Whitney U test was used for statistically comparing parameters between high-grade and low-grade gliomas. The significant difference of DWI-derived parameters between tumor center and peritumoral regions was analyzed by using the intragroup paired t-test or Wilcoxon matched-pairs signed rank test. A receiver operator characteristic (ROC) curve and area under the ROC curve (AUC) were calculated to evaluate the model performance in grading gliomas. The maximum Youden index was used to determine the threshold for calculating the sensitivity and specificity. AUC of the paired models were compared by Delong’s test. The continuous net reclassification improvement (NRI), and integrated discrimination improvement (IDI) indices were analyzed to assess the added value of combined models (30). Interobserver agreement for each measurement was calculated by using an Intraclass Correlation Coefficient (ICC) with 95% confidence interval (CI). Two sides p values less than 0.05 were considered statistically significant. The R packages were mainly involved as follows: “icc” was used for ICC calculation by setting “twoway” and type of “agreement”, “glmnet” package for logistic regression, “pROC” package for ROC analysis, “PredictABEL” was used for NRI and IDI evaluation, and “ggboxplot” for boxplot.
26 of 41 included patients (63.4%) were confirmed to have high-grade gliomas (grade 3 and grade 4) and the remaining 15 patients (36.6%) were confirmed to have low-grade (grade 2) gliomas.
The ICC between the two independent pathologists for measuring the IODs of AQP1, AQP4, AQP9 and Ki-67 were 0.861 (95% CI = 0.740-0.926), 0.853 (95% CI = 0.724-0.922), 0.841 (95% CI = 0.702-0.915) and 0.877 (95% CI = 0.769-0.934), respectively. The ICC between the two independent radiologists’ calculation of ADCst, f, ADCfast, ADCslow, ADCuh, Kapp values in the tumor center and peritumoral region were summarized in Table S1. All of the derived DWI metrics showed good to excellent inter-observer agreement (ICC > 0.8).
The significant differences in DWI-derived imaging parameters and histological indices between the high-grade and low-grade gliomas are listed in Table 1. Values of ADCst and ADCslow at the center of the tumor were significantly lower in high-grade gliomas than in low-grade gliomas, whereas the value of ADCuh at the center of the tumor was significantly increased in the high-grade gliomas than in the low-grade gliomas. Significant higher Kapp at tumor center were found in high-grade gliomas than in low-grade gliomas. Analysis of the histological indices showed that the expression of AQP1, AQP4 and Ki67 were significantly higher in the high-grade than in the low-grade gliomas, whereas the expression of AQP9 showed no significant difference between the high-grade and low-grade gliomas. The MRI and immunohistochemistry staining of the high-grade and low-grade gliomas are illustrated in Figures 1, 2, respectively.
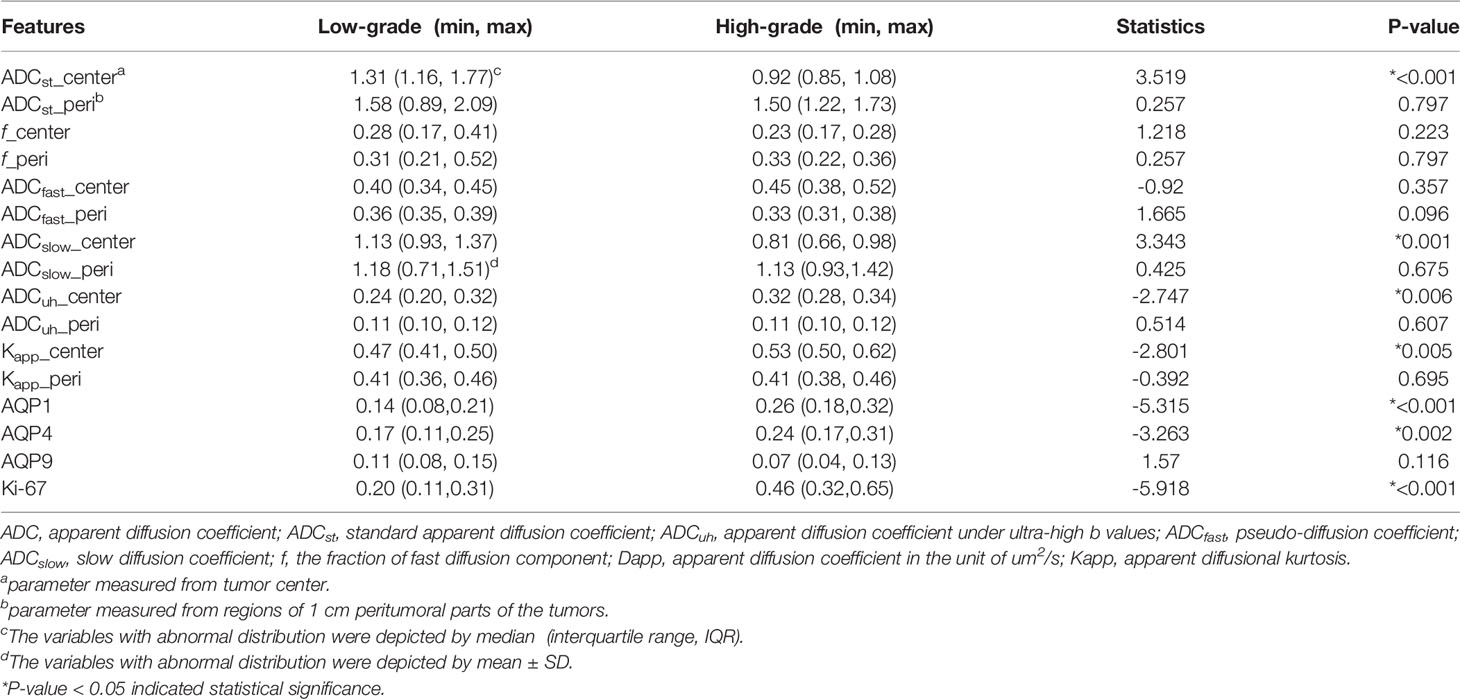
Table 1 The statistical difference analysis of DWI-derived metrics and histological indices between low- and high-grade gliomas.
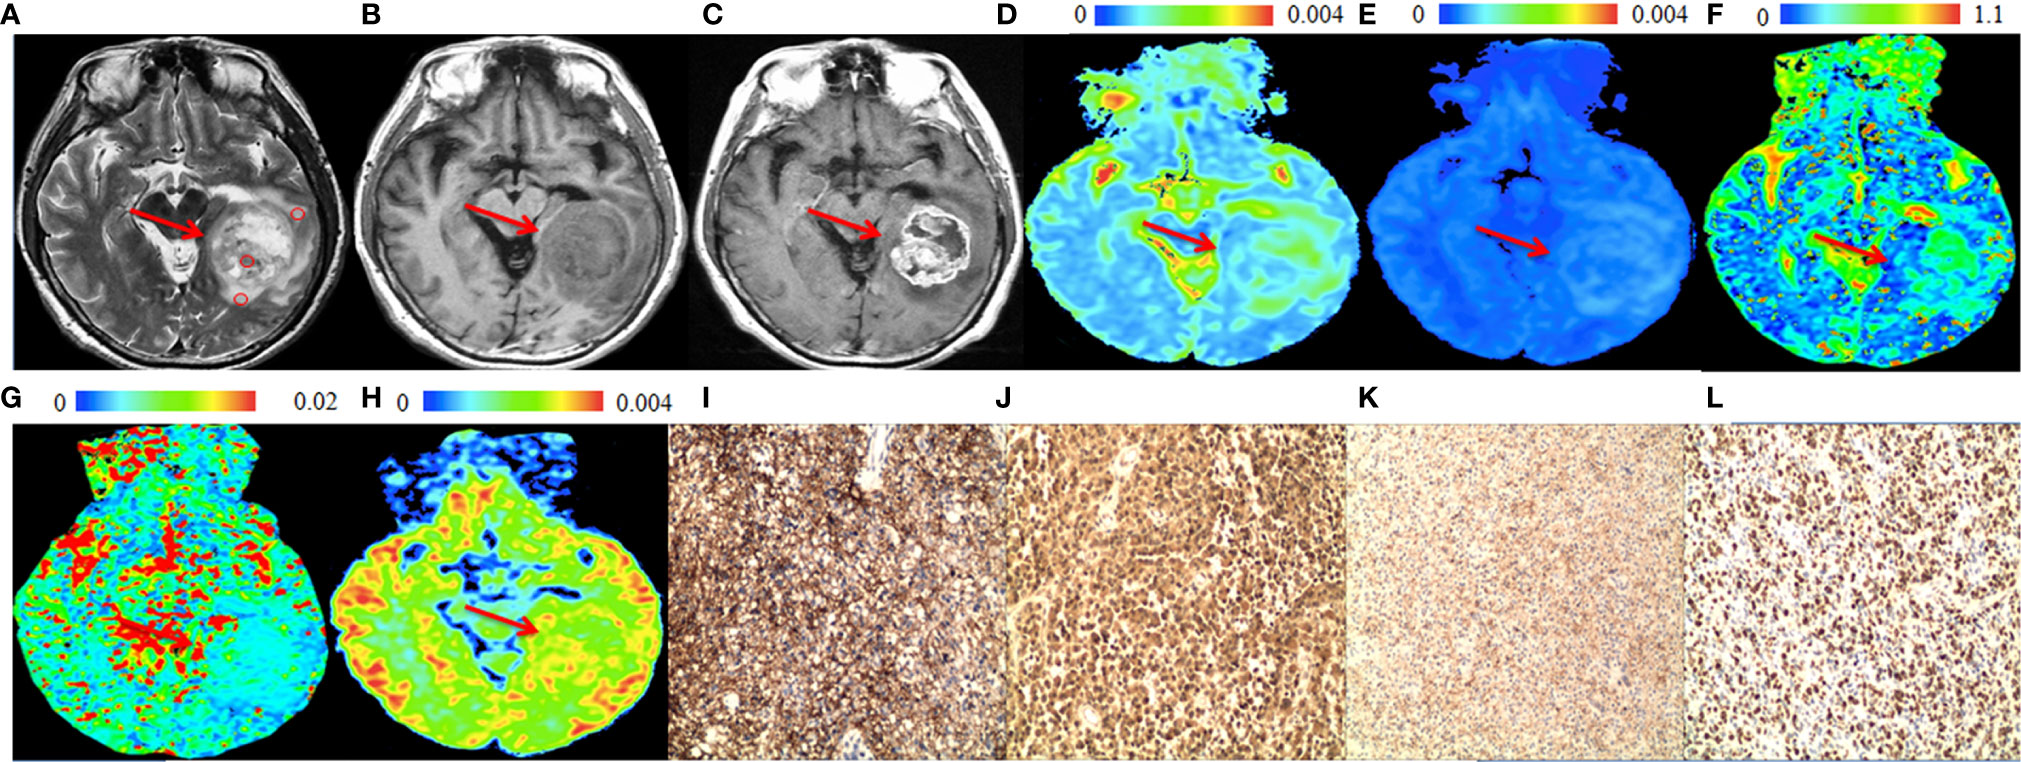
Figure 1 A 57-year-old male patient with a representative glioblastoma (World Health Organization grade 4). In the solid part of the tumor (arrows), (A) T2-weighted image shows isointense to hyperintense (circles are the regions of interest), (B) T1-weighted image shows hypointense. (C) Post-gadolinium T1-weighted image shows enhancement of the solid part of the tumor. (D) apparent diffusion coefficient (ADCslow) map and (E) slow diffusion coefficient (ADCslow) map show no increase of the values in the solid part of the tumor. (F) fraction of fast diffusion component (F) map show no increase of the values in the solid part of the tumor. (G) pseudo-diffusion coefficient (ADCfast) map shows increased values in the solid part of the tumor. (H) ADC with ultra-high b values (ADCuh) map shows increased value in the solid part of the tumor. (I) aquaporin (AQP)1, (J) AQP4 and (K) Ki-67 immunohistostaining maps show increased expression, whereas (L) AQP9 immunohistostaining map shows no obvious increased expression (original magnification, ×100).
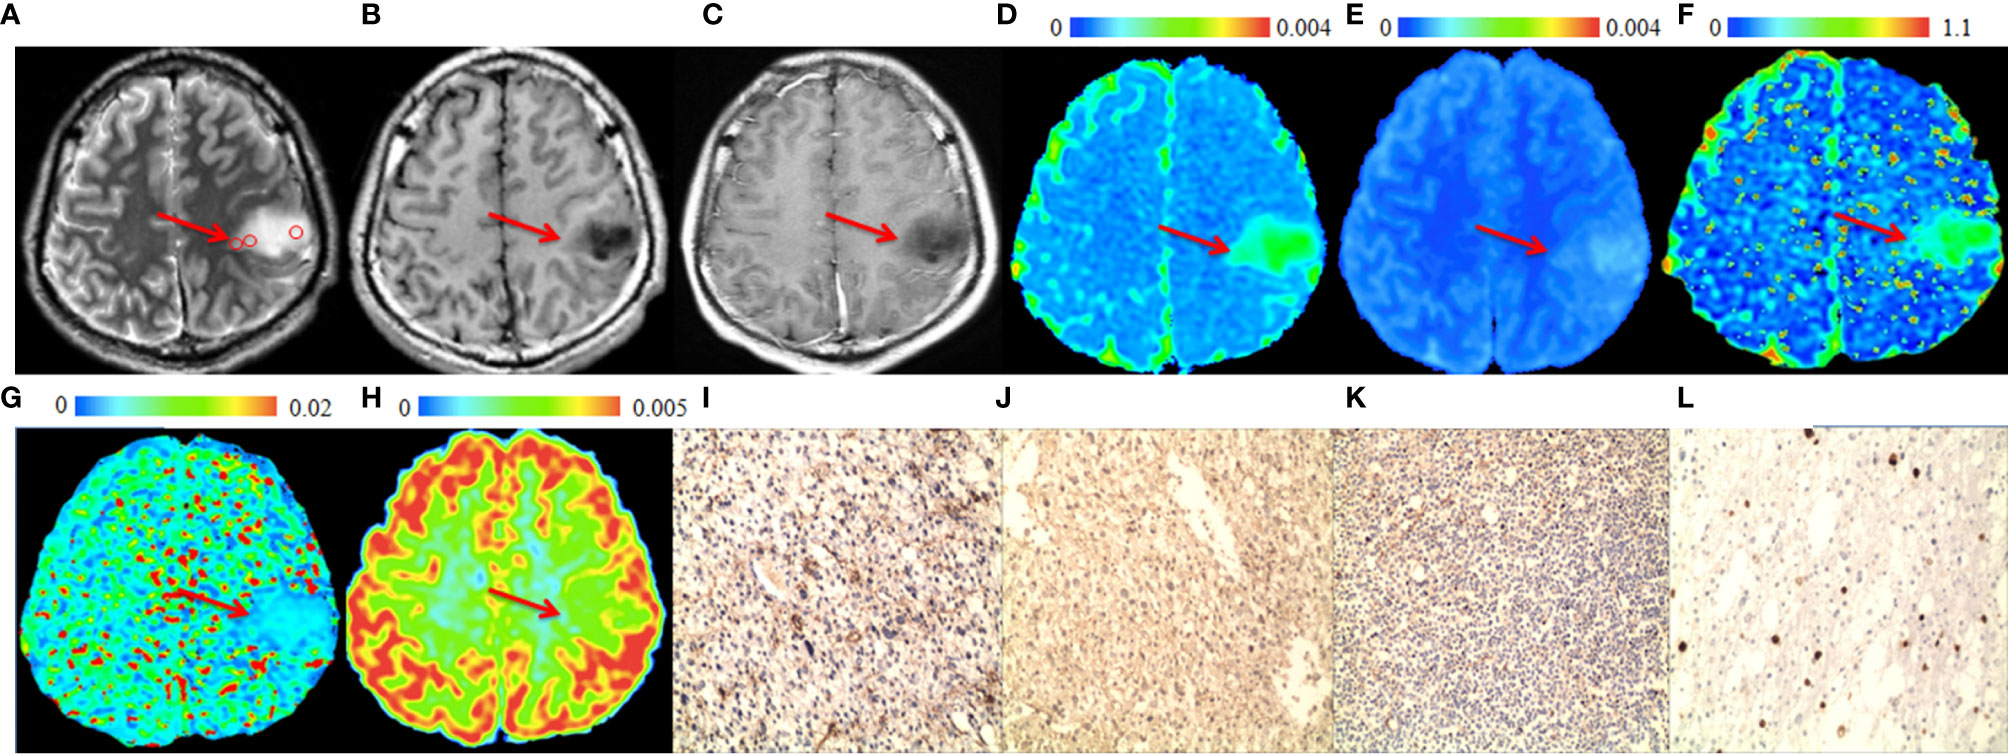
Figure 2 A 28-year-old male patient with a representative astrocytoma (World Health Organization grade 2). In the tumor (arrows), (A) T2-weighted image shows hyperintense (circles are the regions of interest), (B) T1-weighted image shows hypointense. (C) Post-gadolinium T1-weighted image shows no enhancement of the tumor. (D) ADC map and (E) ADCslow map show increased values in the tumor. (F) f map shows increased values in the tumor. (G) ADCfast map show no increase in the values in the tumor. (H) ADCuh map shows no obvious increase in the value in the tumor. (I) AQP1, (J) AQP4, (K) Ki-67 and (L) AQP9 immunohistostaining maps show no obvious increase in expression (original magnification, ×100).
The correlation analysis between DWI-derived imaging parameters and histological indices revealed that expression of AQP1, AQP4 and Ki67 were correlated with ADCst, f, ADCslow and ADCuh at the center of the tumor while had little correlation with those of peritumoral imaging parameters (see Table 2 and Figure 3). As shown in Table 2, the ADCst at the center of the tumor showed a small negative correlation with AQP1, AQP4 and Ki67 (p < 0.05). The f coefficient at the center of the tumor showed a small negative correlation with AQP1 and Ki67 (p < 0.05). The ADCslow at the center of the tumor showed a small negative correlation with AQP1, AQP4 and a moderate negative correlation with Ki-67 (p < 0.05). The ADCuh at the center of the tumor showed a small positive correlation with AQP1, AQP4 and Ki67. The DWI metric of Kapp at the center of the tumor showed weak positive and moderate negative correlation with Ki-67 expression (p < 0.05), while its correlation with AQPs was not obvious. There was no significant correlation between the expression of AQP9 and any of the imaging parameters (p > 0.05).
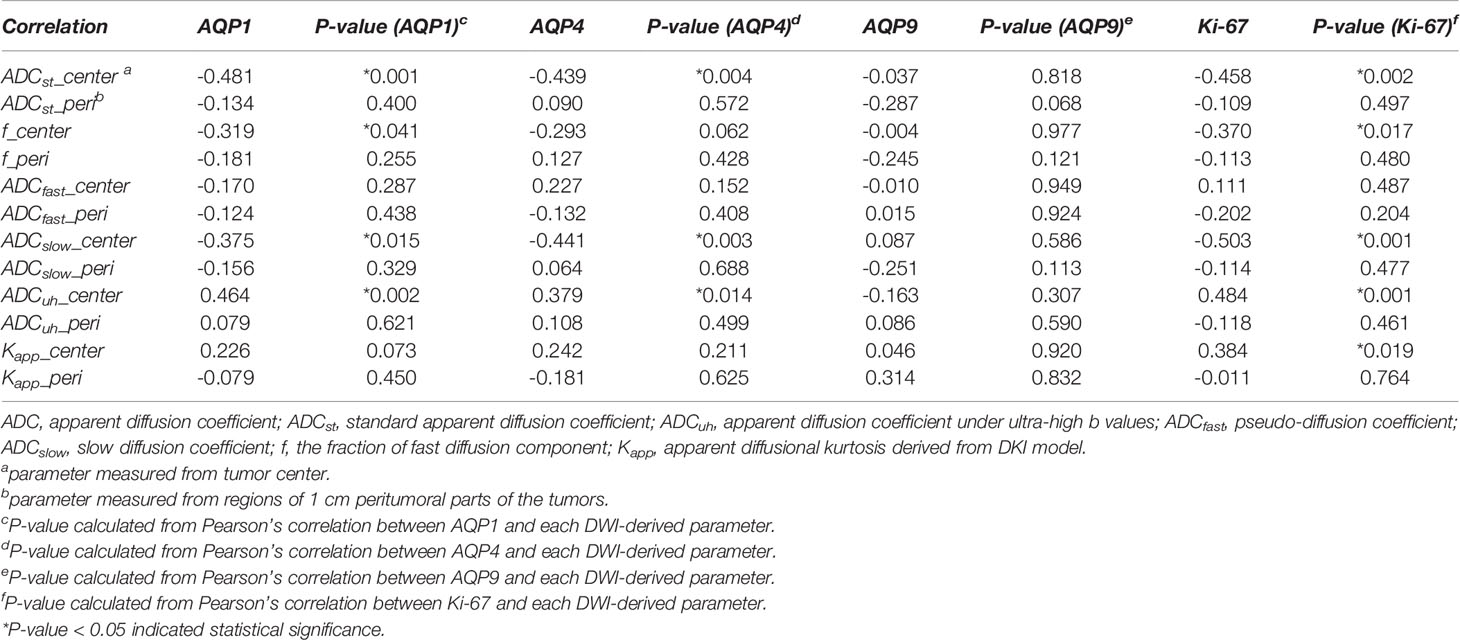
Table 2 Results of correlation analysis between DWI-Derived imaging metrics and histological indices of AQP1, AQP4, AQP9 and Ki-67 molecular expression.
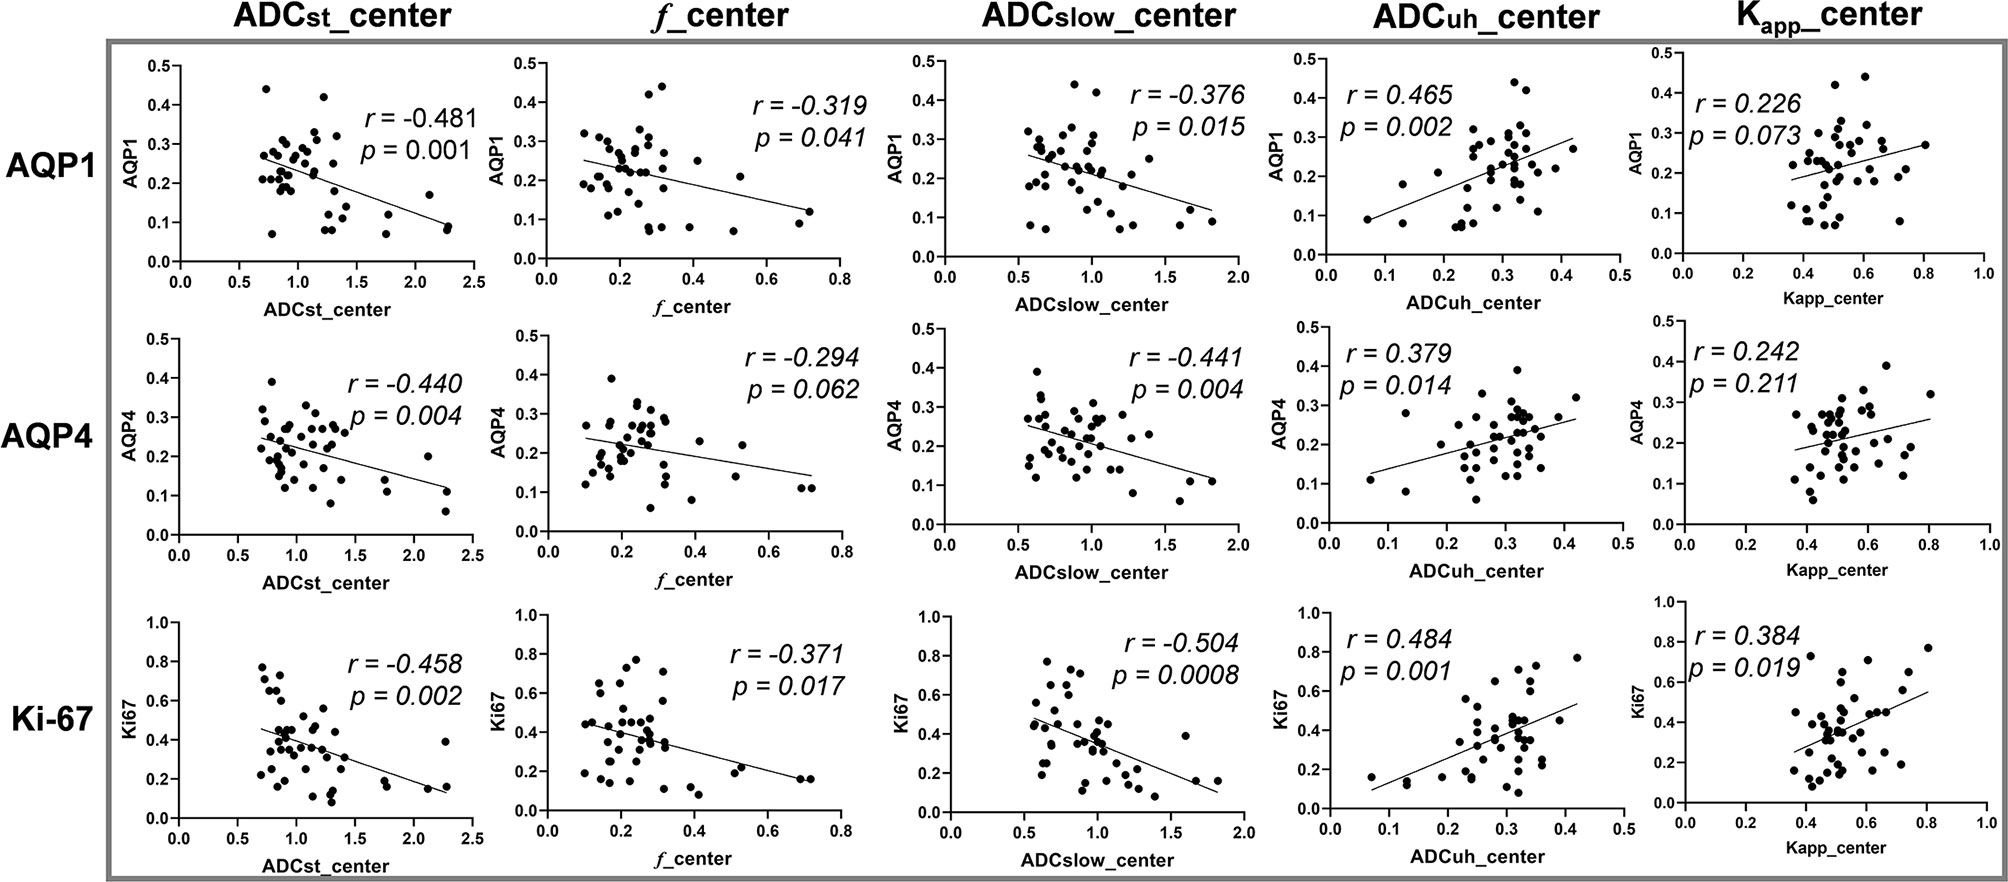
Figure 3 The correlation between diffusion weighted imaging (DWI) parameters and histological indices. Vertical coordinates in rows from top to bottom: AQP1, AQP4 and Ki-67 accordingly. Horizontal coordinates in columns from left to right: ADCst_center, f_center, ADCslow_center, ADCuh_center and Kapp_center accordingly. Center: parameter measured from tumor center.
In addition, the correlation analysis results between each pair of DWI-metrics derived from tumor center were summarized in Table S2. The ADCst showed significant correlation (p < 0.05) with other DWI metrics (f, ADCslow, ADCuh and Kapp), while ADCuh had no significant correlation (p > 0.05) with ADCslow and Kapp. The Steiger’s Z test results by comparing different DWI metrics’ correlations with the same histological biomarker were also summarized in Table S3. It indicated that there was no significant difference between ADCst and ADCslow for its respective correlation with an individual molecule. While significant differences existed between ADCuh and ADCst or ADCslow because of the inverse correlation tendency.
The DWI-derived imaging parameters at the center of the tumor and peritumoral area in low- and high-grade gliomas were statistically analyzed as shown in Figure 4.
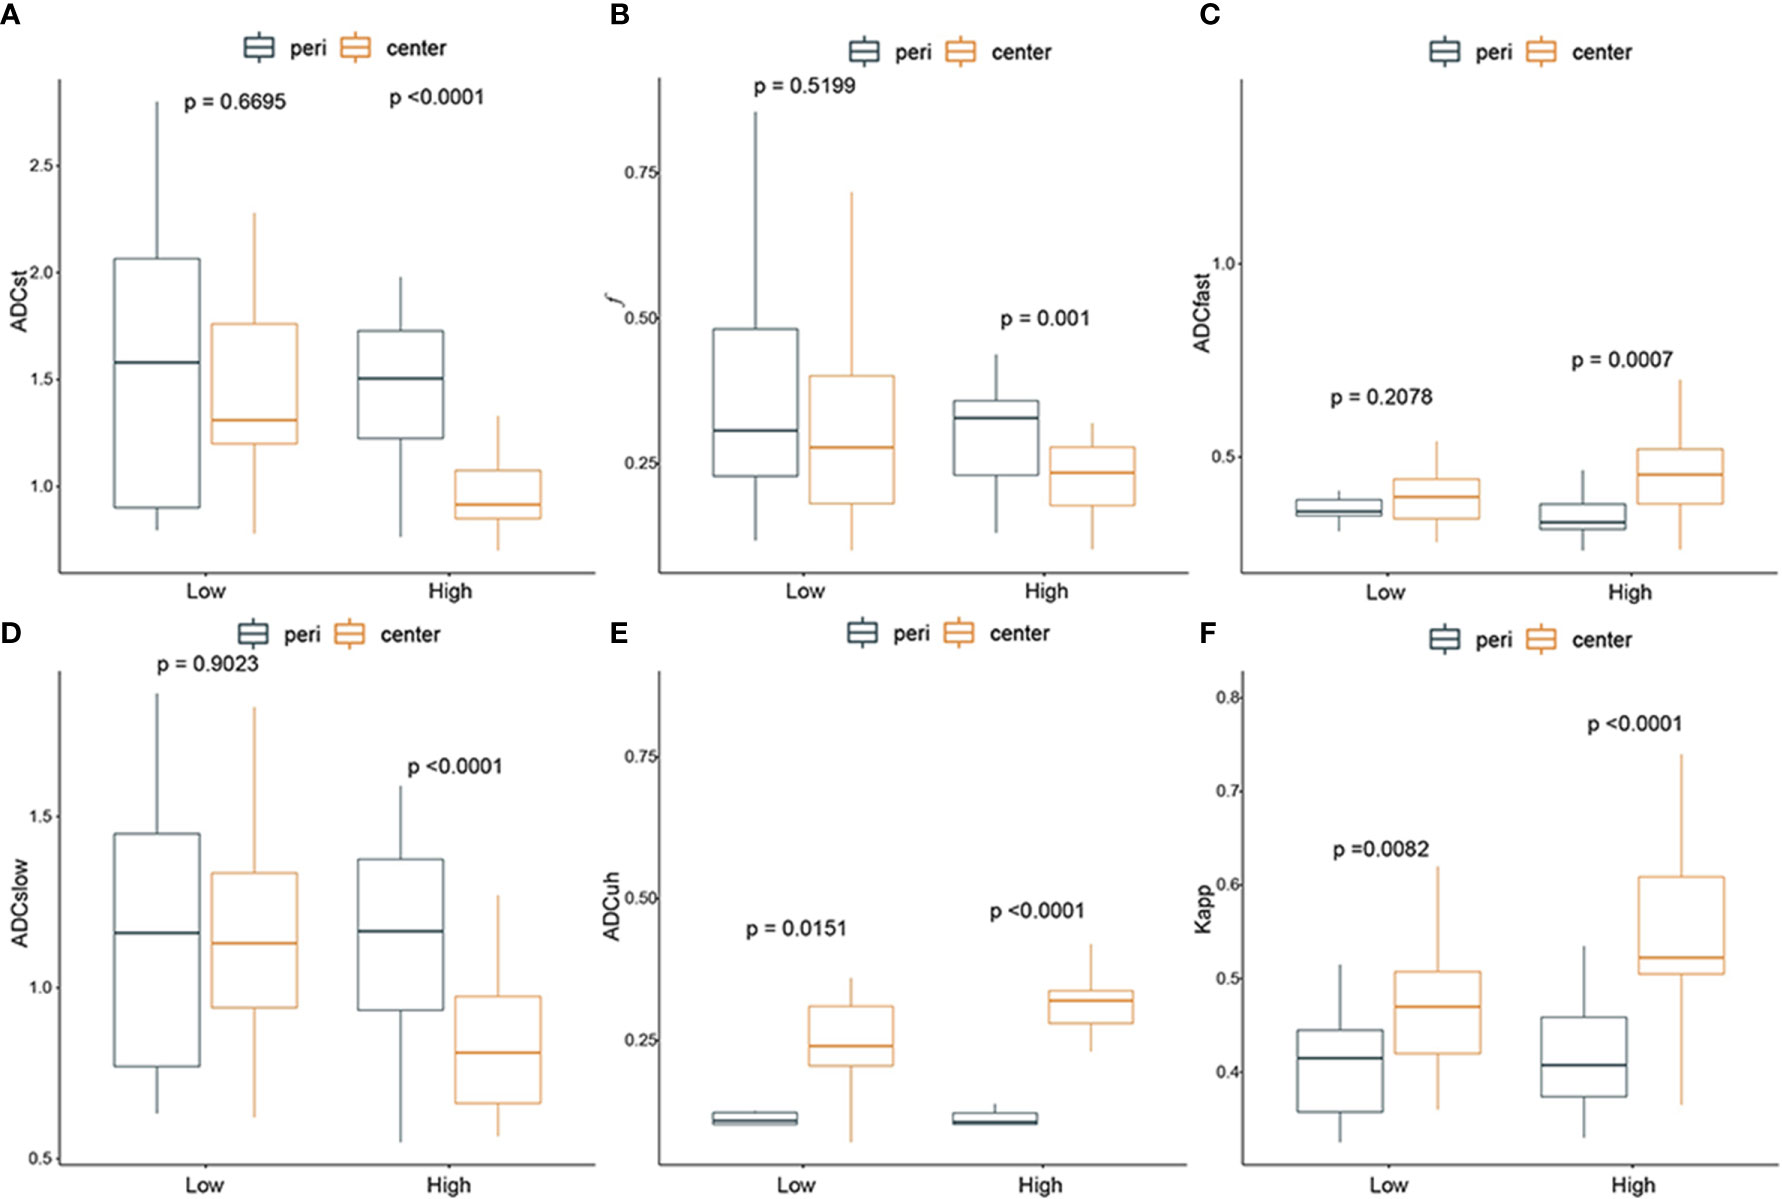
Figure 4 The difference between diffusion weighted imaging (DWI) parameters at the center of the tumor and peritumor in low- and high-grade gliomas. From (A–F): ADCst, f, ADCfast, ADCslow, ADCuh, Kapp. Black box: peritumoral region; yellow box: tumor center. P-value < 0.05 indicated statistical significance.
In summary, all the DWI-imaging parameters (including f, ADCst, ADCfast, ADCslow, ADCuh and Kapp) at the tumor center had significant differences compared with those in peritumoral areas when the glioma grade became high. And the ADCuh and Kapp at tumor center were significantly higher than that of peritumor in both low-grade gliomas and high-grade gliomas.
The ROC analysis for significant DWI imaging metrics measured from tumor center and histological biomarkers in discriminating high-grade gliomas from low-grade gliomas were conducted and compared as shown in Figure 5 and Table 3.
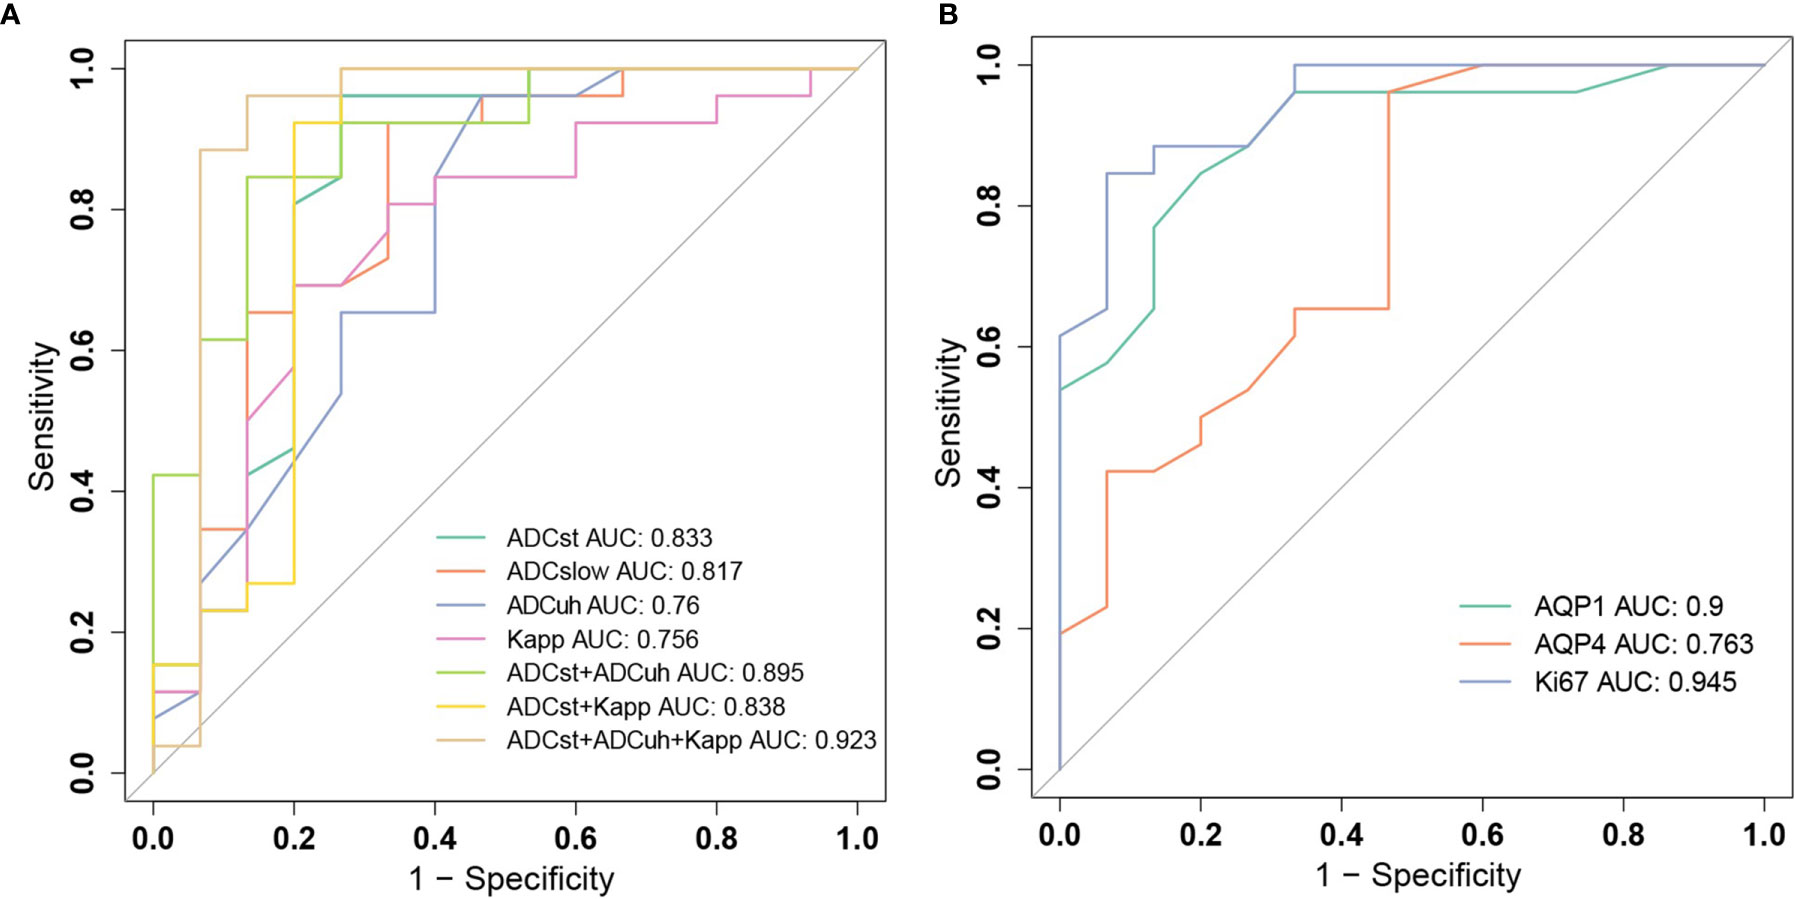
Figure 5 Receiver operating characteristic (ROC) curves for grading gliomas. (A) ROC curves of diffusion weighted imaging (DWI) parameters ADCst, ADCslow, ADCuh, Kapp and their combinations. (B) ROC curves of histological biomarkers of AQP1, AQP4 and Ki-67.
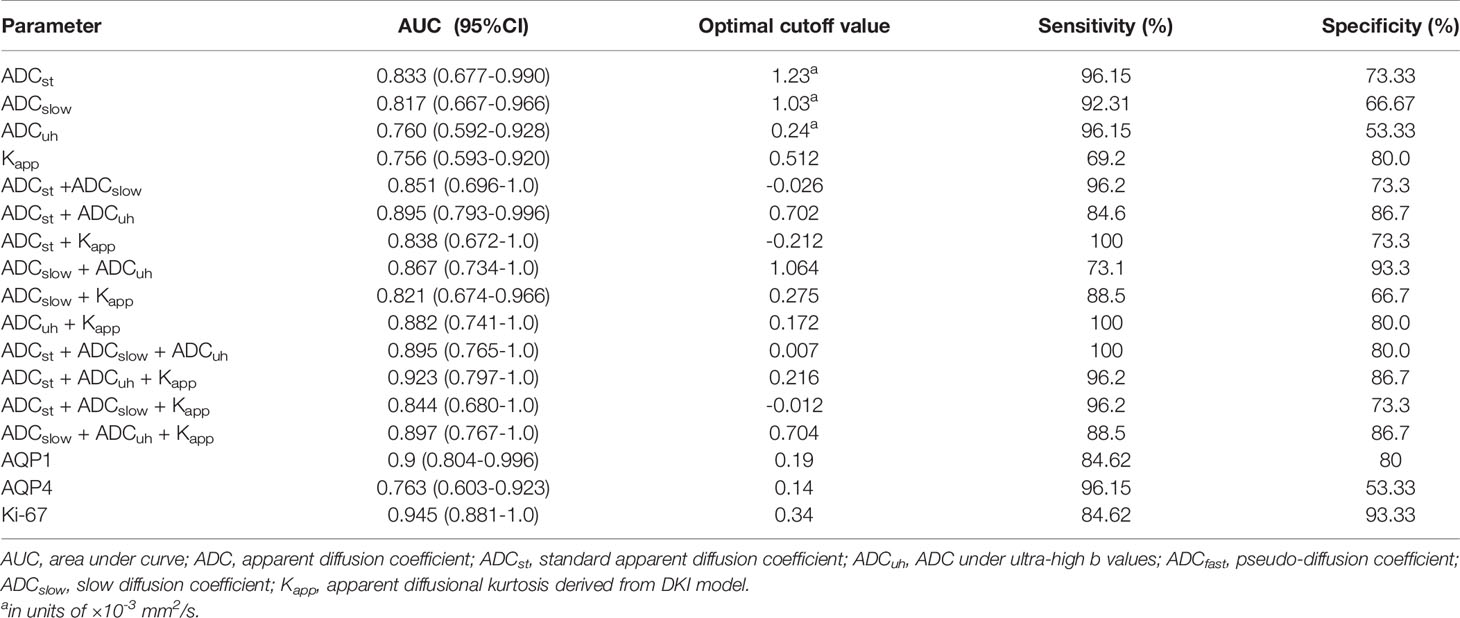
Table 3 The performance of diffusion weighted imaging derived imaging metrics at tumor center and histological biomarkers in differentiating low- and high-grade gliomas.
Among molecular biomarkers, Ki-67 presented a good diagnostic ability with the largest AUC and good sensitivity and specificity, which was followed by AQP1. AQP4 presented the best sensitivity whereas poor specificity was determined at a threshold of 0.14. For DWI imaging biomarkers, the ADCst had the largest AUC and relatively better sensitivity and specificity which was followed by ADCslow. The ADCuh and Kapp performed with a similar AUC of around 0.76. While ADCuh had a good sensitivity the same as the ADCst at a threshold of 0.24 and Kapp had a better specificity (80%) at a threshold of 0.512 compared with other independent imaging metrics. Meanwhile, we assessed the discrimination performance by combining two to three DWI metrics among ADCst, ADCslow, ADCuh and Kapp. From the aspect of AUC performance, the (ADCst + ADCuh: AUC = 0.895) and (ADCuh + Kapp: AUC = 0.882) represented better improvement among two-parameter-based combination models, and (ADCst + ADCuh +Kapp: AUC = 0.923) showed better improvement among three-parameter-based combination models. The paired AUC comparison results derived from the Delong’s test were summarized in Table S4 and the continuous NRI and IDI were summarized in Table S5. Delong’s test result showed that ADCuh at tumor center versus Ki-67 and AQP4 versus Ki67 had significant differences (p < 0.05) among independent imaging parameters or molecular markers. While for combined models, only ADCst+ADCuh+Kapp versus Kapp had a significant difference for AUC comparison (p < 0.05). Although the Delong’s test showed no significant AUC difference for some combined models compared with the independent model, significant improvement in discrimination (IDI, p < 0.05) and reclassification (NRI, p < 0.05) could be obtained by combinations among ADCst, ADCuh or Kapp compared with the independent model, except the comparison between ADCst + ADCuh versus ADCst model.
In the current study, DWI parameters metrics derived from low to ultra-high b values based on mono-exponential model, IVIM model, DKI model and ultra-high b-value model were analyzed from three aspects: (1) their association with expression of histological molecular biomarkers including Ki-67, AQP1, AQP4, and AQP9; (2) if they could be taken as noninvasive surrogated indicators for depicting microenvironment as tumor progression; (3) their preoperative diagnosing ability to differentiate low- and high-grade gliomas.
Our histological results were consistent with previous studies that the AQP1, AQP4 and Ki-67 expression were significantly increased in the high-grade gliomas compared with the low-grade gliomas (31, 32). Our dataset also showed that ADCst, ADCslow decreased and ADCuh, Kapp increased significantly in high-grade gliomas compared with low-grade ones.
The alteration of DWI metrics might be explained by molecular origins. The data presented in our study demonstrated that different DWI models fitted within different b-value regimes could influence the derived DWI metrics’ correlation level or tendency with histological biomarkers expression. Most of the DWI metrics derived from tumor center had correlations with Ki-67 which indicated tumor cell proliferation-related diffusion restriction effect (33). The ADCslow and ADCuh showed stronger correlations with Ki-67 than other DWI metrics in the current study. It was consistent with previous studies that ADCslow eliminated the effect of microcirculation and could better reflect the water restriction from tumor density and extracellular volume or deposition changes during tumor proliferation (4, 34). It has been also reported that ADC value obtained from high-b value (b = 3000 sec/mm2) had a stronger correlation with Ki-67 index, which was in agreement with the current result for ADCuh (35). ADCuh might give more chance to indirectly reflect the slower diffusion component involved in Ki-67-related proliferation.
The ADCst, ADCslow and ADCuh presented correlations with AQP1 and AQP4 in the current study, while AQP9 had no correlation with any DWI metrics. The ADCst and ADCuh presented stronger correlations with AQP1 expression. For AQP4, the ADCst and ADCslow showed stronger correlations.
With the knowledge of slower water transportation speed (36) resulted from the AQPs, previous studies indicated that ADC derived in the high-b value range might be one potential marker for AQPs expressions in gliomas (5) or other diseases (25, 37). However, our results showed that the ADCuh was not completely independent from other DWI metrics such as ADCst to independently indicate AQPs expression. And there were already a few studies that reported a negative correlation between ADCst and AQP4 during brain injury or ischemia, which were hypothesized to be associated with decreases in the extracellular space caused by cell swelling (28, 38). The water diffusion condition was originated from the combined contribution of the water exchange effect by AQP overexpression and the proliferation effect by Ki-67. Up-regulations of AQP1 and AQP4 could enhance migration and invasion of glioma cells. In the migration or invasion process, the AQPs might be involved in or play key roles in coordinated cell volume changes (39), reduced tumor cell adhesion with surrounding cells (40), degradation of extracellular matrix (41) and rapid transmembrane water fluxes during lamellipodia formations of glioma cells (14). In addition, AQP1 upregulation is associated with angiogenesis (32) and tumor-associated edema formation (42) and AQP4 redistribution might be functional in the reabsorption of excess cerebral fluid during vasogenic edema (38, 43, 44). These processes might influence the water diffusion in the tissue and transmembrane or microcirculation. In addition, mean kurtosis, as one potential DWI metric measuring the degree of diffusion hindrance or restriction, has been reported to correlate with AQP4 expression in gliomas (21). In the current dataset, the Kapp showed a larger value in high-grade gliomas which was in accordance with previous studies (45, 46). However, it only showed a significant weak positive correlation with Ki-67 which indirectly reflects proliferation-related diffusion barriers (47). No significant correlation with AQP1 or AQP4 was found for Kapp in the current research. As parameters derived from models involving high-b value, ADCuh and Kapp had different correlation levels with AQPs which might be resulted from the different b-value range for fitting. But the current dataset could not provide sufficient explanations for such deviation. More pathological evidences and a larger sample size should be supplemented to reveal the actual mechanism for AQP-related diffusion effect.
The statistical differences between the DWI metrics derived from tumor center and peritumoral area were analyzed to explore if DWI metrics could be useful to noninvasively describe the glioma microenvironment. In the current study, as gliomas grade increased, the DWI-derived parameters in the tumor center deviated more significantly from those in the peritumoral area. The ADCst at the center of the tumor decreased significantly than that of the peritumoral area in high-grade gliomas which might be a good indicator for the enhanced cellularity in the solid tumor center (48). However, the ADCst might ignore the perfusion effect resulted from tumor vasculature. Therefore, bi-exponential IVIM model was used to distinguish the perfusion and diffusion effects. As expected, the ADCfast increased, ADCslow decreased and Kapp increased respectively at tumor center compared with those at the peritumoral area in the high-grade gliomas whereas these differences were not significant in the low-grade gliomas. Firstly, the decrease of “true” diffusion coefficient ADCslow and Kapp in the tumor center might represent the more complicated or heterogenous tumor microstructure, which was in accordance with proliferation-related Ki-67 expression (49). Secondly, as ADCfast (b < 200 sec/mm2) was able to reflect effective perfusion index (50), the increase of ADCfast at tumor center might be well correlated to perfusion-related angiogenesis of gliomas, which was consistent with the previous study (24). It has been reported that the growth of malignant glioma (WHO grade III and IV) is dependent on new neovascularization which may result in increased permeability, blood flow and transport properties (51, 52). The relative cerebral blood volume increased more frequently in the high-grade gliomas than in the low-grade gliomas (53). Moreover, the AQP1 upregulation might also contribute to the angiogenesis in high grade gliomas (41). The volume fraction of fast pool f is mainly affected by the fraction of capillaries and microcirculations. But the f parameter at tumor center and peritumor showed an inverse tendency compared with perfusion-related ADCfast, in which the f became smaller at tumor center as glioma grade increase. Such controversy between f and ADCfast existed in a previous report (24). The possible reason for this is that the IVIM model doesn’t involve the influence of echo time to f. The T2 value of brain tissues including white or grey matter under 3.0T MRI is greatly deviated from blood’s T2 value. Such deviation might be the reason for the uncertainty of f value. Although the current study showed correlations for AQP expression with ADCuh, ADCst or ADCslow, we still cannot infer that the AQP1 or AQP4 distribution in the tumor center might be denser than peritumor as the immunohistochemical results were only obtained for the solid tumor part. In addition, it has been reported that AQP1 up-regulation is associated with angiogenesis in gliomas and is predominantly located perivascularly and in areas of tumor infiltration whereas distant from the tumor center (32). AQP4 was also reported to have higher expression in both tumor and peritumor than in normal tissues in gliomas, but the degree of peritumoral edema only positively correlates with the expression level of AQP4 in peritumor (9, 22). Therefore, further research is warranted to clarify the spatial distribution of AQPs expressions or tissue arrangement by using pathological, molecular imaging or functional imaging methods and contribute more explanations for DWI metrics.
Finally, the diagnostic performance of the DWI parameters (ADCst, ADCslow, ADCuh and Kapp) in differentiating high-grade and low-grade gliomas. We demonstrated that the ADCst had largest AUC 0.833 which was followed by ADCslow. While ADCuh had a good sensitivity the same as the ADCst. Although there have been reported that conventional ADCst performed well in grading gliomas (47, 54), the added value of other DWI metrics derived from IVIM, ultra-high-b value or DKI model is still worthy of study (5, 19, 55). The current research revealed that increased NRI and IDI indices could be obtained by introducing ADCuh and Kapp into independent ADCst in grading gliomas.
Comprehensive analysis of the relationship between DWI-derived parameters and indices of histopathology has demonstrated the potential of establishing imaging biomarkers reflecting the tumor microenvironment in gliomas. However, further research is required to address several limitations of the present study. Firstly and most importantly, whereas imaging ROIs were placed both at the center of the tumor and in the peritumor, histology assays were not performed separately for these two areas and tumor heterogeneity may have resulted in selection bias. In future studies techniques should be applied so that the imaging and histology refer to the same sampling locations. In addition, by considering the limited sampling area for pathological methods, molecular imaging and functional imaging such as perfusion imaging might be potential methods to help explain the biological significance of DWI metrics. Secondly, the number of patients was relatively small and statistical analysis could not be reliably applied to study different glioma subtypes. As well as studying a larger cohort, additional molecular biomarkers, including proteins and genes, should be included in future studies. Finally, treatment planning must include consideration of regions of glioma infiltration and study of the microenvironment in and beyond the peritumor region is important.
In conclusion, different DWI metrics fitted within different b-value ranges (from low to ultra-high b values) could act with different efficacy as surrogate indicator for molecular expression or microstructural complexity in gliomas. Further studies which associate pathology or physiology with imaging performance are needed to better explain the biological meanings for these DWI parameters in gliomas.
The original contributions presented in the study are included in the article/Supplementary Material. Further inquiries can be directed to the corresponding author.
The studies involving human participants were reviewed and approved by Institutional Review Board of Henan Provincial People’s Hospital. The patients/participants provided their written informed consent to participate in this study.
YB, TL, LC, HG, WW, GZ, SL, HL, and MW designed the overall study, and performed the experiments. YB and MW analyzed imaging data. LW and LK performed histological studies. YB, TL, and MW interpreted the results, and wrote the manuscript. NR revised the language of the manuscript. All authors contributed to the article and approved the submitted version.
This work was supported by the National Natural Science Foundation of China (81720108021, 81601466), National Key R&D Program of China (2017YFE0103600), Scientific and Technological Research Project of Henan Province (182102310496), Medical Science and Technology Research Project of Henan Province (2018020403).
SL and HL are employees of GE Healthcare, China.
The remaining authors declare that the research was conducted in the absence of any commercial or financial relationships that could be construed as a potential conflict of interest.
All claims expressed in this article are solely those of the authors and do not necessarily represent those of their affiliated organizations, or those of the publisher, the editors and the reviewers. Any product that may be evaluated in this article, or claim that may be made by its manufacturer, is not guaranteed or endorsed by the publisher.
The authors thank Zhoushe Zhao, PhD, at GE Healthcare China, for the technical support.
The Supplementary Material for this article can be found online at: https://www.frontiersin.org/articles/10.3389/fonc.2021.672265/full#supplementary-material
1. Louis DN, Ohgaki H, Wiestler OD, Cavenee WK, Burger PC, Jouvet A, et al. The 2007 WHO Classification of Tumours of the Central Nervous System. Acta Neuropathol (2007) 114(2):97–109. doi: 10.1007/s00401-007-0243-4
2. Le Bihan D. Apparent Diffusion Coefficient and Beyond: What Diffusion MR Imaging Can Tell Us About Tissue Structure. Radiology (2013) 268(2):318–22. doi: 10.1148/radiol.13130420
3. Tang L, Zhou XJ. Diffusion MRI of Cancer: From Low to High B-Values. J Magn Reson Imaging (2019) 49(1):23–40. doi: 10.1002/jmri.26293
4. Wang C, Dong H. Ki-67 Labeling Index and the Grading of Cerebral Gliomas by Using Intravoxel Incoherent Motion Diffusion-Weighted Imaging and Three-Dimensional Arterial Spin Labeling Magnetic Resonance Imaging. Acta Radiol (2020) 61(8):1057–63. doi: 10.1177/0284185119891694
5. Tan Y, Zhang H, Wang XC, Qin JB, Wang L. The Value of Multi Ultra High-B-Value DWI in Grading Cerebral Astrocytomas and Its Association With Aquaporin-4. Br J Radiol (2018) 91(1086):20170696. doi: 10.1259/bjr.20170696
6. Torp SH. Diagnostic and Prognostic Role of Ki67 Immunostaining in Human Astrocytomas Using Four Different Antibodies. Clin Neuropathol (2002) 21(6):252–7.
7. Verkman AS, Mitra AK. Structure and Function of Aquaporin Water Channels. Am J Physiol Renal Physiol (2000) 278(1):F13–28. doi: 10.1152/ajprenal.2000.278.1.F13
8. Ding T, Ma Y, Li W, Liu X, Ying G, Fu L, et al. Role of Aquaporin-4 in the Regulation of Migration and Invasion of Human Glioma Cells. Int J Oncol (2011) 38(6):1521–31. doi: 10.3892/ijo.2011.983
9. Hayashi Y, Edwards NA, Proescholdt MA, Oldfield EH, Merrill MJ. Regulation and Function of Aquaporin-1 in Glioma Cells. Neoplasia (New York NY) (2007) 9(9):777–87. doi: 10.1593/neo.07454
10. Warth A, Mittelbronn M, Hülper P, Erdlenbruch B, Wolburg H. Expression of the Water Channel Protein Aquaporin-9 in Malignant Brain Tumors. Appl Immunohistochem Mol Neuropathologica: AIMM (2007) 15(2):193–8. doi: 10.1097/01.pai.0000213110.05108.e9
11. Warth A, Simon P, Capper D, Goeppert B, Tabatabai G, Herzog H, et al. Expression Pattern of the Water Channel Aquaporin-4 in Human Gliomas Is Associated With Blood-Brain Barrier Disturbance But Not With Patient Survival. J Neurosci Res (2007) 85(6):1336–46. doi: 10.1002/jnr.21224
12. Zhao WJ, Zhang W, Li GL, Cui Y, Shi ZF, Yuan F. Differential Expression of MMP-9 and AQP4 in Human Glioma Samples. Folia Neuropathol (2012) 50(2):176–86.
13. Venero JL, Machado A, Cano J. Importance of Aquaporins in the Physiopathology of Brain Edema. Curr Pharm Des (2004) 10(18):2153–61. doi: 10.2174/1381612043384150
14. Saadoun S, Papadopoulos MC, Hara-Chikuma M, Verkman AS. Impairment of Angiogenesis and Cell Migration by Targeted Aquaporin-1 Gene Disruption. Nature (2005) 434(7034):786–92. doi: 10.1038/nature03460
15. Amiry-Moghaddam M, Otsuka T, Hurn PD, Traystman RJ, Haug FM, Froehner SC, et al. An Alpha-Syntrophin-Dependent Pool of AQP4 in Astroglial End-Feet Confers Bidirectional Water Flow Between Blood and Brain. Proc Natl Acad Sci USA (2003) 100(4):2106–11. doi: 10.1073/pnas.0437946100
16. Xiong W, Ran J, Jiang R, Guo P, Shi X, Li H, et al. miRNA-320a Inhibits Glioma Cell Invasion and Migration by Directly Targeting Aquaporin 4. Oncol Rep (2018) 39(4):1939–47. doi: 10.3892/or.2018.6274
17. Jelen S, Parm Ulhøi B, Larsen A, Frøkiær J, Nielsen S, Rützler M. AQP9 Expression in Glioblastoma Multiforme Tumors Is Limited to a Small Population of Astrocytic Cells and CD15(+)/CalB(+) Leukocytes. PloS One (2013) 8(9):e75764. doi: 10.1371/journal.pone.0075764
18. Lv Y, Huang Q, Dai W, Jie Y, Yu G, Fan X, et al. AQP9 Promotes Astrocytoma Cell Invasion and Motility via the AKT Pathway. Oncol Lett (2018) 16(5):6059–64. doi: 10.3892/ol.2018.9361
19. Zhao J, Wang YL, Li XB, Hu MS, Li ZH, Song YK, et al. Comparative Analysis of the Diffusion Kurtosis Imaging and Diffusion Tensor Imaging in Grading Gliomas, Predicting Tumour Cell Proliferation and IDH-1 Gene Mutation Status. J Eurooncol (2019) 141(1):195–203. doi: 10.1007/s11060-018-03025-7
20. Yan R, Haopeng P, Xiaoyuan F, Jinsong W, Jiawen Z, Chengjun Y, et al. Non-Gaussian Diffusion MR Imaging of Glioma: Comparisons of Multiple Diffusion Parameters and Correlation With Histologic Grade and MIB-1 (Ki-67 Labeling) Index. Neuroradiology (2016) 58(2):121–32. doi: 10.1007/s00234-015-1606-5
21. Tan Y, Zhang H, Zhao RF, Wang XC, Qin JB, Wu XF. Comparison of the Values of MRI Diffusion Kurtosis Imaging and Diffusion Tensor Imaging in Cerebral Astrocytoma Grading and Their Association With Aquaporin-4. Neurol India (2016) 64(2):265–72. doi: 10.4103/0028-3886.177621
22. Mou K, Chen M, Mao Q, Wang P, Ni R, Xia X, et al. AQP-4 in Peritumoral Edematous Tissue Is Correlated With the Degree of Glioma and With Expression of VEGF and HIF-Alpha. J Neurooncol (2010) 100(3):375–83. doi: 10.1007/s11060-010-0205-x
23. Iima M, Reynaud O, Tsurugizawa T, Ciobanu L, Li JR, Geffroy F, et al. Characterization of Glioma Microcirculation and Tissue Features Using Intravoxel Incoherent Motion Magnetic Resonance Imaging in a Rat Brain Model. Invest Radiol (2014) 49(7):485–90. doi: 10.1097/rli.0000000000000040
24. Hu YC, Yan LF, Wu L, Du P, Chen BY, Wang L, et al. Intravoxel Incoherent Motion Diffusion-Weighted MR Imaging of Gliomas: Efficacy in Preoperative Grading. Sci Rep (2014) 4:7208. doi: 10.1038/srep07208
25. Xueying L, Zhongping Z, Zhoushe Z, Li G, Yongjin T, Changzheng S, et al. Investigation of Apparent Diffusion Coefficient From Ultra-High B-Values in Parkinson’s Disease. Eur Radiol (2015) 25(9):2593–600. doi: 10.1007/s00330-015-3678-3
26. Jensen JH, Helpern JA, Ramani A, Lu H, Kaczynski K. Diffusional Kurtosis Imaging: The Quantification of Non-Gaussian Water Diffusion by Means of Magnetic Resonance Imaging. Magn Reson Med (2005) 53(6):1432–40. doi: 10.1002/mrm.20508
27. Steiger JH. Tests for Comparing Elements of a Corelation Matrix. Psychol Bull (1980) 87:245–51. doi: 10.1037/0033-2909.87.2.245
28. Kong L, Lian G, Zheng W, Liu H, Zhang H, Chen R. Effect of Alcohol on Diffuse Axonal Injury in Rat Brainstem: Diffusion Tensor Imaging and Aquaporin-4 Expression Study. BioMed Res Int (2013) 2013:798261. doi: 10.1155/2013/798261
29. Heo SH, Jeong YY, Shin SS, Kim JW, Lim HS, Lee JH, et al. Apparent Diffusion Coefficient Value of Diffusion-Weighted Imaging for Hepatocellular Carcinoma: Correlation With the Histologic Differentiation and the Expression of Vascular Endothelial Growth Factor. Korean J Radiol (2010) 11(3):295–303. doi: 10.3348/kjr.2010.11.3.295
30. Pepe MS, Kerr KF, Longton G, Wang Z. Testing for Improvement in Prediction Model Performance. Stat Med (2013) 32(9):1467–82. doi: 10.1002/sim.5727
31. Suzuki Y, Nakamura Y, Yamada K, Kurabe S, Okamoto K, Aoki H, et al. Aquaporin Positron Emission Tomography Differentiates Between Grade III and IV Human Astrocytoma. Neurosurgery (2018) 82(6):842–6. doi: 10.1093/neuros/nyx314
32. El Hindy N, Bankfalvi A, Herring A, Adamzik M, Lambertz N, Zhu Y, et al. Correlation of Aquaporin-1 Water Channel Protein Expression With Tumor Angiogenesis in Human Astrocytoma. Anticancer Res (2013) 33(2):609–13.
33. Calvar JA, Meli FJ, Romero C, Calcagno ML, Yánez P, Martinez AR, et al. Characterization of Brain Tumors by MRS, DWI and Ki-67 Labeling Index. J Neuro-oncol (2005) 72(3):273–80. doi: 10.1007/s11060-004-3342-2
34. Zámecník J, Vargová L, Homola A, Kodet R, Syková E. Extracellular Matrix Glycoproteins and Diffusion Barriers in Human Astrocytic Tumours. Neuropathol Appl Neurobiol (2004) 30(4):338–50. doi: 10.1046/j.0305-1846.2003.00541.x
35. Zeng Q, Dong F, Shi F, Ling C, Jiang B, Zhang J. Apparent Diffusion Coefficient Maps Obtained From High B Value Diffusion-Weighted Imaging in the Preoperative Evaluation of Gliomas at 3T: Comparison With Standard B Value Diffusion-Weighted Imaging. Eur Radiol (2017) 27(12):5309–15. doi: 10.1007/s00330-017-4910-0
36. Ibata K, Takimoto S, Morisaku T, Miyawaki A, Yasui M. Analysis of Aquaporin-Mediated Diffusional Water Permeability by Coherent Anti-Stokes Raman Scattering Microscopy. Biophys J (2011) 101(9):2277–83. doi: 10.1016/j.bpj.2011.08.045
37. Wang Y, Zhang H, Zhang R, Zhao Z, Xu Z, Wang L, et al. Investigation of Aquaporins and Apparent Diffusion Coefficient From Ultra-High B-Values in a Rat Model of Diabetic Nephropathy. Eur Radiol Exp (2017) 1(1):13. doi: 10.1186/s41747-017-0016-3
38. Yao X, Derugin N, Manley GT, Verkman AS. Reduced Brain Edema and Infarct Volume in Aquaporin-4 Deficient Mice After Transient Focal Cerebral Ischemia. Neurosci Lett (2015) 584:368–72. doi: 10.1016/j.neulet.2014.10.040
39. McCoy E, Sontheimer H. Expression and Function of Water Channels (Aquaporins) in Migrating Malignant Astrocytes. Glia (2007) 55(10):1034–43. doi: 10.1002/glia.20524
40. Nicchia GP, Srinivas M, Li W, Brosnan CF, Frigeri A, Spray DC. New Possible Roles for Aquaporin-4 in Astrocytes: Cell Cytoskeleton and Functional Relationship With Connexin43. FASEB J (2005) 19(12):1674–6. doi: 10.1096/fj.04-3281fje
41. Yang WY, Tan ZF, Dong DW, Ding Y, Meng H, Zhao Y, et al. Association of Aquaporin-1 With Tumor Migration, Invasion and Vasculogenic Mimicry in Glioblastoma Multiforme. Mol Med Rep (2018) 17(2):3206–11. doi: 10.3892/mmr.2017.8265
42. Abreu-Rodríguez I, Sánchez Silva R, Martins AP, Soveral G, Toledo-Aral JJ, López-Barneo J, et al. Functional and Transcriptional Induction of Aquaporin-1 Gene by Hypoxia; Analysis of Promoter and Role of Hif-1α. PloS One (2011) 6(12):e28385. doi: 10.1371/journal.pone.0028385
43. Saadoun S, Papadopoulos MC, Davies DC, Bell BA, Krishna S. Increased Aquaporin 1 Water Channel Expression in Human Brain Tumours. Br J Cancer (2002) 87(6):621–3. doi: 10.1038/sj.bjc.6600512
44. Tourdias T, Mori N, Dragonu I, Cassagno N, Boiziau C, Aussudre J, et al. Differential Aquaporin 4 Expression During Edema Build-Up and Resolution Phases of Brain Inflammation. J Neuroinflamm (2011) 8:143. doi: 10.1186/1742-2094-8-143
45. Falk Delgado A, Nilsson M, van Westen D. Glioma Grade Discrimination With MR Diffusion Kurtosis Imaging: A Meta-Analysis of Diagnostic Accuracy. Radiology (2018) 287(1):119–27. doi: 10.1148/radiol.2017171315
46. Abdalla G, Dixon L, Sanverdi E, Machado PM, Kwong JSW, Panovska-Griffiths J, et al. The Diagnostic Role of Diffusional Kurtosis Imaging in Glioma Grading and Differentiation of Gliomas From Other Intra-Axial Brain Tumours: A Systematic Review With Critical Appraisal and Meta-Analysis. Neuroradiology (2020) 62(7):791–802. doi: 10.1007/s00234-020-02425-9
47. Zhang J, Chen X, Chen D, Wang Z, Li S, Zhu W. Grading and Proliferation Assessment of Diffuse Astrocytic Tumors With Monoexponential, Biexponential, and Stretched-Exponential Diffusion-Weighted Imaging and Diffusion Kurtosis Imaging. Eur J Radiol (2018) 109:188–95. doi: 10.1016/j.ejrad.2018.11.003
48. Chen L, Liu M, Bao J, Xia Y, Zhang J, Zhang L, et al. The Correlation Between Apparent Diffusion Coefficient and Tumor Cellularity in Patients: A Meta-Analysis. PloS One (2013) 8(11):e79008. doi: 10.1371/journal.pone.0079008
49. Castillo M, Smith JK, Kwock L, Wilber K. Apparent Diffusion Coefficients in the Evaluation of High-Grade Cerebral Gliomas. AJNR Am J Neuroradiol (2001) 22(1):60–4.
50. Cao M, Suo S, Han X, Jin K, Sun Y, Wang Y, et al. Application of a Simplified Method for Estimating Perfusion Derived From Diffusion-Weighted MR Imaging in Glioma Grading. Front Aging Neurosci (2017) 9:432. doi: 10.3389/fnagi.2017.00432
51. Chi AS, Sorensen AG, Jain RK, Batchelor TT. Angiogenesis as a Therapeutic Target in Malignant Gliomas. Oncologist (2009) 14(6):621–36. doi: 10.1634/theoncologist.2008-0272
52. Jain RK, di Tomaso E, Duda DG, Loeffler JS, Sorensen AG, Batchelor TT. Angiogenesis in Brain Tumours. Nat Rev Neurosci (2007) 8(8):610–22. doi: 10.1038/nrn2175
53. Shin JH, Lee HK, Kwun BD, Kim JS, Kang W, Choi CG, et al. Using Relative Cerebral Blood Flow and Volume to Evaluate the Histopathologic Grade of Cerebral Gliomas: Preliminary Results. AJR Am J Roentgenol (2002) 179(3):783–9. doi: 10.2214/ajr.179.3.1790783
54. Lin Y, Li J, Zhang Z, Xu Q, Zhou Z, Zhang Z, et al. Comparison of Intravoxel Incoherent Motion Diffusion-Weighted MR Imaging and Arterial Spin Labeling MR Imaging in Gliomas. BioMed Res Int (2015) 2015:234245. doi: 10.1155/2015/234245
Keywords: diffusion weighted imaging, intravoxel incoherent motion, diffusion kurtosis imaging, gliomas, biomarker
Citation: Bai Y, Liu T, Chen L, Gao H, Wei W, Zhang G, Wang L, Kong L, Liu S, Liu H, Roberts N and Wang M (2021) Study of Diffusion Weighted Imaging Derived Diffusion Parameters as Biomarkers for the Microenvironment in Gliomas. Front. Oncol. 11:672265. doi: 10.3389/fonc.2021.672265
Received: 25 February 2021; Accepted: 24 September 2021;
Published: 12 October 2021.
Edited by:
Michael Albert Thomas, University of California, Los Angeles, United StatesReviewed by:
Rui Vasco Simoes, Champalimaud Foundation, PortugalCopyright © 2021 Bai, Liu, Chen, Gao, Wei, Zhang, Wang, Kong, Liu, Liu, Roberts and Wang. This is an open-access article distributed under the terms of the Creative Commons Attribution License (CC BY). The use, distribution or reproduction in other forums is permitted, provided the original author(s) and the copyright owner(s) are credited and that the original publication in this journal is cited, in accordance with accepted academic practice. No use, distribution or reproduction is permitted which does not comply with these terms.
*Correspondence: Meiyun Wang, bXl3YW5nQGhhLmVkdS5jbg==
†These authors have contributed equally to this work
Disclaimer: All claims expressed in this article are solely those of the authors and do not necessarily represent those of their affiliated organizations, or those of the publisher, the editors and the reviewers. Any product that may be evaluated in this article or claim that may be made by its manufacturer is not guaranteed or endorsed by the publisher.
Research integrity at Frontiers
Learn more about the work of our research integrity team to safeguard the quality of each article we publish.