- 1Department of Medical Genetics, Shahid Beheshti University of Medical Sciences, Tehran, Iran
- 2Urology and Nephrology Research Center, Shahid Beheshti University of Medical Sciences, Tehran, Iran
- 3Department of Medical Biotechnology, School of Advanced Technologies in Medicine, Tehran University of Medical Sciences, Tehran, Iran
- 4Department of Medical Genetics and Molecular biology, Faculty of Medicine, Iran University of Medical Sciences, Tehran, Iran
- 5Men’s Health and Reproductive Health Research Center, Shahid Beheshti University of Medical Sciences, Tehran, Iran
Breast cancer is the most common neoplasm among females. Estrogen receptor (ESR) signaling has a prominent impact in the pathogenesis of breast cancer. Among the transcription factors associated with ESR signaling, FOXM1, GATA3, FOXA1 and ESR1 have been suggested as a candidate in the pathogenesis of this neoplasm. In the current project, we have designed an in silico approach to find long non-coding RNAs (lncRNAs) that regulate these transcription factors. Then, we used clinical samples to carry out validation of our in silico findings. Our systems biology method led to the identification of APTR, AC144450.1, linc00663, ZNF337.AS1, and RAMP2.AS1 lncRNAs. Subsequently, we assessed the expression of these genes in breast cancer tissues compared with the adjacent non-cancerous tissues (ANCTs). Expression of GATA3 was significantly higher in breast cancer tissues compared with ANCTs (Ratio of mean expressions (RME) = 4.99, P value = 3.12E−04). Moreover, expression levels of APTR, AC144450.1, and ZNF337.AS1 were elevated in breast cancer tissues compared with control tissues (RME = 2.27, P value = 5.40E−03; Ratio of mean expressions = 615.95, P value = 7.39E−19 and RME = 1.78, P value = 3.40E−02, respectively). On the other hand, the expression of RAMP2.AS1 was lower in breast cancer tissues than controls (RME = 0.31, P value = 1.87E−03). Expression levels of FOXA1, ESR1, and FOXM1 and linc00663 were not significantly different between the two sets of samples. Expression of GATA3 was significantly associated with stage (P value = 4.77E−02). Moreover, expressions of FOXA1 and RAMP2.AS1 were associated with the mitotic rate (P values = 2.18E−02 and 1.77E−02, respectively). Finally, expressions of FOXM1 and ZNF337.AS1 were associated with breastfeeding duration (P values = 3.88E−02 and 4.33E−02, respectively). Based on the area under receiver operating characteristics curves, AC144450.1 had the optimal diagnostic power in differentiating between cancerous and non-cancerous tissues (AUC = 0.95, Sensitivity = 0.90, Specificity = 0.96). The combination of expression levels of all genes slightly increased the diagnostic power (AUC = 0.96). While there were several significant pairwise correlations between expression levels of genes in non-tumoral tissues, the most robust correlation was identified between linc00663 and RAMP2.AS1 (r = 0.61, P value = 3.08E−8). In the breast cancer tissues, the strongest correlations were reported between FOXM1/ZNF337.AS1 and FOXM1/RAMP2.AS1 pairs (r = 0.51, P value = 4.79E−5 and r = 0.51, P value = 6.39E−5, respectively). The current investigation suggests future assessment of the functional role of APTR, AC144450.1 and ZNF337.AS1 in the development of breast neoplasms.
Introduction
Breast cancer is the most frequent cancer and one of the leading causes of mortality in women (1). More than two-thirds of breast cancers are classified as luminal A/B subtypes according to the expression of the estrogen receptor α (ER-α) protein (2). ER-positive status has been regarded as an indicator of suitable patients’ prognosis. Yet, the emergence of resistance to endocrine therapy results in disease progression and mortality in many of these patients highlighting the importance of early diagnosis and establishment of effective treatment modalities for these patients (3). In response to estrogen, ER acts as a transcription factor to influence expression of several genes. However, several cofactors are involved in the process of ER-mediated gene expression regulation. These factors mainly modulate chromatin structure to make the compacted DNA available for ER to bind and exert its function (4). Moreover, some proteins construct scaffolds for additional crucial factors and several cofactors with enzymatic activities necessary for optimum protein gathering and function (4). Alterations in the levels of these essential cofactors have been regarded as a mechanism for bypassing the anti-proliferative effects of endocrine therapies (4). The identification of numerous ER-DNA interaction sites has led to the discovery of new ER-related proteins, which participate in the stabilization of the ER complex on the chromatin. FOXA1, GATA3, PBX1, and AP2γ are among the transcription factors involved in this process (4). FOXA1 and GATA3 have been shown to be consistently expressed in the luminal subtype of breast cancer, indicating the presence of a co-modulatory loop that might contribute to the maintenance of the luminal phenotype (5). FOXA1 also enhances response to estrogen through regulating ER binding with the promoter region of its targets (6, 7). GATA3 has a regulatory role in expression of FOXA1, which enhances ER expression in epithelial cells (8). Meanwhile, another transcription factor namely FOXM1 has been demonstrated to decrease expression of GATA3 via induction of methylation in its promoter through recruitment of a DNA methyl transferase. As an estrogen-inducible gene (9), FOXM1 also participates in the regulation of the functional interaction between ER and GATA3. Therefore, GATA3, FOXA1, FOXM1 and ER construct an interactive network which directs the fate of cells in the breast tissue (8). Based on the importance of FOXM1/GATA3/FOXA1/ESR1 axis, we designed the current study to find long non-coding RNAs (lncRNAs) that are linked with transcription factors through a systems biology approach. Subsequently, we assessed expression of these genes in breast cancer tissues versus adjacent non-cancerous tissues (ANCTs). LncRNAs have crucial roles in the regulation of expression of genes through various mechanisms including adjustment of the chromatin configuration, recruitment of transcription factors, modulation of stability of transcripts, changing the bioavailability of other biomolecules and interaction with RNAs and proteins (10). Thus, their interaction with cancer related axes including FOXM1/GATA3/FOXA1/ESR1 axis might affect the course of breast cancer.
Materials and Methods
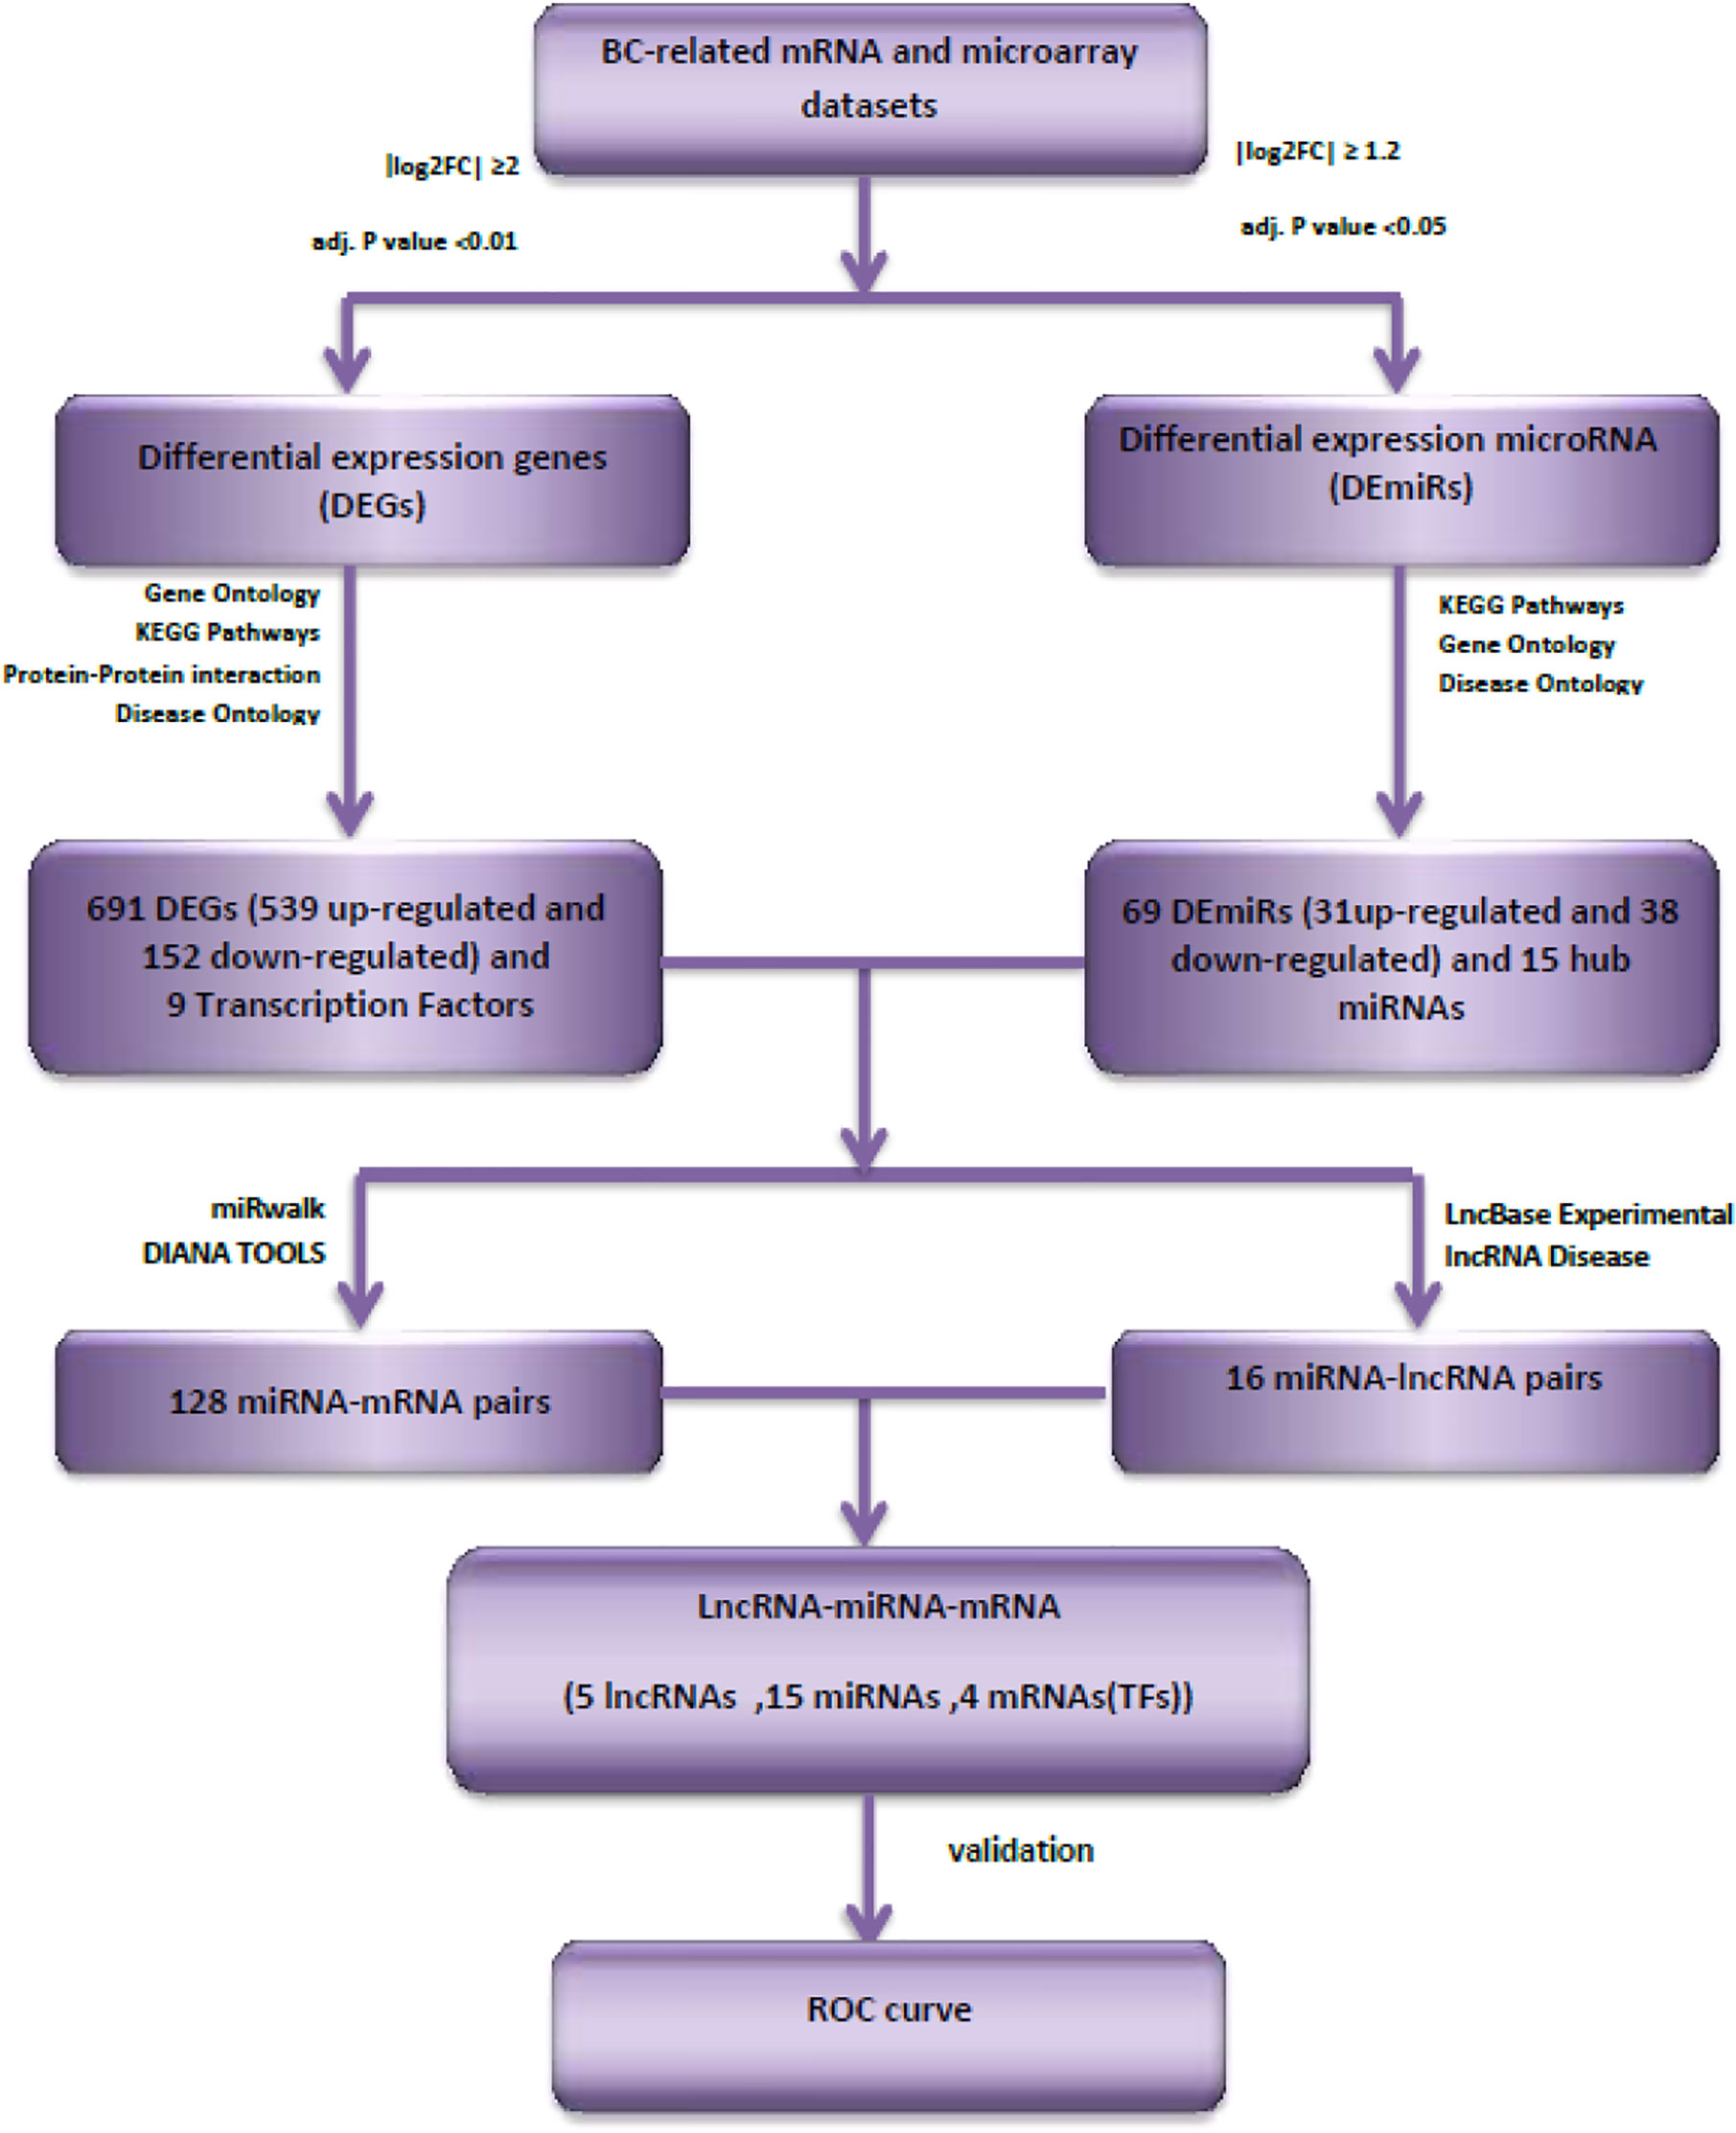
Figure 1 shows the overall flowchart of our in silico assessments.
Microarray Gene Expression Data Analysis
The criteria for finding eligible microarray datasets from the Gene Expression Omnibus database (https://www.ncbi.nlm.nih.gov/geo/) were as follows: 1) Inclusion of gene expression data of breast cancer and adjacent normal tissue samples before any patient treatment (Subjects that had received chemotherapy or radiotherapy before surgery were omitted); 2) Arrays having at least 100 tumor and adjacent normal tissue specimens; 3) Inclusion of four molecular subtypes of breast cancer (luminal A, luminal B, Her2-enriched and Triple-negative/basal-like). One dataset was finally included in this study: GSE45827 (11). First, the Affy package in R (12) was used to convert the raw data (.CEL files). Then, the robust multi-array average (RMA) was used to correct and normalize the background. Subsequently, the Bioconductor package in R was used for conversion of the probe information into a gene symbol (13). The average expression value between all probes sets that were mapped with a given gene were used for final gene expression value. Finally, the R package “limma” (14) was utilized to normalize the data and find differentially expressed genes (DEGs). The threshold points were set to adj. P value <0.01 and |log 2-fold-change| ≥2.
Microarray miRNA Expression Data Analysis
The miRNA microarray datasets GSE59247 (15) and GSE81000 (16) were obtained from GEO database, GPL15019 [Agilent-031181 Unrestricted_Human_miRNA_V16.0_Microarray 030840] and GPL10656 [Agilent-029297 Human miRNA Microarray v14 Rev.2] Platforms, respectively. Differentially expressed miRNAs (DEmiRs) between luminal tumors and normal samples were selected using GEO2R online analysis tool (17). The DEmiRs were obtained with thresholds of |logFC|>1.2 and adj.P value <0.05. Then the common DEmiRs that were in both datasets with the same direction of expression changes (up or down expression in luminal tumors compared with normal samples) were selected.
Functional Enrichment Analysis
To better comprehend the underlying biological processes and pathways, disease ontology (DO), functional enrichment of gene ontology (GO), Kyoto Encyclopedia of Genes and Genomes (KEGG) pathways analyses were conducted using cluster Profiler, DOSE and in R (18). Statistical significance was reported by the adjusted P-value (Q-value) <0.05.
Transcription Factors Recognition
TF checkpoint (www.tfcheckpoint.org), a high-quality and comprehensive repository of human, mouse, and rat TF candidates was used to detect TFs among the list of differentially expressed genes (19).
Protein–Protein Interaction (PPI) Analysis
To conduct a research on protein experimental interactions and prediction, a PPI network was constructed using a STRING online database (http://string-db.org) (combined score >0.4) (20). DEGs with a combined score >0.9 as the threshold (18) were imported into Cytoscape to create network visualization. Then, the network was processed for module analysis, using Molecular Complex Detection (MCODE) Plugin in Cytoscape software with default parameters (21, 22). Parameters were degree cutoff ≥2, node score cutoff ≥2, K-core ≥2, and maximum depth = 100. Cytoscape (v3.8.3) was used to visualize and calculate the basic features of the PPI network, namely average clustering coefficient distribution, closeness centrality, average neighborhood connectivity, node degree distribution, shortest path length distribution, and topological coefficients.
Construction of the Competing Endogenous RNAs (ceRNAs) Regulatory Network
Based on the potential interaction between mRNAs, miRNAs, and lncRNAs, we also reconstructed a ceRNA regulatory network. First, breast cancer-specific RNAs, including mRNAs and miRNAs, were filtered. Down-/up-regulated mRNAs and miRNAs were assigned using the following parameters: adj.P value <0.01 and |log 2-fold-change| ≥2 and adj.P value <0.05 and |log 2-fold-change| ≥1.2, respectively. Then, the mRNAs that were targeted by DEmiRs were predicted by miRwalk (http://mirwalk.umm.uni-heidelberg.de). If there was no interaction between DEmiRs and hub DEGs, the node was removed. Next, the interactions between lncRNA and miRNA were predicted by DIANA TOOLs databases (https://diana.e-ce.uth.gr/lncbasev3), and a list of lncRNA–miRNA pair interactions was identified. Finally, from this list, the lncRNAs predicted for breast cancer were filtered using the LncRNADisease v3.0 database (http://www.rnanut.net/lncrnadisease). The reconstructed ceRNA network was visualized by Cytoscape (v.3.8.3).
Patients
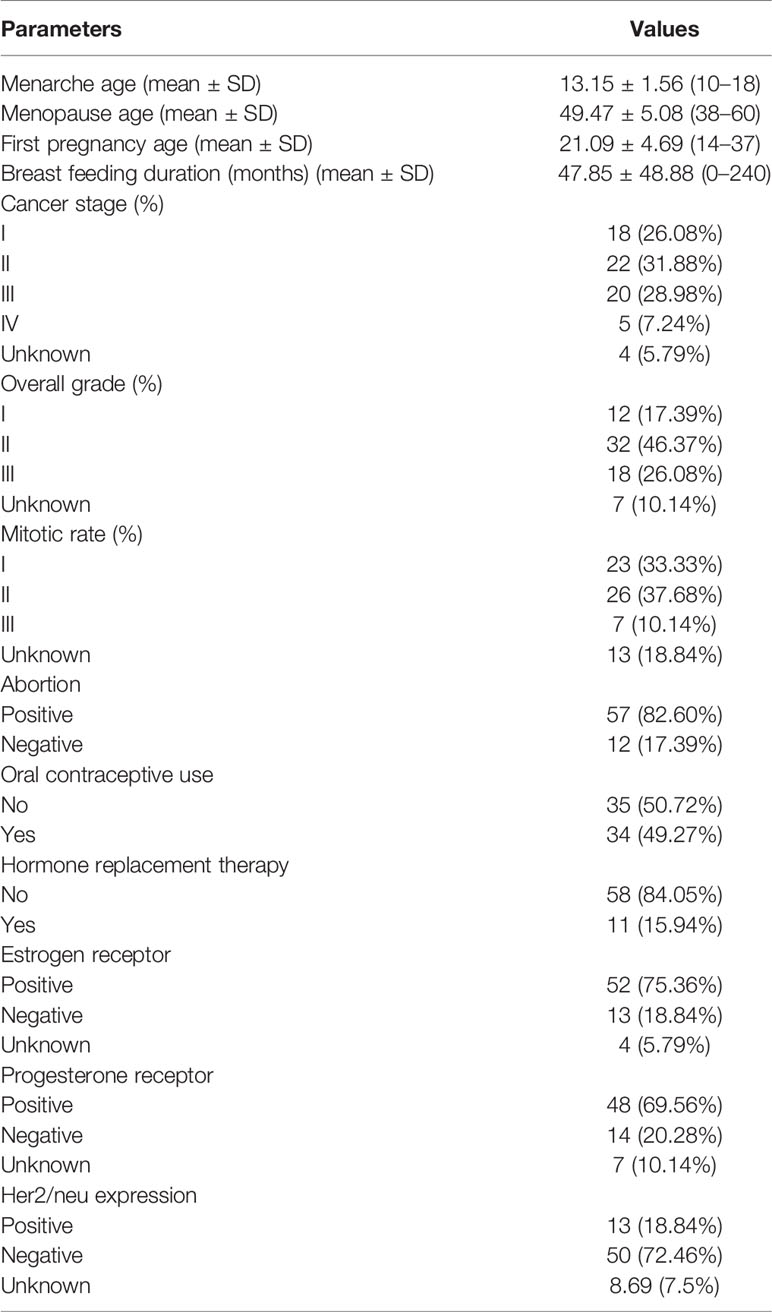
A total of 69 breast cancer samples and their corresponding ANCTs were obtained from Iranian female patients who were referred to Farmanieh and Sina hospitals during 2017–2020, Tehran, Iran. The study protocol was approved by the ethical committee of Shahid Beheshti University of Medical Science (ethical code: IR.SBMU.RETECH.REC.1398.379). Patients received no chemotherapy or radiotherapy prior to sample collection. All samples were conveyed in liquid nitrogen to the Department of Medical Genetics and stored in −80°C till succeeding expression analyzes. Patients’ medical records were assessed for collecting related pathological data.
Expression Assays
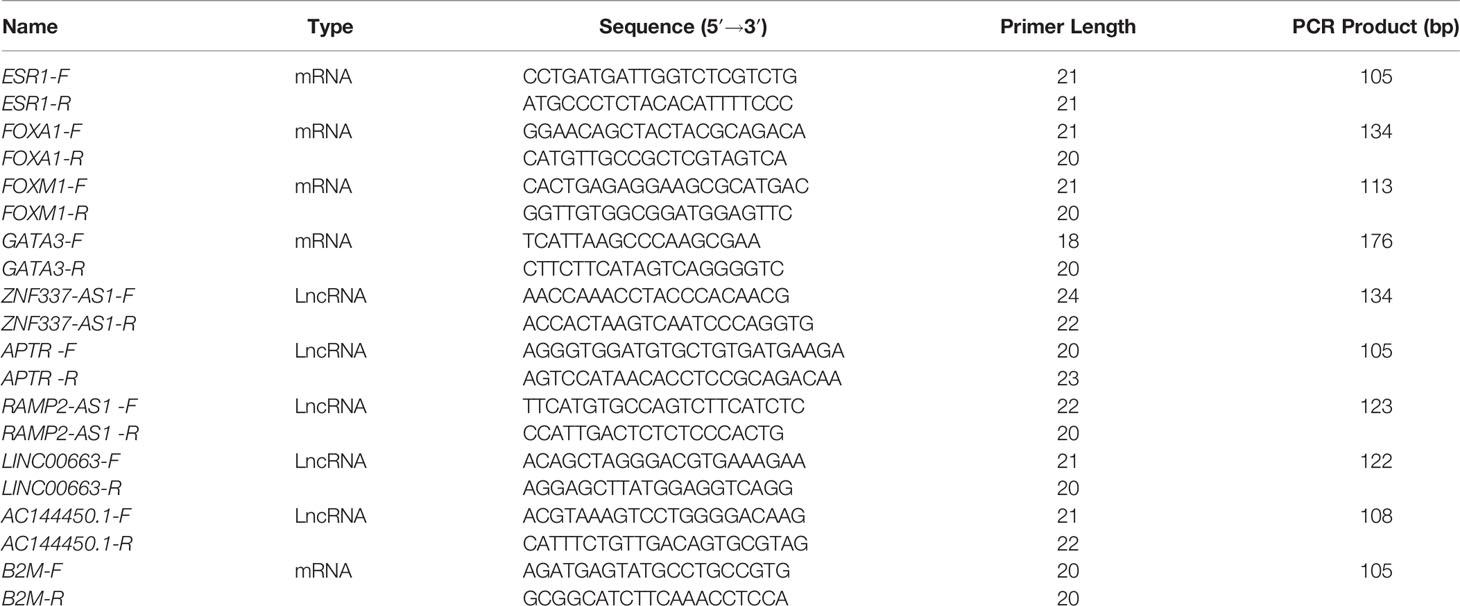
All samples were subjected to RNA isolation using the RiboEx Total RNA extraction kit (GeneAll, Seoul, South Korea). Then, 50–100 ng of RNA was transformed to cDNA using the commercial kit (ExcelRT™, SMOBIO, Taiwan). Expressions of genes in tumoral and non-tumoral tissues were measured in the ABI step one plus PCR machine. Expression levels were normalized to transcripts of B2M. The commercial real time PCR Master Mix (Ampliqon, Odense, Denmark) was used for preparing the reactions. Information about primers is shown in Table 1.
Statistical Methods
Statistical analyses were performed using the R programming language. Transcript quantities of nine mentioned genes were calculated in relation to the B2M reference gene using the equation:. Then, the obtained values were log2 transformed and used for subsequent analysis.
A comparison was made between normal and tumor tissues of patients, and the significance of the difference between mean values was assessed using the paired t-test. Correlations between expressions were evaluated through the calculation of Spearman correlation coefficients. For assessment of the diagnostic power of genes, receiver operating characteristic (ROC) curves were plotted. Three predictive machine learning methods, namely Bayesian Generalized Linear Model, Generalized Linear Model, and Linear Discriminant Analysis with 10-fold cross-validation were used to compute the sensitivity and specificity of each model. The Bayesian Generalized Linear Model (bayesGLM) provided the most efficient estimates, and in the best setting, the AUC was 0.96. Youden’s J statistic was employed to find the optimum threshold. BayesGLM was then selected based on the previous results to investigate the efficiency of each gene for the separation of groups. A Chi-square test was employed to assess the association between patients’ demographic information and transcript levels of genes. Genes with log2FC ≥1 (tumor tissues vs. normal tissues) were considered as up-regulated and those with log2FC ≤−1 were regarded as down-regulated. For all statistical tests, the level of significance was set at P value <0.05.
Results
Genes and miRNAs Expression Analyses
After quality control and elimination of inaccurate expression data, we identified a total of 691 DEGs (539 up-regulated and 152 down-regulated) in breast cancer samples compared with control samples with adj.P value <0.01 and |log 2-fold-change| ≥2. Then, 69 DEmiRs (31 up-regulated and 38 down-regulated) with adj.P value <0.05 and |logFC| >1.2 were selected for further analysis.
PPI Network Reconstruction and Identification of Hubs
The STRING database was used to predict the interaction relationship. As a result, 629 nodes and 4,252 protein pairs with a combined weight score >0.4 were found in the network. All nodes with a combined score >0.9 were imported into Cytoscape software for visualization. After clustering analysis with MCODE, six modules with score >4 were detected. In these clusters, the MCODE score for cluster 1 was 26.44, including 28 nodes; the MCODE score for cluster 2 was 10.97, consisting of 42 nodes; the MCODE score for cluster 3 was 9.1, including 53 nodes; the MCODE score for cluster 4 was 6.97, including 44 nodes; the MCODE score for cluster 5 was 5.6, consisting of 6 nodes; the MCODE score for cluster 6 was 4.3, including of 53 nodes. After centrality analysis, the nodes with degree, closeness, and betweenness indices values higher than the mean value of the whole network were considered as hub nodes. All transcription factors were filtered in entire network using TFcheckpoint and 31 TFs were found. We selected 9 of 31 transcription factors based on centrality indices and MCODE results. So, ESR1, AR, FOS, STAT1, NCOA3, GATA3 and FOXA1 in the up-regulated network and CDC5Land FOXM1 in the down-regulated network were considered as candidate nodes. Figure 2 shows the PPI network of the selected DEGs.
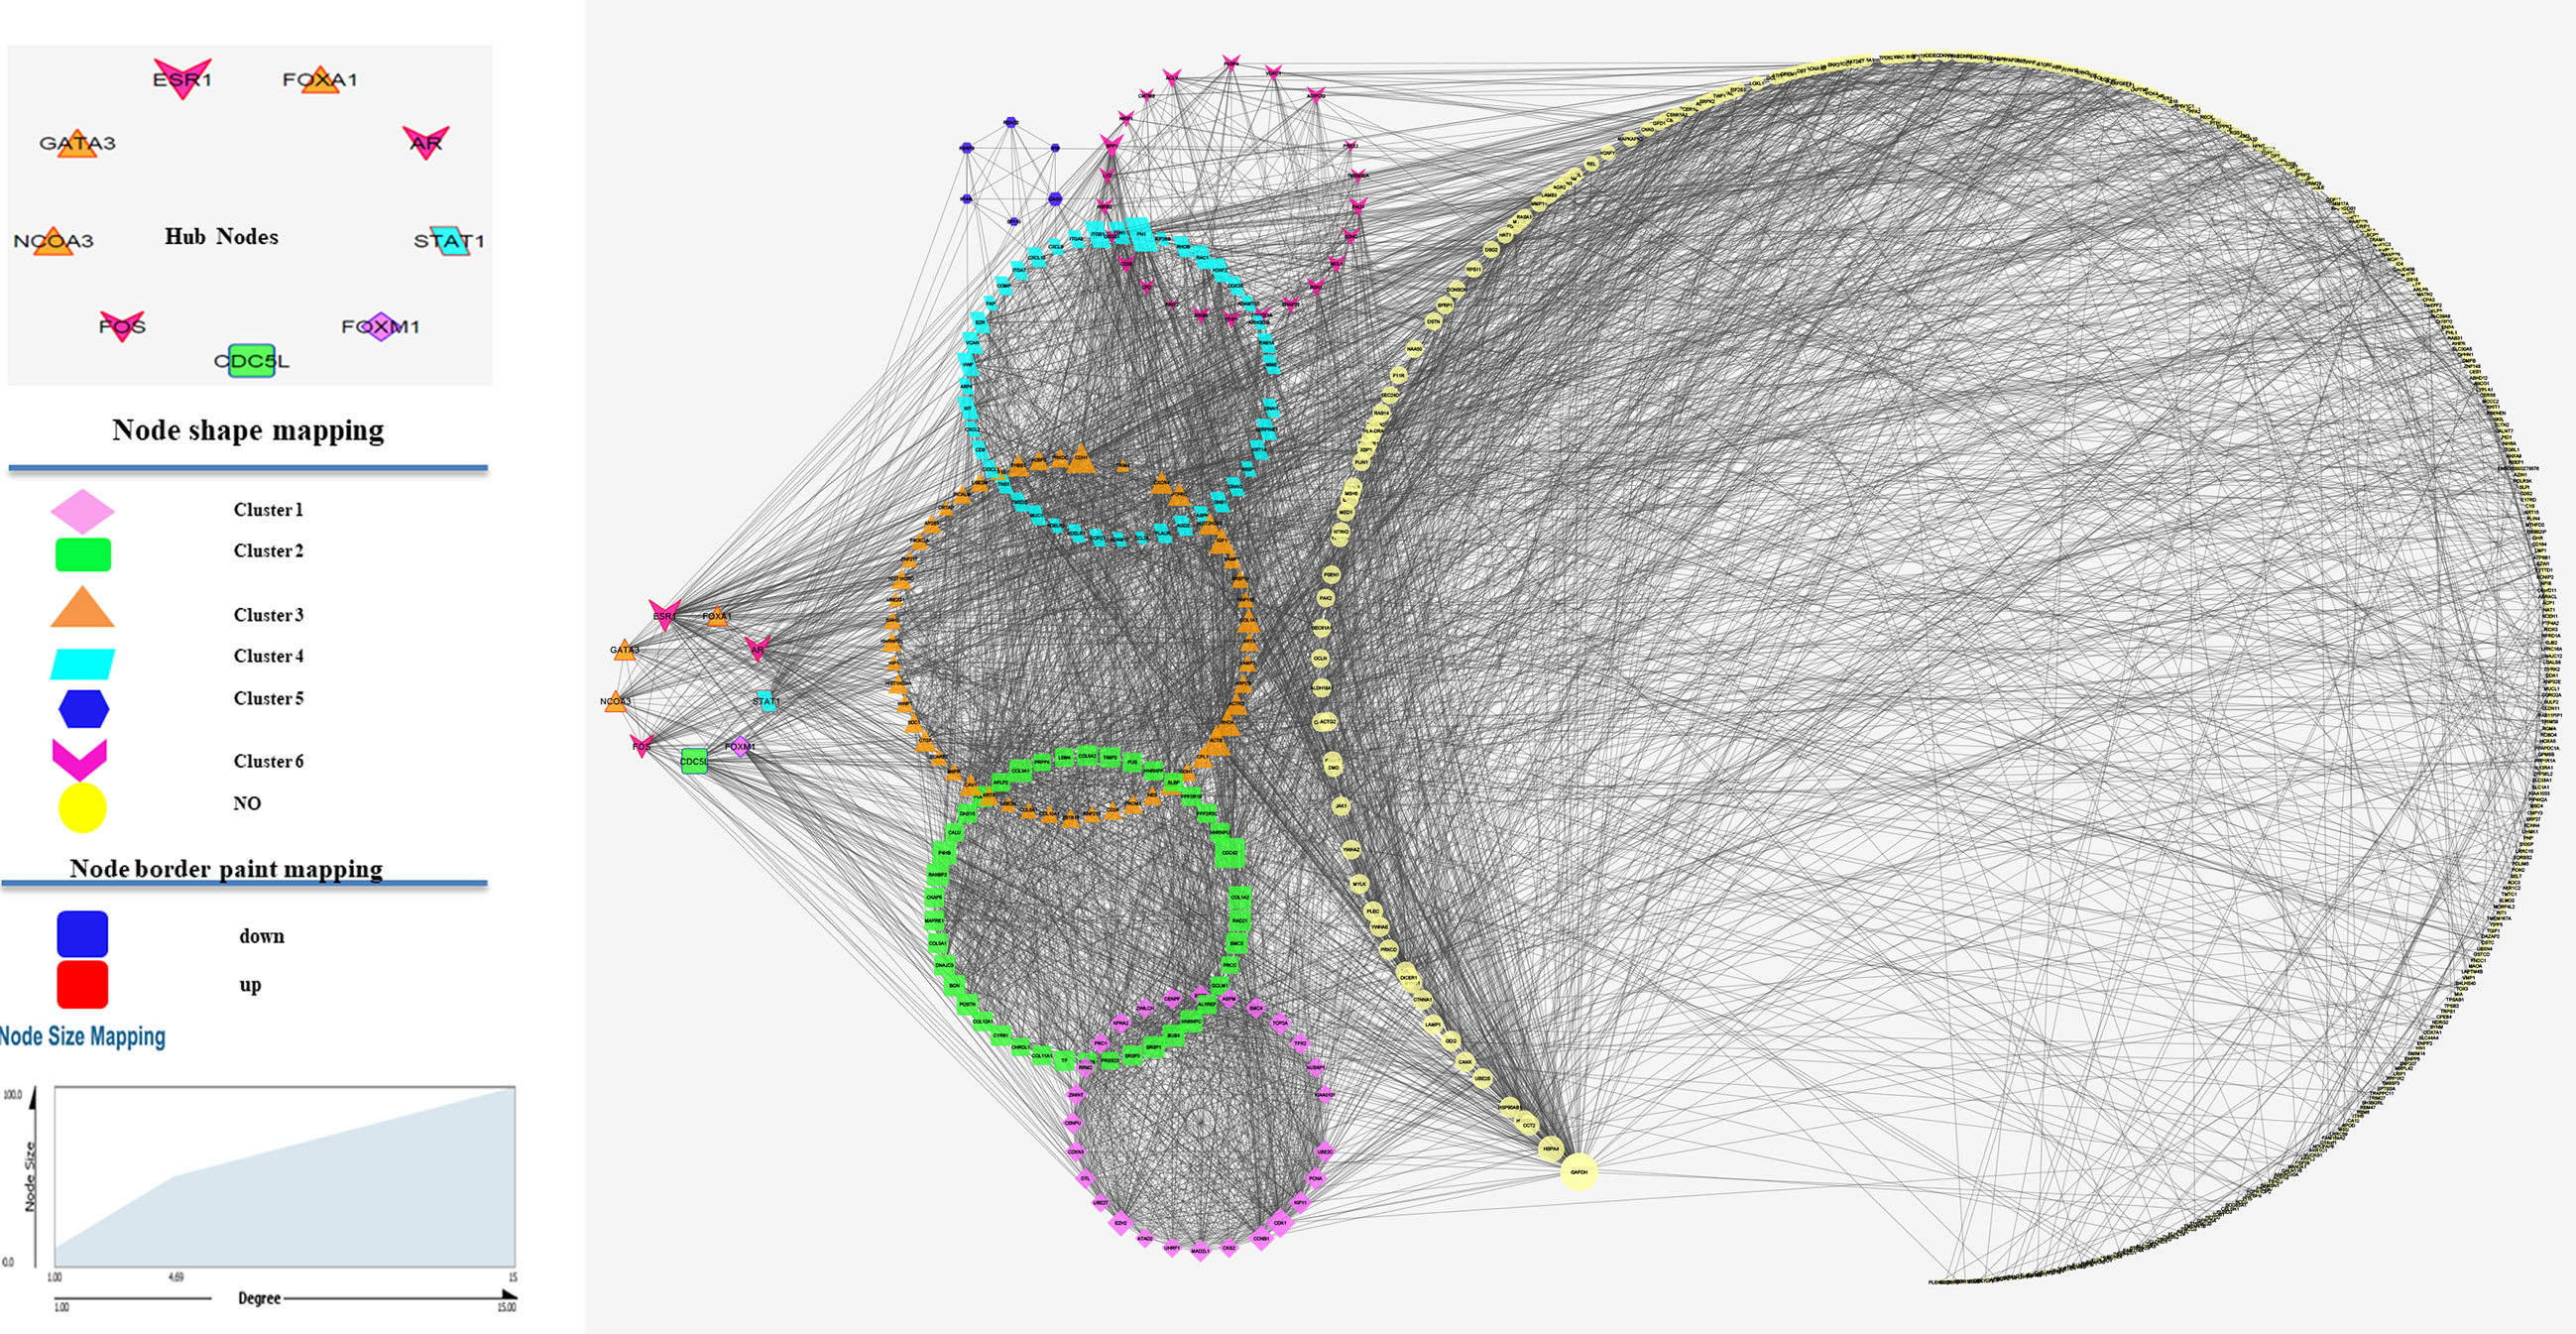
Figure 2 Protein–protein interaction (PPI) analysis of differentially expressed genes. Clusters were identified from the PPI network using the MCODE method with a score of >4.0. Six modules were represented in the figure in unique shapes and colors. Edge stands for the interaction between two genes. The importance of protein nodes in the network is described by degree where small and large sizes denote low and high values, respectively. The border color represents the fold change for nodes where upregulated nodes are marked red and downregulated nodes marked blue. This figure shows the PPI between genes in the selected dataset showing the clusters related to each of key genes.
Functional Annotation
To obtain the biofunctions of the TFs, DO functional, GO analyses and KEGG pathway enrichment were conducted using the clusterProfiler package of R software (Figures 3A, B). The same method was performed to analyze miRNAs. The result is shown in Figures 3C, D. The ESR1 gene encodes ERα, which plays central roles in mammary carcinogenesis and clinical response of breast tumors to endocrine therapy. In our network, ESR1 with greater degree than other hub nodes was selected. After functional enrichment analysis of hub nodes, three transcription factors that interact with ESR1 in luminal breast cancer cells were filtered for further analyses. FOXA1, FOXM1, and GATA3 transcription factors are involved in some common biological pathways such as response to steroid hormone, mammary gland epithelium development, urogenital system development, intracellular steroid hormone receptor signaling pathway, aging and epithelial cell proliferation.

Figure 3 Functional annotation for DEGs and DEmiRs. (A) Gene Ontology for DEGs; (B) KEGG pathway and Disease Ontology for DEGs; (C) KEGG pathway for DEmiRs; (D) Gene Ontology and Disease Ontology for DEmiRs. KEGG pathway represented by circulary segment. Each ribbon represents a miRNA. The ribbon color represents the fold change for miRNAs where upregulated ribbons are blue and downregulated ribbons marked black.
Through function enrichment of the DEmiRs, 15 hub miRNAs were identified for further studies.
Construction of the lncRNA–miRNA–mRNA Regulatory Network
MiRwalk database was searched to predict the interaction between miRNAs and mRNAs. If the predicted genes from the database were not considered as hub nodes, they were removed from our list. So, 128 miRNA–mRNA interaction pairs were identified using our strategy. After identifying hub miRNAs, among 128 miRNA-hub Gene pairs, hub mirRNAs were filtered and 19 miRNA–mRNA interaction pairs were detected between hub miRNAs and four selected transcription factors. Next, lncRNAs targets of the selected miRNAs were predicted using the DIANA TOOLs database. Then, we determined five lncRNAs with a putative role in breast cancer using the LncRNA disease (v.3.0) database, including AC144450.1, APTR, RAMP2-AS1, LINC00663, and ZNF337-AS1. LncRNAs can act as an endogenous sponge and bind directly to miRNAs, resulting in the down-regulation of miRNAs and up-regulation of gene, i.e., they regulate the regulator. Finally, a lncRNA–miRNA–mRNA regulation network was reconstructed and visualized by Cytoscape (V. 3.8.3) (Figure 4). LncRNAs, mRNAs and miRNAs are the nodes in the network. The edges in the network represent the interactions between different types of RNAs. In total, we selected five lncRNAs and four TFs in this triple regulatory network to validate their expressions in clinical samples.
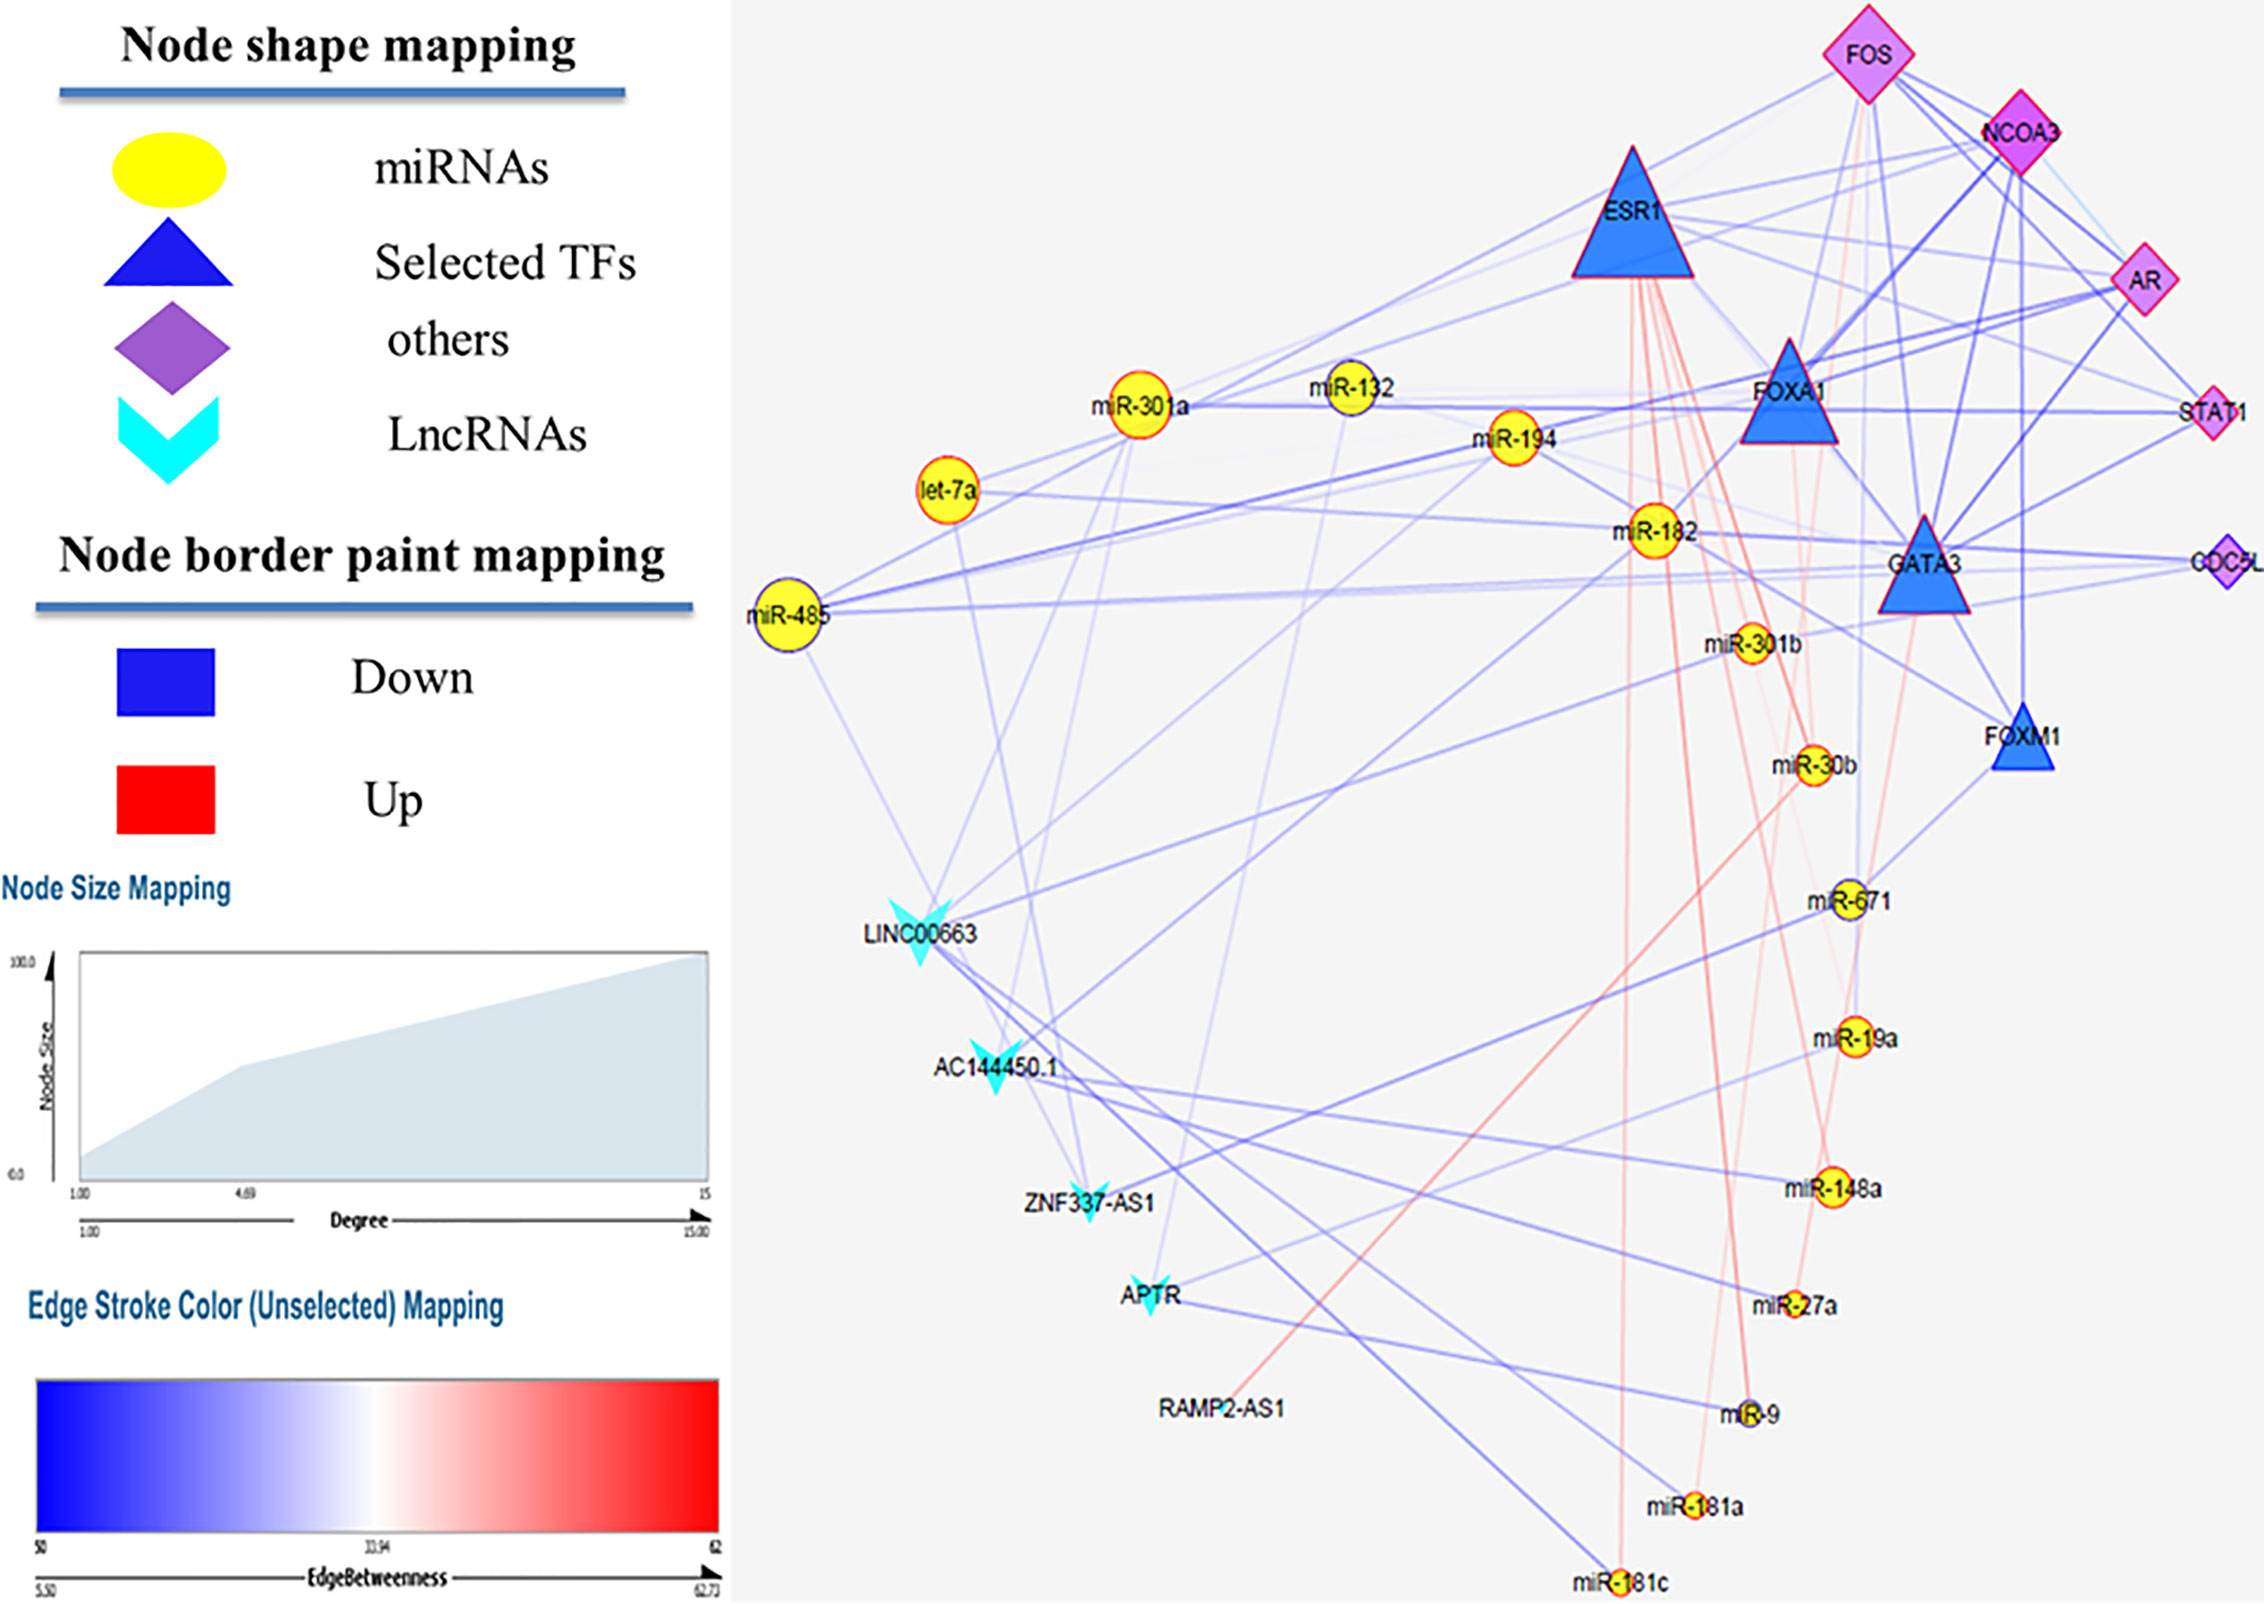
Figure 4 LncRNA–miRNA–mRNA network. Edge stands for the interaction between two genes. The importance of protein nodes in the network is described by degree where small and large sizes denote low and high values, respectively. The border color represents the fold change for nodes where upregulated nodes are marked red and downregulated nodes marked blue.
Demographic Data
The same cohort of patients has been used in our previous study (23). Demographic data of study participants is summarized in Table 2.
Expression Assays
The expression of GATA3 was significantly higher in breast cancer tissues compared with ANCTs (Ratio of mean expressions (RME) = 4.99, P value = 3.12E−04). Moreover, expression levels of APTR, AC144450.1, and ZNF337.AS1 were elevated in breast cancer tissues compared with control tissues (RME = 2.27, P value = 5.40E−03; Ratio of mean expressions = 615.95, P value = 7.39E−19 and RME = 1.78, P value = 3.40E−02, respectively). On the other hand, the expression of RAMP2.AS1 was lower in breast cancer tissues than controls (RME = 0.31, P value = 1.87E−03). Expression levels of FOXA1, ESR1, and FOXM1 and linc00663 were not significantly different between the two sets of samples. The patients’ cohort included 6 HER2 subtype, 2 TNBC and 62 luminal cases. The observed pattern of expression did not vary between these subtypes. Table 3 shows the detailed statistics of expressions of named transcription factors and related lncRNAs in breast cancer samples compared with non-cancerous tissues.

Table 3 Detailed statistics of expressions of named transcription factors and related lncRNAs in breast cancer samples compared with non-cancerous tissues.
Figure 5 shows the relative expression of named transcription factors and related lncRNAs in breast cancer tissues and ANCTs.
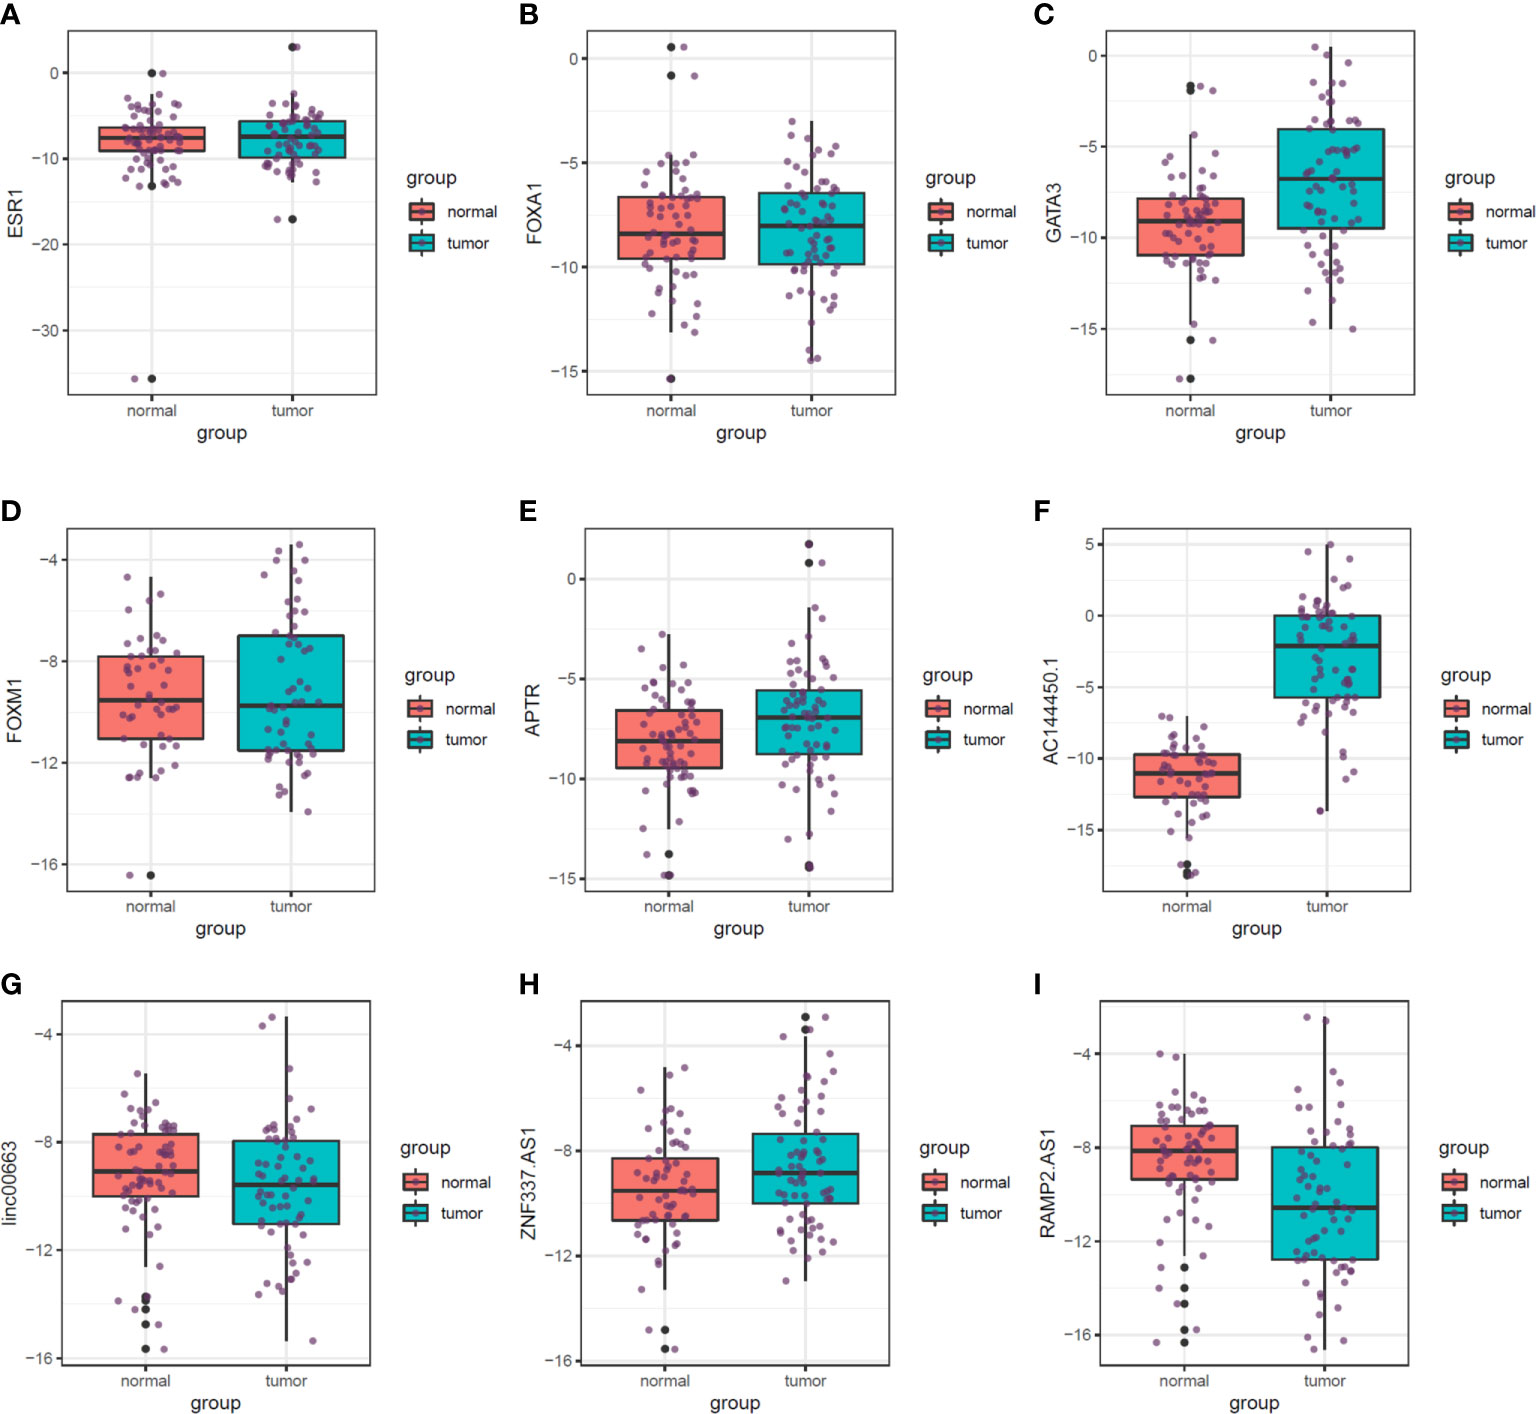
Figure 5 Relative expression of transcription factors and related lncRNAs in breast cancer tissues and their paired normal tissues. Median, upper, and lower quartile values are shown. (A) ESR1. (B) FOXA1. (C) GATA3. (D) FOXM1. (E) APTR. (F) AC144450.1. (G) linc00663. (H) ZNF337.AS1. (I) RAMP2.AS1.
Association Between the Expression of Genes and Demographic/Clinical Data
Expression of GATA3 was significantly associated with the stage (P value = 4.77E−02). Moreover, expressions of FOXA1 and RAMP2.AS1 were associated with the mitotic rate (P values = 2.18E−02 and 1.77E−02, respectively). Finally, expressions of FOXM1 and ZNF337.AS1 were associated with breast feeding duration (P values = 3.88E−02 and 4.33E−02, respectively). Table 4 shows the detailed statistics of the association between the expression of genes and demographic/clinical data.
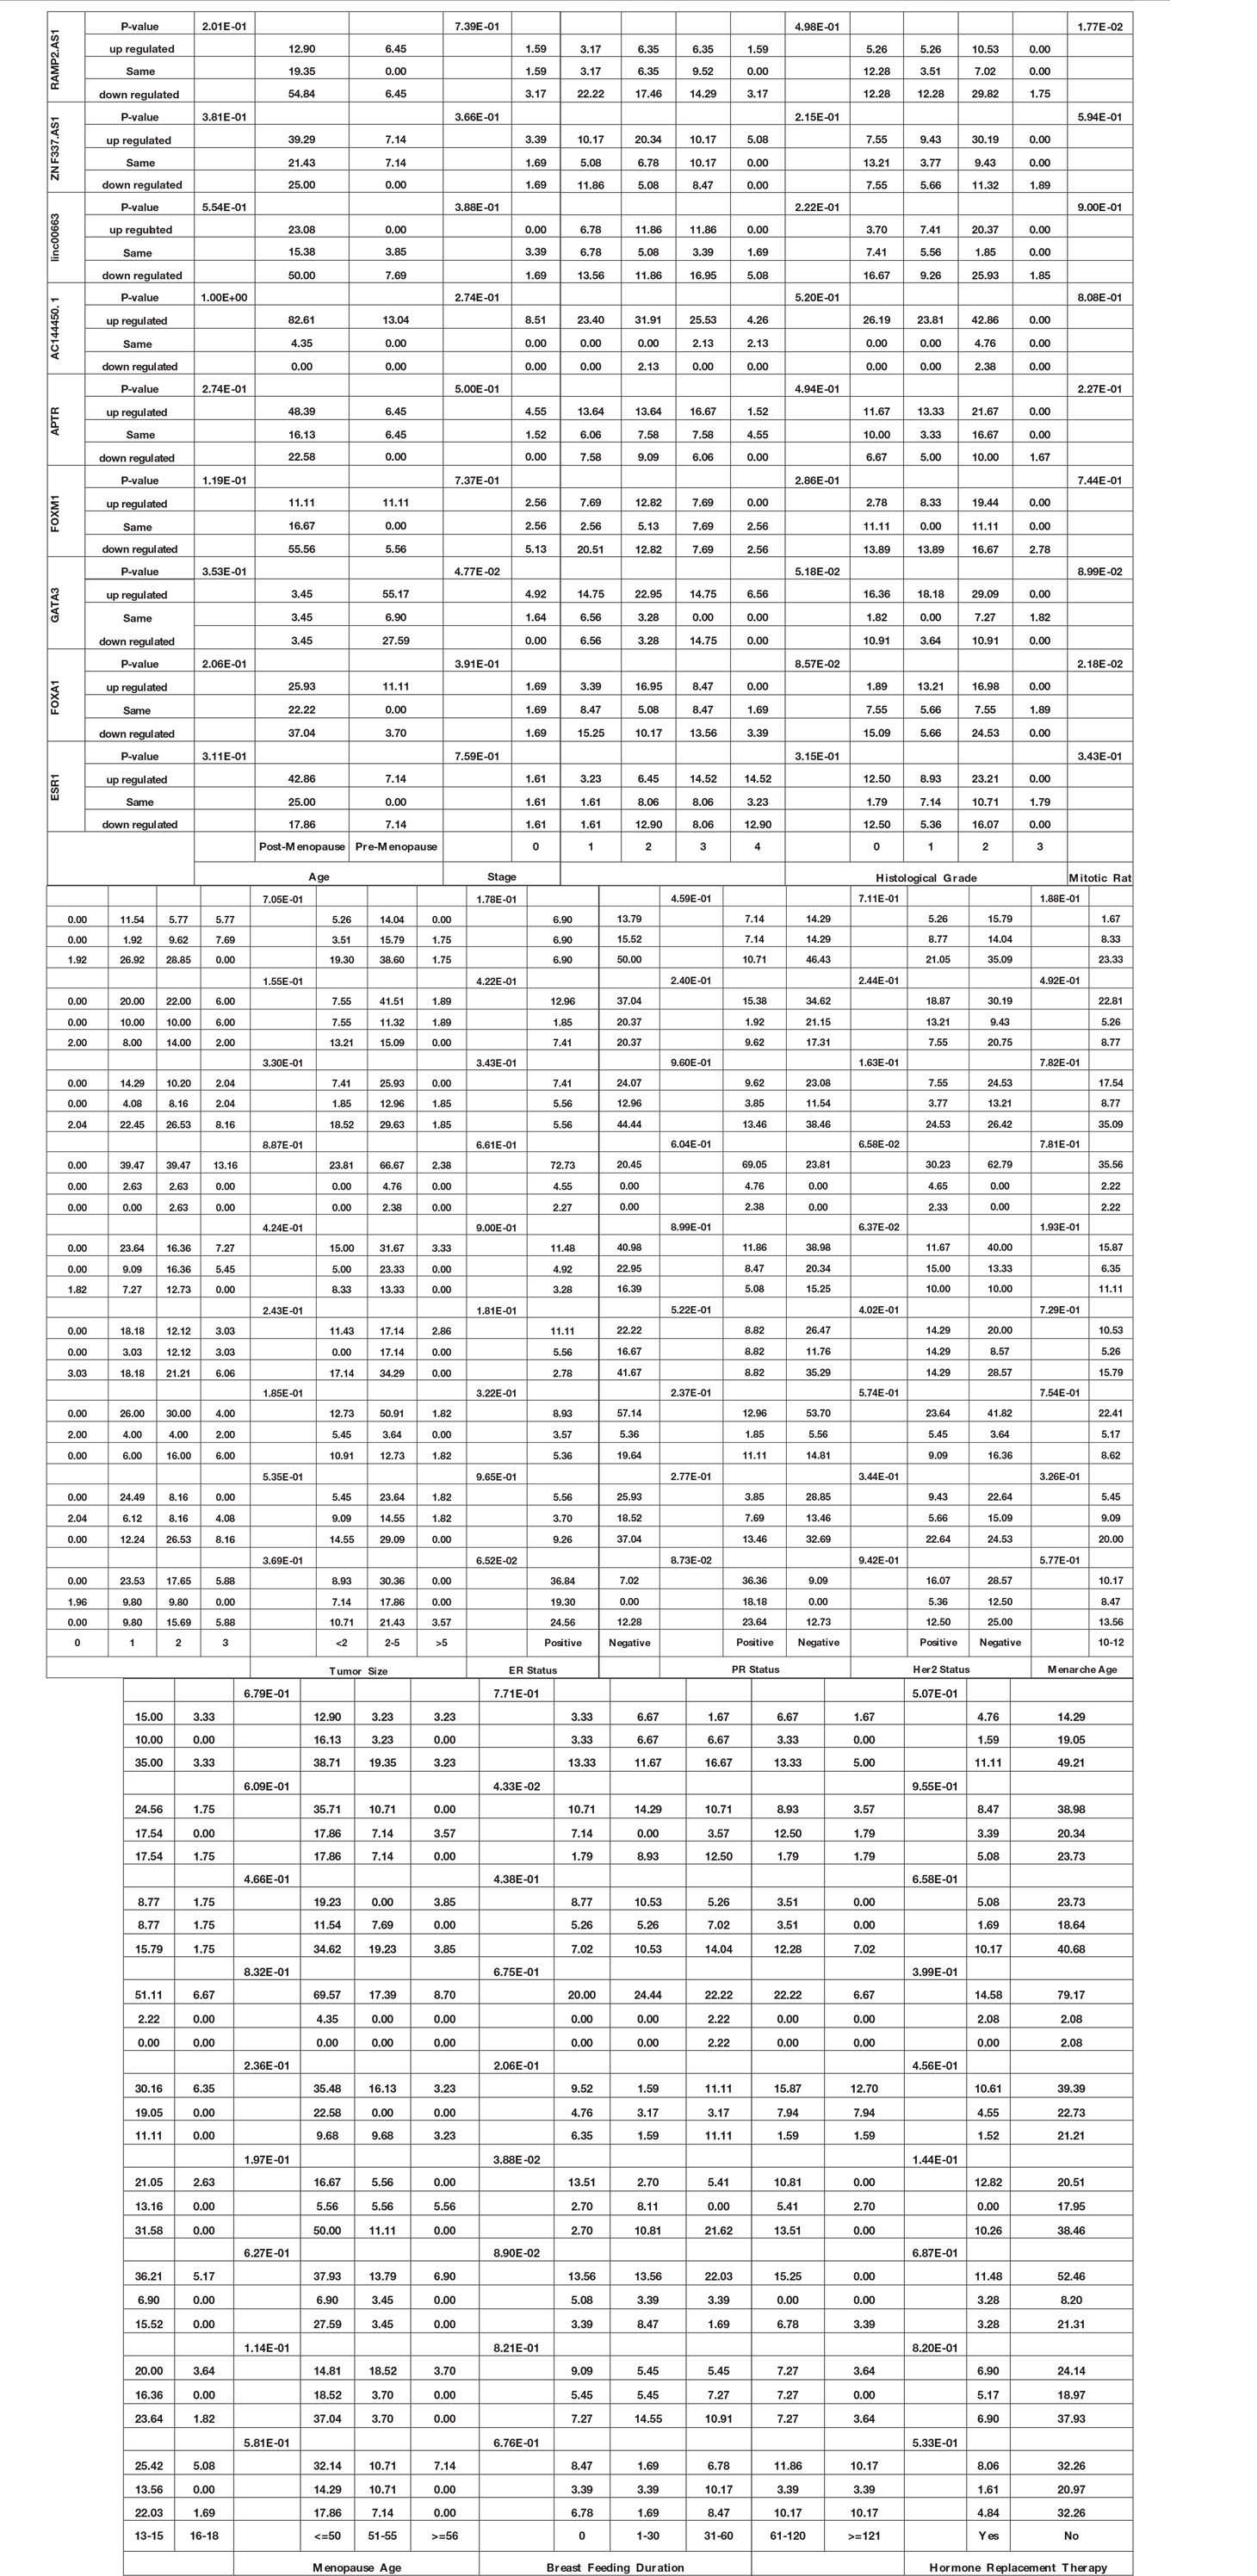
Table 4 Association between expression of genes and demographic/clinical data (Log2FC ≤−1 and log2FC ≥1 were regarded as down-regulation and up-regulation, respectively. Same levels of expression were described by −1< log2FC <1).
ROC Curve Analysis
Based on the AUC values, AC144450.1 had the optimal diagnostic power in distinguishing between cancerous and non-cancerous tissues (AUC = 0.95, Sensitivity = 0.90, Specificity = 0.96). The combination of expression levels of all genes slightly increased the diagnostic power (AUC = 0.96). Table 5 and Figure 6 show the details of the ROC curve analysis.
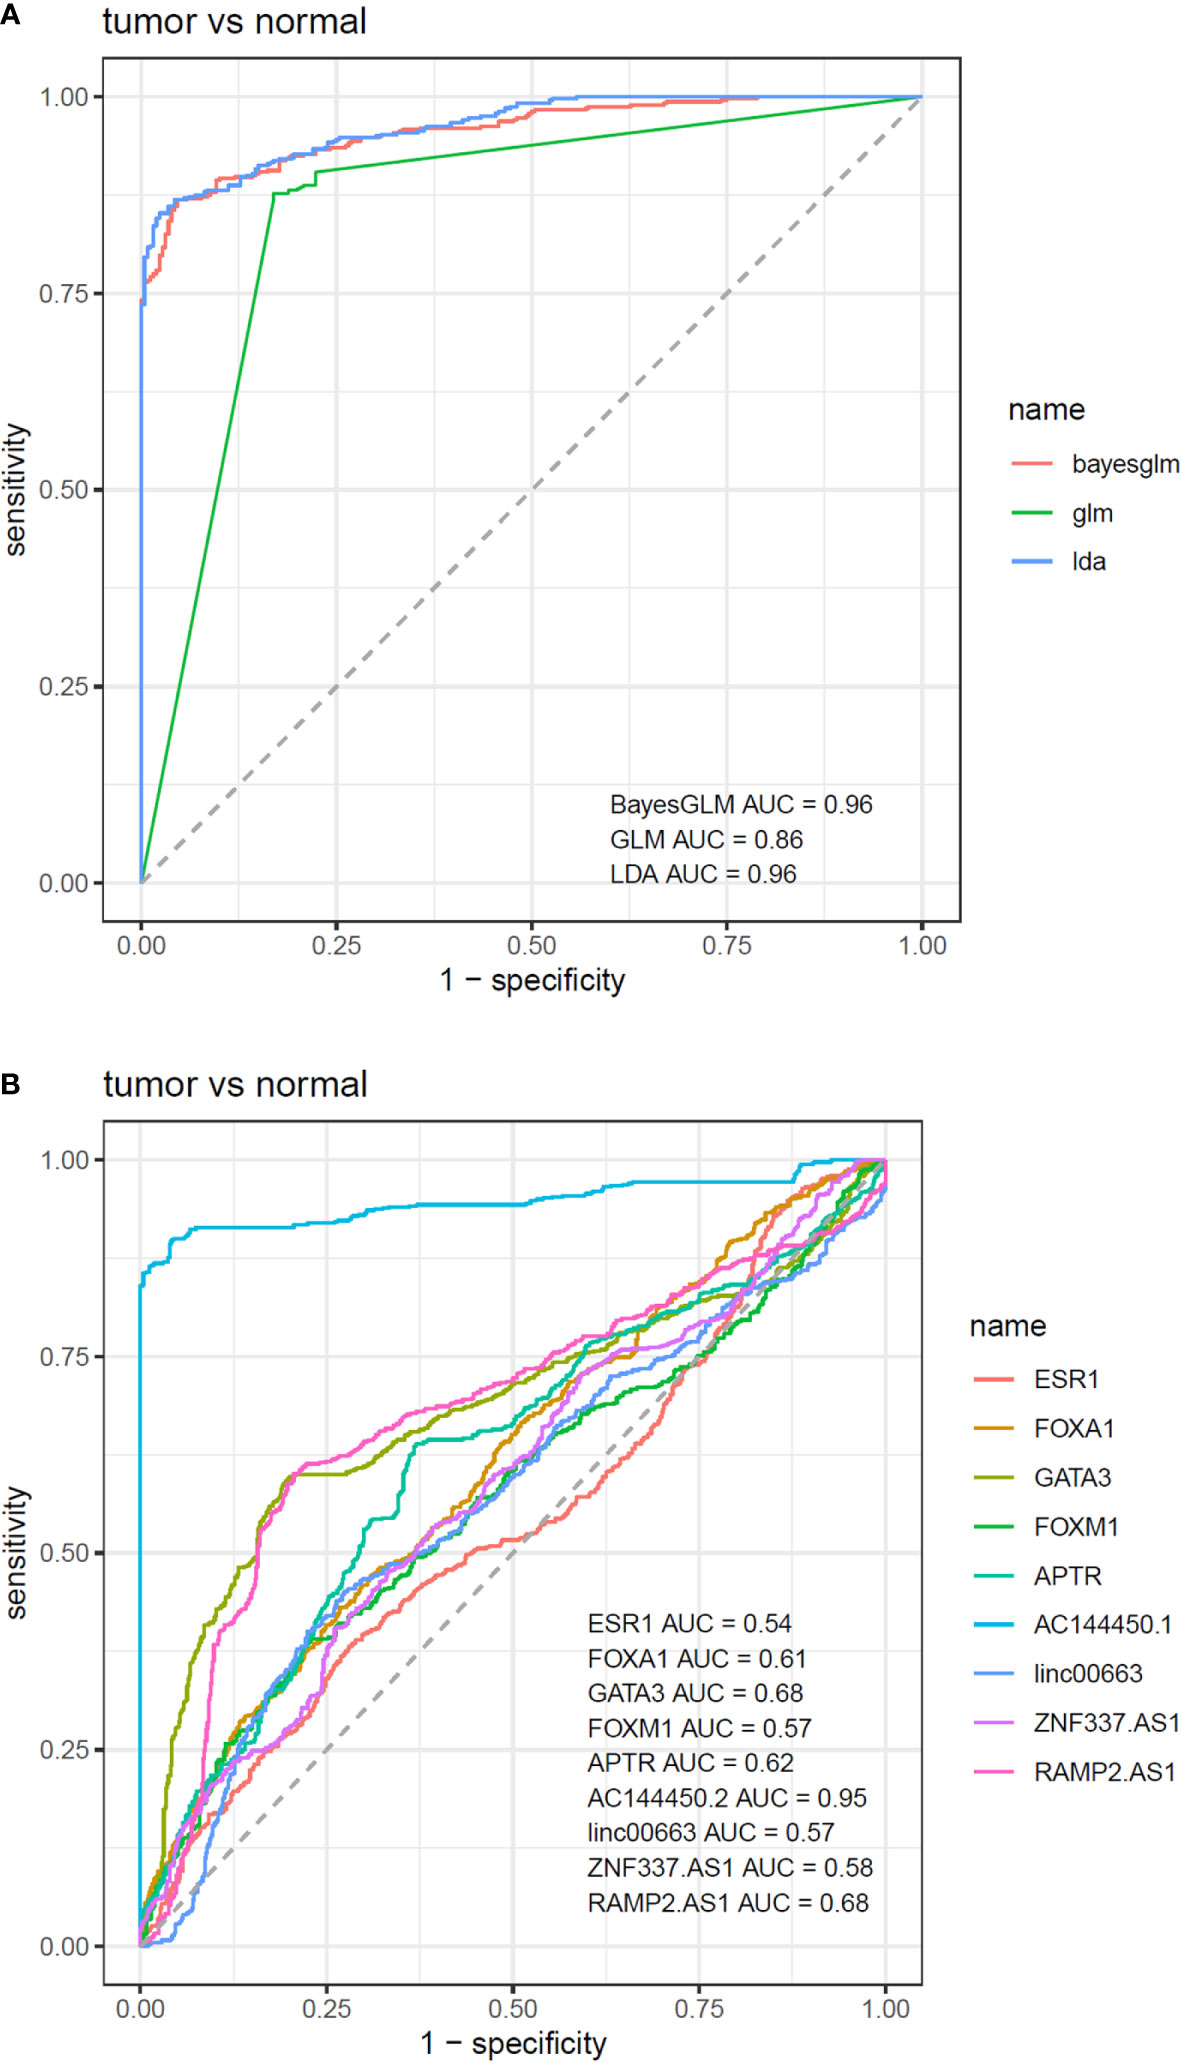
Figure 6 ROC curves depicted by three predictive machine learning methods, namely Bayesian Generalized Linear Model, Generalized Linear Model, and Linear Discriminant Analysis (A). The Bayesian Generalized Linear Model (bayesGLM) provided the most efficient estimates (B).
Correlation Analysis
While there were several substantial pairwise correlations between expression levels of genes in non-tumoral tissues, the most robust correlation was noticed between linc00663 and RAMP2.AS1 (r = 0.61, P value = 3.08E−8). In the breast cancer tissues, the most strong correlations were reported between FOXM1/ZNF337.AS1 and FOXM1/RAMP2.AS1 pairs (r = 0.51, P value = 4.79E−5 and r = 0.51, P value = 6.39E−5, respectively). Figure 7 shows the correlation matrix between expression levels of named transcription factors and related lncRNAs in two sets of samples.
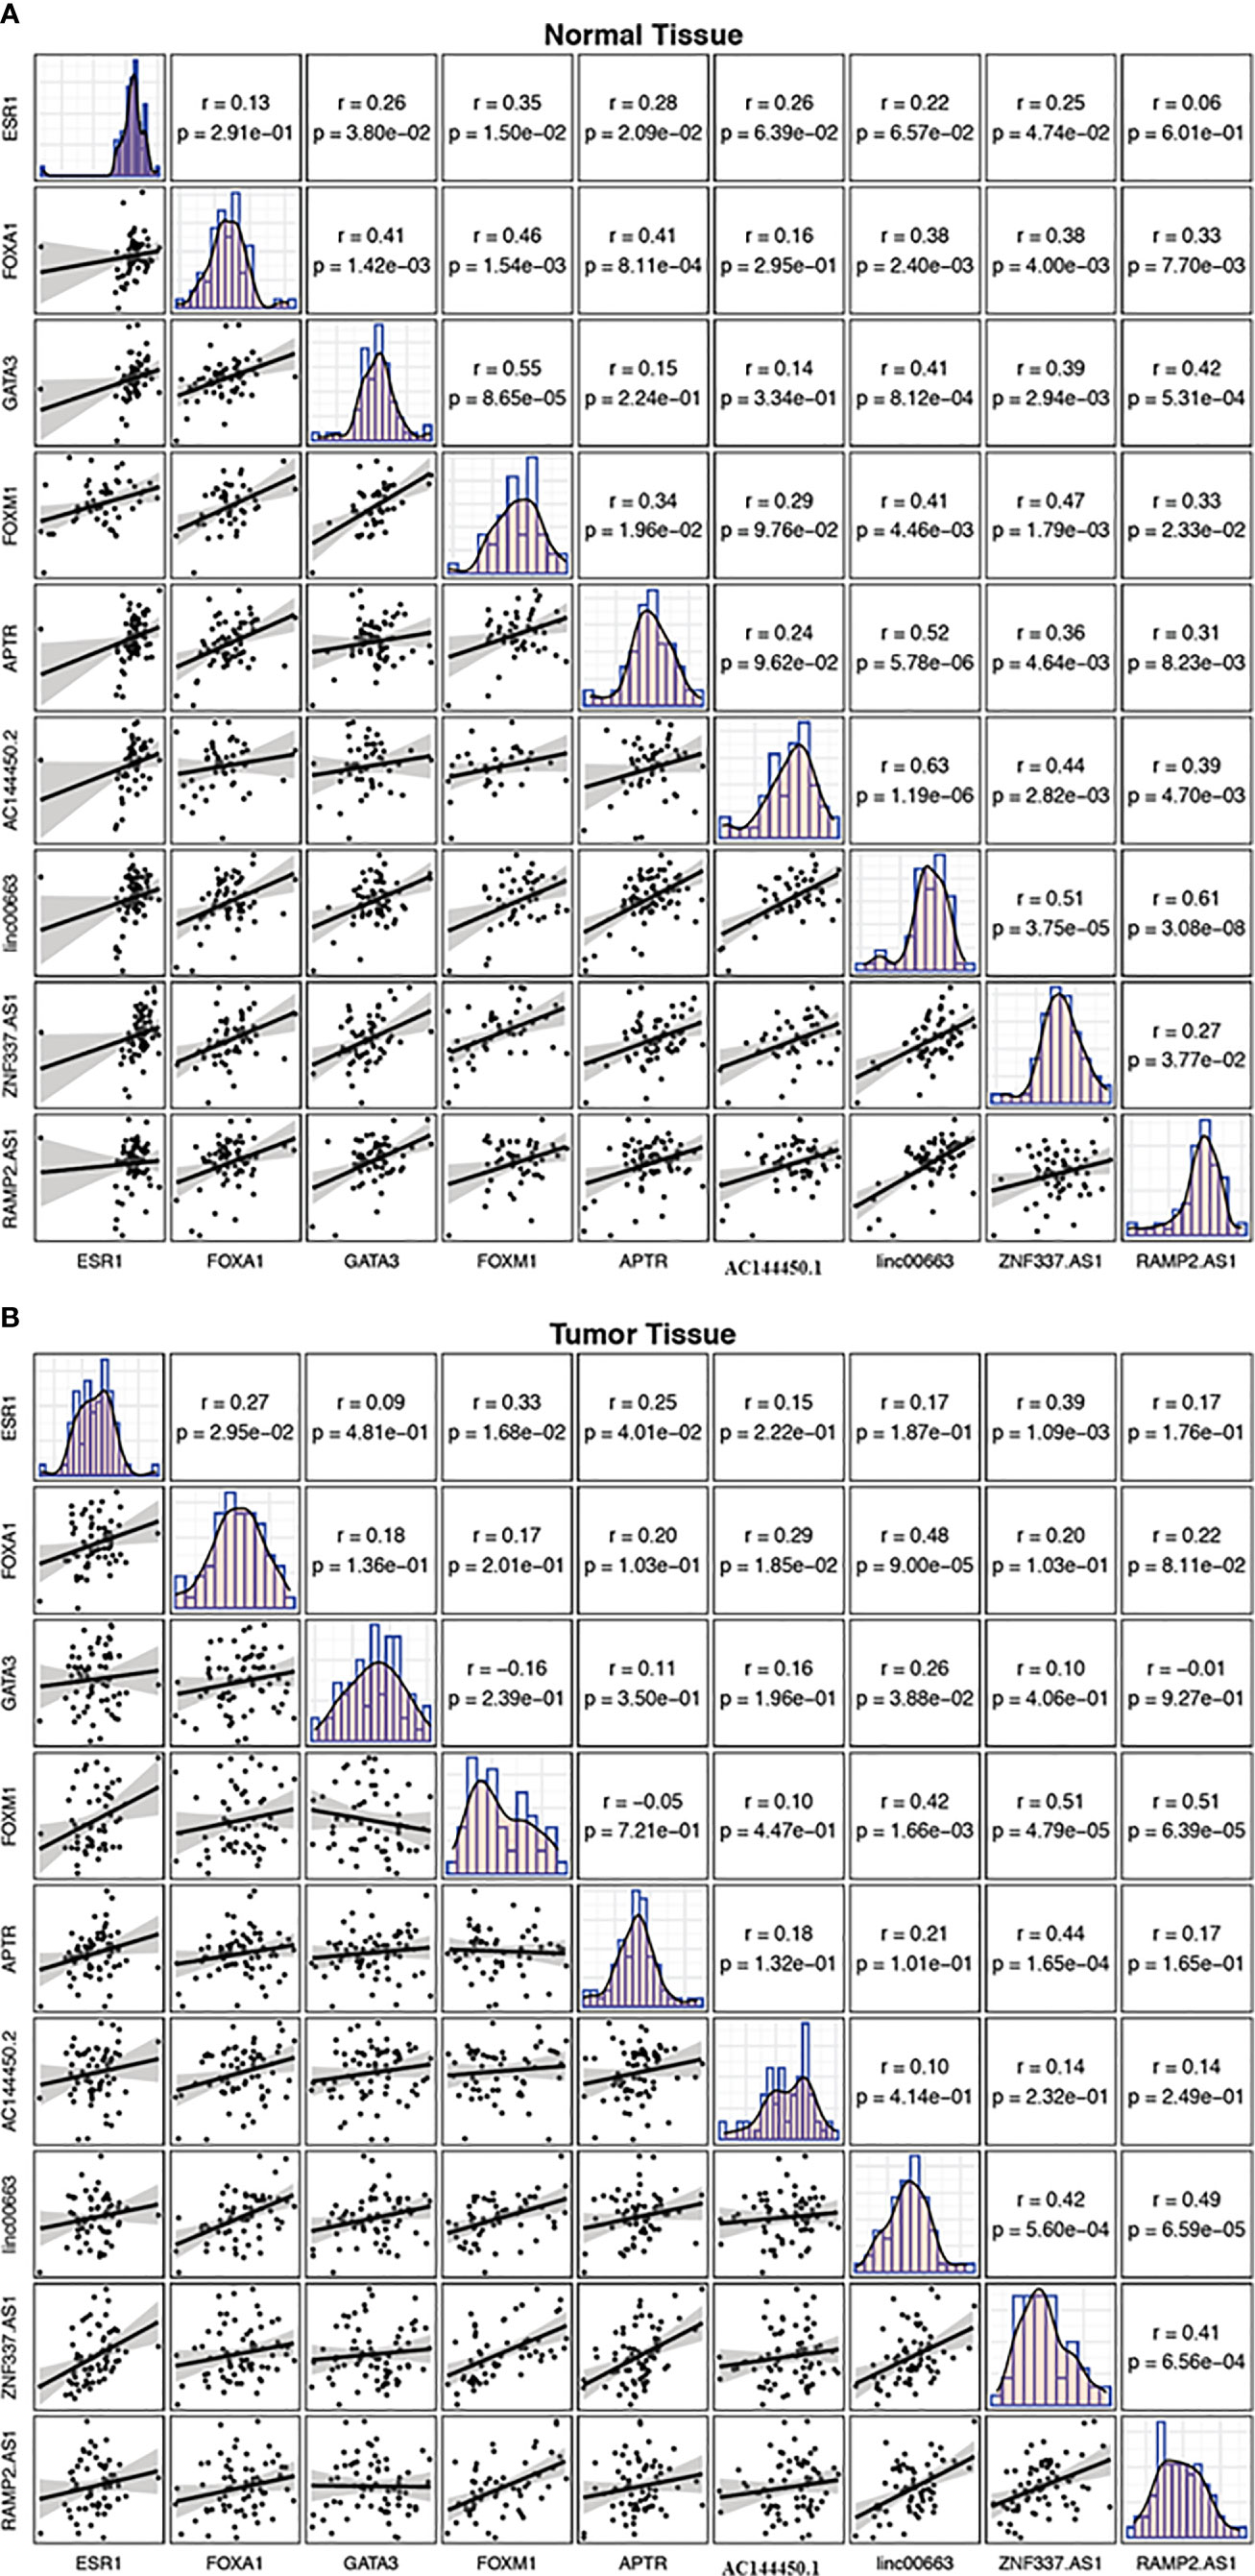
Figure 7 Correlation matrix showing the correlation between expression levels of FOXM1, GATA3, FOXA1, ESR1 and related lncRNAs in non-cancerous tissues (A) and breast cancer tissues (B). The distribution of each variable is shown on the diagonal. The bivariate scatter plots with a fitted line are presented at the bottom of the diagonal. The correlation coefficients and P values are presented on top of the diagonal.
Discussion
In the current project, we developed an in silico approach to identify lncRNAs, which are functionally associated with FOXM1, GATA3, FOXA1 and ESR1. Subsequently, we validated the results of in silico methods in clinical samples and assessed the expression of these genes and five lncRNAs in breast cancer samples and ANCTs. Figure 8 shows the interactions between the selected mRNAs and role of lncRNAs in the regulation of protein-coding genes.
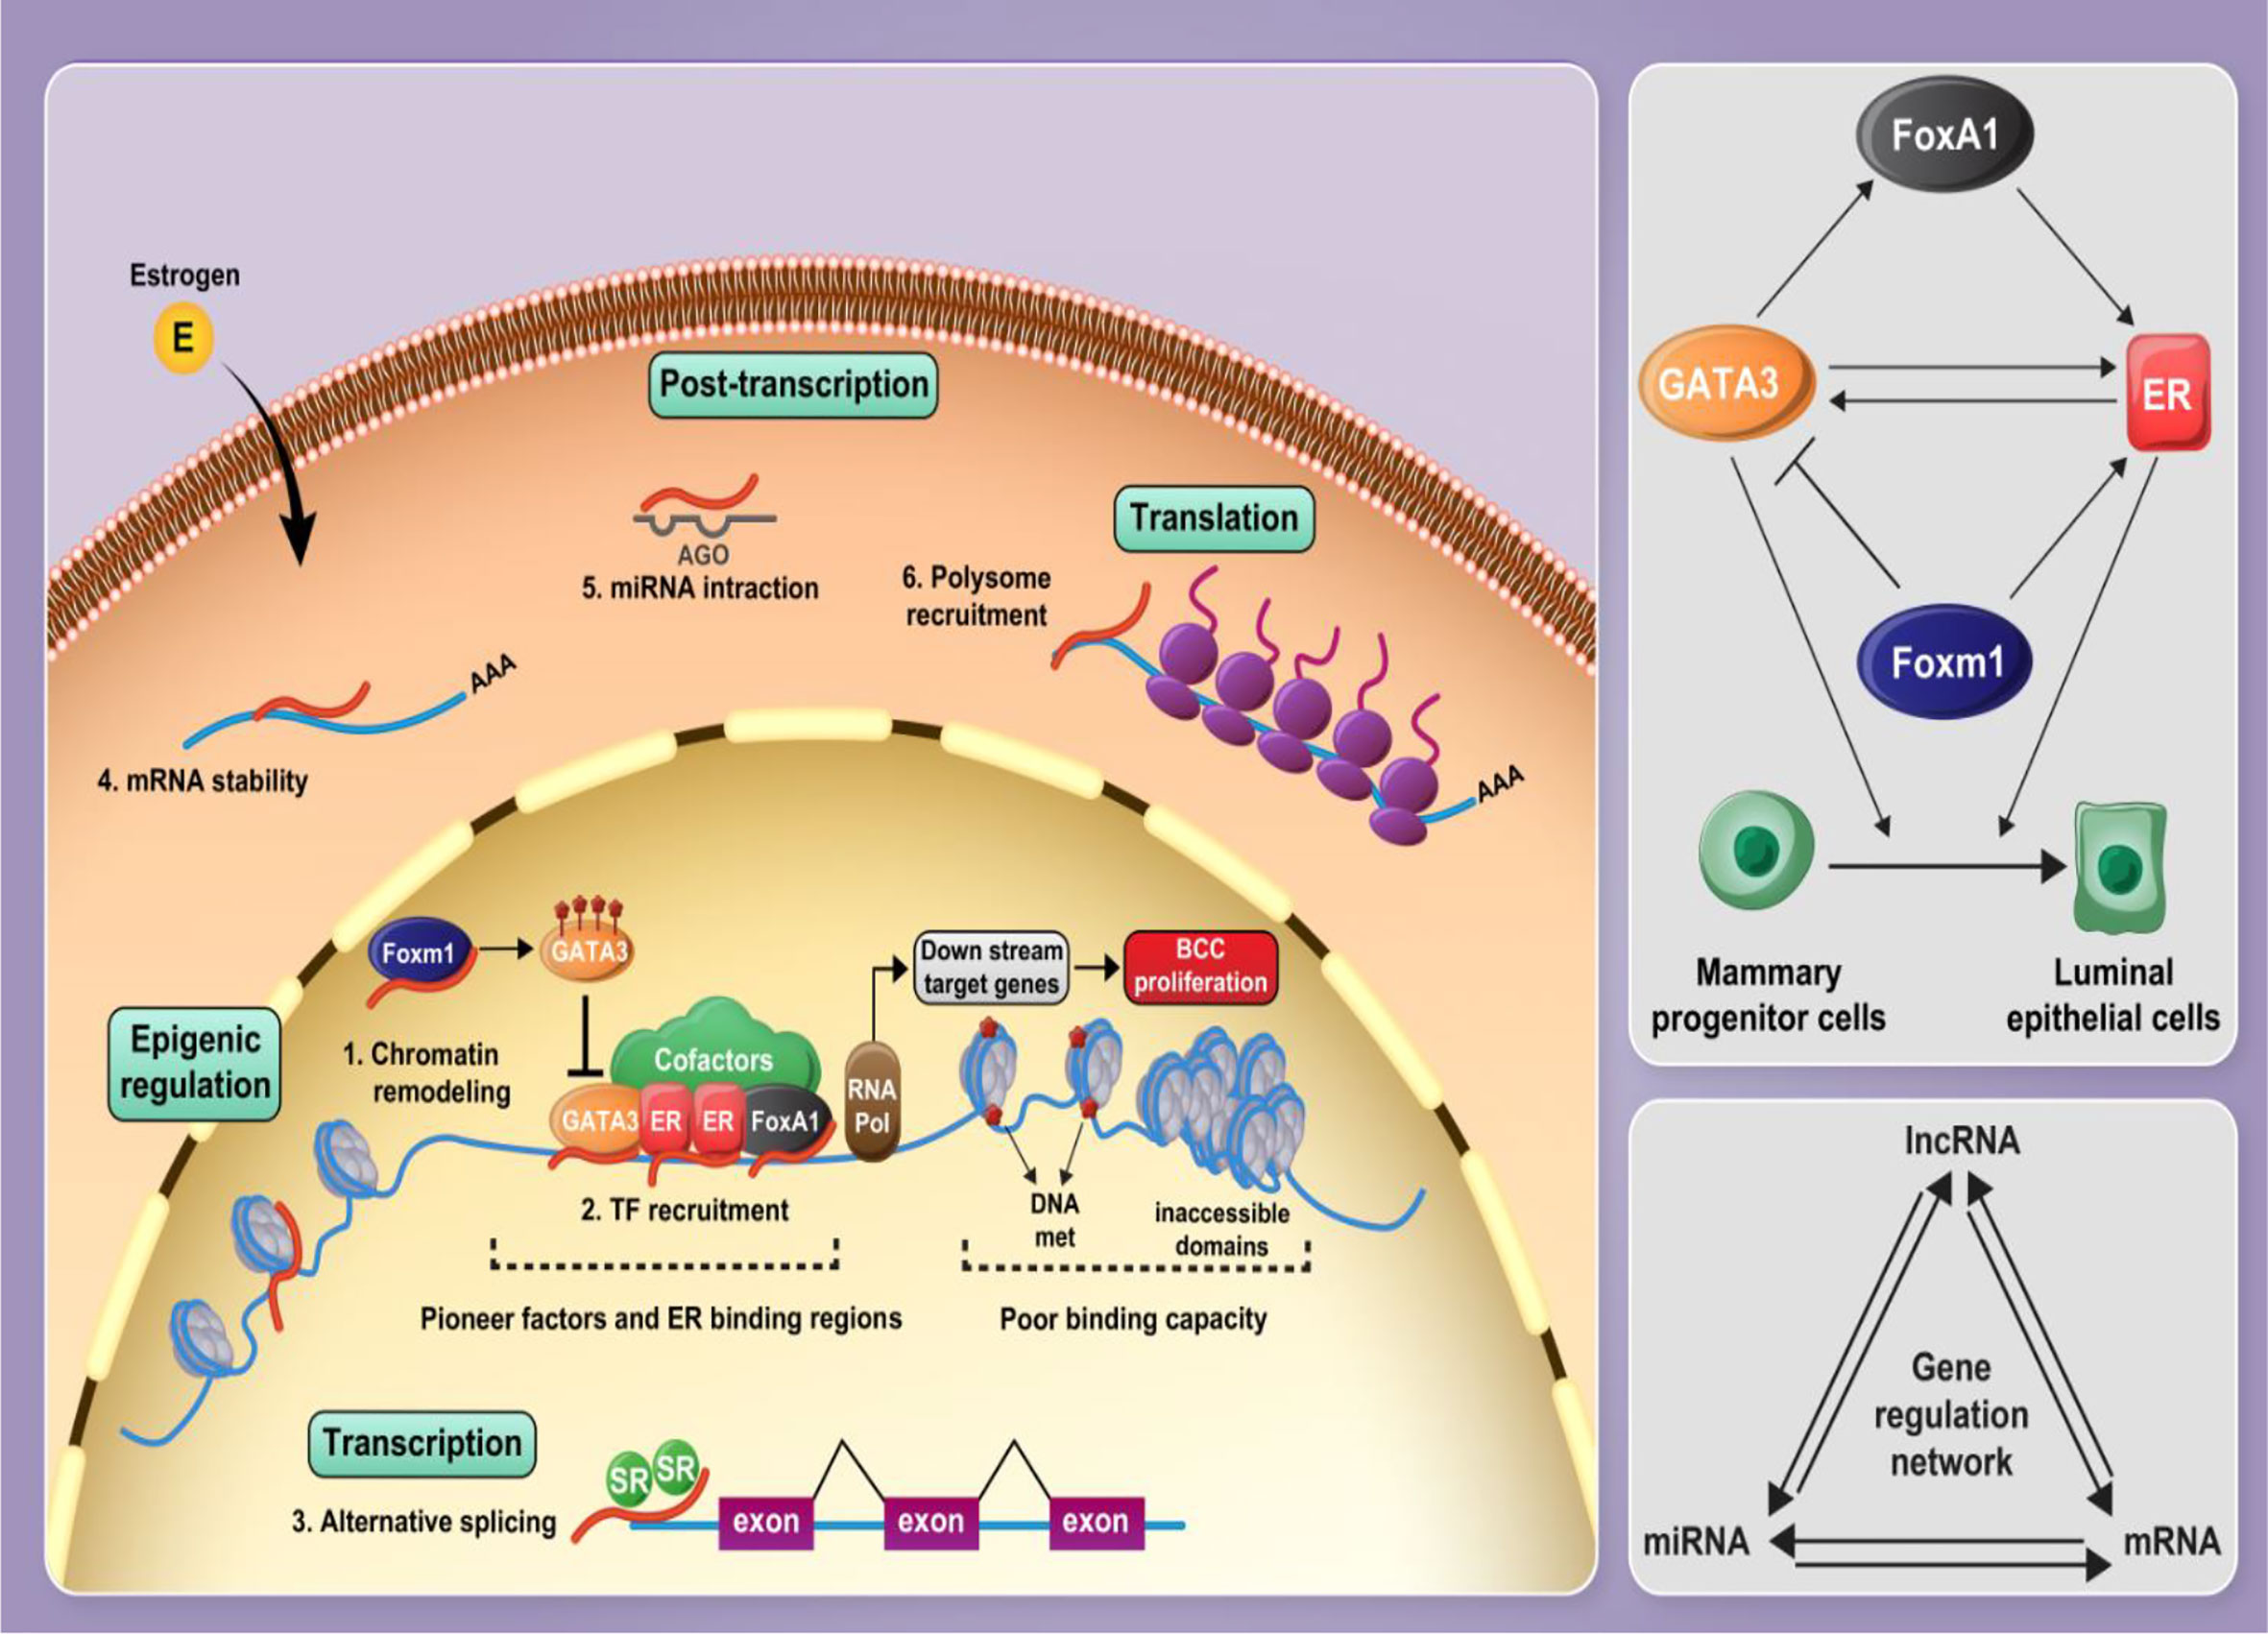
Figure 8 Several cofactors along with pioneer factors including FOXA1, ER1, and GATA3 contribute to establish a complex on the chromatin, modulating E2 signaling and mammary progenitor cell fate and promoting their differentiation into luminal epithelial cells. FOXA1 facilitates euchromatic conditions for ER through the formation of a stable platform for the recruitment of ER-associated coregulators and mediating chromatin loops with a subset of target gene promoters. GATA3 and ER are involved in a positive feedback regulation loop. FOXM1 regulates GATA3 expression by promoting DNA methylation leading to the expansion of mammary stem and progenitor pools. Non-coding RNAs, particularly lncRNAs and miRNAs, play critical roles in the regulation of protein-coding genes and, along with mRNAs, form a gene expression regulatory network. Gene expression regulation is influenced by lncRNAs at different levels, such as epigenetic, transcriptional level, post-transcriptional processes, and translational level.
Expression analysis of the mentioned genes in a cohort of breast cancer patients revealed overexpression of GATA3 in breast cancer tissues compared with ANCTs. This transcription factor has an essential role in the development of the normal mammary gland. In addition, it is regarded as the amplest transcription factor in luminal epithelial cells (24). The role of GATA3 as an oncogene or tumor suppressor gene is a matter of debate. The clustering of identified GATA3 mutations within specific functional protein domains is in line with the suggested description of an oncogene (24). Cimino-Mathews et al. have assessed GATA3 expression in a set of invasive ductal carcinomas samples as well as matched metastatic breast carcinomas using the tissue microarray method. They reported GATA3 labeling in two-thirds of primary ductal carcinomas, including triple-negative samples. Remarkably, GATA3 labeling was preserved in paired metastases and all “luminal loss” metastases that have lost ER and/or PR expression, indicating the application of this marker for diagnosis of metastatic breast cancers (25). Although several studies have shown an association between GATA3 and ER signaling pathway (2, 26, 27), the observed preservation of GATA3 expression in primary triple-negative breast cancer samples and metastatic tissues of luminal cancers in the absence of ER expression suggests dissociation of GATA3 from ER signaling in at least some cases of breast cancer (25). Consistent with this speculation, we could not find any association between GATA3 expression and ER status. In turn, we detected a significant association between expression levels of this gene and breast cancer stage. McCleskey et al. have demonstrated the significance of GATA3 expression in the determination of patients’ prognosis. Yet, they reported a similar expression of this protein between advanced luminal tumors and early-stage luminal tumors (28). The reason for inconsistency between our results and the results of the mentioned study is the difference in the expression assay technique (Immunohistochemical and In Situ Hybridization versus real-time PCR). Notably, correlation analysis revealed a significant correlation between expression levels of ESR1 and GATA3 in non-cancerous tissues despite lack of correlation in tumor tissues, suggesting the impact of cancer development on the functional association between these two genes.
Moreover, expression levels of APTR, AC144450.1, and ZNF337.AS1 were elevated in breast cancer tissues compared with control tissues. APTR has been previously shown to participate in the progression of osteosarcoma via inhibition of miR-132-3p expression and over-expression of yes-associated protein 1 (29). This miRNA also represses the progression of breast cancer (29). Therefore, in addition to the connection between APTR and ER signaling, over-expression of this lncRNA in breast cancer cells might facilitate the development of this cancer via repression of miR-132-3p expression. Moreover, this lncRNA has functional association with CDKN1A/p21 promoter and suppresses its expression through recruitment of polycomb proteins (30). Over-expression of p21 can preclude growth of ERα-positive breast cancer cells (31). Therefore, APTR might contribute in the pathogenesis of breast cancer via different mechanisms. Although the exact mechanism of AC144450.1 in the pathogenesis of cancer is unknown, Zhao et al. have reported over-expression of the fusion transcript PXDN-AC144450.2 in prostate cancer samples (32). This lncRNA has been among the differentially expressed lncRNAs between ductal carcinoma in situ and early stage breast cancer samples (33).
On the other hand, the expression of RAMP2.AS1 was lower in breast cancer tissues compared with controls. This lncRNA has been suggested to have a tumor-suppressive impact in glioblastoma via an indirect suppression of NOTCH3 (34). NOTCH3 expression contributes in the development of metastasis in both ERα positive and triple-negative breast cancer models (35). Therefore, RAMP2.AS1 might affect breast cancer pathogenesis via both ESR-dependent and -independent manners.
Combination of bioinformatics approaches and literature review has led to suggestion of some putative functional axes in breast cancer. Expression of none of these lncRNAs has been assessed in breast cancer. Based on the previous reports, a number of miRNAs have been identified that might mediate the regulatory role of these lncRNAs. APTR/miR‐132‐3p/YAP1 is a possible functional axis participating in the pathogenesis of osteosarcoma (36). Consistent with this study, in the bioinformatics steps of our study, we have identified miR-132-3p as one of differentially expressed miRNAs between breast cancer samples and non-cancerous samples. Additionally, miR-132-3p has been shown to bind with 3’ UTR of FOXA1 and suppress its expression, thus reducing breast cancer cells proliferation (37). Therefore, it is possible that APTR over-expression leads to down-regulation of miR-132-3p and release FOXA1 from its inhibitory effects. Thus, APTR/miR132-3P/FOXA1 axis possibly contributes in the pathogenesis of breast cancer. GATA3 is another target genes of miR-132-3p based on miRTArbase and miRWalk databases, therefore APTR/miR132-3p/GATA3 is another possible route of participation of APTR in breast cancer. The observed over-expression of GATA3 in the current study is consistent with this speculation. miR-9-5p is another differentially expressed miRNA based on our bioinformatics analyses. Down-regulation of miR-9-5p in ER-positive breast cancer cells has been associated with over-expression of ESR1 (38). It is possible that APTR up-regulation affects ESR1 expression through miR-9-5p. Based on the observed correlation between APTR and ESR1 in the current study, APTR/miR-9/ESR1 is another putative functional axis in breast cancer.
AC144450.1 has functional interactions with miR-182-5p, miR-301a-3p, miR-27a-3p and miR-148a-3p. Notably, GATA3, ESR1 and FOXA1 are targets for these miRNAs. Besides, ZNF337-AS1 has functional interactions with miR-671-5p and miR-485. Based on the reported data in miRWalk, FOXA1 and GATA3 are putative targets of miR-485. This miRNA has been down-regulated in T47D cells and has a potential tumor suppressor role (39). In addition, miR-485 decreases expression of PGC-1α, thus reducing metastatic potential of breast cancer (40). As GATA3 is a target of this miRNA, it is possible that ZNF-337-AS1 affects expression of GATA3 via this miRNA. ZNF-337-AS1/miR-485/FOXA1 and ZNF-337-AS1/miR-485/GATA3 are other putative functional axes in the pathogenesis of breast cancer. Finally, miR-30b-5p is a predicted target for RAMP2.AS1. ESR1 and FOXA1 are targeted by miR-30b-5p. Thus, RAMP2.AS1/miR-30b-5p/ESR1 and RAMP2.AS1/miR-30b-5p/FOXA1 axes might be involved in the pathogenesis of this kind of cancer.
Altered expressions of these lncRNAs in breast cancer samples have both diagnostic and therapeutic significance. Several therapeutic strategies have been designed to affect the hormone receptor-related pathways in breast cancer. However, response of patients to these options is variable (41). One can suppose that alterations in the regulatory mechanisms of these pathways might affect response of patients to these treatment modalities. Thus, prior identification of expression levels of mentioned lncRNAs in breast cancer samples may predict response of patients. Moreover, the difference in the survival rate of patients with breast cancer (42) necessitates identification of factors which have crucial role in the development of this kind of cancer. As lncRNAs can regulate expression of genes and activity of signaling pathways via different routes (43), they are appropriate candidates in diagnostic, prognostic and therapeutic approaches. Assessment of lncRNAs signatures in breast cancer, particularly those related with markers used for molecular subtyping is a practical method for understanding the mechanism of different responses of patients to targeted therapies. LncRNA signatures have been previously used as predictors of survival of breast cancer patients. For instance, a signature of eight lncRNAs associated with immune responses could predict survival of breast cancer patients (44). Moreover, a four lncRNA signature including PVT1, MAPT-AS1, LINC00667 and LINC00938 could precisely divide breast cancer patients into high- and low-risk groups (45).
A number of ER-associated cofactors might be used as markers or as potential therapeutic targets in breast cancer. For instance, deletion of NCoA-1 in animal models has attenuated the growth of tissues in response to steroid hormones (46). The steroid receptor RNA activator SRA which interacts with and regulates the AF-1 domain of ER (47), has been suggested as a prognostic biomarker for a subset of ER-positive/node-negative breast cancer patients (48). These observations potentiate ER-associated coregulators as markers for breast cancer.
Expression levels of FOXA1, ESR1, and FOXM1 and linc00663 at mRNA levels were not significantly different between two sets of samples. Thus, the previously reported dysregulation of these factors might be due to regulatory mechanisms at posttranscriptional level. Expressions of FOXA1 and RAMP2.AS1 were associated with mitotic rate, indicating the role of these genes in the carcinogenic processes. Finally, expressions of FOXM1 and ZNF337.AS1 were associated with breastfeeding duration. Future studies are needed to elaborate on the mechanisms of such observed associations.
Based on the area under receiver operating characteristics curves, AC144450.1 had the optimal diagnostic power in distinguishing between cancerous and non-cancerous tissues. The combination of expression levels of all genes slightly increased the diagnostic capability. Therefore, AC144450.1 can be regarded as a diagnostic biomarker for breast cancer. Based on the heterogeneity of expression levels of lncRNAs among breast cancer patients, a diagnostic panel for this kind of cancer should contain multiple genes whose signatures differentiate several types of neoplastic tissues with different levels of genes expressions. Applicability of any putative diagnostic panel should be assessed in independent samples.
While there were several significant pairwise correlations between expression levels of genes in non-tumoral tissues, the most robust correlation was detected between linc00663 and RAMP2.AS1. In the breast cancer tissues, the strongest correlations were reported between FOXM1/ZNF337.AS1 and FOXM1/RAMP2.AS1 pairs. Although the functional role of these pairs in the progression of breast cancer has not clarified, the altered correlation patterns between these genes in the context of cancer suggest the impact of malignancy on the determination of functional networks among genes.
In brief, the altered expression pattern of FOXM1/GATA3/FOXA1/ESR1-associated lncRNAs in breast cancer suggests future assessment of the functional role of these genes in the development of breast neoplasms. We state using only one gene expression microarray for selection of genes, lack of comparison of expression of genes between luminal, HER2+ and TNBC samples and lack of validation in an independent set of tumor/adjacent normal specimens as limitations of our study which should be addressed in future studies.
Data Availability Statement
The authors acknowledge that the data presented in this study must be deposited and made publicly available in an acceptable repository, prior to publication. Frontiers cannot accept a article that does not adhere to our open data policies.
Ethics Statement
The study protocol was approved by the ethical committee of Shahid Beheshti University of Medical Science (ethical code: IR.SBMU.RETECH.REC.1398.379). The patients/participants provided their written informed consent to participate in this study.
Author Contributions
MT and SG-F supervised the study, wrote the draft, and edited the submission. BH, AS, and AZ performed the experiment. FP and YA analyzed the data and performed the bioinformatic analysis. All authors contributed to the article and approved the submitted version.
Funding
The current study was supported by a grant from Shahid Beheshti University of Medical Sciences (Grant number: 25813).
Conflict of Interest
The authors declare that the research was conducted in the absence of any commercial or financial relationships that could be construed as a potential conflict of interest.
References
1. Bray F, Ferlay J, Soerjomataram I, Siegel RL, Torre LA, Jemal A. Global Cancer Statistics 2018: GLOBOCAN Estimates of Incidence and Mortality Worldwide for 36 Cancers in 185 Countries. CA: Cancer J Clin (2018) 68(6):394–424. doi: 10.3322/caac.21492
2. Perou CM, Sørlie T, Eisen MB, Van De Rijn M, Jeffrey SS, Rees CA, et al. Molecular Portraits of Human Breast Tumours. nature (2000) 406(6797):747–52. doi: 10.1038/35021093
3. Peng J, Zhang L, Yuan C, Zhou L, Xu S, Lin Y, et al. Expression Profile Analysis of Long Noncoding RNA in ER-Positive Subtype Breast Cancer Using Microarray Technique and Bioinformatics. Cancer Manage Res (2017) 9:891. doi: 10.2147/CMAR.S151120
4. Carroll JS. EJE PRIZE 2016: Mechanisms of Oestrogen Receptor (ER) Gene Regulation in Breast Cancer. Eur J Endocrinol (2016) 175(1):R41–R9. doi: 10.1530/EJE-16-0124
5. Bernardo GM, Lozada KL, Miedler JD, Harburg G, Hewitt SC, Mosley JD, et al. FOXA1 is an Essential Determinant of Erα Expression and Mammary Ductal Morphogenesis. Development (2010) 137(12):2045–54. doi: 10.1242/dev.043299
6. Carroll JS, Liu XS, Brodsky AS, Li W, Meyer CA, Szary AJ, et al. Chromosome-Wide Mapping of Estrogen Receptor Binding Reveals Long-Range Regulation Requiring the Forkhead Protein Foxa1. Cell (2005) 122(1):33–43. doi: 10.1016/j.cell.2005.05.008
7. Laganière J, Deblois G, Lefebvre C, Bataille AR, Robert F, Giguere V. Location Analysis of Estrogen Receptor α Target Promoters Reveals That FOXA1 Defines a Domain of the Estrogen Response. Proc Natl Acad Sci (2005) 102(33):11651–6. doi: 10.1073/pnas.0505575102
8. Manavathi B, Samanthapudi VS, Gajulapalli VNR. Estrogen Receptor Coregulators and Pioneer Factors: The Orchestrators of Mammary Gland Cell Fate and Development. Front Cell Dev Biol (2014) 2:34. doi: 10.3389/fcell.2014.00034
9. Millour J, Constantinidou D, Stavropoulou AV, Wilson MS, Myatt SS, Kwok JM, et al. FOXM1 is a Transcriptional Target of Eralpha and Has a Critical Role in Breast Cancer Endocrine Sensitivity and Resistance. Oncogene (2010) 29(20):2983–95. doi: 10.1038/onc.2010.47
10. Statello L, Guo CJ, Chen LL, Huarte M. Gene Regulation by Long Non-Coding Rnas and Its Biological Functions. Nat Rev Mol Cell Biol (2021) 22:96–118. doi: 10.1038/s41580-020-00315-9
11. Gruosso T, Mieulet V, Cardon M, Bourachot B, Kieffer Y, Devun F, et al. Chronic Oxidative Stress Promotes H2 AX Protein Degradation and Enhances Chemosensitivity in Breast Cancer Patients. EMBO Mol Med (2016) 8(5):527–49. doi: 10.15252/emmm.201505891
12. Gautier L, Cope L, Bolstad B, Irizarry R. Affy–Analysis of Affymetrix Genechip Data At the Probe Level. Bioinforma (2004) 20:307–15. doi: 10.1093/bioinformatics/btg405
13. Carey D, Bolstad B, Dettling M, Dudoit S, Ellis B, Gautier L, et al. Bioconductor: Open Software Development for Computational Biology and Bioinformatics R. Gentleman. VJ Genome Biol (2004) 5:R80. doi: 10.1186/gb-2004-5-10-r80
14. Wettenhall JM, Smyth GK. Limmagui: A Graphical User Interface for Linear Modeling of Microarray Data. Bioinformatics (2004) 20(18):3705–6. doi: 10.1093/bioinformatics/bth449
15. Lesurf R, Aure MR, Mørk HH, Vitelli V, Sauer T, Geisler J, et al. Molecular Features of Subtype-Specific Progression From Ductal Carcinoma in Situ to Invasive Breast Cancer. Cell Rep (2016) 16(4):1166–79. doi: 10.1016/j.celrep.2016.06.051
16. Aure MR, Vitelli V, Jernström S, Kumar S, Krohn M, Due EU, et al. Integrative Clustering Reveals a Novel Split in the Luminal a Subtype of Breast Cancer With Impact on Outcome. Breast Cancer Res (2017) 19(1):44. doi: 10.1186/s13058-017-0812-y
17. Barrett T, Wilhite SE, Ledoux P, Evangelista C, Kim IF, Tomashevsky M, et al. NCBI GEO: archive for functional genomics data sets—update. Nucleic Acids Research, vol. 41(D1). (2013). p. D991–D5. doi: 10.1093/nar/gks1193
18. Zhang H, Zhang X, Huang J, Fan X. Identification of Key Genes and Pathways for Peri-Implantitis Through the Analysis of Gene Expression Data. Exp Ther Med (2017) 13(5):1832–40. doi: 10.3892/etm.2017.4176
19. Chawla K, Tripathi S, Thommesen L, Lægreid A, Kuiper M. Tfcheckpoint: A Curated Compendium of Specific DNA-Binding RNA Polymerase II Transcription Factors. Bioinformatics (2013) 29(19):2519–20. doi: 10.1093/bioinformatics/btt432
20. Szklarczyk D, Franceschini A, Wyder S, Forslund K, Heller D, Huerta-Cepas J, et al. STRING v10: protein–protein interaction networks, integrated over the tree of life. Nucleic Acid Res (2015) 43(D1):D447–52. doi: 10.1093/nar/gku1003
21. Paul S, Andrew M, Owen O, Baliga NS, Wang JT, Ramage D, et al. Cytoscape: A Software Environment for Integrated Models of Biomolecular Interaction Networks. Genome Res (2003) 13(11):2498–504. doi: 10.1101/gr.1239303
22. Bader GD, Hogue CW. An Automated Method for Finding Molecular Complexes in Large Protein Interaction Networks. BMC Bioinf (2003) 4(1):2. doi: 10.1186/1471-2105-4-2
23. Mohebi M, Ghafouri-Fard S, Modarressi MH, Dashti S, Zekri A, Kholghi-Oskooei V, et al. Expression Analysis of Vimentin and the Related Lncrna Network in Breast Cancer. Exp Mol Pathol (2020) 115:104439. doi: 10.1016/j.yexmp.2020.104439
24. Takaku M, Grimm SA, Wade PA. GATA3 in Breast Cancer: Tumor Suppressor or Oncogene? Gene Expr (2015) 16(4):163–8. doi: 10.3727/105221615X14399878166113
25. Cimino-Mathews A, Subhawong AP, Illei PB, Sharma R, Halushka MK, Vang R, et al. GATA3 Expression in Breast Carcinoma: Utility in Triple-Negative, Sarcomatoid, and Metastatic Carcinomas. Hum Pathol (2013) 44(7):1341–9. doi: 10.1016/j.humpath.2012.11.003
26. Hoch RV, Thompson DA, Baker RJ, Weigel RJ. GATA-3 is Expressed in Association With Estrogen Receptor in Breast Cancer. Int J Cancer (1999) 84(2):122–8. doi: 10.1002/(SICI)1097-0215(19990420)84:2<122::AID-IJC5>3.0.CO;2-S
27. Van De Vijver MJ, He YD, Van’t Veer LJ, Dai H, Hart AA, Voskuil DW, et al. A Gene-Expression Signature as a Predictor of Survival in Breast Cancer. New Engl J Med (2002) 347(25):1999–2009. doi: 10.1056/NEJMoa021967
28. McCleskey BC, Penedo TL, Zhang K, Hameed O, Siegal GP, Wei S. GATA3 Expression in Advanced Breast Cancer: Prognostic Value and Organ-Specific Relapse. Am J Clin Pathol (2015) 144(5):756–63. doi: 10.1309/AJCP5MMR1FJVVTPK
29. Guan H, Shang G, Cui Y, Liu J, Sun X, Cao W, et al. Long Noncoding RNA APTR Contributes to Osteosarcoma Progression Through Repression of Mir-132-3p and Upregulation of Yes-Associated Protein 1. J Cell Physiol (2019) 234(6):8998–9007. doi: 10.1002/jcp.27572
30. Negishi M, Wongpalee SP, Sarkar S, Park J, Lee KY, Shibata Y, et al. A New Lncrna, APTR, Associates With and Represses the CDKN1A/P21 Promoter by Recruiting Polycomb Proteins. PloS One (2014) 9(4):e95216. doi: 10.1371/journal.pone.0095216
31. Sheikh MS, Rochefort H, Garcia M. Overexpression of P21waf1/CIP1 Induces Growth Arrest, Giant Cell Formation and Apoptosis in Human Breast Carcinoma Cell Lines. Oncogene (1995) 11(9):1899–905.
32. Zhao S, Løvf M, Carm KT, Bakken AC, Hoff AM, Skotheim RI. Novel Transcription-Induced Fusion Rnas in Prostate Cancer. Oncotarget (2017) 8(30):49133–43. doi: 10.18632/oncotarget.17099
33. Deva Magendhra Rao AK, Patel K, Korivi Jyothiraj S, Meenakumari B, Sundersingh S, Sridevi V, et al. Identification of Lnc RNA S Associated With Early-Stage Breast Cancer and Their Prognostic Implications. Mol Oncol (2019) 13(6):1342–55. doi: 10.1002/1878-0261.12489
34. Liu S, Mitra R, Zhao MM, Fan W, Eischen CM, Yin F, et al. The Potential Roles of Long Noncoding Rnas (Lncrna) in Glioblastoma Development. Mol Cancer Ther (2016) 15(12):2977–86. doi: 10.1158/1535-7163.MCT-16-0320
35. Leontovich AA, Jalalirad M, Salisbury JL, Mills L, Haddox C, Schroeder M, et al. NOTCH3 Expression is Linked to Breast Cancer Seeding and Distant Metastasis. Breast Cancer Res (2018) 20(1):105–. doi: 10.1186/s13058-018-1020-0
36. Guan H, Shang G, Cui Y, Liu J, Sun X, Cao W, et al. Long Noncoding RNA APTR Contributes to Osteosarcoma Progression Through Repression of Mir-132-3p and Upregulation of Yes-Associated Protein 1. J Cell Physiol (2019) 234(6):8998–9007. doi: 10.1002/jcp.27572
37. Jee YH, Wang J, Yue S, Jennings M, Clokie SJ, Nilsson O, et al. Mir-374-5p, Mir-379-5p, and Mir-503-5p Regulate Proliferation and Hypertrophic Differentiation of Growth Plate Chondrocytes in Male Rats. Endocrinology (2018) 159(3):1469–78. doi: 10.1210/en.2017-00780
38. Barbano R, Pasculli B, Rendina M, Fontana A, Fusilli C, Copetti M, et al. Stepwise Analysis of MIR9 Loci Identifies Mir-9-5p to Be Involved in Oestrogen Regulated Pathways in Breast Cancer Patients. Sci Rep (2017) 7(1):1–12. doi: 10.1038/srep45283
39. Anaya-Ruiz M, Bandala C, Perez-Santos J. Mir-485 Acts as a Tumor Suppressor by Inhibiting Cell Growth and Migration in Breast Carcinoma T47D Cells. Asian Pac J Cancer Prev (2013) 14(6):3757–60. doi: 10.7314/APJCP.2013.14.6.3757
40. Lou C, Xiao M, Cheng S, Lu X, Jia S, Ren Y, et al. Mir-485-3p and Mir-485-5p Suppress Breast Cancer Cell Metastasis by Inhibiting PGC-1 α Expression. Cell Death Dis (2016) 7(3):e2159–e. doi: 10.1038/cddis.2016.27
41. Lumachi F, Brunello A, Maruzzo M, Basso U, Basso SM. Treatment of Estrogen Receptor-Positive Breast Cancer. Curr Med Chem (2013) 20(5):596–604. doi: 10.2174/092986713804999303
42. Fallahpour S, Navaneelan T, De P, Borgo A. Breast Cancer Survival by Molecular Subtype: A Population-Based Analysis of Cancer Registry Data. CMAJ Open (2017) 5(3):E734–E9. doi: 10.9778/cmajo.20170030
43. Peng WX, Koirala P, Mo YY. Lncrna-Mediated Regulation of Cell Signaling in Cancer. Oncogene (2017) 36(41):5661–7. doi: 10.1038/onc.2017.184
44. Ma W, Zhao F, Yu X, Guan S, Suo H, Tao Z, et al. Immune-Related Lncrnas as Predictors of Survival in Breast Cancer: A Prognostic Signature. J Trans Med (2020) 18(1):1–13. doi: 10.1186/s12967-020-02522-6
45. Zhu M, Lv Q, Huang H, Sun C, Pang D, Wu J. Identification of a Four-Long Non-Coding RNA Signature in Predicting Breast Cancer Survival. Oncol Lett (2020) 19(1):221–8. doi: 10.3892/ol.2019.11063
46. Xu J, Qiu Y, DeMayo FJ, Tsai SY, Tsai M-J, O’Malley BW. Partial Hormone Resistance in Mice With Disruption of the Steroid Receptor Coactivator-1 (SRC-1) Gene. Science (1998) 279(5358):1922–5. doi: 10.1126/science.279.5358.1922
47. Lanz RB, McKenna NJ, Onate SA, Albrecht U, Wong J, Tsai SY, et al. A Steroid Receptor Coactivator, SRA, Functions as an RNA and is Present in an SRC-1 Complex. Cell (1999) 97(1):17–27. doi: 10.1016/S0092-8674(00)80711-4
Keywords: breast cancer, lncRNAs, FOXM1/GATA3/FOXA1/ESR1 axis, APTR, AC144450.1, linc00663, ZNF337.AS1, RAMP2.AS1
Citation: Hassani B, Taheri M, Asgari Y, Zekri A, Sattari A, Ghafouri-Fard S and Pouresmaeili F (2021) Expression Analysis of Long Non-Coding RNAs Related With FOXM1, GATA3, FOXA1 and ESR1 in Breast Tissues. Front. Oncol. 11:671418. doi: 10.3389/fonc.2021.671418
Received: 23 February 2021; Accepted: 26 March 2021;
Published: 19 May 2021.
Edited by:
Anabel Sorolla, University of Western Australia, AustraliaReviewed by:
Rakesh Kumar, Rajiv Gandhi Centre for Biotechnology, IndiaCarlos Martinez-Perez, Medical Research Council Institute of Genetics and Molecular Medicine (MRC), United Kingdom
Copyright © 2021 Hassani, Taheri, Asgari, Zekri, Sattari, Ghafouri-Fard and Pouresmaeili. This is an open-access article distributed under the terms of the Creative Commons Attribution License (CC BY). The use, distribution or reproduction in other forums is permitted, provided the original author(s) and the copyright owner(s) are credited and that the original publication in this journal is cited, in accordance with accepted academic practice. No use, distribution or reproduction is permitted which does not comply with these terms.
*Correspondence: Soudeh Ghafouri-Fard, cy5naGFmb3VyaWZhcmRAc2JtdS5hYy5pcg==; Farkhondeh Pouresmaeili, cG91cmVzZmFyQGdtYWlsLmNvbQ==
 Bita Hassani1
 Mohammad Taheri
 Soudeh Ghafouri-Fard
 Farkhondeh Pouresmaeili