
94% of researchers rate our articles as excellent or good
Learn more about the work of our research integrity team to safeguard the quality of each article we publish.
Find out more
ORIGINAL RESEARCH article
Front. Oncol., 18 August 2021
Sec. Neuro-Oncology and Neurosurgical Oncology
Volume 11 - 2021 | https://doi.org/10.3389/fonc.2021.665891
This article is part of the Research TopicAdvances of Radiomics and Artificial Intelligence in the Management of Patients with Central Nervous System TumorsView all 12 articles
 Yu Zhang1,2†
 Kewei Liang2,3,4†
 Jiaqi He2,5
 He Ma4
 Hongyan Chen1
 Fei Zheng1Lingling Zhang1
 Xinsheng Wang6*
 Xibo Ma2,3*
 Xuzhu Chen1*
Objectives: To explore the MRI-based differential diagnosis of deep learning with data enhancement for cerebral glioblastoma (GBM), primary central nervous system lymphoma (PCNSL), and tumefactive demyelinating lesion (TDL).
Materials and Methods: This retrospective study analyzed the MRI data of 261 patients with pathologically diagnosed solitary and multiple cerebral GBM (n = 97), PCNSL (n = 92), and TDL (n = 72). The 3D segmentation model was trained to capture the lesion. Different enhancement data were generated by changing the pixel ratio of the lesion and non-lesion areas. The 3D classification network was trained by using the enhancement data. The accuracy, sensitivity, specificity, and area under the curve (AUC) were used to assess the value of different enhancement data on the discrimination performance. These results were then compared with the neuroradiologists’ diagnoses.
Results: The diagnostic performance fluctuated with the ratio of lesion to non-lesion area changed. The diagnostic performance was best when the ratio was 1.5. The AUCs of GBM, PCNSL, and TDL were 1.00 (95% confidence interval [CI]: 1.000–1.000), 0.96 (95% CI: 0.923–1.000), and 0.954 (95% CI: 0.904–1.000), respectively.
Conclusions: Deep learning with data enhancement is useful for the accurate identification of GBM, PCNSL, and TDL, and its diagnostic performance is better than that of the neuroradiologists.
Cerebral glioblastoma (GBM), primary central nervous system lymphoma (PCNSL), and tumefactive demyelinating lesion (TDL) are distinct neurological lesions with respect to their pathology, treatment, and prognosis. GBM and PCNSL are both malignant primary intracranial tumors in adults (1, 2). The conventional management strategies are surgical resection followed by radiochemotherapy for GBM, and chemotherapy for PCNSL, respectively. The clinical onsets of the two kinds of neoplasms are not specific and closely related to the extent and location of lesions (3). TDL is an inflammatory disease characterized by varied neurodegenerative clinical manifestations, such as movement disorder and vision impairment (4). Hormone therapy is effective for TDL, and the clinical course is more favorable than brain malignancy.
All these three kinds of lesions can be either solitary or multiple (5–7). The conventional MRI findings of these three kinds of lesions are overlapping. As solitary lesions, they usually present as enhanced masses with peripheral edema. As multiple lesions, they present as scattered and enhanced masses in the brain. The open-ring enhancement in TDL may be an important sign that distinguishes it from other tumors (8). This typical radiological finding, however, is not frequent, resulting in a difficult diagnosis.
The similar routine MRI findings represent a challenge for the differential diagnosis. Given the conventional radiology characteristics, some advanced MRI modalities have been used for the differentiation of three lesions. A systematic review showed that the dynamic susceptibility contrast-enhanced image (DSC) and arterial spin labeling (ASL) had the potential to discriminate PCNSL from GBM (9). Another study reported that diffusion-weighted imaging (DWI) could be a useful diagnostic tool to differentiate among PCNSL, GBM, and inflammatory demyelination pseudotumor (10). Moreover, MRS had been a valuable approach to distinguish the mimicked pathologies (11).
However, these advanced MR modalities mainly focused only on the enhanced component of the lesion. Radiomics-based analysis, on the other hand, can explore the whole lesion including the enhanced and non-enhanced components. Recently, different radiomics have been developed to better understand cerebral entities. For example, the deep learning approach has been used for the differential diagnosis or grading in meningioma (12–14).
Thus far, both the advanced MR modalities and radiomics analysis have been used for the differentiation of the three lesions; however, these have only focused on the solitary form of the three lesions. All three lesion types can be multiple (4, 15). Moreover, most radiomics analysis have only considered machine learning algorithms with small datasets (10, 16). Thus, we collected more data and attempted to identify the three types of lesions by using MRI-based deep learning with data enhancement algorithm, with simultaneous focus on single and multiple lesions.
This study is retrospective in nature. It was approved by the ethics committee of Beijing Tiantan Hospital. The need for patient informed consent was waived.
Our study recruited 97, 92, and 72 patients with GBM, PCNSL, and TDL, between January 2005 and December 2019. Of these subjects, 97 patients with GBM, 76 patients with PCNSL, and 52 patients with TDL were from a single medical institute. The remaining 16 patients with PCNSL and 20 patients with TDL were from another medical institute. All patients with GBM and PCNSL were confirmed by pathology. Among 72 patients with TDL, 52 were diagnosed based on the definition of TDL: demyelinating lesions (2 cm or greater) or lesions between 0.5 and 2 cm with possible mass effect that can be mistaken for tumor-like space-occupying lesions and have a characteristic radiographic appearance (17). With analysis of medical records and clinical and MRI characteristics, 20 were pathologically confirmed owing to the diagnostic uncertainty.
The inclusion criteria were as follows: (1) GBM and PCNSL confirmed by pathology, respectively; (2) TDL diagnosed by pathology or the corresponding criteria (17); (3) available cerebral MRI before diagnosis. The exclusion criteria were as follows: (1) patient age <18 years; (2) missing clinical information; (3) receipt of hormone therapy before undergoing MRI; (4) no data on enhanced MRI; (5) lesions not in the cerebral parenchyma; and (6) MR images with obvious artifact. The enrollment process is presented in Supplementary File 1. Each type of entity was composed of solitary or multiple lesions.
The MRI acquisition protocols were composed of pre- and post-enhanced T1-weighted (CE-T1) images. The contrast media type, venous injection dose, and acquisition parameters for CE-T1 are given in Supplementary File 2.
All MR images in the form of digital imaging and communications in medicine (DICOM) were input to the ITK-SNAP (version 3.4.0, www.itk-snap.org). The regions of interest (ROIs) of these three types of lesions were manually delineated on axial CE-T1 by a neuroradiologist using ITK-SNAP.
Before the ROI segmentation, two blinded neuroradiologists with 10 years of experience independently diagnosed these three types of diseases for 130 randomly selected cases out of the 261 cases. Each neuroradiologist had access to the full DICOM images from different MRI scanners. The number of accurately diagnosed cases by the two senior neuroradiologists were divided by that of all diagnosed cases. The result was determined to calculate the diagnostic performance.
All continuous and categorical variables were expressed as the mean ± standard deviation and the number (percentage), respectively. One-way analysis of variance (ANOVA) and Pearson’s chi-square tests were used to compare the group differences with regard to patient age, sex ratio, and number of multiple lesions by SPSS (version 23.0, IBM Corporation, Armonk, NY, USA). A p < 0.05 was considered to indicate statistical significance. The receiver operating characteristic (ROC) curve obtained from the pROC (version 1.16.2) of R (version 4.0.2) was used to show the area under the curve (AUC), accuracy, specificity, and sensitivity under different thresholds to evaluate the performance of the classification model.
Most of the algorithms were implemented by Python 3.7.4. The 261 subjects were randomly divided into a training set and a testing set. The training set included 67 cases of GBM, 65 cases of PCNSL, and 50 cases of TDL, and the testing set consisted of 30 cases of GBM, 27 cases of PCNSL, and 22 cases of TDL. All data were converted into a NIFTI format to adapt to a 3D network.
The diagnosis process is presented in Figure 1. It was divided into three stages and was not an end-to-end solution.
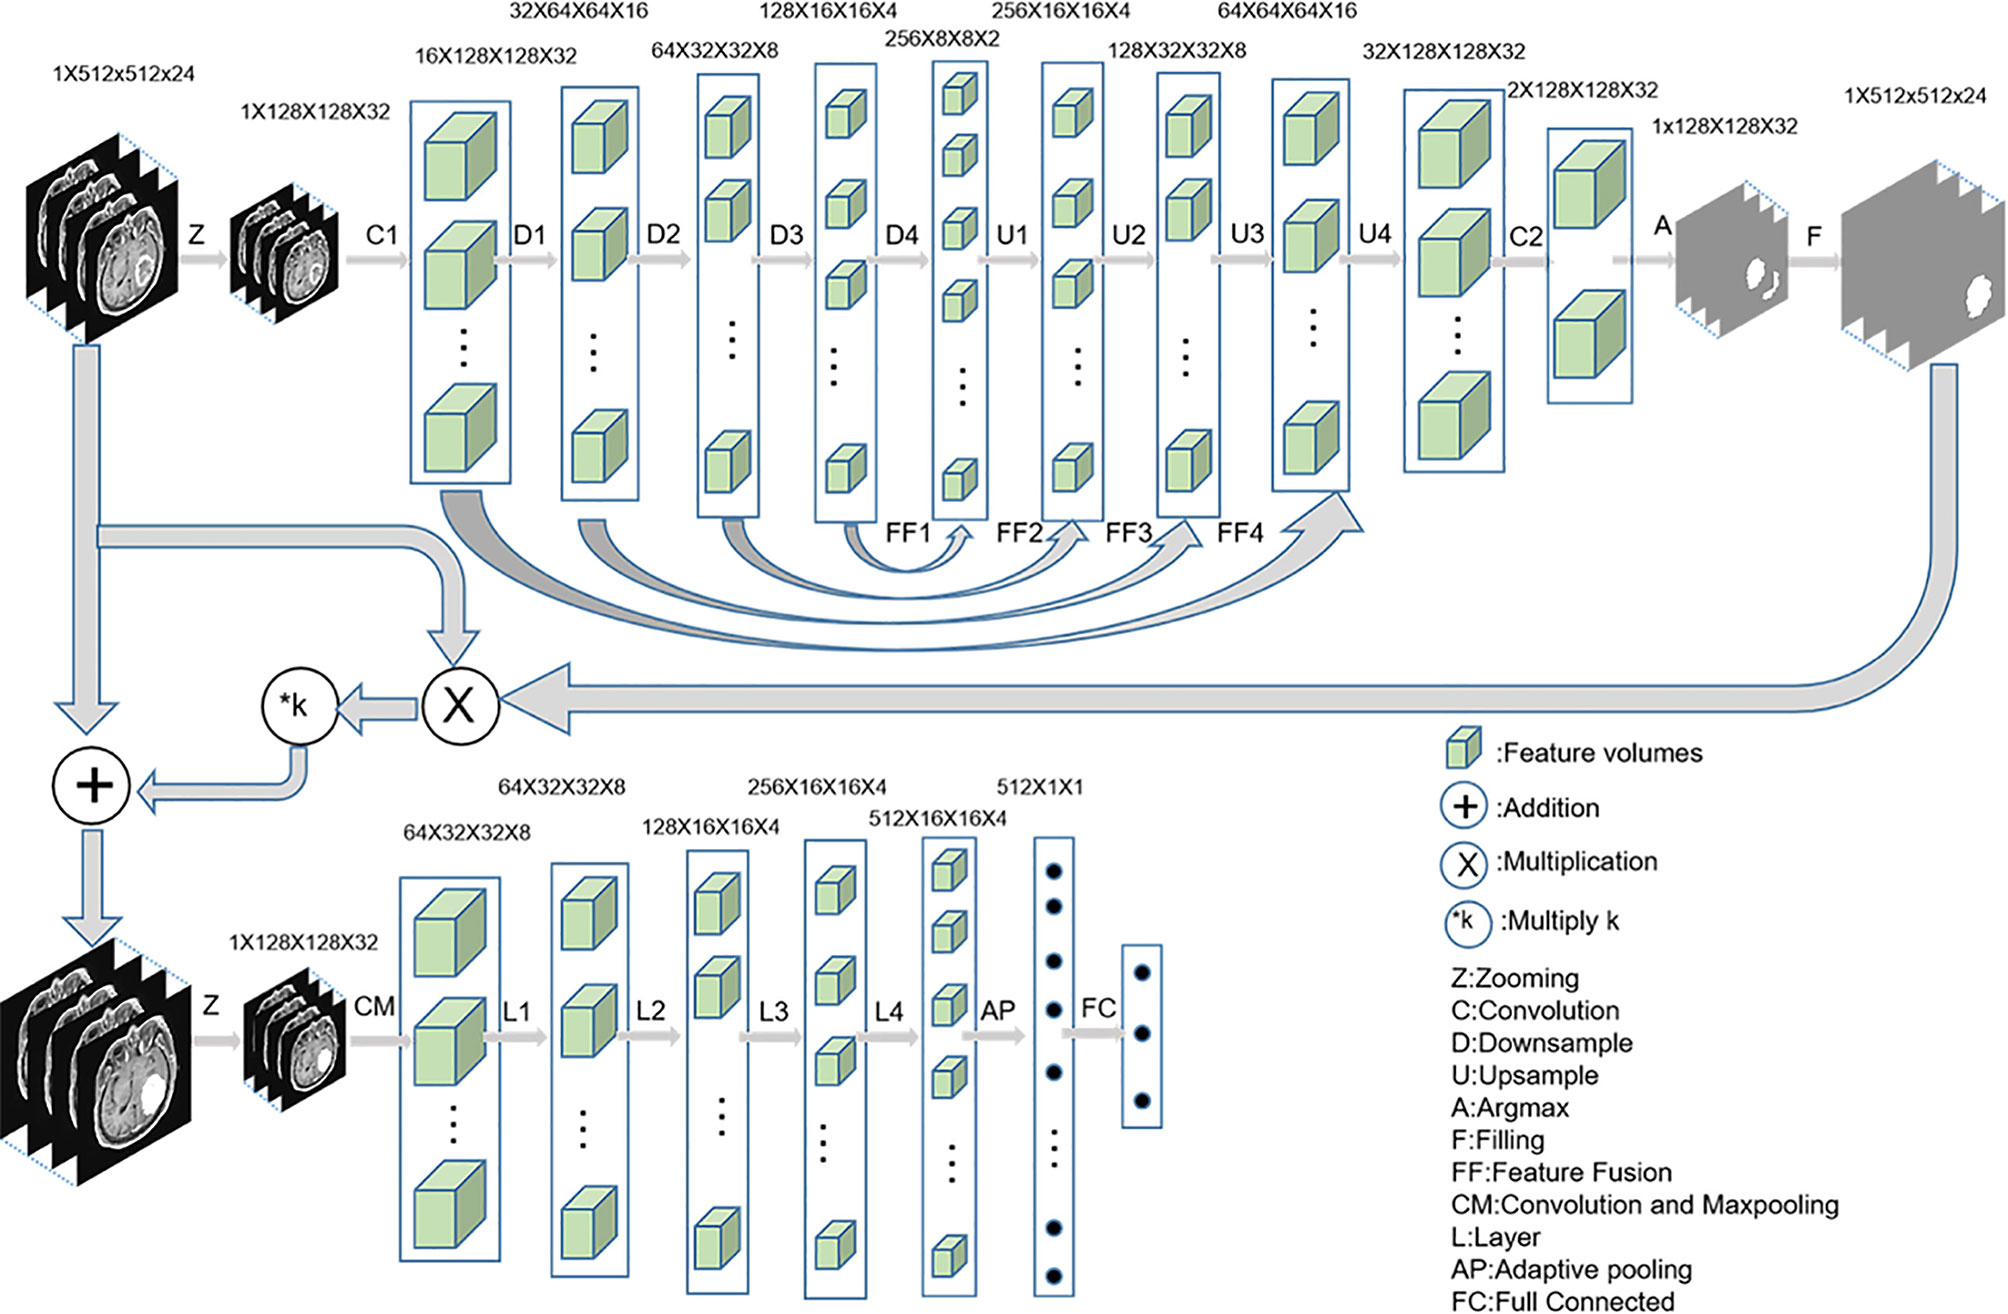
Figure 1 The implementation process of three-stage algorithm based on deep learning with data enhancement. In the first stage, 3D u-net is used to capture the lesion area; in the second stage, enhanced data are generated; and in the third stage, 3D Resnet is used for diagnosis.
In the first stage, a 3D U-Net (18) was used to automatically predict the lesion area. First, MRI was cropped to reduce the consumption of computing resources, and then the data were normalized to reduce the interference of medical image caused by uneven light. The initial input network image size was reduced to 128 × 128 × 32 without affecting the segmentation performance. Second, the fixed-size image was entered into a convolution layer and four ResBlock downsampling modules to obtain different depth features. Third, the features obtained after the fourth downsampling were fused with the features obtained after the third downsampling module. The fused features were entered into the upsampling ResBlock module to obtain the upsampling features. By analogy, the image size was finally restored to 128 × 128 × 32. Finally, the number of channels were reduced to two after the image entered a convolution layer. The segmentation mask was obtained by argmax function, and the segmentation mask was restored to 512 × 512 × 24 by bilinear interpolation.
In the second stage, the segmented lesion area was combined with the original MR image to change the pixels of the lesion area by a certain multiple, and the pixels of the non-lesion area were unchanged. The following combination equation was used:
Where Mn represents the enhanced data, M represents the original MR image, n represents the segmented mask, and k represents the enhancement coefficient. In this experiment, five k values were selected, namely, −0.5, 0, 0.5, 1, and 2, to explore the best model. The Mn visualization for different k values is shown in Figure 2.
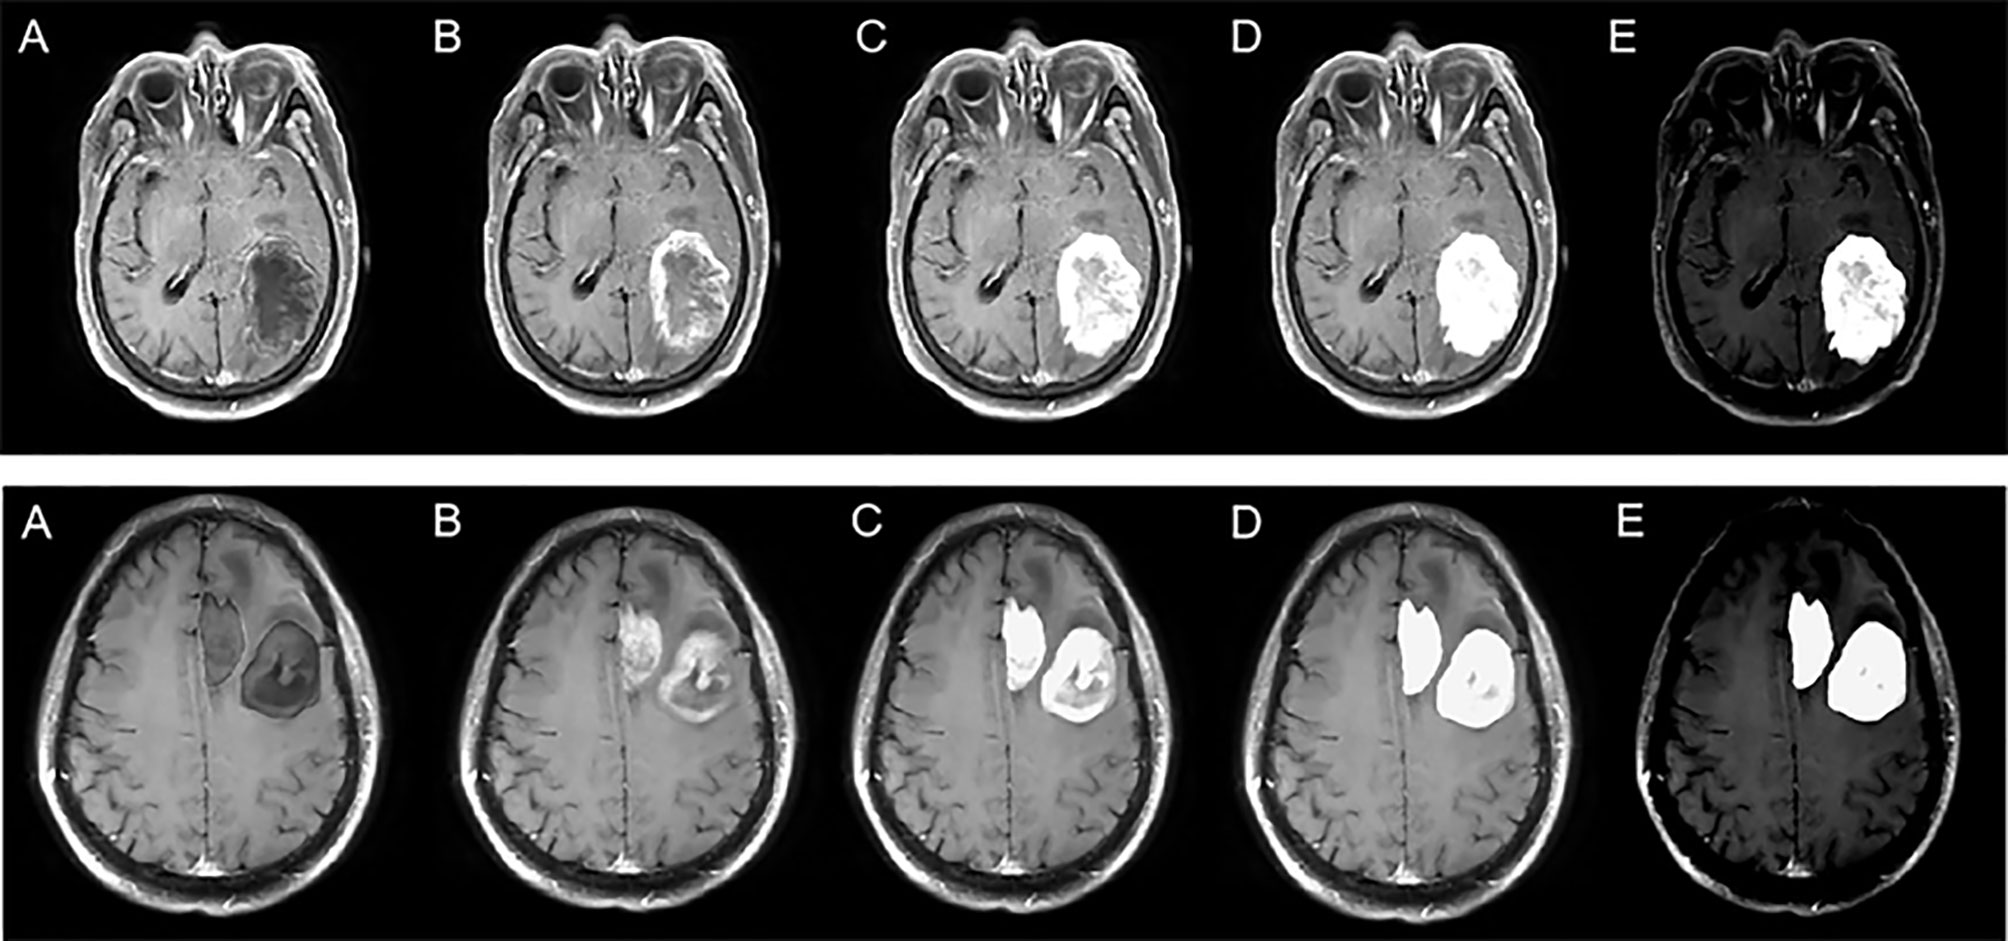
Figure 2 Enhanced data with different k values. The top row represents solitary figures, and the bottom row represents multiple lesions. k is −0.5 (A), 0 (B), 0.5 (C), 1 (D), and 2 (E).
In the third stage, the enhanced data were preprocessed similar to the first stage. The Resnet18 (19) was trained and tested by the preprocessed images to identify GBM, PCNSL, and TDL.
In addition, identification using the lesion area was considered one of the comparative experiments. The mask segmented by the automatic segmentation network was multiplied with the original MR image so that the surrounding area of the original MR image was removed and only the lesion area was retained. Resnet18 was used for identification of the lesion area. The flow chart of a comparative experiment is shown in Figure 3.
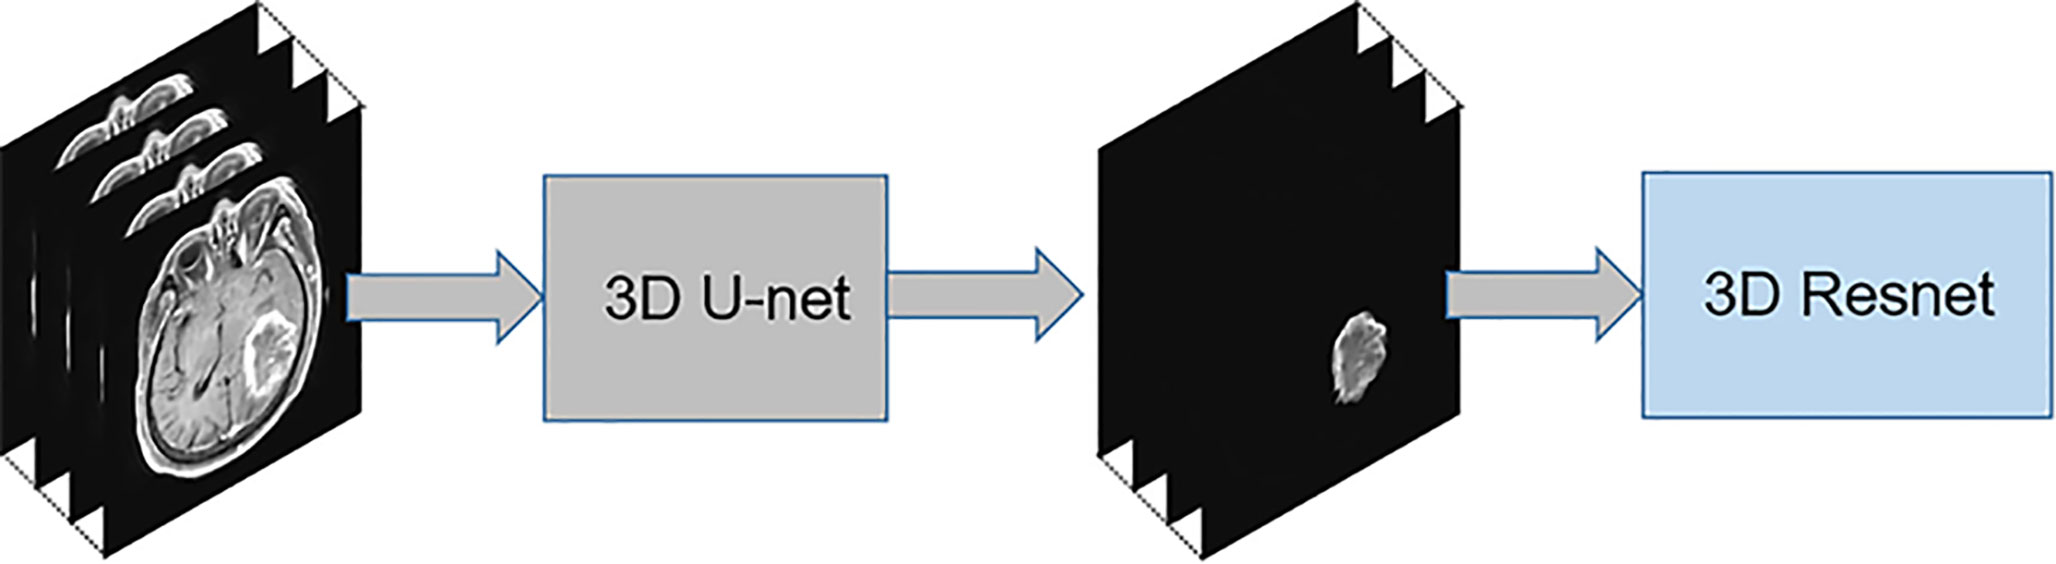
Figure 3 The implementation process of the lesion area diagnosis algorithm.
The AUC, accuracy, sensitivity, and specificity were calculated according to the output of the classification network. When ROC curves were plotted, one disease was considered positive and the other two were considered negative.
Patients with TDL were the youngest. Those with GBM had the highest ratio of solitary lesions (85.6%, 83/97) (Table 1).
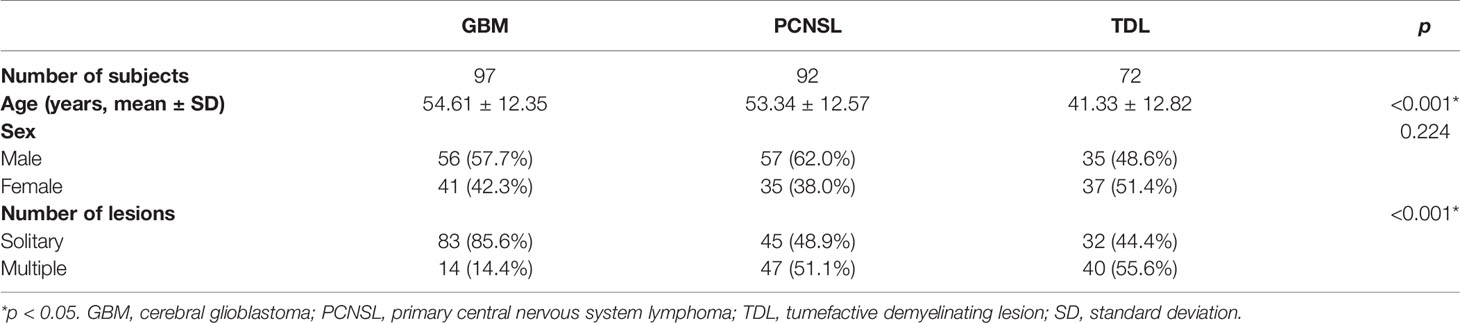
Table 1 Clinical characteristics of subjects.
The AUC (95% confidence interval [CI]), accuracy, sensitivity, specificity, and overall accuracy are presented in Tables 2 and 3. The ROC curves are shown in Figure 4. When k was 0.5, the diagnostic performance was the best, and the overall accuracy was 92.4%. The AUC (95% CI) of GBM, PCNSL, and TDL were 1.00 (1.000–1.000), 0.96 (0.923–1.000), and 0.95 (0.904–1.000), respectively. The selected radiomics features of GBM, PCNSL, and TDL at the optimal k value are shown in Figure 5. The overall diagnostic performances of the two neuroradiologists were 52.4%.
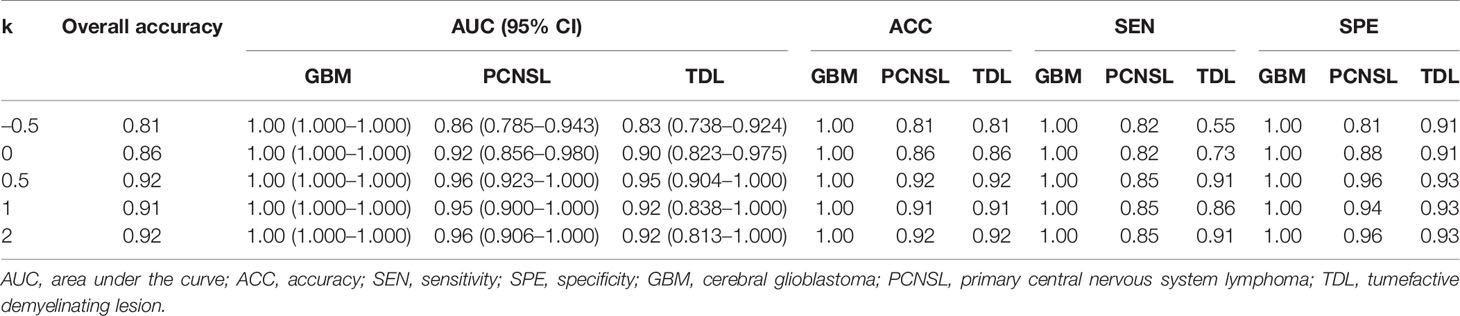
Table 2 Diagnostic performance at different k values.
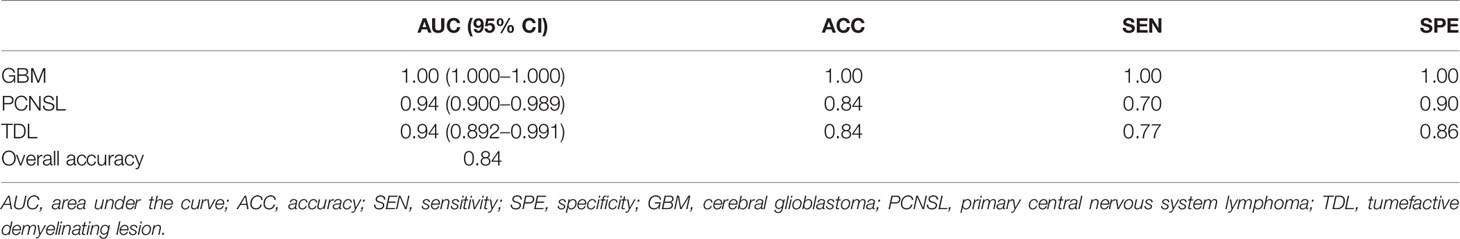
Table 3 Diagnostic performance of the model using the lesion area.
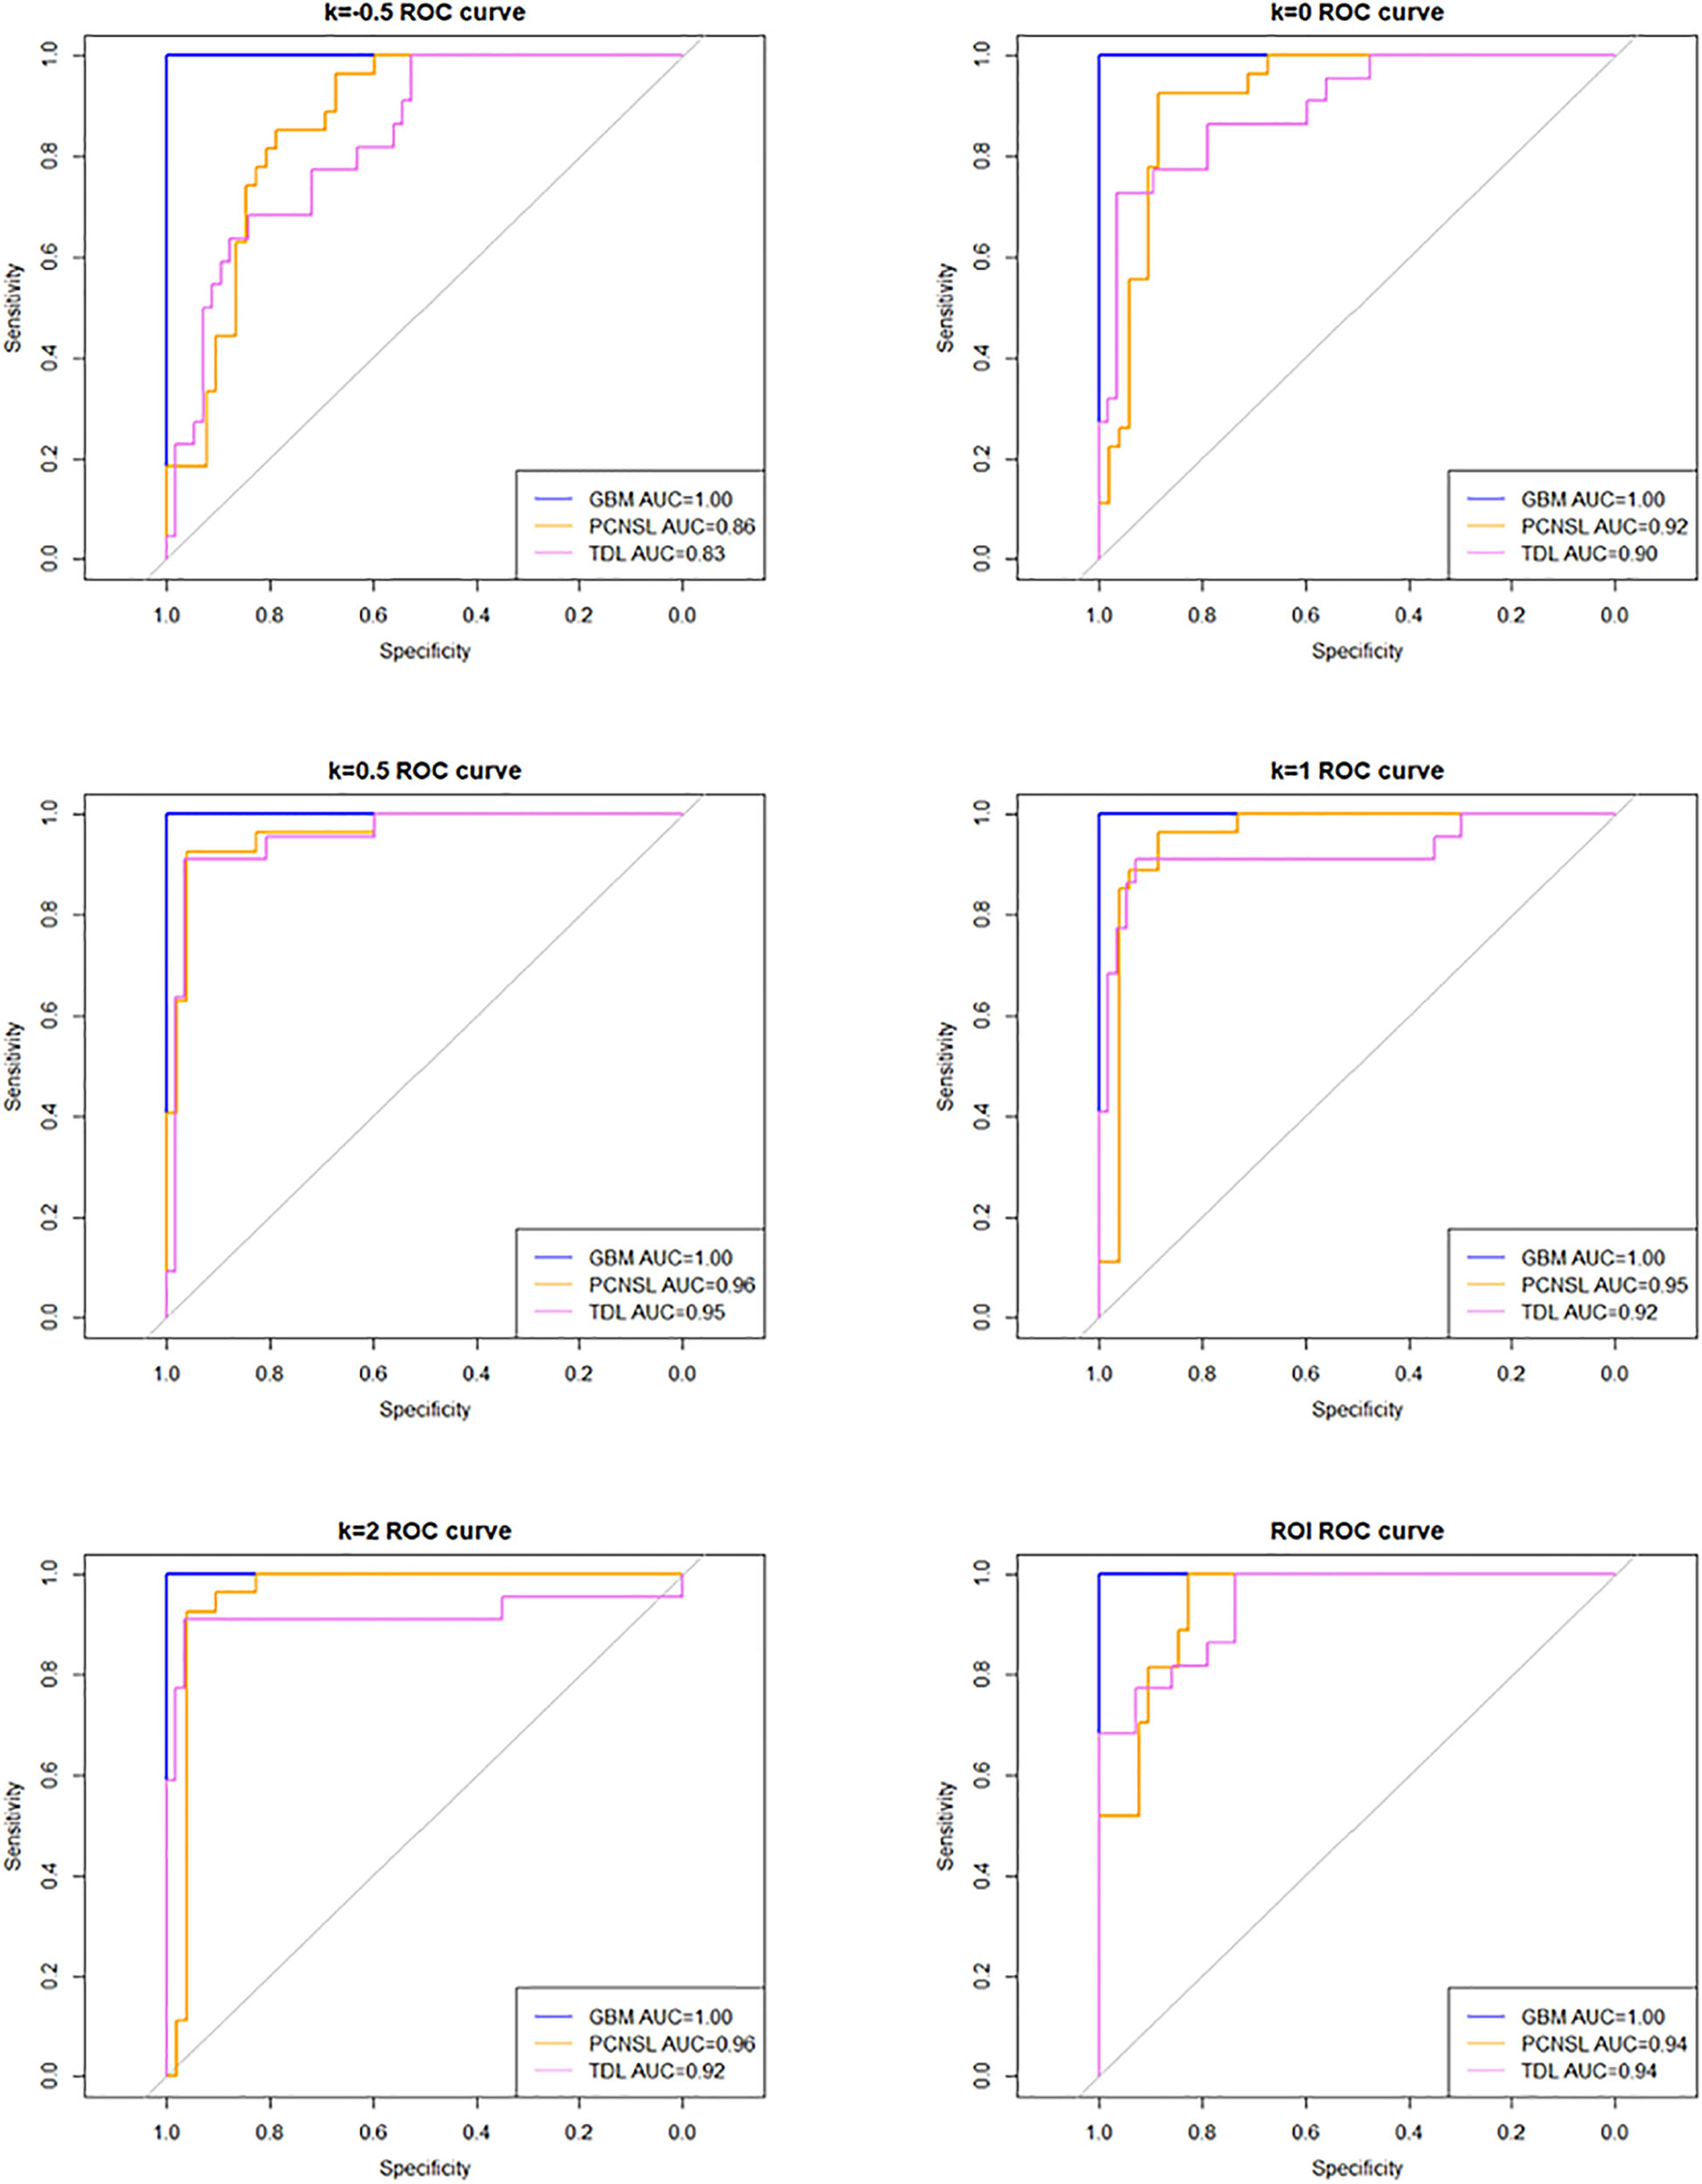
Figure 4 Receiver operating characteristic (ROC) curve at different k values and region of interest (ROI).
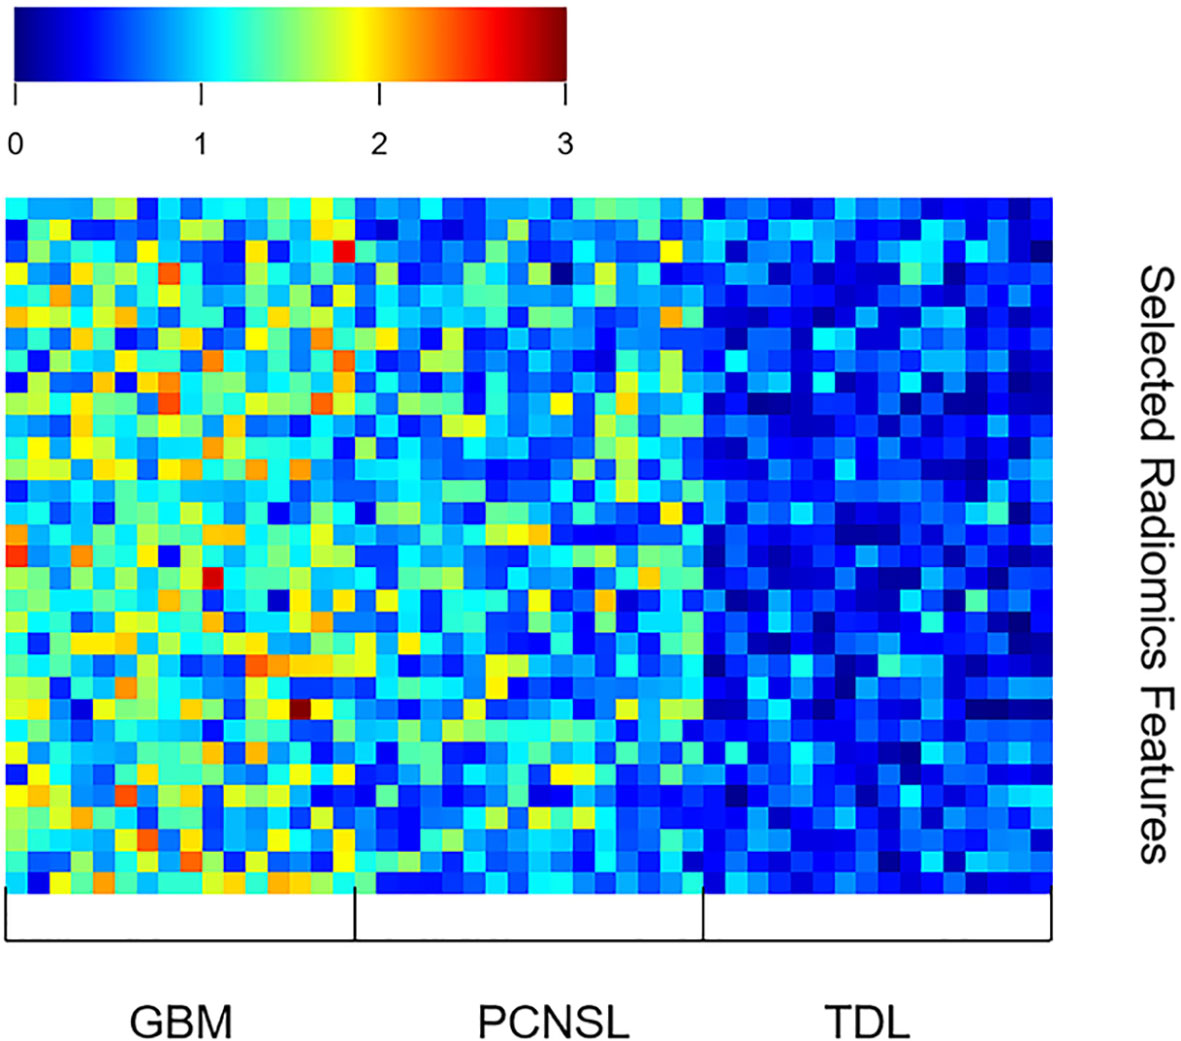
Figure 5 The selected radiomics features of GBM, PCNSL, and TDL at the optimal k value.
In our study, GBM and PCNSL were found more in male than female patients, while TDL was found more in female than male patients. This observation was in accordance with previous studies (7, 20). The mean age of patients with these three types of lesions was between 40 and 50 years in our subjects, consistent with some previous reports (7, 20, 21). Regarding the number of lesions, solitary GBM was found in 85.6% (83/97) patients, similar to that reported by Kapoor et al. (6). The ratio of multifocal PCNSL and TDL lesions was slightly higher than that of non-focal lesions, inconsistent with some previous reports (7, 22). This discrepancy may be due to the different case selection criteria among studies.
In this study, we aimed to simultaneously differentiate among three types of lesions. This is different from existing similar studies that only differentiated between two types of lesions. For example, GBM was differentiated from PCNSL by using different MRI modalities (23, 24), machine learning applications (25), and radiomics approach (26); GBM was differentiated from TDL by using methionine positron emission tomography (PET) (27); and PCNSL was differentiated from TDL by using different MRI modalities (28, 29). Moreover, these differential studies between two kinds of entities only focused on solitary lesion. Multiple PCNSL was differentiated from multifocal gliomas by using PET (30). However, the differentiation was also being performed between two types of lesions. To our knowledge, our study is the first to simultaneously differentiate the three entities with solitary and multifocal types by radiomics analysis.
Our study showed that a deep learning algorithm with data enhancement could accurately differentiate among solitary and multifocal GBM, PCNSL, and TDL. This method has two advantages. First, an automatic segmentation network was designed for the lesion region. The neural network can improve focus to the lesion area by enhancing it; this significantly improves the overall diagnostic performance of the neural network for GBM, PCNSL, and TDL. The performance of the model rises first and then falls with the increase in the ratio of lesion area to non-lesion area, and there is an optimal ratio. This means that both the focus area and the non-focus area contain information that can be used for diagnosis. When the ratio is appropriate, the neural network can maximize the information in the two areas for the identification of three lesions. Second, the data were transformed into 3D data, and 3D u-net and 3D Resnet were used for image segmentation and classification, respectively. 3D data have better diagnostic performance than 2D data and 2D networks. The consumption of computing resources is reduced by dividing the training into three stages.
Our study had several limitations. First, although we tried to minimize it, there may be some selection bias owing to the retrospective nature of the study. Second, our training process was not end-to-end, and while this saves computing resources, this makes it more challenging for non-professionals to use this diagnostic method. Although we tried to use the end-to-end network for training, the existing data could not support training several times larger than the existing model to achieve better diagnostic performance. Therefore, more data need to be collected to support end-to-end networks. Third, this experiment only studied the differentiation of three radiologically similar lesions; neuroradiologists may consider additional diseases when making a diagnosis. The existing supervised machine learning and deep learning methods can only diagnose the disease as one of the training set labels, and ignore other possible diseases. If the subject is not one of the training set labels, there is no possibility of being diagnosed correctly. Fourth, no external validation was performed. Last, only single-mode MRI data were used in this study. Inclusion of multimodal data will provide more diagnostic information and is one of the important ways to improve diagnostic performance. However, the single-model data reduce the difficulty of data collection, which makes our method more easily applicable to other diagnosis processes than other methods. Therefore, our method showed good performance in diagnostic accuracy and can provide a feasible reference for the identification of other diseases.
Deep learning with data enhancement is useful for the identification of GBM, PCNSL, and TDL, and its diagnostic performance is better than that of neuroradiologists.
The raw data supporting the conclusions of this article will be made available by the authors, without undue reservation.
The studies involving human participants were reviewed and approved by the Department of Radiology, Beijing Tiantan Hospital, Capital Medical University. Written informed consent for participation was not required for this study in accordance with the national legislation and the institutional requirements.
XC and XM designed the original research. YZ, KL, JH, HM, HC, FZ, and LZ conducted the research. KL analyzed the data. YZ and KL wrote the manuscript. XC, XM, and XW revised the paper. All authors contributed to the article and approved the submitted version.
This work is supported by the National Key Research and Development Program of China Grant under grant (Nos. 2018YFC0115604, 2016YFA0100900, 2016YFA0100902); the National Natural Science Foundation of China under grant (Nos. 81772005, 82090051, 81871442); Collaborative innovative major special project supported by Beijing Municipal Science & Technology Commission (Z191100006619088); the Youth Innovation Promotion Association CAS (Y201930); and Shandong Province Natural Science Foundation (ZR2020KF016).
The authors declare that the research was conducted in the absence of any commercial or financial relationships that could be construed as a potential conflict of interest.
All claims expressed in this article are solely those of the authors and do not necessarily represent those of their affiliated organizations, or those of the publisher, the editors and the reviewers. Any product that may be evaluated in this article, or claim that may be made by its manufacturer, is not guaranteed or endorsed by the publisher.
The Supplementary Material for this article can be found online at: https://www.frontiersin.org/articles/10.3389/fonc.2021.665891/full#supplementary-material
1. Linhares P, Carvalho B, Vaz R, Costa BM. Glioblastoma: Is There Any Blood Biomarker With True Clinical Relevance? Int J Mol Sci (2020) 21(16):5809. doi: 10.3390/ijms21165809
2. de Melo SM, Marta GN, Yan M, Cruz C, Moraes FY, Riera R. Management of Elderly Patients With Glioblastoma: Current Status With a Focus on the Post-Operative Radiation Therapy. Ann Palliat Med (2020) 9(5):3553–61. doi: 10.21037/apm-20-768
3. Grommes C, Rubenstein JL, DeAngelis LM, Ferreri AJM, Batchelor TT. Comprehensive Approach to Diagnosis and Treatment of Newly Diagnosed Primary CNS Lymphoma. Neuro Oncol (2019) 21(3):296–305. doi: 10.1093/neuonc/noy192
4. Sánchez P, Meca-Lallana V, Barbosa A, Manzanares R, Palmí I, Vivancos J. Tumefactive Demyelinating Lesions of 15 Patients: Clinico-Radiological Features, Management and Review of the Literature. J Neurol Sci (2017) 381:32–8. doi: 10.1016/j.jns.2017.08.005
5. Li Y, Zhang ZX, Huang GH, Xiang Y, Yang L, Pei YC. A Systematic Review of Multifocal and Multicentric Glioblastoma. J Clin Neurosci (2021) 83:71–6. doi: 10.1016/j.jocn.2020.11.025
6. Kapoor A, Mohindra S, Singla N, Sodhi HB, Chatterjee D, Gupta SK. Multiple Glioblastoma: A Diagnostic Challenge and Controversies in Management. Neurol India (2015) 63(3):449–52. doi: 10.4103/0028-3886.158267
7. Partovi S, Karimi S, JK L, Esmaeili A, Tan J, Deangelis LM. Multimodality Imaging of Primary CNS Lymphoma in Immunocompetent Patients. Br J Radiol (2014) 87(1036):20130684. doi: 10.1259/bjr.20130684
8. Smirniotopoulos JG, Murphy FM, Rushing EJ, Rees JH, Schroeder JW. Patterns of Contrast Enhancement in the Brain and Meninges. Radiographics (2007) 27(2):525–51. doi: 10.1148/rg.272065155
9. Suh CH, Kim HS, Jung SC, Park JE, Choi CG, Kim SJ. MRI as a Diagnostic Biomarker for Differentiating Primary Central Nervous System Lymphoma From Glioblastoma: A Systematic Review and Meta-Analysis. J Magn Reson Imaging (2019) 50(2):560–72. doi: 10.1002/jmri.26602
10. Wen JB, Huang WY, Xu WX, Wu G, Geng DY, Yin B. Differentiating Primary Central Nervous System Lymphomas From Glioblastomas and Inflammatory Demyelinating Pseudotumor Using Relative Minimum Apparent Diffusion Coefficients. J Comput Assist Tomogr (2017) 41(6):904–9. doi: 10.1097/RCT.0000000000000636
11. Brandão LA, Castillo M. Adult Brain Tumors: Clinical Applications of Magnetic Resonance Spectroscopy. Magn Reson Imaging Clin N Am (2016) 24(4):781–809. doi: 10.1016/j.mric.2016.07.005
12. Gao Y, Xiao X, Han B, Li G, Ning X, Wang D, et al. Deep Learning Methodology for Differentiating Glioma Recurrence From Radiation Necrosis Using Multimodal Magnetic Resonance Imaging: Algorithm Development and Validation. JMIR Med Inform (2020) 8(11):e19805. doi: 10.2196/19805
13. Zhu Y, Man C, Gong L, Dong D, Yu X, Wang S, et al. A Deep Learning Radiomics Model for Preoperative Grading in Meningioma. Eur J Radiol (2019) 116:128–34. doi: 10.1016/j.ejrad.2019.04.022
14. Qian Z, Li Y, Wang Y, Li L, Li R, Wang K, et al. Differentiation of Glioblastoma From Solitary Brain Metastases Using Radiomic Machine-Learning Classifiers. Cancer Lett (2019) 451:128–35. doi: 10.1016/j.canlet.2019.02.054
15. Zali A, Shahzadi S, Mohammad-Mohammadi A, Taherzadeh K, Parsa K. Cerebral Lymphoma: Clinical and Radiological Findings in 90 Cases. Arch Iran Med (2007) 10(2):194–8. doi: 10.07102/AIM.0013
16. Kim DS, Na DG, Kim KH, Kim JH, Kim E, Yun BL, et al. Distinguishing Tumefactive Demyelinating Lesions From Glioma or Central Nervous System Lymphoma: Added Value of Unenhanced CT Compared With Conventional Contrast-Enhanced MR Imaging. Radiology (2009) 251(2):467–75. doi: 10.1148/radiol.2512072071
17. Brod SA, Lindsey JW, Nelson F. Tumefactive Demyelination: Clinical Outcomes, Lesion Evolution and Treatments. Mult Scler J Exp Transl Clin (2019) 5(2):2055217319855755. doi: 10.1177/2055217319855755
18. Milletari F, Navab N, Ahmadi S. V-Net: Fully Convolutional Neural Networks for Volumetric Medical Image Segmentation. In: 2016 Fourth International Conference on 3D Vision (3dv). Stanford, USA: IEEE (2016).
19. He K, Zhang X, Ren S, Sun J. Deep Residual Learning for Image Recognition. In: 2016 IEEE Conference on Computer Vision and Pattern Recognition (CVPR). Las Vegas, USA: IEEE (2016).
20. Suh CH, Kim HS, Jung SC, Choi CG, Kim SJ. MRI Findings in Tumefactive Demyelinating Lesions: A Systematic Review and Meta-Analysis. AJNR Am J Neuroradiol (2018) 39(9):1643–9. doi: 10.3174/ajnr.A5775
21. Kanderi T, Gupta V. Glioblastoma Multiforme. In: StatPearls. Treasure Island (FL): StatPearls Publishing (2020).
22. Lucchinetti CF, Gavrilova RH, Metz I, Parisi JE, Scheithauer BW, Weigand S, et al. Clinical and Radiographic Spectrum of Pathologically Confirmed Tumefactive Multiple Sclerosis. Brain (2008) 131(7):1759–75. doi: 10.1093/brain/awn098
23. Saini J, Kumar Gupta P, Awasthi A, Pandey CM, Singh A, Patir R, et al. Multiparametric Imaging-Based Differentiation of Lymphoma and Glioblastoma: Using T1-Perfusion, Diffusion, and Susceptibility-Weighted MRI. Clin Radiol (2018) 73(11):986.e7–15. doi: 10.1016/j.crad.2018.07.107
24. You SH, Yun TJ, Choi HJ, Yoo RE, Kang KM, Choi SH, et al. Differentiation Between Primary CNS Lymphoma and Glioblastoma: Qualitative and Quantitative Analysis Using Arterial Spin Labeling MR Imaging. Eur Radiol (2018) 28(9):3801–10. doi: 10.1007/s00330-018-5359-5
25. Nguyen AV, Blears EE, Ross E, Lall RR, Ortega-Barnett J. Machine Learning Applications for the Differentiation of Primary Central Nervous System Lymphoma From Glioblastoma on Imaging: A Systematic Review and Meta-Analysis. Neurosurg Focus (2018) 45(5):E5. doi: 10.3171/2018.8.FOCUS18325
26. Suh HB, Choi YS, Bae S, Ahn SS, Chang JH, Kang SG, et al. Primary Central Nervous System Lymphoma and Atypical Glioblastoma: Differentiation Using Radiomics Approach. Eur Radiol (2018) 28(9):3832–9. doi: 10.1007/s00330-018-5368-4
27. Yasuda S, Yano H, Kimura A, Suzui N, Nakayama N, Shinoda J, et al. Frontal Tumefactive Demyelinating Lesion Mimicking Glioblastoma Differentiated by Methionine Positron Emission Tomography. World Neurosurg (2018) 119:244–8. doi: 10.1016/j.wneu.2018.08.027
28. Mabray MC, Cohen BA, Villanueva-Meyer JE, Valles FE, Barajas RF, Rubenstein JL, et al. Performance of Apparent Diffusion Coefficient Values and Conventional MRI Features in Differentiating Tumefactive Demyelinating Lesions From Primary Brain Neoplasms. AJR Am J Roentgenol (2015) 205(5):1075–85. doi: 10.2214/AJR.14.13970
29. Lu SS, Kim SJ, Kim N, Kim HS, Choi CG, Lim YM. Histogram Analysis of Apparent Diffusion Coefficient Maps of Differentiating Primary CNS Lymphomas From Tumefactive Demyelinating Lesion. AJR Am J Roentgenol (2015) 204(4):827–34. doi: 10.2214/AJR.14.12677
Keywords: glioblastoma, lymphoma, tumefactive demyelination, differential diagnosis, deep learning
Citation: Zhang Y, Liang K, He J, Ma H, Chen H, Zheng F, Zhang L, Wang X, Ma X and Chen X (2021) Deep Learning With Data Enhancement for the Differentiation of Solitary and Multiple Cerebral Glioblastoma, Lymphoma, and Tumefactive Demyelinating Lesion. Front. Oncol. 11:665891. doi: 10.3389/fonc.2021.665891
Received: 09 February 2021; Accepted: 29 July 2021;
Published: 18 August 2021.
Edited by:
Xuejun Li, Central South University, ChinaReviewed by:
Xavier Ayrignac, Université de Montpellier, FranceCopyright © 2021 Zhang, Liang, He, Ma, Chen, Zheng, Zhang, Wang, Ma and Chen. This is an open-access article distributed under the terms of the Creative Commons Attribution License (CC BY). The use, distribution or reproduction in other forums is permitted, provided the original author(s) and the copyright owner(s) are credited and that the original publication in this journal is cited, in accordance with accepted academic practice. No use, distribution or reproduction is permitted which does not comply with these terms.
*Correspondence: Xinsheng Wang, eHN3YW5nQGhpdC5lZHUuY24=; Xibo Ma, eGliby5tYUBpYS5hYy5jbg==; Xuzhu Chen, cmFkaW9sb2d5ODg4QGFsaXl1bi5jb20=
†These authors have contributed equally to this work
Disclaimer: All claims expressed in this article are solely those of the authors and do not necessarily represent those of their affiliated organizations, or those of the publisher, the editors and the reviewers. Any product that may be evaluated in this article or claim that may be made by its manufacturer is not guaranteed or endorsed by the publisher.
Research integrity at Frontiers
Learn more about the work of our research integrity team to safeguard the quality of each article we publish.