
94% of researchers rate our articles as excellent or good
Learn more about the work of our research integrity team to safeguard the quality of each article we publish.
Find out more
ORIGINAL RESEARCH article
Front. Oncol., 02 September 2021
Sec. Hematologic Malignancies
Volume 11 - 2021 | https://doi.org/10.3389/fonc.2021.661102
 Irene Bagaloni1†
 Axel Visani2†
 Sara Biagiotti1
 Annamaria Ruzzo1
 Mohsen Navari3,4,5Maryam Etebari2,6
 Lucia Mundo7,8Massimo Granai7,9
 Stefano Lazzi7Alessandro Isidori10
 Federica Loscocco10Jiejin Li11Lorenzo Leoncini7Giuseppe Visani10*
 Mauro Magnani1‡
 Pier Paolo Piccaluga2,11,12,13*‡
Altered cellular energetic metabolism has recently emerged as important feature of neoplastic cells. Indeed, interfering with cancer cell metabolism might represent a suitable therapeutic strategy. In this study, we aimed to assess glucose metabolism activation in human lymphomas and evaluate how metformin can exert its action on lymphoma cells. We studied a large series of human lymphomas (N = 252) and an in vitro model of Burkitt lymphoma (BL) cells. We combined molecular biology techniques, including global gene expression profiling (GEP) analysis, quantitative PCR (qPCR) and Western blotting, and biochemical assays, aimed to assess pentose phosphate pathway, tricarboxylic acid (TCA) cycle, and aerobic glycolysis rates. We found that glucose metabolism is overall enhanced in most lymphoma subtypes, based on gene expression profiling (GEP), with general shift to aerobic glycolysis. By contrast, normal B cells only showed an overall increase in glucose usage during germinal center transition. Interestingly, not only highly proliferating aggressive lymphomas but also indolent ones, like marginal zone lymphomas, showed the phenomenon. Consistently, genes involved in glycolysis were confirmed to be overexpressed in BL cells by qPCR. Biochemical assays showed that while aerobic glycolysis is increased, TCA cycle is reduced. Finally, we showed that metformin can induce cell death in BL cells by stressing cellular metabolism through the induction of GLUT1, PKM2, and LDHA. In conclusion, we unveiled glucose metabolism abnormalities in human lymphomas and characterized the mechanism of action of metformin in Burkitt lymphoma model.
Altered cellular energetic metabolism is emerging as one of the most important hallmarks of malignantly transformed cells. Tumor cells are subjected to several changes in metabolic pathways, among which the shift from oxidative phosphorylation to lactate fermentation, known as Warburg effect, plays a key role. In fact, normal cells convert glucose into carbonic anhydride under aerobic conditions through oxidative phosphorylation. On the contrary, cancer cells mainly produce lactate, even in the presence of sufficient levels of oxygen (1). Although aerobic glycolysis is less efficient in producing energy (2 ATP molecules instead of 36 from complete glucose oxidation), this apparent waste of glucose really constitutes a survival advantage in active proliferating cells because it makes them insensitive to transient or permanent hypoxic conditions. Moreover, lactate is not just a waste product of the process; actually, it promotes tumor invasion supporting cell migration, angiogenesis, immune escape, and radioresistance (2). The Warburg effect is still extremely relevant in the cancer research field because understanding the complex cancer energy metabolism will help to develop new approaches in early diagnosis and cancer therapy.
The biguanide metformin is the first-line therapy for type 2 diabetes (3). Retrospective studies of type 2 diabetes patients treated with metformin show a strong correlation between drug intake and reduced tumor incidence or reduced cancer-related deaths (4, 5). These findings supported the rationale of designing clinical trials using metformin as an adjuvant in chemotherapy for cancer patients (6, 7). Even if the mechanism of action of metformin is still partially unknown, and sometimes controversial, to date, two major effects of metformin have been described. The first is the inhibition of mitochondrial electron transport chain complex I (8). In fact, it has been described that metformin fuels glycolysis by impairing mitochondrial respiration through complex I inhibition, as a compensation mechanism. This limits the flux of glucose into the tricarboxylic acid (TCA) cycle that, in turn, limits acetyl-CoA levels necessary for lipid biosynthesis. Consequently, the highest concentration of pyruvate resulting from enhanced aerobic glycolysis is converted to lactate through lactate fermentation (9, 10). The second effect of metformin is the activation of AMP-activated protein kinase (AMPK), a key energy sensor in cells, which is able to switch cells from an anabolic/energy-consuming to a catabolic/energy-producing state, mimicking a condition of caloric restriction (11). Through a direct and AMPK-dependent activation of mammalian target of rapamycin (m-TOR), metformin can also induce a decrease in protein synthesis. Of note, the metabolic switch was also detected in AMPK-deficient cells indicating that the antiproliferative effect of metformin does not depend exclusively on AMPK. In fact, several AMPK-independent mechanisms have been described, underlining the pleiotropic effect of metformin in cancer (11). This study reports that metformin can exert its antineoplastic activity without activation of AMPK but rather by inhibiting downstream pathways, for example by preventing AKT phosphorylation, as reported in lung and breast cancers. In recent years, new effects of metformin, upstream AMPK activation, have been identified. For example, cell culture assay and molecular modeling studies indicated that metformin impairs, directly, glucose metabolism by inhibiting hexokinase II, the most expressed hexokinase in cancer cells, leading to its dissociation from mitochondria and activation of apoptotic signaling (11–13).
Clinical trials involving metformin as a therapy option for tumors are focusing predominantly on solid tumors such as breast, prostate, lung, and colon cancer. On the contrary, there are few evidence on the role of metformin in hematological malignancies (11). Scotland and colleagues reported that metformin elicits a reprogramming of intermediary metabolism leading to the inhibition of cell proliferation in leukemia cells (14). Recently, it has been reported that metformin induces autophagy and G0/G1 cell cycle arrest in multiple myeloma (15) and produces significant reduction in cell viability with associated alterations in oxidative phosphorylation and glycolysis in lymphoma cell lines (16).
Burkitt lymphoma (BL) is a rare, aggressive subtype of non-Hodgkin lymphoma. Despite the improvements in the diagnosis and management of the disease, treatment-related toxicity and limited therapeutic options for relapses remain a challenge in managing BL (17). Of note, although some particular aspects regarding BL metabolism have been addressed (18, 19), our overall knowledge is still very limited in this regard.
In this study, we attempt to highlight the metabolic switch induced by malignancy in B-cell-derived tumors cells and further elucidate the influence of metformin on cellular energetic metabolism in Burkitt lymphoma by performing in vivo gene expression profiles and in vitro biochemical and biomolecular analyses.
Two hundred fifty-two B-cell-derived malignancies and 25 samples of normal B-cell subpopulations were studied by gene expression profiling (GEP) analysis, including mantle cell lymphoma (MCL), chronic lymphocytic leukemia (CLL), follicular lymphoma (FL), diffuse large B-cell lymphoma, not otherwise specified (DLBCL/NOS), primary mediastinal large B-cell lymphoma (PMBCL), Burkitt lymphoma (BL), splenic marginal zone lymphoma (SMZL), plasma cell myeloma (PCM), classical Hodgkin lymphoma (cHL), and lymphocyte-predominant Hodgkin lymphoma (NLPHL) and also normal B-cell subpopulations including centroblasts (CB), centrocytes (CC), naive (N), memory cells (M), and plasma cells (PC) (20–23). Akata, Awia, Eli, Mutu, and DAUDI cell lines were also studied to verify their similarity to primary BL samples (24, 25). For more details, refer to Supplementary Material.
For proper comparison with our samples, gene expression values were adequately normalized (Supplementary Figure 1) and analyzed, as described (26–28). Briefly, the data were robust multiarray averaging (RMA) normalized and log2 transformed (29), and batch effect was removed using ComBat (30). Unsupervised [principal component analysis (PCA) and hierarchical clustering] and supervised clustering was conducted on the data (26–28). To perform the supervised gene expression analysis, ANOVA or t-test, with p ≤ 0.05 and fold change ≥2 were used; Benjamini–Hockeberg method was adopted for false discovery rate (FDR) correction (23). Gene Set Enrichment Analysis (GSEA) (27) was applied to establish which Broad Institute’s gene sets were significantly represented among different categories. We ended up with eight gene sets (Table 1) associated with glucose metabolism. See Supplementary Material for more details.
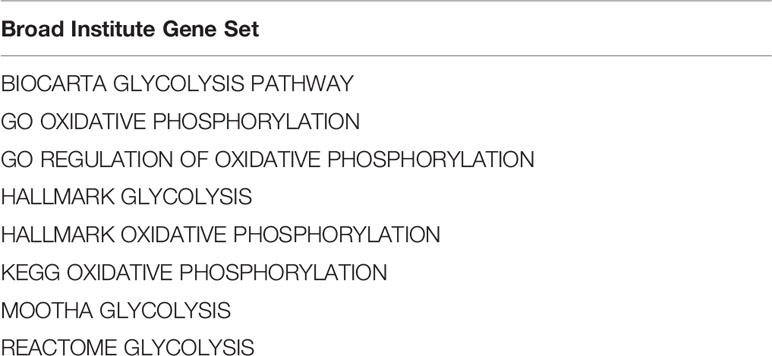
Table 1 Gene sets used to study glucose metabolism at gene expression level.
DAUDI (BL; ATCC Cat. No. CCL-213), AKATA (BL; kindly provided by Prof. Giulia De Falco, Queen Mary University of London), and RAJI (BL; Sigma-Aldrich. Cat No. 85011429-1VL) cell lines were first studied to assess the possible cytotoxic effect of metformin by MTS assay (Abcam, USA), following the manufacturer’s instructions. Based on the (overall similar) results, DAUDI cells were chosen for the following experiments, having an intermediate IC50 among the three cell lines.
DAUDI cells were treated with 10 mM metformin (Sigma, St. Louis, MO, USA) for 24 h, prior to RNA and protein extractions. Cellular viability was evaluated by an automated cell counter at 24, 48, and 72 h after drug treatment. Prior to the experiments, DAUDI cells were compared for the expression of the genes involved in glucose metabolism to other BL cell lines to verify their comparability to primary BL samples (Supplementary Figure 2). Peripheral blood lymphocytes (PBL) obtained from three normal healthy blood donors were used as controls as described for DAUDI cells. Since our first aim was to unveil the effects of metformin on primary human non-neoplastic lymphocytes, we chose PBL rather than primary germinal center cells since the isolation of the latter would by itself largely affect the metabolic profile. Furthermore, based on the initial GEP, aerobic glycolysis characterized the tumor and none of the normal B-cell subsets.
More details are provided in the Supplementary Material.
DAUDI and PBL cells treated or non-treated with metformin were subjected to rate determination of pentose phosphate pathway (PPP) and tricarboxylic acid cycle (TCA) rates using isotope tracer analyses ([1-C14]-glucose and [6-C144]-glucose), as described (31). Aerobic glycolysis rate was calculated based on lactate production. For more details, refer to the Supplementary Material.
After 24 h of treatment with 10 mM metformin, total RNA was extracted from DAUDI cells and PBL (as control), complementary DNA (cDNA) was obtained, and reverse transcription quantitative PCR (RT-qPCR) was performed to evaluate the messenger RNA (mRNA) expression levels of six genes involved in the various branches of glucose metabolism: glucose transporter 1 (GLUT-1), hexokinase-1 (HK1), hexokinase-2 (HK2), pyruvate kinase M2 (PKM2), lactate dehydrogenase A (LDHA), and voltage-dependent anion channel 1 (VDAC1), using beta-actin (ACTB) as housekeeping gene for normalization. The relative mRNA expression of the above genes was calculated by 1/2ΔCt method. See Supplementary Material for more details.
Western blots were performed on DAUDI cells and primary lymphocytes after 24 h of treatment with metformin at a concentration of 10 mM using monoclonal antibodies (mAb) anti-LDHA, anti-PKM, and anti-GLUT-1. Beta-actin mouse mAb was used as a loading control. Refer to the Supplementary Material for further details.
Statistical analyses of in vitro studies were performed with GraphPad Prism, version 8 (GraphPad Software, San Diego, CA, USA). Data are presented as means ± standard error or standard deviations of three or four independent experiments. Means for all data were compared by Wilcoxon test for paired samples and by Mann–Whitney U-test for unpaired samples. A p ≤ 0.05 was considered statistically significant.
First, we studied glucose metabolism in normal B-cell subsets. PCA, an unsupervised approach, indicated the existence of three main clusters, including GC, naive/memory (N/M), and PC, respectively. Particularly, while GC and N/M constituted two relatively homogeneous aggregates, PC samples were more dispersing, indicating a more heterogeneous gene expression pattern (Figure 1A). When naive and germinal center cells were compared, GC cells showed a significant enrichment in genes involved in both glycolysis and oxidative phosphorylation (Figures 1B, C). After germinal center transition, a reduction in glucose usage was still recorded; such reduction was particularly evident in plasma cells (Figure 1D), while it was not statistically significant in memory cells (data not shown).
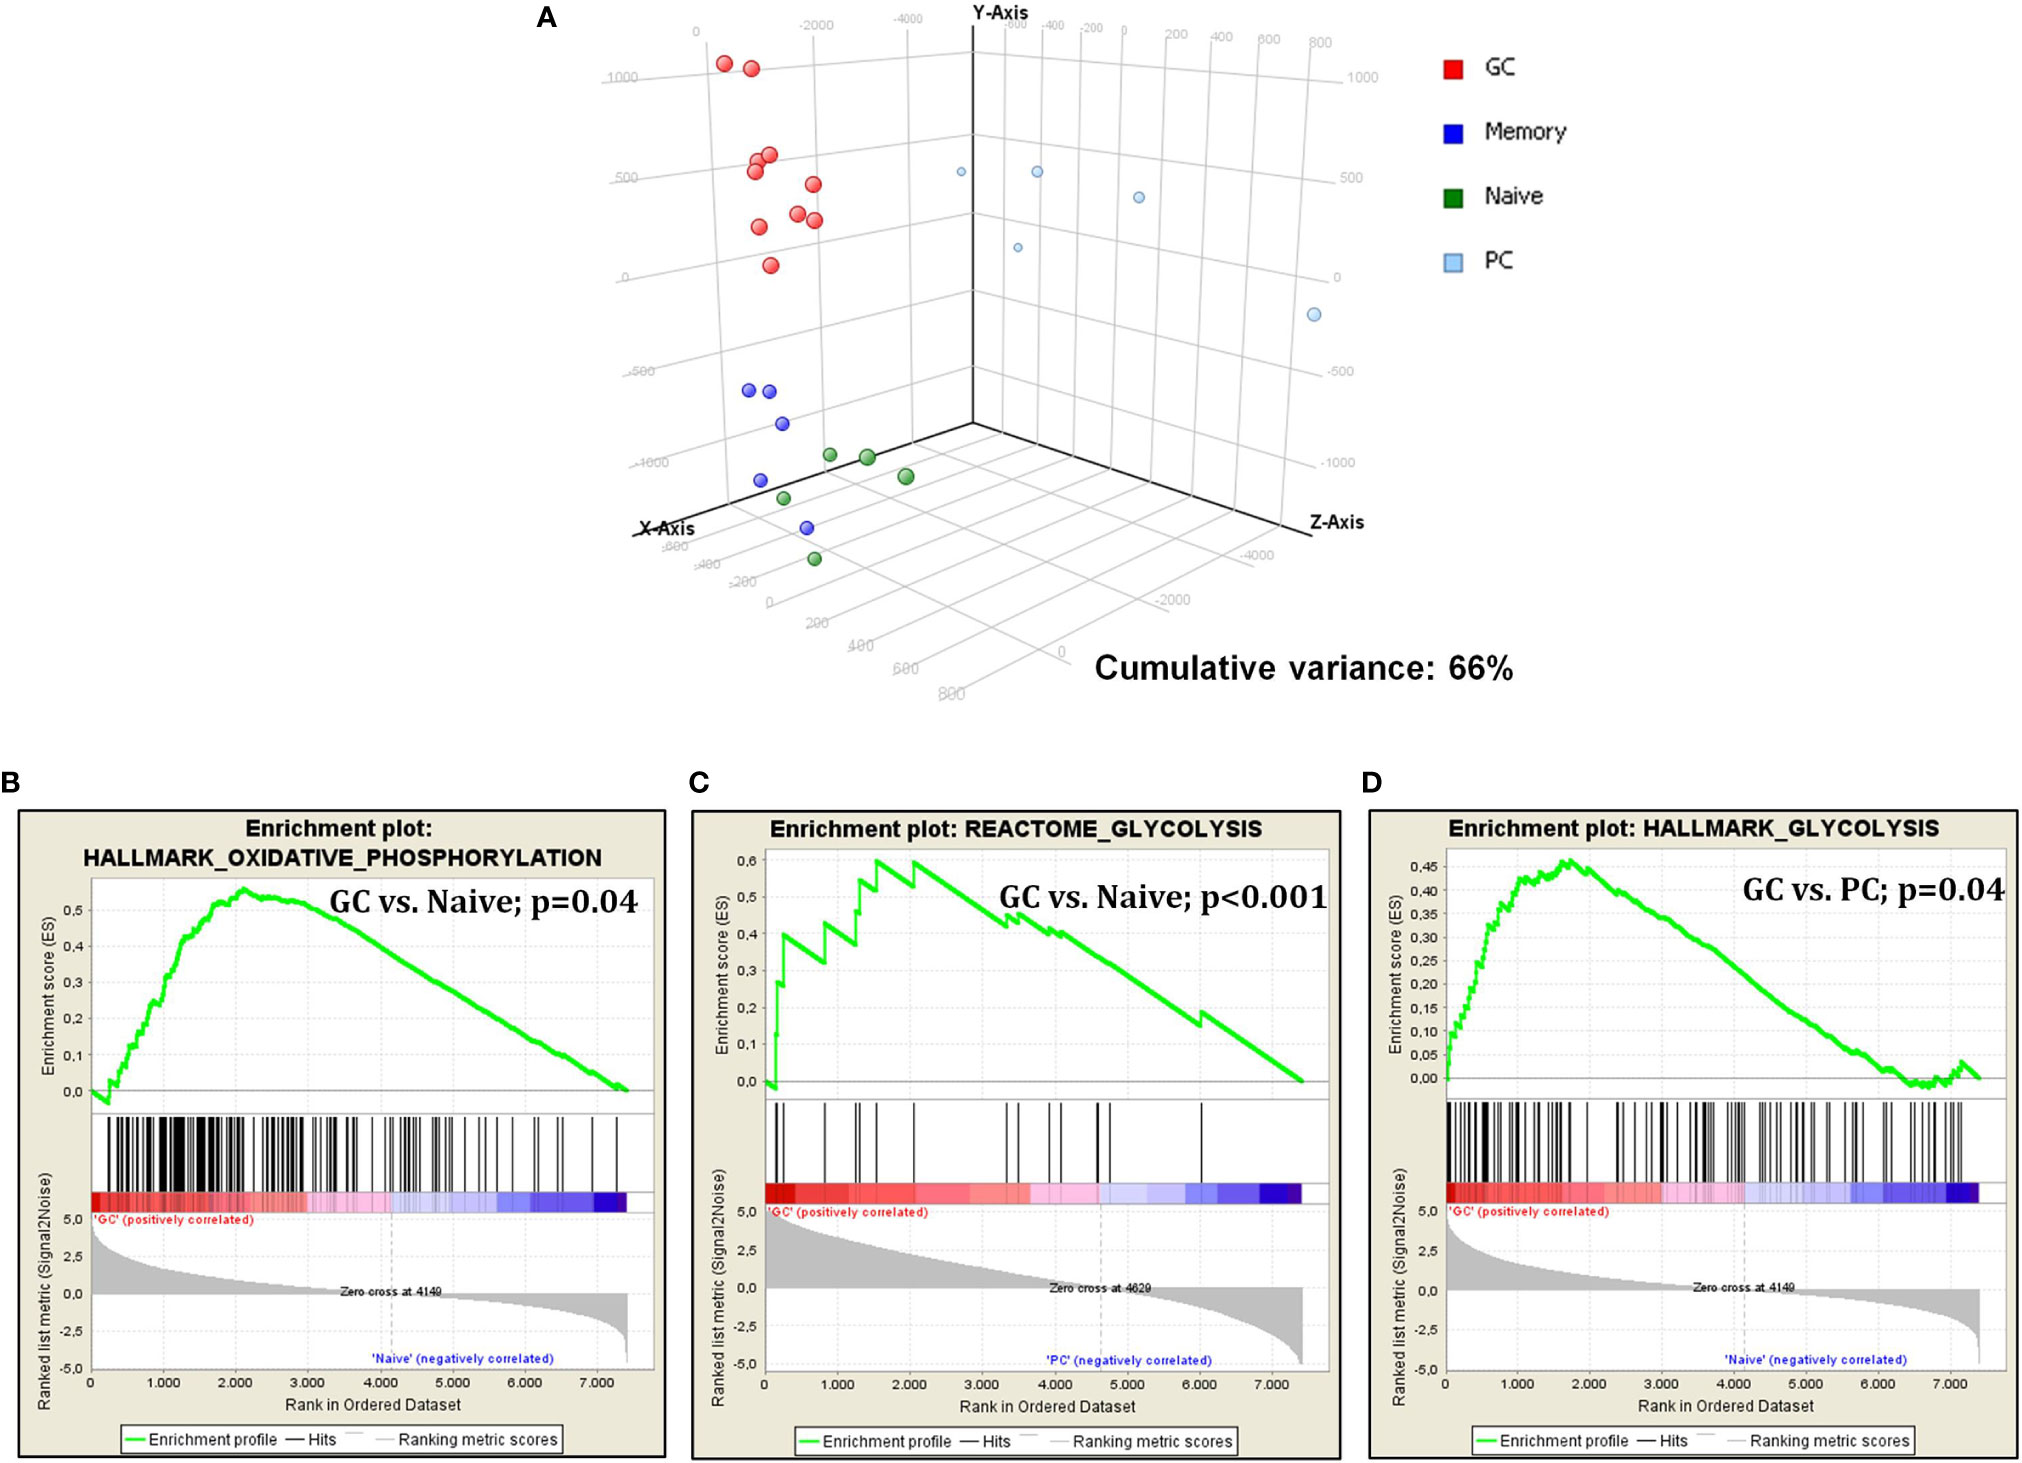
Figure 1 Glucose metabolism is modulated during germinal center transition. PCA on glucose metabolism associated genes showed a clear separation among normal B-cell subpopulations (A). GSEA showed increased expression of genes that are involved in both glycolysis and oxidative phosphorylation in GC cells vs. naive cells (B, C) and plasma cells (D).
We then investigated whether glucose-metabolism-related genes were differentially expressed in non-neoplastic B-cell populations and malignant lymphoma. Supervised analysis (t-test, p ≤ 0.05; fold change ≥2; Benjamini–Hockeberg FDR) showed that 41 genes (57 probe sets) were differentially expressed, 37 being upregulated in lymphomas and only 4 in normal cells (Supplementary Figure 3 and Supplementary Table 1).
However, when cases were clustered by principal component analysis (PCA), it was evident that different tumor types behaved differently. In fact, we observed four main clusters including (1) aggressive GC-derived lymphomas (DLBCL/NOS, PMBCL, and BL); (2) FL, SMZL, and naive, GC, and memory B cells; (3) MCL and CLL; and (4) Hodgkin lymphomas and plasma cells (Figure 2A).
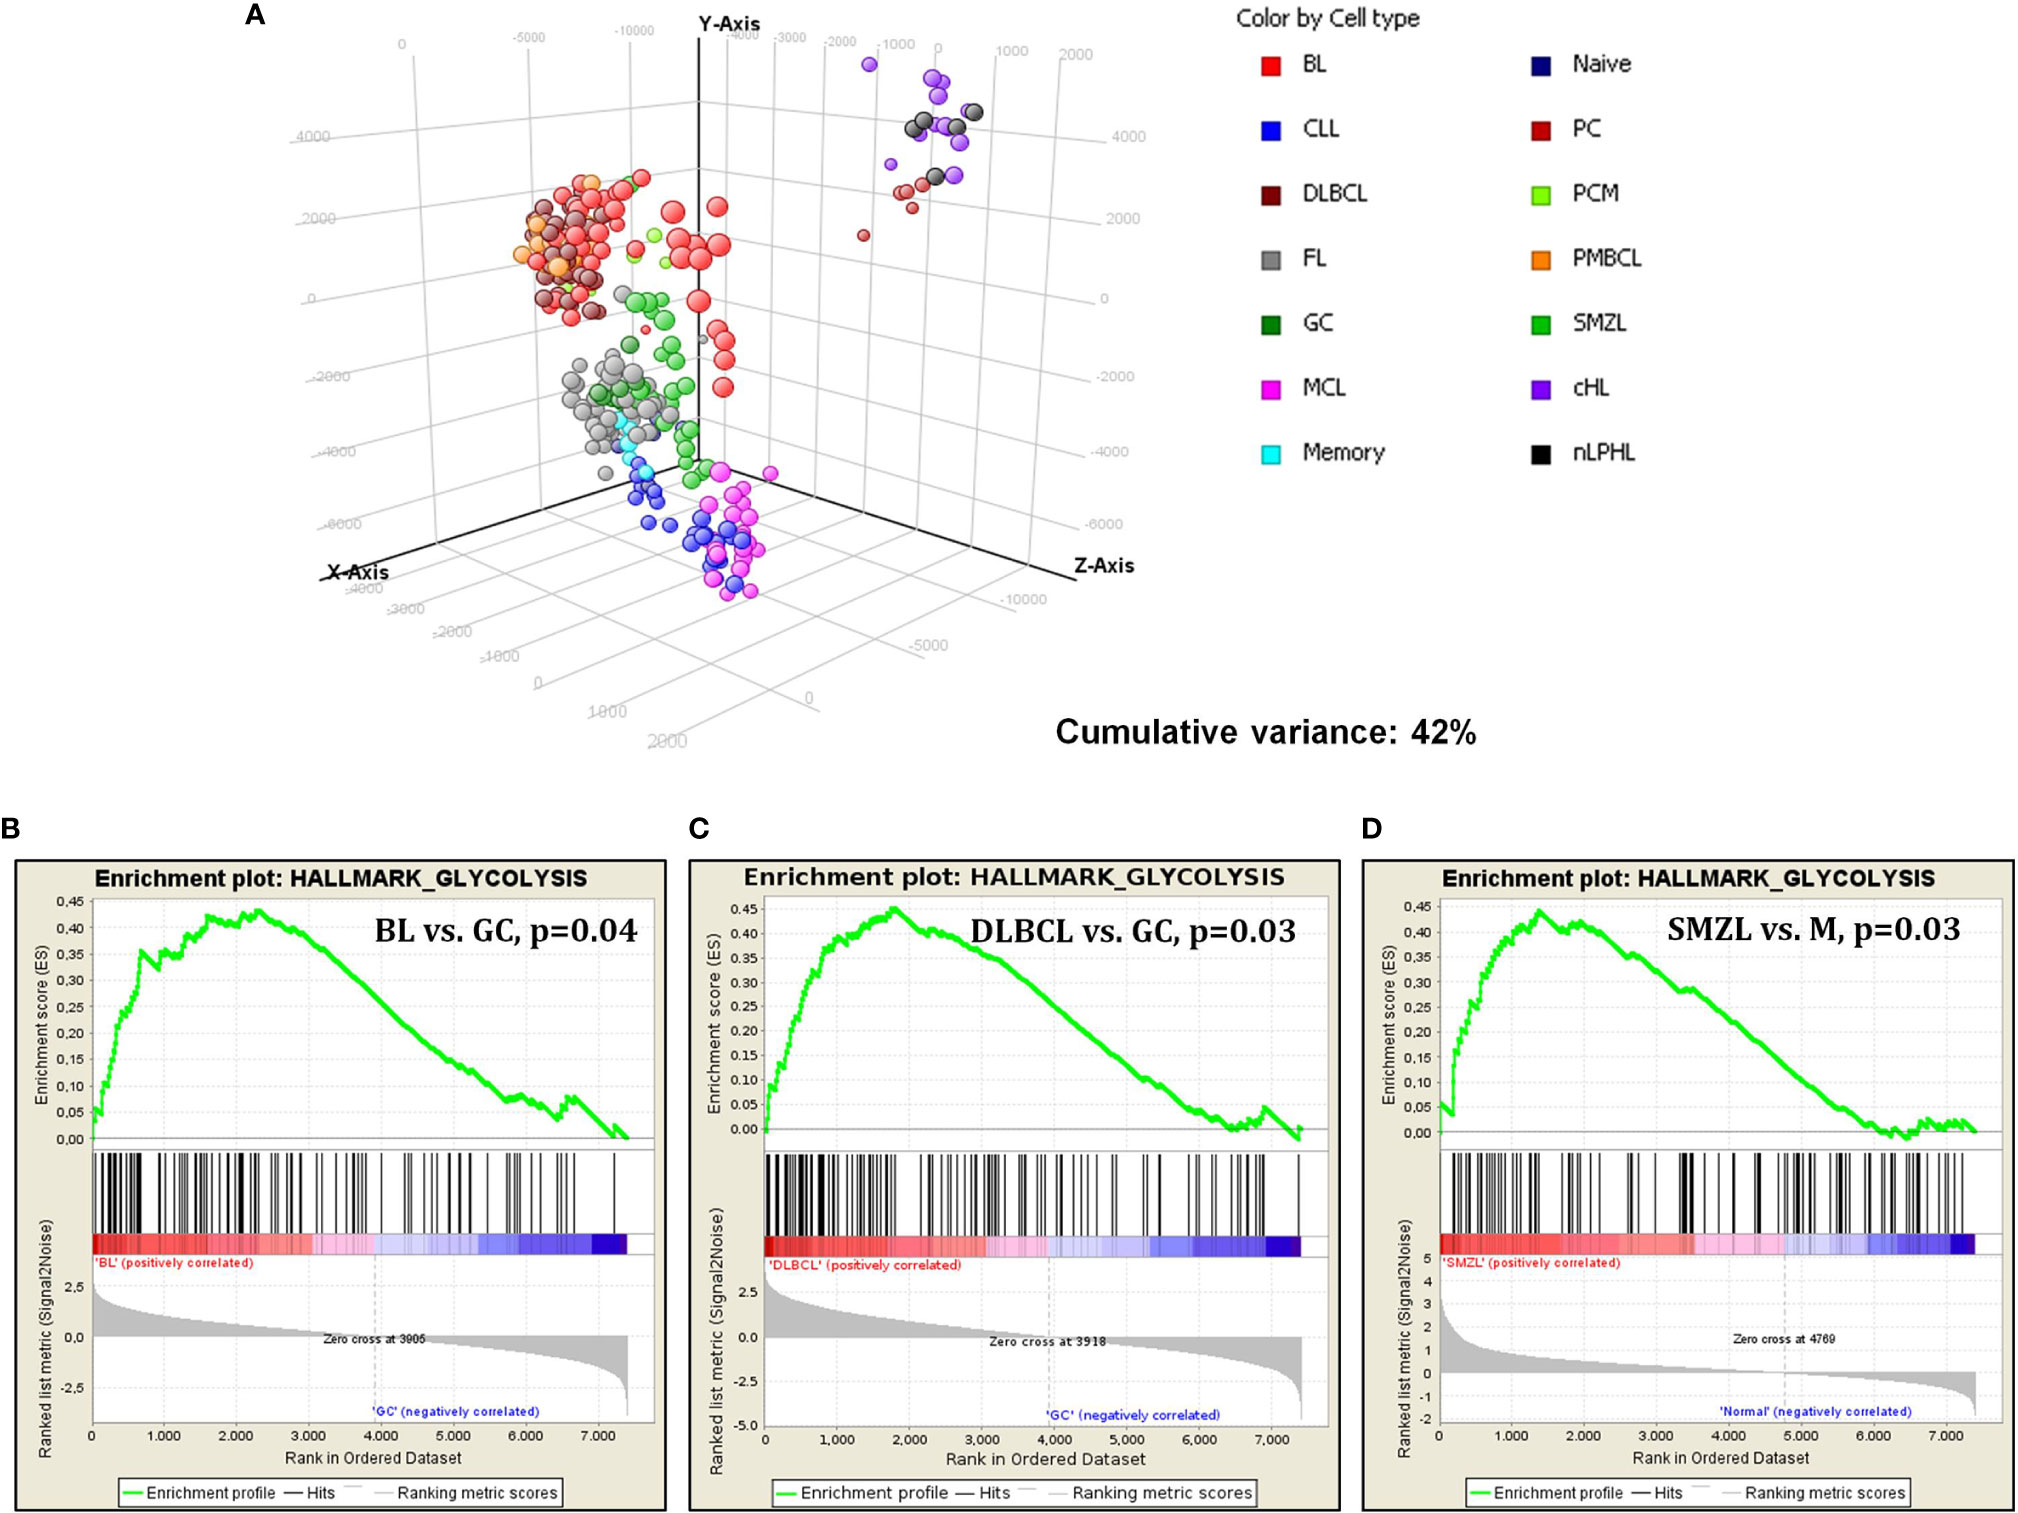
Figure 2 Gene expression analysis of lymphomas and normal B-cell by DNA microarrays. (A) PCA showed specific clustering of lymphomas and normal cells based on glucose metabolism associated genes. Each sphere represents a sample. (B–D) GSEA revealed significant enrichment in genes involved in glycolysis in BL, DLBCL and SMZL, when these tumors were confronted to their normal counterparts.
Subsequently, we studied glucose-metabolism-associated gene sets in the individual tumor types, comparing the neoplastic cells via GSEA with their normal, non-neoplastic counterparts. Burkitt lymphoma, compared to GC B cells, showed a significant enrichment in genes related to glycolysis. Of interest, no enrichment in oxidative phosphorylation was recorded, indicating a possible metabolic shift toward aerobic glycolysis (Warburg effect) (Figure 2B). Similarly, DLBCL cases were compared to GC cells, plasmablasts (the supposed counterpart of ABC-type DLBCL) not being available. Again, a considerable enhancement in glycolysis in favor of DLBCL cells was recorded (Figure 2C). Comparing SMZL to memory B cells showed enhancement in glycolysis as well (Figure 2D). Conversely, none of the other entities showed a significant enrichment in either glycolysis or oxidative phosphorylation when compared to the corresponding counterpart (data not shown).
Overall, it appeared that although most tumors presented with a variable augment in the expression of glucose metabolism associated genes, only few entities showed a remarkable and consistent increase in them. Particularly, BL and DLBCL turned to out to further upregulated these genes even if compared to highly proliferating GC B cells that already showed a consistent increase in glucose usage compared to nodal resting B cells in our analysis. Based on the above findings indicating a potential usefulness of drugs interfering with glucose metabolism in DLBCL, we further investigated BL.
To validate the results observed in the gene sets from microarray data, which reported the upregulation of genes involved in glucose metabolism in patients affected with BL, we investigated the gene expression of six selected genes involved in glucose metabolism in both DAUDI and PBL by means of RT-qPCR. As expected, we found that the main genes involved in Warburg effect were upregulated in BL-originated DAUDI cells compared to healthy lymphocytes. Particularly, a statistically significant upregulation was observed as far as GLUT-1, LDHA, and VDAC1 (Figure 3). Moreover, HK1 was found to be downregulated in DAUDI cells with respect to PBL, while HK2 was found to be upregulated. This may be due to the fact that HK2, instead of HK1, is frequently upregulated in cancer, and, in addition, the binding of HK2 to the external mitochondrial membrane in a complex with VDAC1 is known to contribute to fuel the glycolytic process (32).
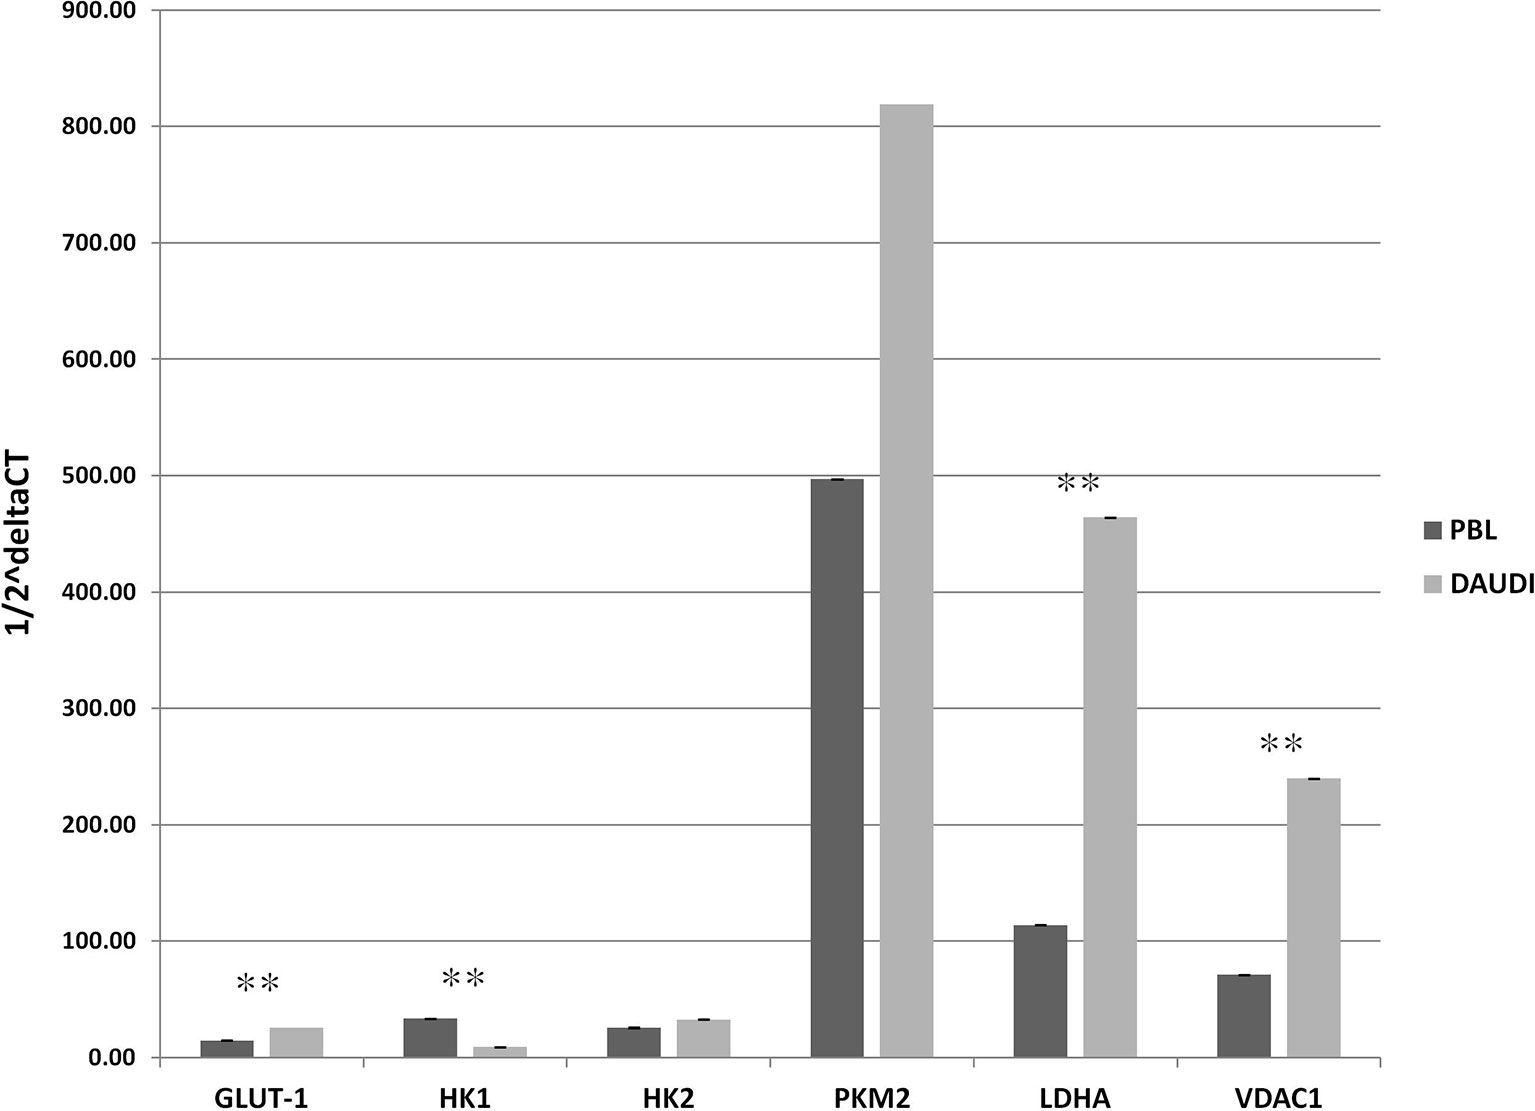
Figure 3 Gene expression of glucose metabolism genes in DAUDI cells vs. PBL. The gene expression of selected targets involved in glucose metabolism was evaluated by RT-qPCR in both DAUDI cells and PBL. Beta-actin was used as reference gene. Values represent the relative amount of each transcript in the two cell types. Values are means and SEM of four independent experiments (Mann-Whitney U-test, **two-tailed p-values ≤ 0.05).
To further validate the results obtained by gene expression assays, we assessed the in vitro overall glucose consumption, by focusing on the rate of the PPP, TCA cycle, and aerobic glycolysis branches, in cellular model of BL (DAUDI cells) and normal PBL as control. As expected, we demonstrated that overall glucose metabolism was increased in DAUDI cells with respect to PBL of about twofold because of tumor metabolism switch, being the main effects on aerobic glycolysis (increased) and mitochondrial metabolism (decreased) (Figure 4).
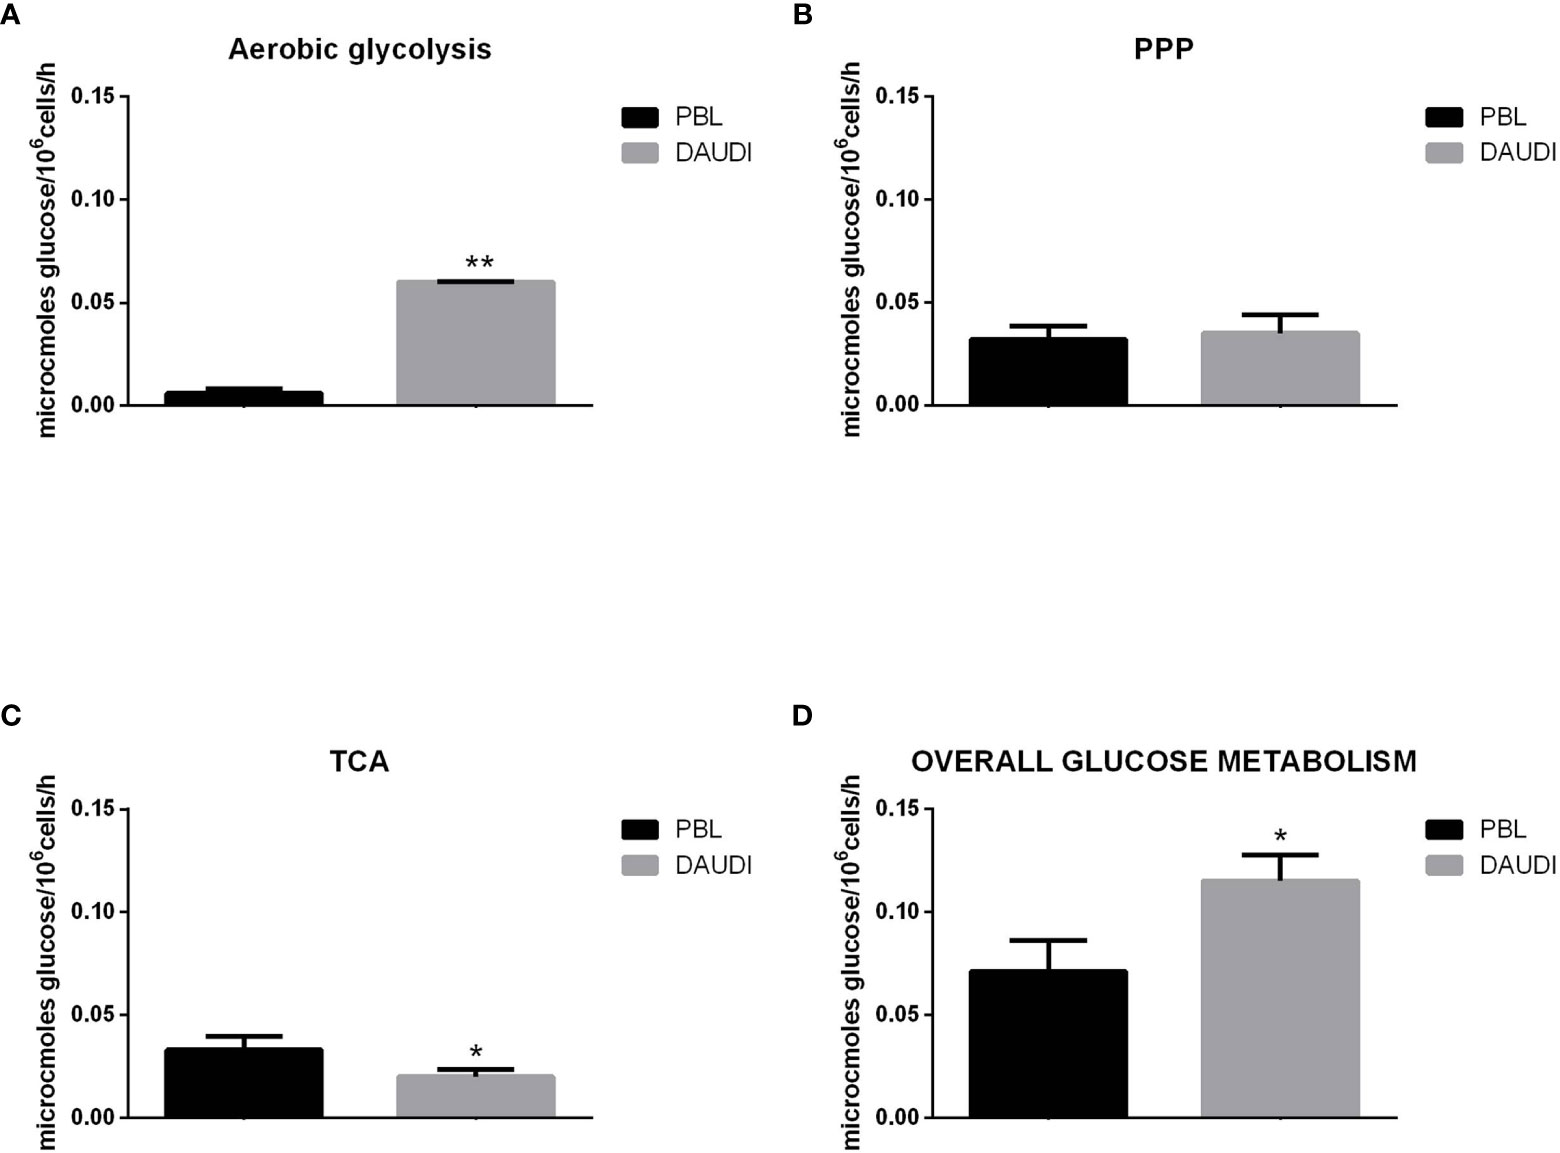
Figure 4 Glucose metabolism in DAUDI cells vs. PBL. Values are means and SEM of four independent experiments (Wilcoxon signed rank test, two-tailed; *p-values ≤ 0.05; **p-values < 0.005). (A) Bars represent the rates of glucose consumption in aerobic glycolysis leading to lactate production. Effective rates of utilization of radiolabeled glucose in PPP (B) and TCA (Krebs) cycle (C) was evaluated by administration of [1-C14]-glucose or [6-C14]-glucose and subsequent monitoring of the emitted 14CO2, which is directly proportional to the consumed glucose. PPP rates were determined as the difference between the rates of radiolabeled carbon dioxide production from [1-C14]- and [6-C14]-glucose. TCA cycle rates were determined by monitoring the production of radiolabeled carbon dioxide only produced by [6-C14]-glucose. Overall glucose consumption (D) was calculated as the sum of glucose consumption in aerobic glycolysis, PPP and TCA cycle.
To test the possibility of treatment with metformin, we first assessed the cytotoxic effect of the drug on AKATA, DAUDI, and RAJI cells by MTS assay and assess the IC50 after 48 h of exposure. We observed a relatively similar dose-dependent cytotoxic effect. Particularly, the IC50 was 16.56, 12.82, and 9.81 mM, for the three lines, respectively (Supplementary Figure 4). Based on that, DAUDI (the one showing the intermediate degree of sensitivity) was used for the following experiments.
We then further studied the cytotoxic effects of metformin on DAUDI cells, treating in parallel PBL as control. To this end, cells were treated with 10 mM metformin for 24, 48, and 72 h. DAUDI cells showed a strong and significant reduction in cell viability after 24 h of treatment, and this effect increased at longer periods of treatment (Figure 5A). On the contrary, metformin treatment slightly affected healthy lymphocytes (Figure 5B). In fact, the observed reduction in cell viability could mainly be attributable to the physiological death of primary lymphocytes, which were not supplemented with specific growth factors to avoid any interference in metabolism assays. Since the IC50% in DAUDI cells was almost reached after 24 h of treatment, all following assays were performed under this condition.
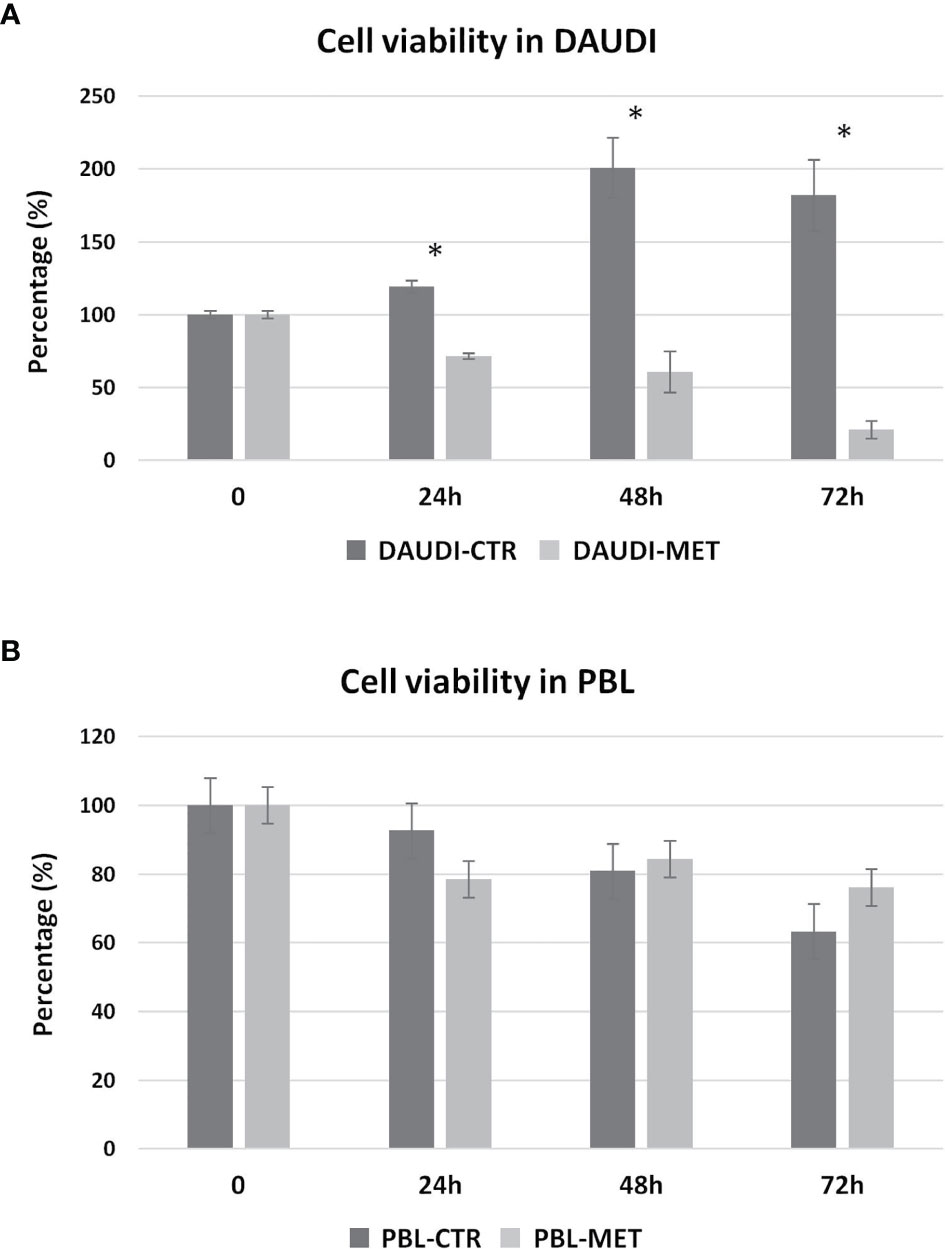
Figure 5 Metformin effect on cell viability. DAUDI cells (A) and PBL (B) were treated with 10 mM metformin for 24, 48 and 72 hours. CTR, untreated cells; MET, treated cells with 10mM Metformin. Significance is expressed by comparing treated cells versus the respective untreated ones (Wilcoxon signed rank test; *two-tailed p-values ≤ 0.05).
To test if the cytotoxic effect of metformin was somehow due to changes in the overall energetic and metabolic status, we assessed glucose metabolism by focusing on the rate of aerobic glycolysis, PPP, and TCA in DAUDI cells and PBL treated or untreated with metformin (Figure 6).
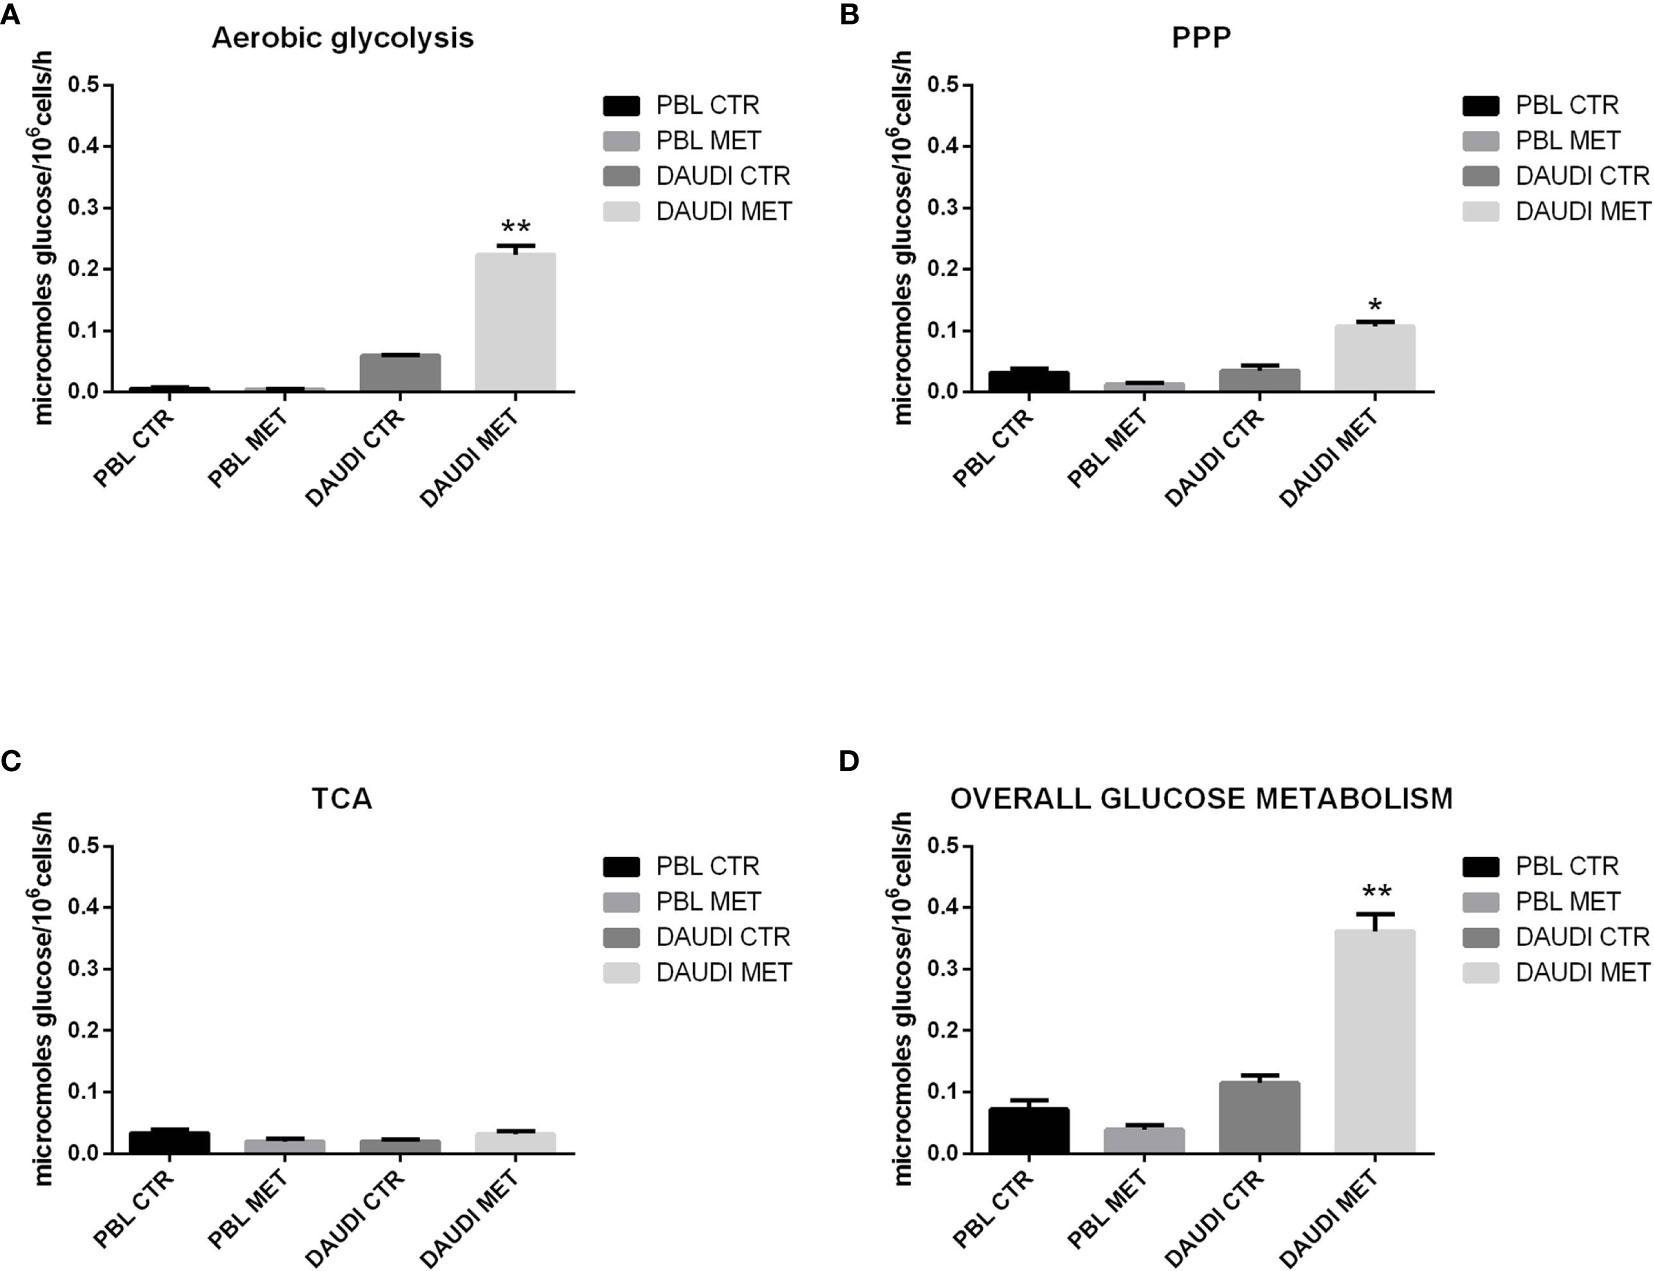
Figure 6 Effect of metformin on glucose metabolism in DAUDI and PBL cells. Panel (A) represent the rates of glucose consumption in aerobic glycolysis producing lactate, while panel (B, C) show the rate of PPP and TCA. Effective rates of utilization of radiolabeled glucose in PPP and TCA cycle (Krebs) was confirmed by administration of [1-C14]-glucose and [6-C14]-glucose and subsequent monitoring of emitted 14CO2, which is directly proportional to the glucose consumed. PPP rates were determined as the difference between the rates of radiolabeled carbon dioxide production from [1-C14]- and [6-C14]-glucose. TCA cycle rates were determined monitoring the production of radiolabeled carbon dioxide only produced by [6-C14]-glucose. Overall glucose consumption (D) was calculated as the sum of glucose consumption in aerobic glycolysis, PPP and TCA cycle. CTR: untreated cells; MET: treated cells with 10mM metformin. Values are means and SEM of three independent experiments (Wilcoxon signed rank test, two-tailed; *p-values ≤ 0.05; **p-values ≤ 0.005).
As a first point, we focused on the aerobic glycolysis rate by measuring the amount of lactate produced. As shown in Figure 6A, we found that lactate production was significantly increased after metformin treatment. We next focused on the PPP and TCA rates. The results showed that, in DAUDI cells, the amount of glucose utilized in the oxidative decarboxylation of the hexose monophosphate pathway increased significantly after metformin administration, consistent with an increased rate of the PPP (Figure 6B). On the other hand, the amount of glucose utilized in the oxidative decarboxylation during TCA cycle was slightly affected by metformin treatment (Figure 6C).
The overall glucose metabolism, calculated as the sum of PPP, TCA, and aerobic glycolysis, indicated more than 2-fold upregulation in DAUDI cells after metformin treatment (Figure 6D). On the contrary, in PBL, the overall glucose metabolism was slightly downregulated after metformin treatment, since it utilizes less glucose in both PPP and TCA cycle, while aerobic glycolysis remained unchanged. As for cell viability, this could be explained by the physiological resting of lymphocytes, which were not supplemented with specific growth factors.
Subsequently, we investigated whether this metabolic reprogramming could be the result of rearrangement in the gene expression profile. To this end, we selected a panel of genes involved in the Warburg effect including HK1, HK2, PKM2, VDAC1, GLUT-1, and LDHA, and mRNA levels were analyzed by RT-qPCR. In Figure 7, the relative expression levels, calculated by means of the 1/2ΔCt method, are shown (Figure 7A, PBL; Figure 7B, DAUDI).
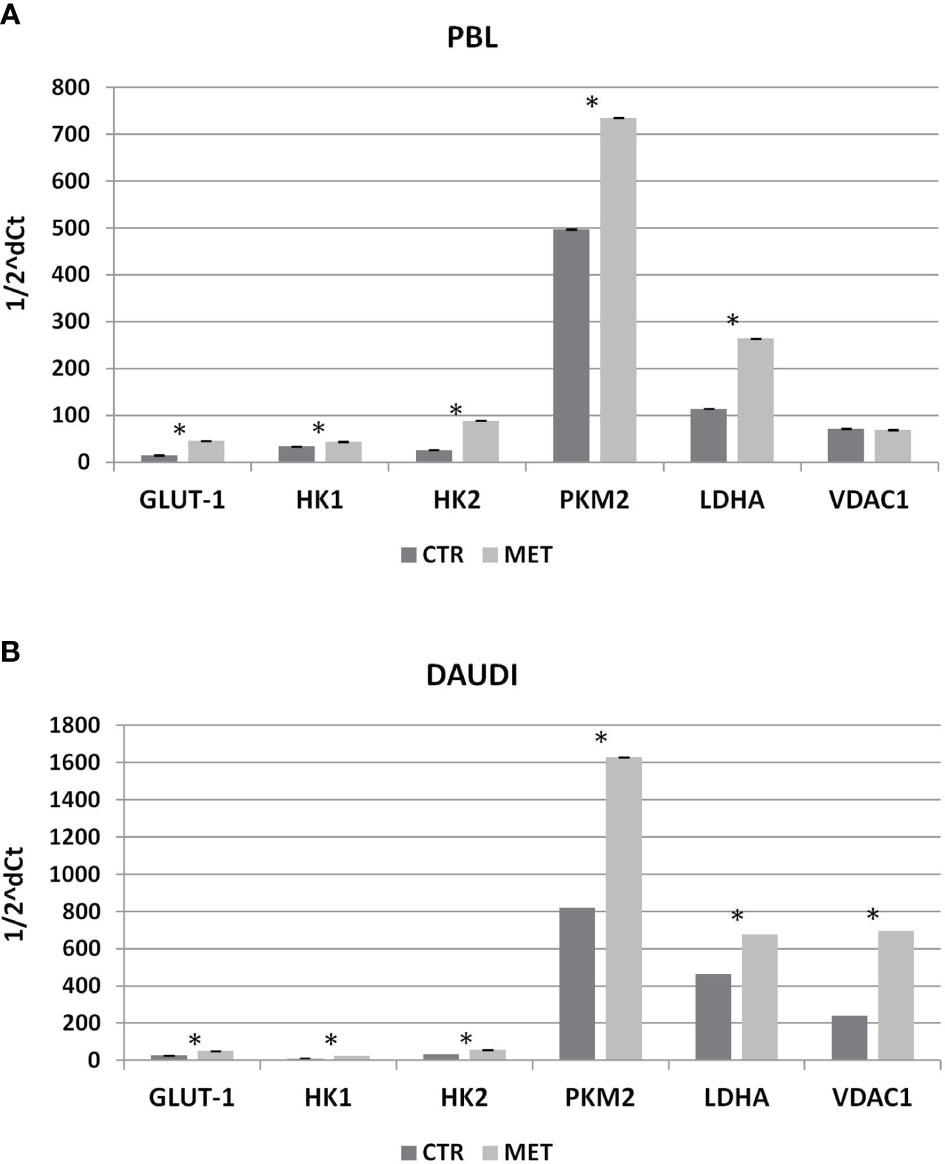
Figure 7 Effect of Metformin on gene expression profile of PBL (A) and DAUDI cells (B). The effect of metformin on gene expression of selected targets involved in Warburg’s effect was evaluated by RT-qPCR after 24 hours of 10 mM metformin treatment in both DAUDI cells and PBL. Beta-actin was used as the reference genes. Values represent fold changes of each target with respect to the untreated control (Wilcoxon matched-pairs signed rank test; *p-values ≤ 0.05).
In DAUDI cells, we found upregulation of the main genes involved in glucose metabolism, the main effect being observed on GLUT-1, HK1, HK2, PMK2, LDHA, and VDAC1. On the other hand, in PBL, the main effect was on GLUT-1, HK1, HK2, PKM2, and LDHA genes. As final point, we evaluated whether the observed increase in gene expression was supported by a corresponding increase in protein level expression. As shown in Supplementary Figure 5, in DAUDI cells treated with metformin, we demonstrated a corresponding increase in GLUT-1, PKM2, and LDHA protein levels. Regarding PBL, the upregulation at mRNA level does not correspond to an increase at protein level, consistent with the lack of metformin effect observed at metabolic level.
Multiple molecular mechanisms, both intrinsic and extrinsic, converge to alter core cellular metabolism and to provide support for the three basic needs of dividing cells: rapid ATP generation to maintain the energy status, increased biosynthesis of macromolecules, and the strict maintenance of an appropriate redox status. To meet these needs, cancer cells acquire alterations to the metabolism of all four major classes of macromolecules: carbohydrates, proteins, lipids, and nucleic acids (33). In this study, we explored for the first time glucose metabolism in a large panel of malignant lymphomas and normal B-cell subsets. Although the tumors, taken together, showed a slight, but still significant (p = 0.05), enrichment in the expression of glycolysis associated genes, later only few tumor types (DLBCL, SMZL, and BL) demonstrated a significant enrichment when compared to the corresponding normal counterparts. Indeed, very little is currently known concerning SMZL metabolism, a fact that certainly warrants further exploration. In fact, differently from DLBCL and BL, the proliferation rate, usually low in MZL, cannot, as obviously as in more aggressive lymphomas, be regarded as the driving factor for glycolysis increase. On the other hand, DLBCL is already known to be characterized, generally speaking, by “increased glucose metabolism” based on increased glucose uptake documented at [18F]-fluorodeoxyglucose positron emission tomography/computed tomography ([18F]Ł-FDG-PET/CT), this being related to tumor proliferation (34). Furthermore, the activation of the phosphoinositide 3-kinase (PI3K)/Akt/mTOR pathway was shown to be able to promote this metabolic change rendering DLBCL cells glucose dependent (35). As a consequence, very recently, it was shown that glyceraldehyde 3-phosphate dehydrogenase (GAPDH) expression could predict not only the metabolic status but also response to chemotherapy and specific metabolism-interfering therapy in DLBCL patients (36). As far as BL is regarded, it is known that MYC oncogene, the molecular hallmark of the tumor, is responsible for profound effects on cell metabolism (37). However, only very little was specifically reported in BL, mainly concerning a possible positive effect of metformin when BL cells are treated with selected apoptosis and signaling inhibitors (16). Based on such preliminary evidence and the rational of inhibiting pathways downstream the driving oncogene MYC, we further investigated this tumor and served as a model for this study. Interestingly, different from this previous study, we found that lymphoma cells preferred aerobic glycolysis, consistent with the Warburg effect, rather than oxidative phosphorylation. Furthermore, we also showed gene expression in a large set of primary cases, while Chukkapalli and colleagues mainly referred to cell lines (16).
To further validate data from gene expression microarrays, we performed analyses by qRT-PCR on six target genes involved in glucose metabolism in DAUDI BL cells and PBL. Unfortunately, primary lymphoma cells were not considered suitable for validation analyses, since functional studies would have been significantly affected by tissue manipulation and cells isolation. GLUT-1, LDHA, and VDAC1 were significantly upregulated in DAUDI cells with respect to PBL; on the contrary, HK1 was significantly downregulated. Upregulation of GLUT-1 and LDHA is consistent with the enrichment of glycolysis gene set and suggested that lymphoma cells, as for most tumors, undergo the Warburg effect. HK1 is defined as a mitochondrial hexokinase because of its interaction with VDAC1, which is in the outer mitochondrial membrane (OMM), and regulates ATP flux from the mitochondria to cytoplasm. The attachment to the OMM promotes the coupling of glycolysis to mitochondrial oxidative phosphorylation (38). Therefore, HK1 downregulation is possibly correlated with the impairment of respiratory activity. Tseng and colleagues (39) reported that HK1 silencing induces a switch in energy metabolism specifically from oxidative phosphorylation to aerobic glycolysis and enhances tumor malignancy, increasing cancer cell proliferation and metastasis. The upregulation of VDAC1 in DAUDI cells is probably due to a compensation mechanism, which reflects the increased requirement of energy consequent to the active proliferative state of cancer cells. Subsequently, we assessed glucose metabolism and the specific rate of the pentose phosphate pathway (PPP) and the citric acid cycle (TCA) by isotope tracer analyses in DAUDI cells and PBL. Moreover, we measured lactate production as an indicator of aerobic glycolysis rate. As expected, we demonstrated that overall glucose metabolism was increased about twofold in DAUDI cells when compared with PBL. This increase was mainly due to the induction of aerobic glycolysis. These data confirmed gene expression profiles and showed that tumorigenesis per se induces a shift from an anabolic state to a catabolic state in BL. In the light of the current state of research in the field, we investigated the effects of metformin on the viability and cellular metabolism in BL. We found that metformin strongly affected viability in DAUDI cells, while PBLs were not affected by the treatment, indicating the ability of metformin to selectively target cancer cells. These observations suggested a possible therapeutic role for targeting cellular metabolism in BL and gave the rationale to further explore the mechanism of action of metformin. Here, we demonstrate that metformin exerts its major effect on metabolic pathways, enhancing even more the rate of aerobic glycolysis that, pushed to the limit, probably leads cancer cells to death. It should be noted, however, that the IC50 that we observed for metformin in BL cell lines is relatively high (in the order of magnitude of mM). Despite being in line with previous studies on lymphomas, this might certainly affect the actual feasibility of in vivo treatments. On the other hand, the association of lower doses to chemotherapy or targeted agents might certainly maintain a biological and therapeutic effect, which need further investigation in vivo.
To determine the overall energetic and metabolic changes induced by the drug, we assessed the overall glucose metabolism by evaluating the rate of glucose consumption both through TCA and PPP in DAUDI cells treated or untreated with metformin. Metformin was chosen as already available for clinical use and safely administrable during chemotherapy and obviously interfering with glucose metabolism. We performed isotope tracer analyses, which revealed that the amount of glucose consumed in the oxidative decarboxylation of the hexose monophosphate pathway increased after metformin administration, consistent with an increased rate of the PPP. On the other hand, the amount of glucose employed in oxidative decarboxylation during TCA cycle was slightly affected by metformin treatment. Moreover, metformin induces a strong increase in lactate production in DAUDI cells due to a rise in aerobic glycolysis rate, suggesting that pyruvate is preferentially converted to lactate as opposed to entering the TCA cycle. Taken together, our data indicate that metformin treatment induces a strong increase in the overall glucose consumption and that, instead of mitochondrial metabolism, glycolysis intermediates are probably used to fuel aerobic glycolysis and the PPP, which is one of the most important pathways for NADPH regeneration that is required for both the nucleotide synthesis and cell survival under stress conditions. Under normal conditions, 90% of glucose is directed to glycolysis, while only 10% is directed to PPP, while under oxidative stress conditions, the rate of PPP can be dramatically increased to promote antioxidant defense (40, 41). In our conditions, we found that about 30% of total glucose was shunted in the PPP, while the remaining (about 60%) was directed to aerobic glycolysis. Aerobic glycolysis is potentiated probably as a compensation mechanism because inhibition of complex-I impairs ATP production and prevents NADH oxidation through oxidative phosphorylation, thus requiring oxidation of cytosolic NADH by the conversion of pyruvate to lactate (10). These results are consistent with the observations of Scotland et al. (14) reporting that, in leukemic cells, metformin induces an increase in glucose utilization through both the aerobic glycolysis (Warburg effect) and pentose phosphate pathway as a compensatory effect of its early inhibition of mitochondrial energetics. On the contrary, PBL consumed less glucose in both PPP and TCA cycle after metformin treatment, while the lactate production was not affected. This could be explained by the physiological resting of lymphocytes, which were not supplemented with specific growth factors. Finally, we investigated metformin effects on gene expression and protein levels of the six candidate genes, as already mentioned. We found that, at mRNA level, metformin induces a strong upregulation of the overall targets in DAUDI cells; the main effect was observed on GLUT-1, HK1, HK2, PKM2, LDHA, and VDAC1, consistent with the increased glucose uptake and the increased rate of aerobic glycolysis. Upregulation of GLUT-1, PKM2, and LDHA was also confirmed at protein level in DAUDI cells. About PBL, the main effect was on GLUT-1, HK1, HK2, PKM2, and LDHA genes; however, these changes in gene expression do not reflect an increase in protein levels and metabolic utilization in the respective metabolic pathways. Nonetheless, off-targets effects of metformin accounting for its cytotoxicity at higher doses cannot be excluded. In conclusion, our data showed for the first time that (1) glucose metabolism is overall disrupted in human malignant lymphomas, (2) Burkitt lymphoma presents with a specific metabolic shift to aerobic glycolysis, and (3) metformin can kill BL cells by determining a strong variation in glucose usage. These data support further investigation on the possible use of metformin in Burkitt lymphoma treatment as an alternate and/or in combination with approved treatments. Based on our results, clinical trials aimed to interfere with lymphoma glucose metabolisms are indicated, while further biochemical and metabolomic studies are warranted to shed light on the specific features of other lymphoma subtypes.
The original contributions presented in the study are included in the article/Supplementary Material. Further inquiries can be directed to the corresponding authors.
PP, GV, and MM conceptualized and designed the study, supervised the analyses, and critically revised the manuscript. MN, AV, and ME were responsible for gene expression profiling analysis. IB, SB, AR, AI, and FL were responsible for biochemical analysis. LM, MG, SL, and LL contributed to cell culturing and viability assays with metformin. JL contributed to manuscript writing and critically revised it. All authors contributed to the article and approved the submitted version.
This work was supported by AIL-Pesaro Onlus (2019, AV), BolognAIL (2020, PP), RFO DIMES (2018, PP), and FIRB Futura 2011 RBFR12D1CB (PP). IB is an AIL-Pesaro Onlus fellow.
The authors declare that the research was conducted in the absence of any commercial or financial relationships that could be construed as a potential conflict of interest.
All claims expressed in this article are solely those of the authors and do not necessarily represent those of their affiliated organizations, or those of the publisher, the editors and the reviewers. Any product that may be evaluated in this article, or claim that may be made by its manufacturer, is not guaranteed or endorsed by the publisher.
The Supplementary Material for this article can be found online at: https://www.frontiersin.org/articles/10.3389/fonc.2021.661102/full#supplementary-material
1. Ngo DC, Ververis K, Tortorella SM, Karagiannis TC. Introduction to the Molecular Basis of Cancer Metabolism and the Warburg Effect. Mol Biol Rep (2015) 42(4):819–23. doi: 10.1007/s11033-015-3857-y
2. Augoff K, Hryniewicz-Jankowska A, Tabola R. Lactate Dehydrogenase 5: An Old Friend and a New Hope in the War on Cancer. Cancer Lett (2015) 358(1):1–7. doi: 10.1016/j.canlet.2014.12.035
3. Inzucchi SE, Bergenstal RM, Buse JB, Diamant M, Ferrannini E, Nauck M, et al. Management of Hyperglycemia in Type 2 Diabetes, 2015: A Patient-Centered Approach: Update to a Position Statement of the American Diabetes Association and the European Association for the Study of Diabetes. Diabetes Care (2015) 38(1):140–9. doi: 10.2337/dc14-2441
4. Evans JM, Donnelly LA, Emslie-Smith AM, Alessi DR, Morris AD. Metformin and Reduced Risk of Cancer in Diabetic Patients. Bmj (2005) 330(7503):1304–5. doi: 10.1136/bmj.38415.708634.f7
5. Pollak MN. Investigating Metformin for Cancer Prevention and Treatment: The End of the Beginning. Cancer Discov (2012) 2(9):778–90. doi: 10.1158/2159-8290.cd-12-0263
6. Zhang P, Li H, Tan X, Chen L, Wang S. Association of Metformin Use With Cancer Incidence and Mortality: A Meta-Analysis. Cancer Epidemiol (2013) 37(3):207–18. doi: 10.1016/j.canep.2012.12.009
7. Chae YK, Arya A, Malecek M-K, Shin DS, Carneiro B, Chandra S, et al. Repurposing Metformin for Cancer Treatment: Current Clinical Studies. Oncotarget (2016) 7(26):40767. doi: 10.18632/oncotarget.8194
8. Viollet B, Guigas B, Garcia NS, Leclerc J, Foretz M, Andreelli F. Cellular and Molecular Mechanisms of Metformin: An Overview. Clin Sci (2012) 122(6):253–70. doi: 10.1042/cs20110386
9. Andrzejewski S, Gravel S-P, Pollak M, St-Pierre J. Metformin Directly Acts on Mitochondria to Alter Cellular Bioenergetics. Cancer Metab (2014) 2(1):12. doi: 10.1186/2049-3002-2-12
10. Janzer A, German NJ, Gonzalez-Herrera KN, Asara JM, Haigis MC, Struhl K. Metformin and Phenformin Deplete Tricarboxylic Acid Cycle and Glycolytic Intermediates During Cell Transformation and NTPs in Cancer Stem Cells. Proc Natl Acad Sci (2014) 111(29):10574–9. doi: 10.1073/pnas.1409844111
11. Schulten H-J. Pleiotropic Effects of Metformin on Cancer. Int J Mol Sci (2018) 19(10):2850. doi: 10.3390/ijms19102850
12. Salani B, Del Rio A, Marini C, Sambuceti G, Cordera R, Maggi D. Metformin, Cancer and Glucose Metabolism. Endocrine-Related Cancer (2014) 21(6):R461–71. doi: 10.1530/erc-14-0284
13. Amin S, Lux A, O’callaghan F. The Journey of Metformin From Glycaemic Control to mTOR Inhibition and the Suppression of Tumour Growth. Br J Clin Pharmacol (2019) 85(1):37–46. doi: 10.1111/bcp.13780
14. Scotland S, Saland E, Skuli N, De Toni F, Boutzen H, Micklow E, et al. Mitochondrial Energetic and AKT Status Mediate Metabolic Effects and Apoptosis of Metformin in Human Leukemic Cells. Leukemia (2013) 27(11):2129. doi: 10.1038/leu.2013.107
15. Wang Y, Xu W, Yan Z, Zhao W, Mi J, Li J, et al. Metformin Induces Autophagy and G0/G1 Phase Cell Cycle Arrest in Myeloma by Targeting the AMPK/mTORC1 and Mtorc2 Pathways. J Exp Clin Cancer Res (2018) 37(1):63. doi: 10.1186/s13046-018-0731-5
16. Chukkapalli V, Gordon LI, Venugopal P, Borgia JA, Karmali R. Metabolic Changes Associated With Metformin Potentiates Bcl-2 Inhibitor, Venetoclax, and CDK9 Inhibitor, BAY1143572 and Reduces Viability of Lymphoma Cells. Oncotarget (2018) 9(30):21166. doi: 10.18632/oncotarget.24989
17. Casulo C, Friedberg J. Burkitt Lymphoma-a Rare But Challenging Lymphoma. Best Pract Res Clin Haematol (2018) 31(3):279–84. doi: 10.1016/j.beha.2018.07.013
18. Ambrosio MR, Piccaluga PP, Ponzoni M, Rocca BJ, Malagnino V, Onorati M, et al. The Alteration of Lipid Metabolism in Burkitt Lymphoma Identifies a Novel Marker: Adipophilin. PloS One (2012) 7(8):e44315. doi: 10.1371/journal.pone.0044315
19. Piccaluga PP, Weber A, Ambrosio MR, Ahmed Y, Leoncini L. Epstein–Barr Virus-Induced Metabolic Rearrangements in Human B-Cell Lymphomas. Front Microbiol (2018) 9:1233. doi: 10.3389/fmicb.2018.01233
20. Klein U, Tu Y, Stolovitzky GA, Mattioli M, Cattoretti G, Husson H, et al. Gene Expression Profiling of B Cell Chronic Lymphocytic Leukemia Reveals a Homogeneous Phenotype Related to Memory B Cells. J Exp Med (2001) 194(11):1625–38. doi: 10.1084/jem.194.11.1625
21. Klein U, Tu Y, Stolovitzky GA, Keller JL, Haddad J Jr., Miljkovic V, et al. Transcriptional Analysis of the B Cell Germinal Center Reaction. Proc Natl Acad Sci USA (2003) 100(5):2639–44. doi: 10.1073/pnas.0437996100
22. Basso K, Liso A, Tiacci E, Benedetti R, Pulsoni A, Foa R, et al. Gene Expression Profiling of Hairy Cell Leukemia Reveals a Phenotype Related to Memory B Cells With Altered Expression of Chemokine and Adhesion Receptors. J Exp Med (2004) 199(1):59–68. doi: 10.1084/jem.20031175
23. Piccaluga PP, Agostinelli C, Califano A, Rossi M, Basso K, Zupo S, et al. Gene Expression Analysis of Peripheral T Cell Lymphoma, Unspecified, Reveals Distinct Profiles and New Potential Therapeutic Targets. J Clin Invest (2007) 117(3):823–34. doi: 10.1172/JCI26833
24. Barretina J, Caponigro G, Stransky N, Venkatesan K, Margolin AA, Kim S, et al. The Cancer Cell Line Encyclopedia Enables Predictive Modelling of Anticancer Drug Sensitivity. Nature (2012) 483(7391):603–7. doi: 10.1038/nature11003
25. Fitzsimmons L, Boyce AJ, Wei W, Chang C, Croom-Carter D, Tierney RJ, et al. Coordinated Repression of BIM and PUMA by Epstein–Barr Virus Latent Genes Maintains the Survival of Burkitt Lymphoma Cells. Cell Death Differ (2018) 25(2):241–54. doi: 10.1038/cdd.2017.150
26. Navari M, Fuligni F, Laginestra MA, Etebari M, Ambrosio MR, Sapienza MR, et al. Molecular Signature of Epstein Barr Virus-Positive Burkitt Lymphoma and Post-Transplant Lymphoproliferative Disorder Suggest Different Roles for Epstein Barr Virus. Front Microbiol (2014) 5:728. doi: 10.3389/fmicb.2014.00728
27. Navari M, Etebari M, De Falco G, Ambrosio MR, Gibellini D, Leoncini L, et al. The Presence of Epstein-Barr Virus Significantly Impacts the Transcriptional Profile in Immunodeficiency-Associated Burkitt Lymphoma. Front Microbiol (2015) 6:556. doi: 10.3389/fmicb.2015.00556
28. Di Napoli A, De Cecco L, Piccaluga PP, Navari M, Cancila V, Cippitelli C, et al. Transcriptional Analysis Distinguishes Breast Implant-Associated Anaplastic Large Cell Lymphoma From Other Peripheral T-Cell Lymphomas. Modern Pathol (2019) 32(2):216–30. doi: 10.1038/s41379-018-0130-7
29. Irizarry RA, Bolstad BM, Collin F, Cope LM, Hobbs B, Speed TP. Summaries of Affymetrix GeneChip Probe Level Data. Nucleic Acids Res (2003) 31(4):e15–5. doi: 10.1093/nar/gng015
30. Johnson WE, Li C, Rabinovic A. Adjusting Batch Effects in Microarray Expression Data Using Empirical Bayes Methods. Biostatistics (2007) 8(1):118–27. doi: 10.1093/biostatistics/kxj037
31. Biagiotti S, Menotta M, Orazi S, Spapperi C, Brundu S, Fraternale A, et al. Dexamethasone Improves Redox State in Ataxia Telangiectasia Cells by Promoting an NRF2-Mediated Antioxidant Response. FEBS J (2016) 283(21):3962–78. doi: 10.1111/febs.13901
32. Krasnov GS, Dmitriev AA, Lakunina VA, Kirpiy AA, Kudryavtseva AV. Targeting VDAC-Bound Hexokinase II: A Promising Approach for Concomitant Anti-Cancer Therapy. Expert Opin Ther Targets (2013) 17(10):1221–33. doi: 14728222.2013.833607 doi: 10.1517/14728222.2013.833607
33. Cairns RA, Harris IS, Mak TW. Regulation of Cancer Cell Metabolism. Nat Rev Cancer (2011) 11(2):85–95. doi: 10.1038/nrc2981
34. Wu X, Pertovaara H, Korkola P, Vornanen M, Eskola H, Kellokumpu-Lehtinen PL. Glucose Metabolism Correlated With Cellular Proliferation in Diffuse Large B-Cell Lymphoma. Leuk Lymph (2012) 53(3):400–5. doi: 10.3109/10428194.2011.622420
35. Coloff JL, Macintyre AN, Nichols AG, Liu T, Gallo CA, Plas DR, et al. Akt-Dependent Glucose Metabolism Promotes Mcl-1 Synthesis to Maintain Cell Survival and Resistance to Bcl-2 Inhibition. Cancer Res (2011) 71(15):5204–13. doi: 10.1158/0008-5472.can-10-4531
36. Chiche J, Reverso-Meinietti J, Mouchotte A, Rubio-Patino C, Mhaidly R, Villa E, et al. GAPDH Expression Predicts the Response to R-CHOP, the Tumor Metabolic Status, and the Response of DLBCL Patients to Metabolic Inhibitors. Cell Metab (2019) 29(6):1243–57.e1210. doi: 10.1016/j.cmet.2019.02.002
37. Dejure FR, Eilers M. MYC and Tumor Metabolism: Chicken and Egg. EMBO J (2017) 36(23):3409–20. doi: 10.15252/embj.201796438
38. Regenold W, Pratt M, Nekkalapu S, Shapiro P, Kristian T, Fiskum G. Mitochondrial Detachment of Hexokinase 1 in Mood and Psychotic Disorders: Implications for Brain Energy Metabolism and Neurotrophic Signaling. J Psychiatr Res (2012) 46(1):95–104. doi: 10.1016/j.jpsychires.2011.09.018
39. Tseng P-L, Chen C-W, Hu K-H, Cheng H-C, Lin Y-H, Tsai W-H, et al. The Decrease of Glycolytic Enzyme Hexokinase 1 Accelerates Tumor Malignancy via Deregulating Energy Metabolism But Sensitizes Cancer Cells to 2-Deoxyglucose Inhibition. Oncotarget (2018) 9(27):18949. doi: 10.18632/oncotarget.24855
40. Patra KC, Hay N. The Pentose Phosphate Pathway and Cancer. Trends Biochem Sci (2014) 39(8):347–54. doi: 10.1016/j.tibs.2014.06.005
Keywords: glucose metabolism, glycolysis, metformin, anaerobic glycolysis, Burkitt lymphoma
Citation: Bagaloni I, Visani A, Biagiotti S, Ruzzo A, Navari M, Etebari M, Mundo L, Granai M, Lazzi S, Isidori A, Loscocco F, Li J, Leoncini L, Visani G, Magnani M and Piccaluga PP (2021) Metabolic Switch and Cytotoxic Effect of Metformin on Burkitt Lymphoma. Front. Oncol. 11:661102. doi: 10.3389/fonc.2021.661102
Received: 30 January 2021; Accepted: 26 July 2021;
Published: 02 September 2021.
Edited by:
Luca Arcaini, University of Pavia, ItalyReviewed by:
Salma Parvin, Dana–Farber Cancer Institute, United StatesCopyright © 2021 Bagaloni, Visani, Biagiotti, Ruzzo, Navari, Etebari, Mundo, Granai, Lazzi, Isidori, Loscocco, Li, Leoncini, Visani, Magnani and Piccaluga. This is an open-access article distributed under the terms of the Creative Commons Attribution License (CC BY). The use, distribution or reproduction in other forums is permitted, provided the original author(s) and the copyright owner(s) are credited and that the original publication in this journal is cited, in accordance with accepted academic practice. No use, distribution or reproduction is permitted which does not comply with these terms.
*Correspondence: Pier Paolo Piccaluga, cGllcnBhb2xvLnBpY2NhbHVnYUB1bmliby5pdA==; Giuseppe Visani, Z2l1c2VwcGUudmlzYW5pQG9zcGVkYWxpbWFyY2hlbm9yZC5pdA==
†These authors have contributed equally to this work
‡These authors have contributed equally to this work
Disclaimer: All claims expressed in this article are solely those of the authors and do not necessarily represent those of their affiliated organizations, or those of the publisher, the editors and the reviewers. Any product that may be evaluated in this article or claim that may be made by its manufacturer is not guaranteed or endorsed by the publisher.
Research integrity at Frontiers
Learn more about the work of our research integrity team to safeguard the quality of each article we publish.