- 1Department of Mechanical Engineering, K. N. Toosi University of Technology, Tehran, Iran
- 2Department of Electrical and Computer Engineering, Faculty of Engineering, School of Optometry and Vision Science, Faculty of Science, University of Waterloo, Waterloo, ON, Canada
- 3Advanced Bioengineering Initiative Center, Multidisciplinary International Complex, K. N. Toosi University of Technology, Tehran, Iran
- 4Centre for Biotechnology and Bioengineering (CBB), University of Waterloo, Waterloo, ON, Canada
- 5Departments of Radiology and Physics, University of British Columbia, Vancouver, BC, Canada
- 6Department of Integrative Oncology, BC Cancer Research Institute, Vancouver, BC, Canada
Objective: Nano-sized drug delivery systems (NSDDSs) offer a promising therapeutic technology with sufficient biocompatibility, stability, and drug-loading rates towards efficient drug delivery to solid tumors. We aim to apply a multi-scale computational model for evaluating drug delivery to predict treatment efficacy.
Methodology: Three strategies for drug delivery, namely conventional chemotherapy (one-stage), as well as chemotherapy through two- and three-stage NSDDSs, were simulated and compared. A geometric model of the tumor and the capillary network was obtained by processing a real image. Subsequently, equations related to intravascular and interstitial flows as well as drug transport in tissue were solved by considering real conditions as well as details such as drug binding to cells and cellular uptake. Finally, the role of periodic treatments was investigated considering tumor recurrence between treatments. The impact of different parameters, nanoparticle (NP) size, binding affinity of drug, and the kinetics of release rate, were additionally investigated to determine their therapeutic efficacy.
Results: Using NPs considerably increases the fraction of killed cells (FKCs) inside the tumor compared to conventional chemotherapy. Tumoral FKCs for two-stage DDS with smaller NP size (20nm) is higher than that of larger NPs (100nm), in all investigate release rates. Slower and continuous release of the chemotherapeutic agents from NPs have better treatment outcomes in comparison with faster release rate. In three-stage DDS, for intermediate and higher binding affinities, it is desirable for the secondary particle to be released at a faster rate, and the drug with slower rate. In lower binding affinities, high release rates have better performance. Results also demonstrate that after 5 treatments with three-stage DDS, 99.6% of tumor cells (TCs) are killed, while two-stage DDS and conventional chemotherapy kill 95.6% and 88.5% of tumor cells in the same period, respectively.
Conclusion: The presented framework has the potential to enable decision making for new drugs via computational modeling of treatment responses and has the potential to aid oncologists with personalized treatment plans towards more optimal treatment outcomes.
Introduction
Encapsulation of drugs in nanoparticles (NPs) can enhance the delivery of therapeutic and diagnostic agents to tumors, and at the same time, reduce their accumulation in healthy tissue (1). In treatments, this issue results in improved local drug concentrations at disease sites while decreasing systemic toxicity. On the other hand, conventional small molecule compounds usually distribute randomly among all tissues (2). However, NPs using advantages such as enhanced permeability and retention effect (EPR) have provided moderate enhancements over small molecule therapeutics regarding patient survival and care (3). A qualitative analysis of the pharmacokinetics of NP-mediated doxorubicin (DOX) in patients with cancer was carried out by Gabizon et al. (4) comparing with an equal DOX dosage delivered in free form. The findings distinctly indicated that NP-mediated delivery is capable of decreasing plasma clearance and enhancing DOX concentration inside tumors (4). In vivo tests on human prostate carcinoma showed that NP-mediated DOX may improve treatment effectiveness because of decreased systemic elimination, enhanced penetration in tumor, and prolonged NP existence with a slow release rate of drug (5). The clinical advantages of NP-encapsulated DOX is also evaluated in patients with metastatic breast cancer (6). The results suggested that NP-mediated DOX was capable of significantly reducing cardiotoxicity and improving therapeutic efficacy. Nevertheless, despite multiple promising ideas and experimental outcomes, NPs do not commonly reach tumors efficiently in clinical trials (7). Successful drug delivery depends on the ability of NPs to deep penetration into tissue, achieve an efficient spatial distribution, ensure its proper binding affinity, and adequately release the drugs (8). However, progress in NPs will need a number of technical and physiological barriers to be realized and overcome, such as opsonization and nonspecific protein adsorption, non-specific uptake by cells and organs encompassing the immune system, targeting and penetrating the tumor microenvironment (TME), and gaining access to cancer cells for intracellular drug delivery (9). Physical circumstances influencing the function of NPs facing these obstacles are still understood imperfectly, and the nanomedicine lacks a detailed explanation of physical principles to guide logical NP designs that can overcome biological barriers in TME (1).
For most desirable efficiency, sufficient amounts of the therapeutic agents must reach tumors in order to eliminate cancer cells, and at the same time, they must not induce considerable side effects on normal tissues. Generally, relatively small NPs experience higher transvascular and interstitial transports (10). Investigation of the various functions of NPs with different physiological features in combating biological barriers has demonstrated that NPs require to be dynamically adapted to these obstacles, resulting in the emergence and development of multi-stage DDSs (11). In such a system, the NPs can change their size in response to stimuli at different stages (e.g., initial size of 100 nm and secondary size of 10 nm) (12). Wong et al. (13) suggested a multi-stage system comprising the primary particle containing smaller secondary particles, which subsequently carry the therapeutic agent. Eventually, therapeutic agents contained in the secondary particles must be released to reach cancer cells. If an additional stage was included in the conventional NPs, it could improve drug distribution into the tumor and also tumor penetration, as well as increase treatment efficacy. The secondary particles release their cargo within the tumor, triggered by exposure to external (magnetic and electric fields, acoustic, etc.) or internal stimuli (TME properties such as enzymes, pH, etc.).
Since the introduction of the first model for chemotherapy, the use of mathematical and computational models has become widespread in examining different DDSs (14–19). These models can provide guidance on required composition and preparation methods for administration of DDSs. Various computational models have been employed for simulation of NSDDSs to examine efficacy, understand biological phenomena, and select optimal treatment plans. Based on the investigated spatial and temporal scales, these models are classified to discrete, continuous, and hybrid models (8). A summary is presented in Table 1 of important studies conducted on employing mathematical modeling of drug-containing NPs for drug delivery to solid tumors (20–45).
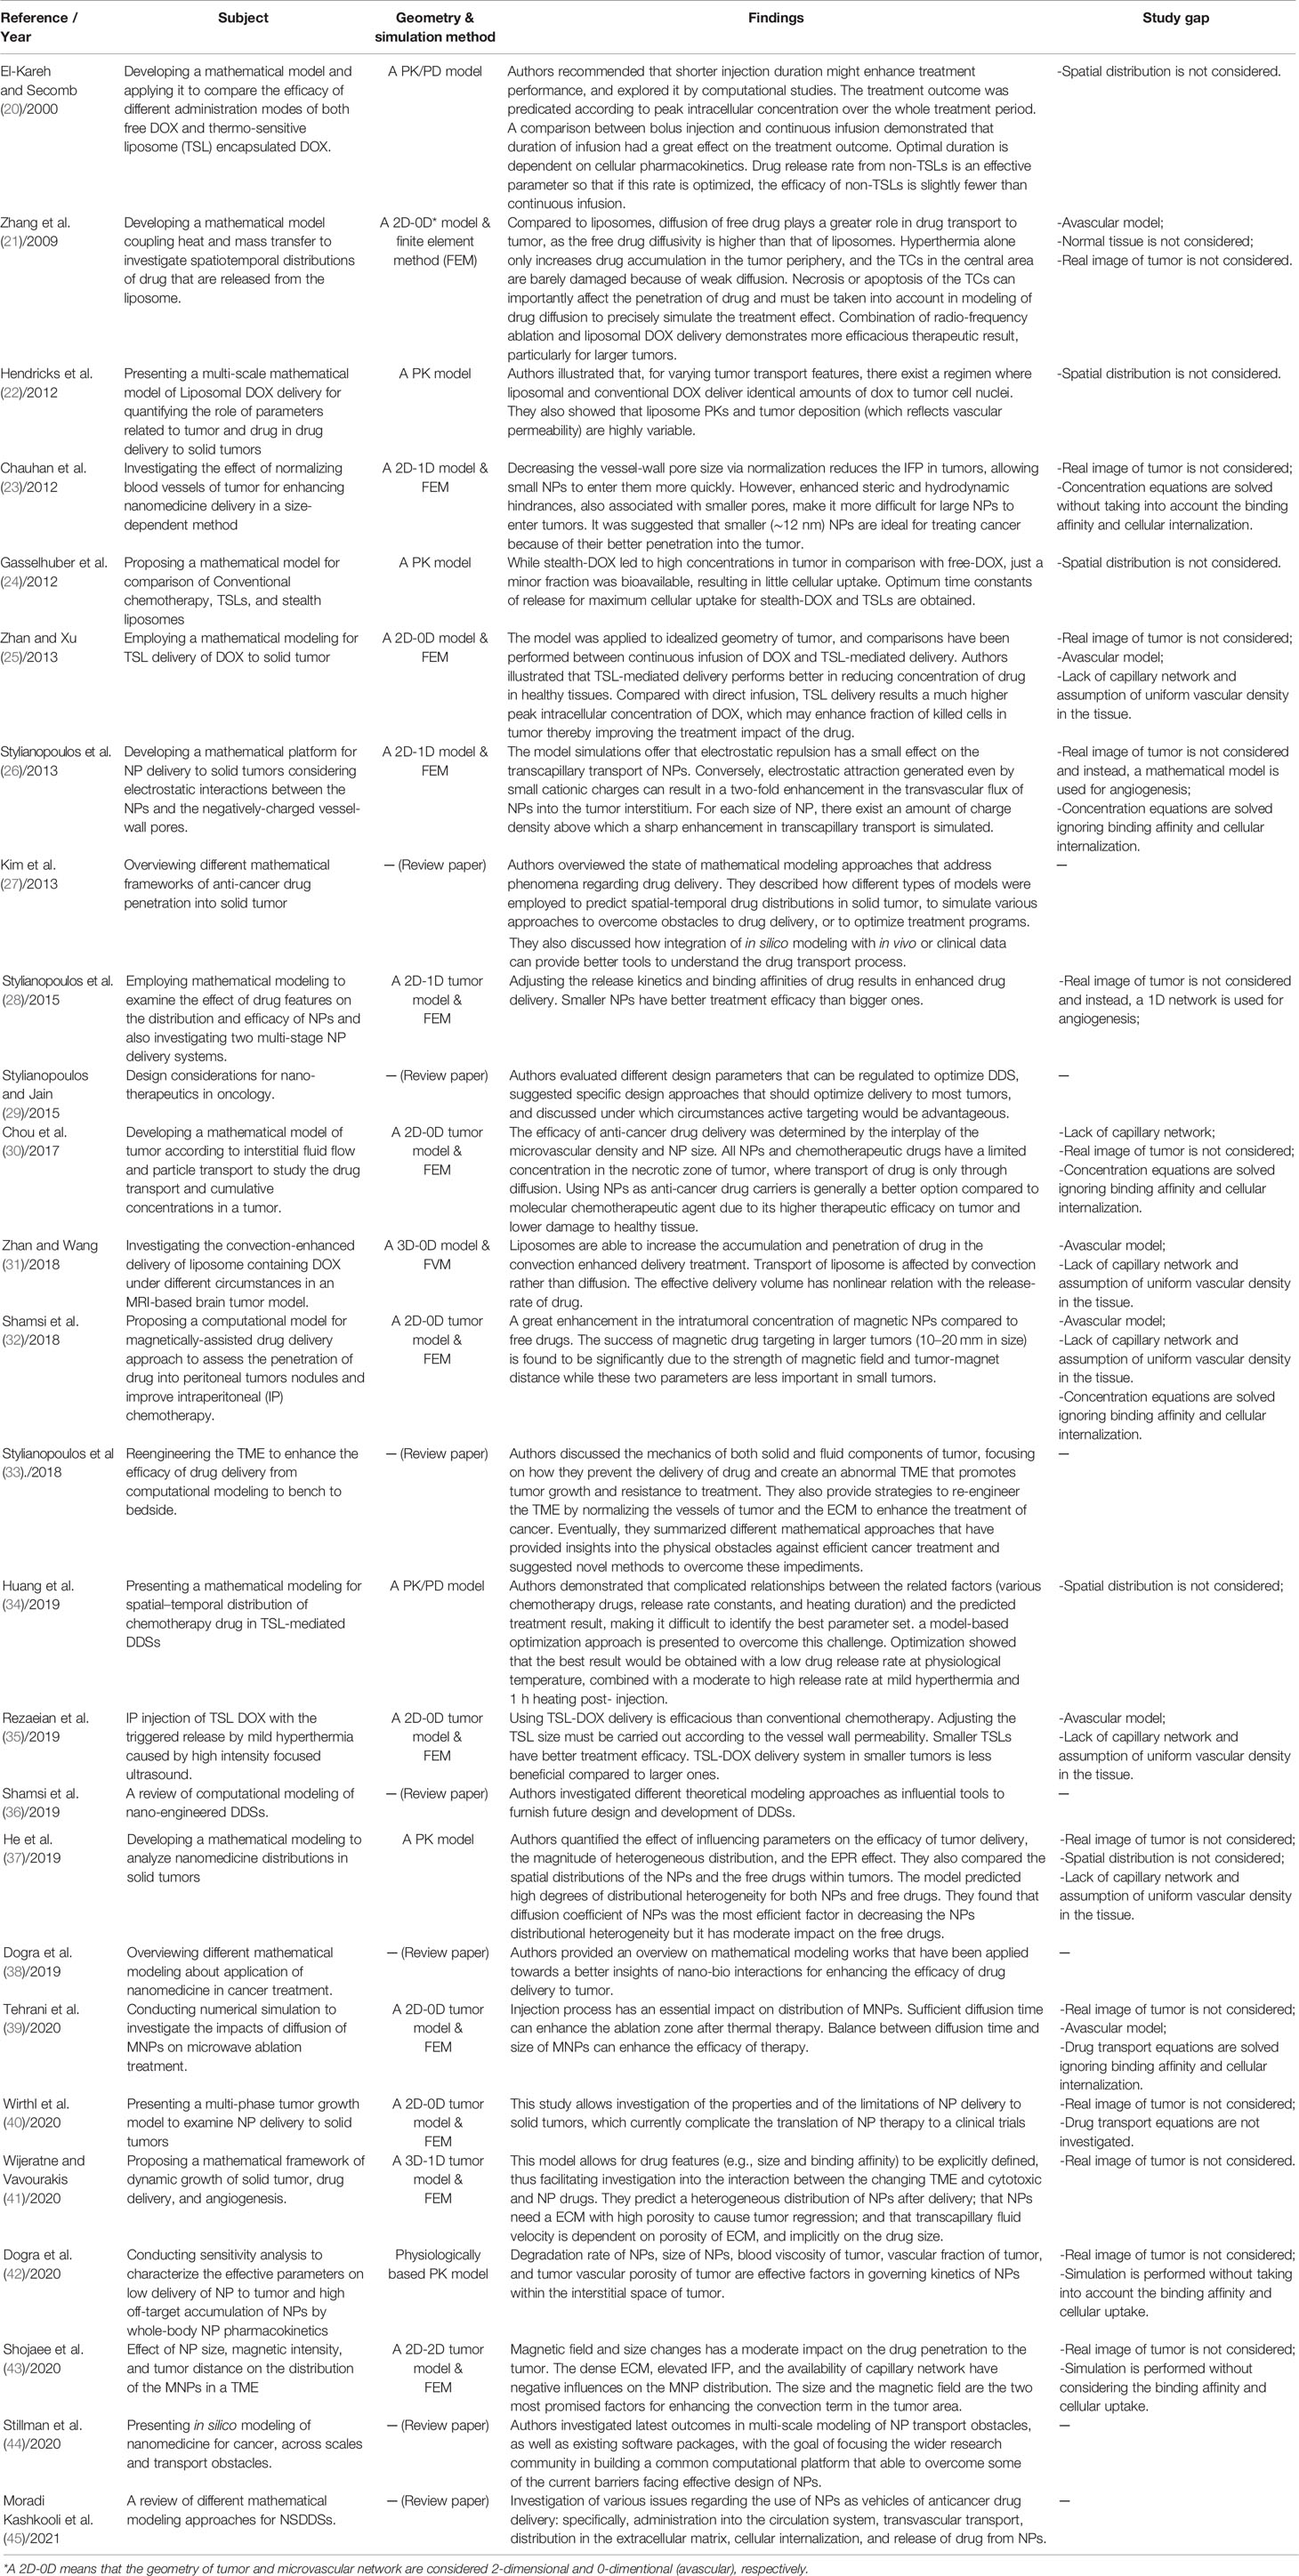
Table 1 A summary of important studies conducted on employing mathematical modeling of drug-containing NPs for drug delivery to solid tumors.
As seen in Table 1, there exist a number of gaps in the literature regarding usage of drug-containing NPs for delivery of drug to solid tumors. With this motivation, in the present study, the main contribution is to apply a computational model of three DDSs, namely (i) a conventional chemotherapy system (one-stage DDS) and (ii) a conventional two-stage DDS containing NP and chemotherapy (two-stage DDS), and (iii) a three-stage DDS containing a primary NP, a secondary NP, and the chemotherapy; on a real image of vascularized tumor. To this end, intravascular and interstitial fluid flows as well as drug transport equations are solved by considering actual conditions in tumor. Then, various parameters, NP size, binding affinity of drug ligands to the receptors of cells, and the kinetics of release rate, are studied to determine their effects on treatment efficacy. NPs employed in this study could for instance be drug-loaded nanocarriers, liposomes, or magnetic NPs. Additionally, the impact of successive treatment cycles is numerically examined considering tumor recurrence between two consecutive treatments for three investigated DDSs.
Material and Methods
In this section, a detailed description of mathematical models and their assessment are investigated. First, the mathematical equations are presented, including equations governing the interstitial fluid flow, solute transport and cellular uptake of chemotherapeutic agents, and NP delivery system. Then, parameters of model, relevant physical and transport properties, and NP-related calculations are also provided. Finally, numerical methods to assess the mathematical models, model parameters, boundary conditions (BCs), input images as geometry, computational domain, as well as solution strategy are presented.
Delivery Mechanisms
Two well-known delivery mechanisms, namely chemotherapeutic delivery and delivery through drug loaded NP, are considered in the present study. In the following, their mechanisms are described in detail.
After intravenous (IV) injection, the chemotherapeutic drugs (here, DOX) are transported to the tumor site through the blood vessels. Subsequently, they pass via the tumor vessel wall and travel the remaining distance from the vessel wall to the cancer cells. In tumor ECM, free molecules of drug agents can bind to receptors of the cells, unbind or get internalized (28, 46).
In general, only a small fraction of an injected drug reaches tumor tissue, the remaining being cleared from the body. One possible way to overcome this problem is to target drug delivery by encapsulating the anticancer drug in a nanocarrier (47). In such a system, drugs which encapsulated inside NPs are injected into the blood, and subsequently, NP characteristics cause them to be released in accordance with a pre-designed controllable procedure. NP formulations have benefits over commonly used chemotherapies since they can combine many diagnostic and therapeutic factors (48). They are also associated with significantly lower side effects, owing to their capacity for optional accumulation in tumorous tissue. To eradicate TCs, NPs have to first reach the tumor via the vascular system, then extravasate from the relatively leaky regions of the microvessels into the TME. Subsequently, NPs release their cargo in a controlled manner, while staying put at the ECM. Drug molecules diffuse into the tumor slightly more than into normal tissue and can bind to cancer cells and/or TME components eventually, becoming internalized by cells (28). A schematic of drug delivery mechanisms considered in the current study is shown in Figure 1.
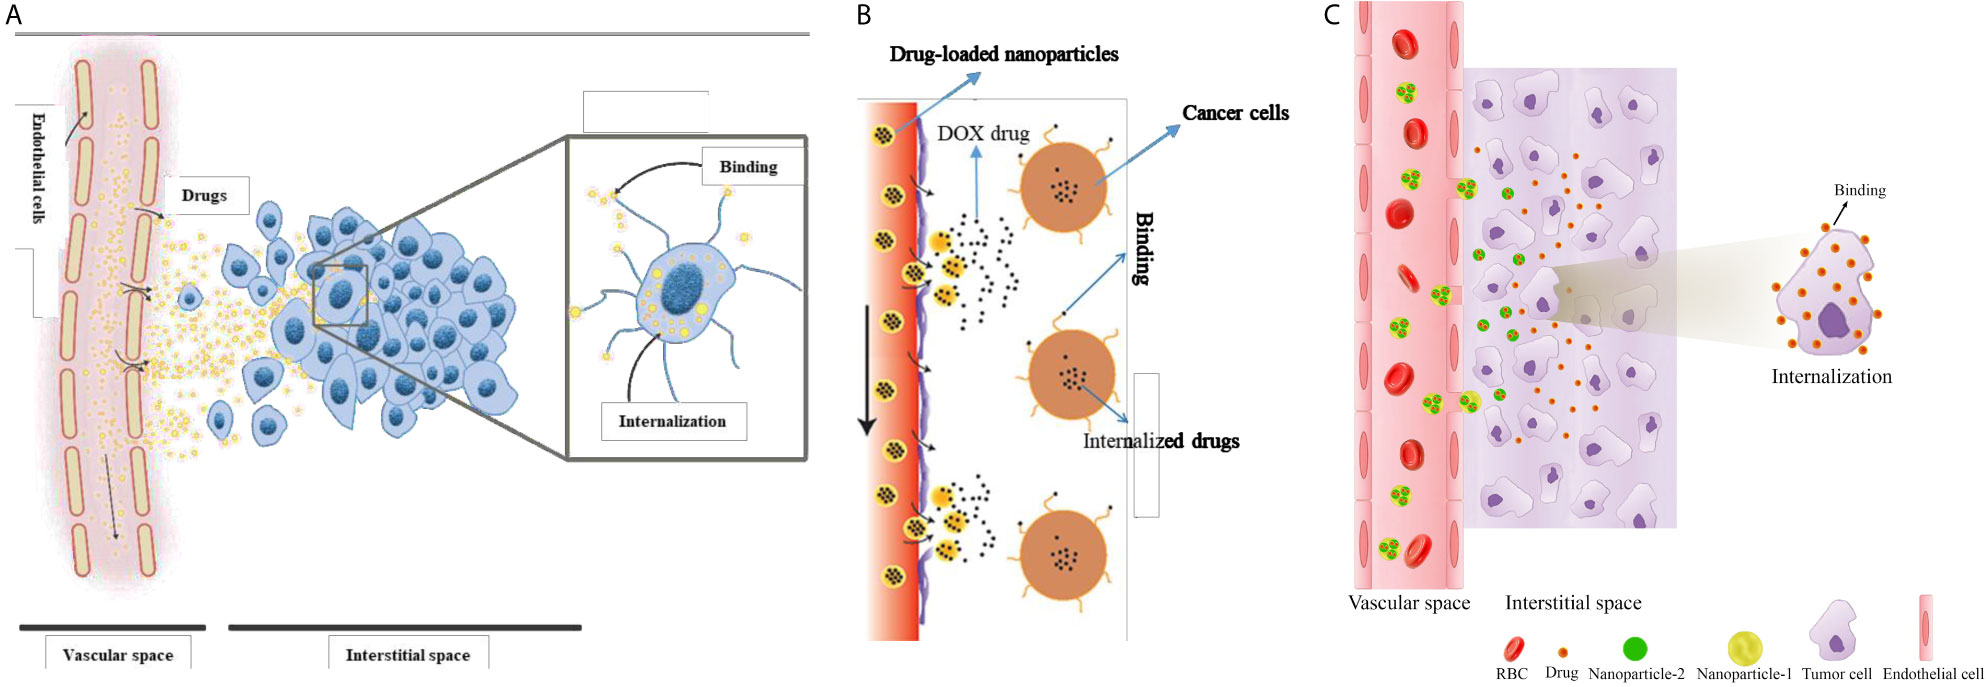
Figure 1 Schematic of drug delivery mechanisms considered in the current study. (A) one-stage DDS or conventional chemotherapeutic delivery, (B) two-stage DDS (i.e., NP delivery), and (C) three-stage DDS.
Governing Equations
The mathematical models for delivery of drugs to solid tumors consist of equations as:
i. Mass and momentum conservation for interstitial fluid flow;
ii. Mass transport for the free, bound, and internalized drug;
iii. Mass transport for nano-encapsulated drug; and
iv. Treatment efficacy for intracellular drug concentration.
Detailed descriptions of each aspect of mathematical modeling are provided next.
The dynamics process in drug delivery includes binding and unbinding of drug agent ligands with receptors of the cells at the rates of KON and KOFF, respectively; exchange of drug between capillary network and interstitium, and influx/efflux of drugs from interstitium to TCs, internalization of drugs to cellular space, and finally cell-killing by drug agents. The cell-killing rate is governed by a model according to the predicted intracellular concentration of anticancer drugs. In the case of two-stage and three-stage DDSs, additional equations describing the transport of NPs in ECM are required. Mathematical modeling of fluid flow and solute transport in interstitium, convection-diffusion-reaction (CDR) modeling of drug transport in the extracellular space (for conventional chemotherapy, two-stage, and three-stage DDSs), as well as FKCs and tumor-cell survival equations are presented in the following sections, respectively.
Fluid Flow in Interstitium
First, the interstitial fluid flow equations are solved to provide the basic biomechanical environment for transport of drug. Darcy equation, which demonstrates the relationship between interstitial fluid velocity (IFV) and interstitial fluid pressure (IFP), is employed to describe interstitial fluid flow in a porous environment as follows (16):
where vi and κ are the IFV and the hydraulic conductivity. Considering the presence of source/sink terms in biological tissues, the continuity equation is modified as (7):
in which ϕB is the rate of fluid flow from the microvessels to the extracellular matrix (ECM) and and ϕL is the rate of fluid flow from ECM to lymph system, defined as (7):
in which S/V demonstrates the surface area per unit volume of microvessels. and PL are the lymphatic filtration coefficient and lymphatic pressure, respectively.
Combining Eq. (2) with Eq. (1), we arrive at:
Transport of Drug in the Interstitium
The comprehensive model for drug transport in the interstitial space includes:
- Transport in ECM by diffusion and convection mechanisms,
- Transport across microvessels by diffusion and convection mechanisms, and
- Binding to cells and internalization.
The drug transport equation for biological tissue can be written as (18):
in which ФB is the drug transport rate through the microvessels into the interstitial space, and ФL is the drug transport rate from interstitial space into the lymph system. ФB is defined according to Patlak’s model, as (18, 49):
Pe demonstrates the Peclet number, σf is the coefficient of filtration reflection, P represents the permeability coefficient of microvessels, and Cp is the injected drug concentration.
The drug transport rate through lymphatic microvessels has been considered only in healthy tissue as (18, 49):
A bolus injection of chemotherapeutic agents, representing the initial vascular concentration of the drug, is modeled as (50):
where C0 and kd are the initial concentration and blood circulation decay, respectively.
Convection-Diffusion-Reaction Modeling of Drug Transport in the Interstitium
The drugs exist in different forms as: NPs in the interstitial space (CN), free drugs in the interstitial space (CF), bound drugs (CB), and intracellular drugs (CINT) (20, 49). In tissues, with regards to the existence of mass flow source/sink, a system of equations, which is called CDR equations, is utilized to represent the process of drug delivery. The general block diagram of the model of current study considering NPs and chemotherapeutic drugs for two-stage DDS is shown in Figure 2.

Figure 2 Block diagram of the current study for computational modeling of drug transport of two-stage DDS.
Conventional Chemotherapy
The CDR equations for conventional chemotherapy are as follows (17, 41):
in which CF demonstrates free drug concentration, CB bound drug concentration, CINT internalized drug concentration, and Crec is the concentration of cell-surface receptor. In this equations, v is the IFV, D is the diffusion coefficient, KON is the association rate, KOFF is disassociation rate, KINT, represents the cellular internalization; and φ demonstrates the tumor volume fraction available for the drugs.
Two-Stage Drug Delivery System
Systemically administered NPs, as demonstrated in Figures 1 and 2, are transported to tumor sites through the circulation system, undergo transvascular extravasation followed by distribution in the interstitial space, and are finally delivered to cancer cells. For transport of an NP containing chemotherapeutic agents (CN), the system of equations is adjusted thus (51):
in which Krel, DN, and α are respectively the drug release rate from the carrier, its diffusion coefficient, and the number of chemotherapy molecules contained in the nanocarrier.
Three-Stage Drug Delivery System
Three-stage NP drug delivery system is an efficient option to overcome the barriers of two-stage DDS in ECM. The system of equations for three-stage DDS, as demonstrated in Figure 1C, is as following (32):
in which CN1 and CN2 are the primary and secondary NP concentrations, respectively. Krel1 is the rate constant for the release of the secondary NP from the primary one and Kel2 the rate constant for the drug release from the secondary NP. α and β are the number of secondary NPs released by the primary and drug particles released by the secondary NP, respectively.
Fraction of Killed Cells
Despite its cardiotoxicity, the drug DOX is frequently employed in tumor treatment. DOX is a standard-of-care, DNA-damaging agent employed in the treatment of multiple tumors (e.g., bladder, breast, and lung cancers). Using the internalized drug concentration, the efficacy of drugs was calculated according to the empirical equation obtained for DOX (52). The FKCs parameter is defined, as (53):
in which SF is the fraction of cells remaining after treatment and ω is a fitting parameter specified for DOX based on the results of experiments (54).
Tumor-Cell Survival
The number of TCs after a period of time (ni), which is obtained through Gompertz’s model, depends on intervals between chemotherapy sessions (t) (55). Gompertz equation is a function of three parameters (as demonstrated in Eq.)15(): the number of TCs surviving after the ith treatment (Ni), the number of saturated cells after a very long period (N∞), and eventually the rate of tumor progression (b).
The number of surviving TCs after each therapeutic phase will be examined as a criterion of treatment efficacy evaluation. This criterion is obtained by using the FKCs according to Eq. (14). The number of remaining TCs as a result of the difference between the number of cells after (Ni) and before (N0) treatment will also be examined as a criterion for evaluating treatment efficacy. In the present model, SF is also defined, as (30):
The initial numbers of TCs here, adopted from York et al. (55), are N0 = 5 × 10⁹, N∞ = 3.1 × 10¹², and b = 0.0283 month-1. The number of cells for healthy tissue was considered to be N1 = 4.64 × 10¹² (55). The cell number is assumed to depend on tumor volume; i.e., when the cell number decreases, the tumor shrinks (R reduces). The ratio of the density of healthy tissue to the density of TC is considered to be 0.2 (56), and it is also assumed that the microvascular density distribution in the computational field does not change after each treatment. In addition, the regrowth of healthy tissue cells was examined by using Eq. (15) with the assumption that the growth rate (b) of healthy tissue is half that of the tumor (30).
Model Parameters
Interstitial and Drug Transport Parameters
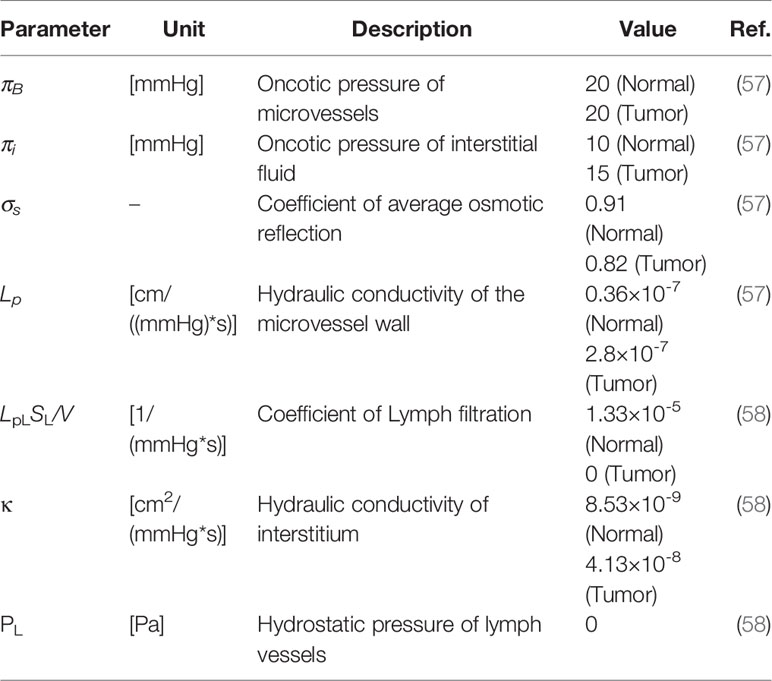
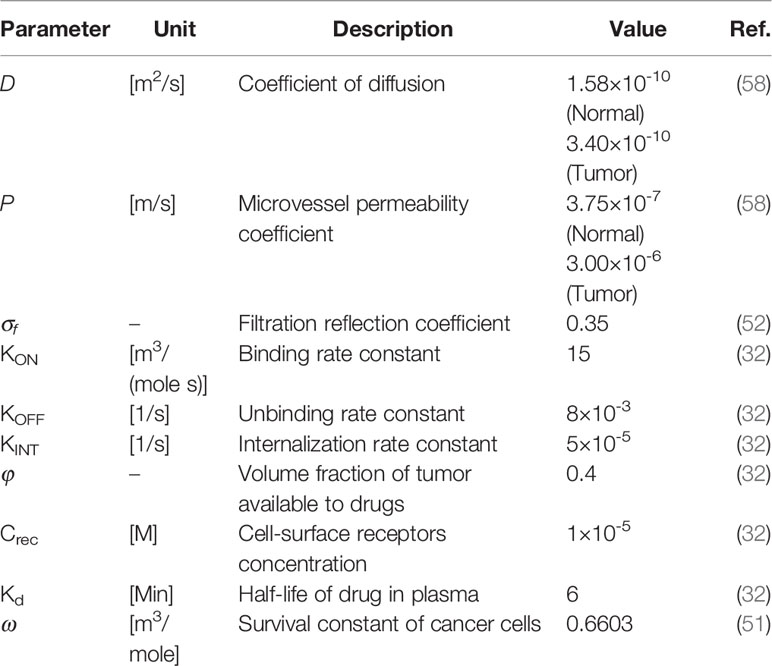
Tables 2 and 3 demonstrate both the interstitial and DOX drug transport parameters, respectively, including both tumor and healthy tissues. Table 4 represents the baseline state parameters for NSDDS for 20 nm particle size and 200 nm vessel-wall pore (VWP) size.
NP-Related Calculations
The hydraulic conductivity, vascular permeability, and reflection coefficient are calculated for the NPs by using the theory of particle transport through cylindrical pores (28, 59):
in which γ is the fraction of the surface area of a porous vessel-wall, ro is the pore radius, η is the viscosity of water at 310 K, and L is the vessel-wall thickness. Do represents a particle diffusion coefficient in a free solution at 310 K, given by the Stokes-Einstein relationship as in (53, 59):
in which Kb, T, and rs are the Boltzmann constant, the temperature, and the diffusing particle radius, respectively.
H and W are diffusive and convective hindrance factors, respectively, and related to hydrodynamic and electrostatic interactions. Neglecting electrostatic interactions (E=0), H and W are reduced to (53, 59):
where F is the partition coefficient and is defined as (53, 60):
in which λ is the ratio of drug particle size to the VWP size, as follows (53, 59):
Kt and Ks coefficients in Eqs. (21) and (22) are given by (53, 59):
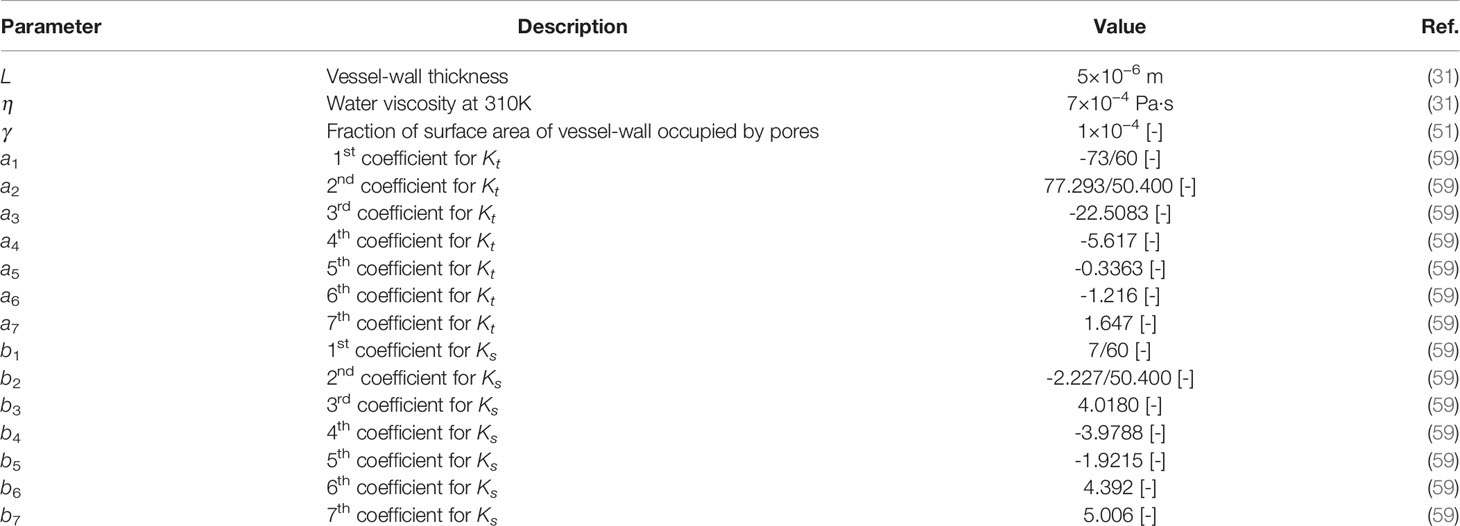
Parameter values used in the Eqs. (17) to (25) are demonstrated in Table 5.
Model Geometry and Boundary Conditions
In this study, a tumor model (as shown in Figure 3A) is employed as an input geometry based on real image of a tumor with a capillary network surrounded by healthy tissue, extracted from Roudnicky et al. (60). About the circumstance of this input image, it should be mentioned that this type of tumor is inoculated in a mice by injecting human A431 squamous cell carcinoma (SCC) cells (60). This image was taken about 12 days after tumor inoculation. In fact, 2 days after inoculation, thrombospondin-2 (TSP2), an anti-angiogenic matricellular protein that inhibits tumor growth and angiogenesis, was injected for 10 days and subsequently this image was taken. After image-processing, a computational field is considered with the existence of a tumor in the middle of the domain as well as the parent vessels (Figure 3B).
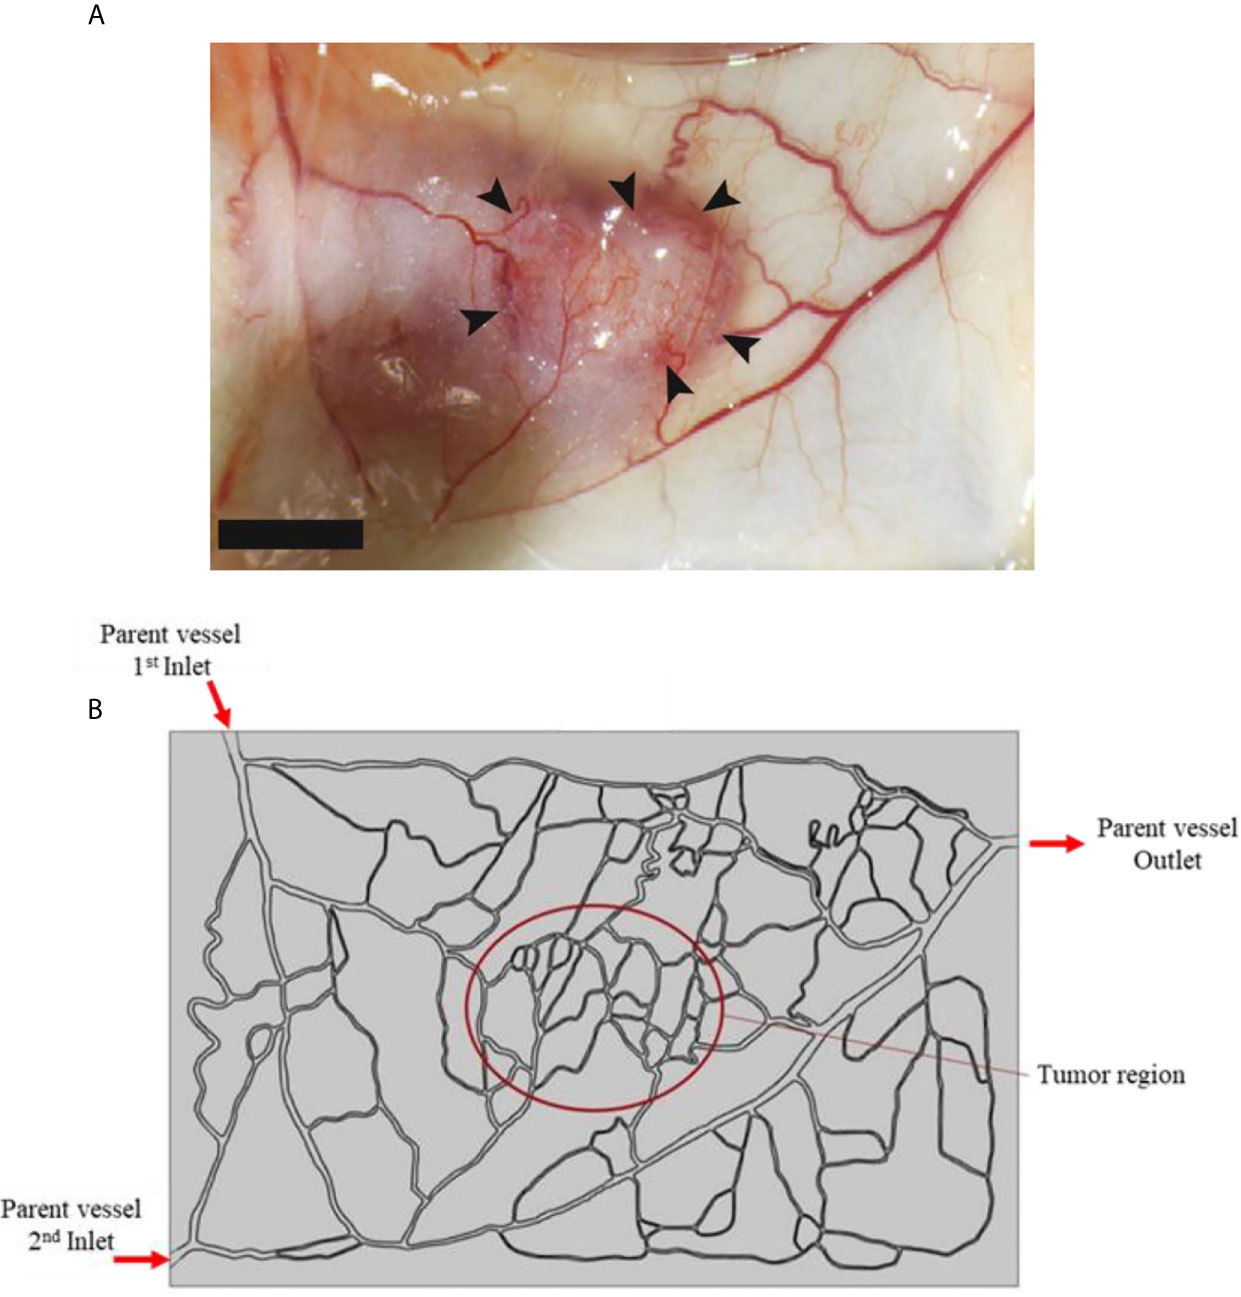
Figure 3 (A) Real image of tumor, and (B) computational field considered in numerical simulation which is obtained by image-processing of realistic image.
Two boundaries are assumed in the computational field: the inner boundary (between the tumor and the normal tissue), and the outer boundary (at the outer edges of computational field). For the inner boundary, the continuity BC is considered for IFV, IFP, as well as concentration and its flux. For the outer boundary, in which the IFP is constant, the Dirichlet BC is used for fluid flow, and the open boundary is employed for concentration (50). The input and output pressure amounts for the parent vessels are selected as: PInlet,1 = 25 mmHg, PInlet,2 = 25 mmHg, and POutlet =10 mmHg, according to realistic physiological conditions reported in literature (50, 61).
Solution Strategy
There exist two distinct phases for solving the present problem: steady-state and transient. Calculations related to blood flow in a model with a discretized capillary network in the computational field provides a system of non-linear equations. Thus, an iterative approach was applied to solve the fluid flow equations. The blood flow and interstitial fluid flow were solved concurrently, where IBP and IFP were coupled via Starling’s equation (Eq. (3) in supporting file). Obtained values for IBP, IFP, and IFV were employed for solving the transient equations of CDR to achieve different drug concentrations (CN1, CN2, CF, CB, and CINT) as well as FKCs.
After image-processing, geometries were meshed and analyzed utilizing the COMSOL Multiphysics software-version 5.5a. The coupled nonlinear set of the above-mentioned governing equations and also the BCs were assessed through FEM. A segregated approach is applied to solve the equations with the time-step of 0.1 [s] and relative tolerance of 0.001. A six-fold drop of residuals is chosen as the criterion for convergence. For solving drug delivery equations in vascularized tumors, a Core (TM) i24 CPU @ 3 GHz with 32 GB RAM system is used.
Results and Discussion
Characteristics of tumors are determinant factors in transport of drug and final efficacy of treatment. Since chemotherapy drugs are carried by the circulatory system, the tumor vasculature features play an important act in delivery of drug. In the present study, a tumor model incorporating details of capillary network distribution is employed to evaluate the impact of heterogeneous distribution of capillary network on delivery of drug. This is followed by studies of transport of drug in tumors with microvascular density (MVD). First, the results of chemotherapeutic agent delivery for a case study, extracted from real image of tumor, are proposed, and different parameters are investigated in detail. Subsequently, results of computational modeling for delivery of NPs are presented.
Validation of the Results
In this study, validation is performed with the same governing equations as the literature (28) for the FKCs over time (Figure 4). As is clear, there is a correspondence between the results of the present study and those in the literature so that by considering the real geometry and physics, the FKCs has a similar trend. However, considering similar conditions, its value has about 4% difference, due to differences in tumor geometry, computational domain, and structure of capillary network. One should note the 2D geometry of the tumor and capillary network investigated in this study, while Stylianopoulos et al. (28) utilized 1D for the capillary network.
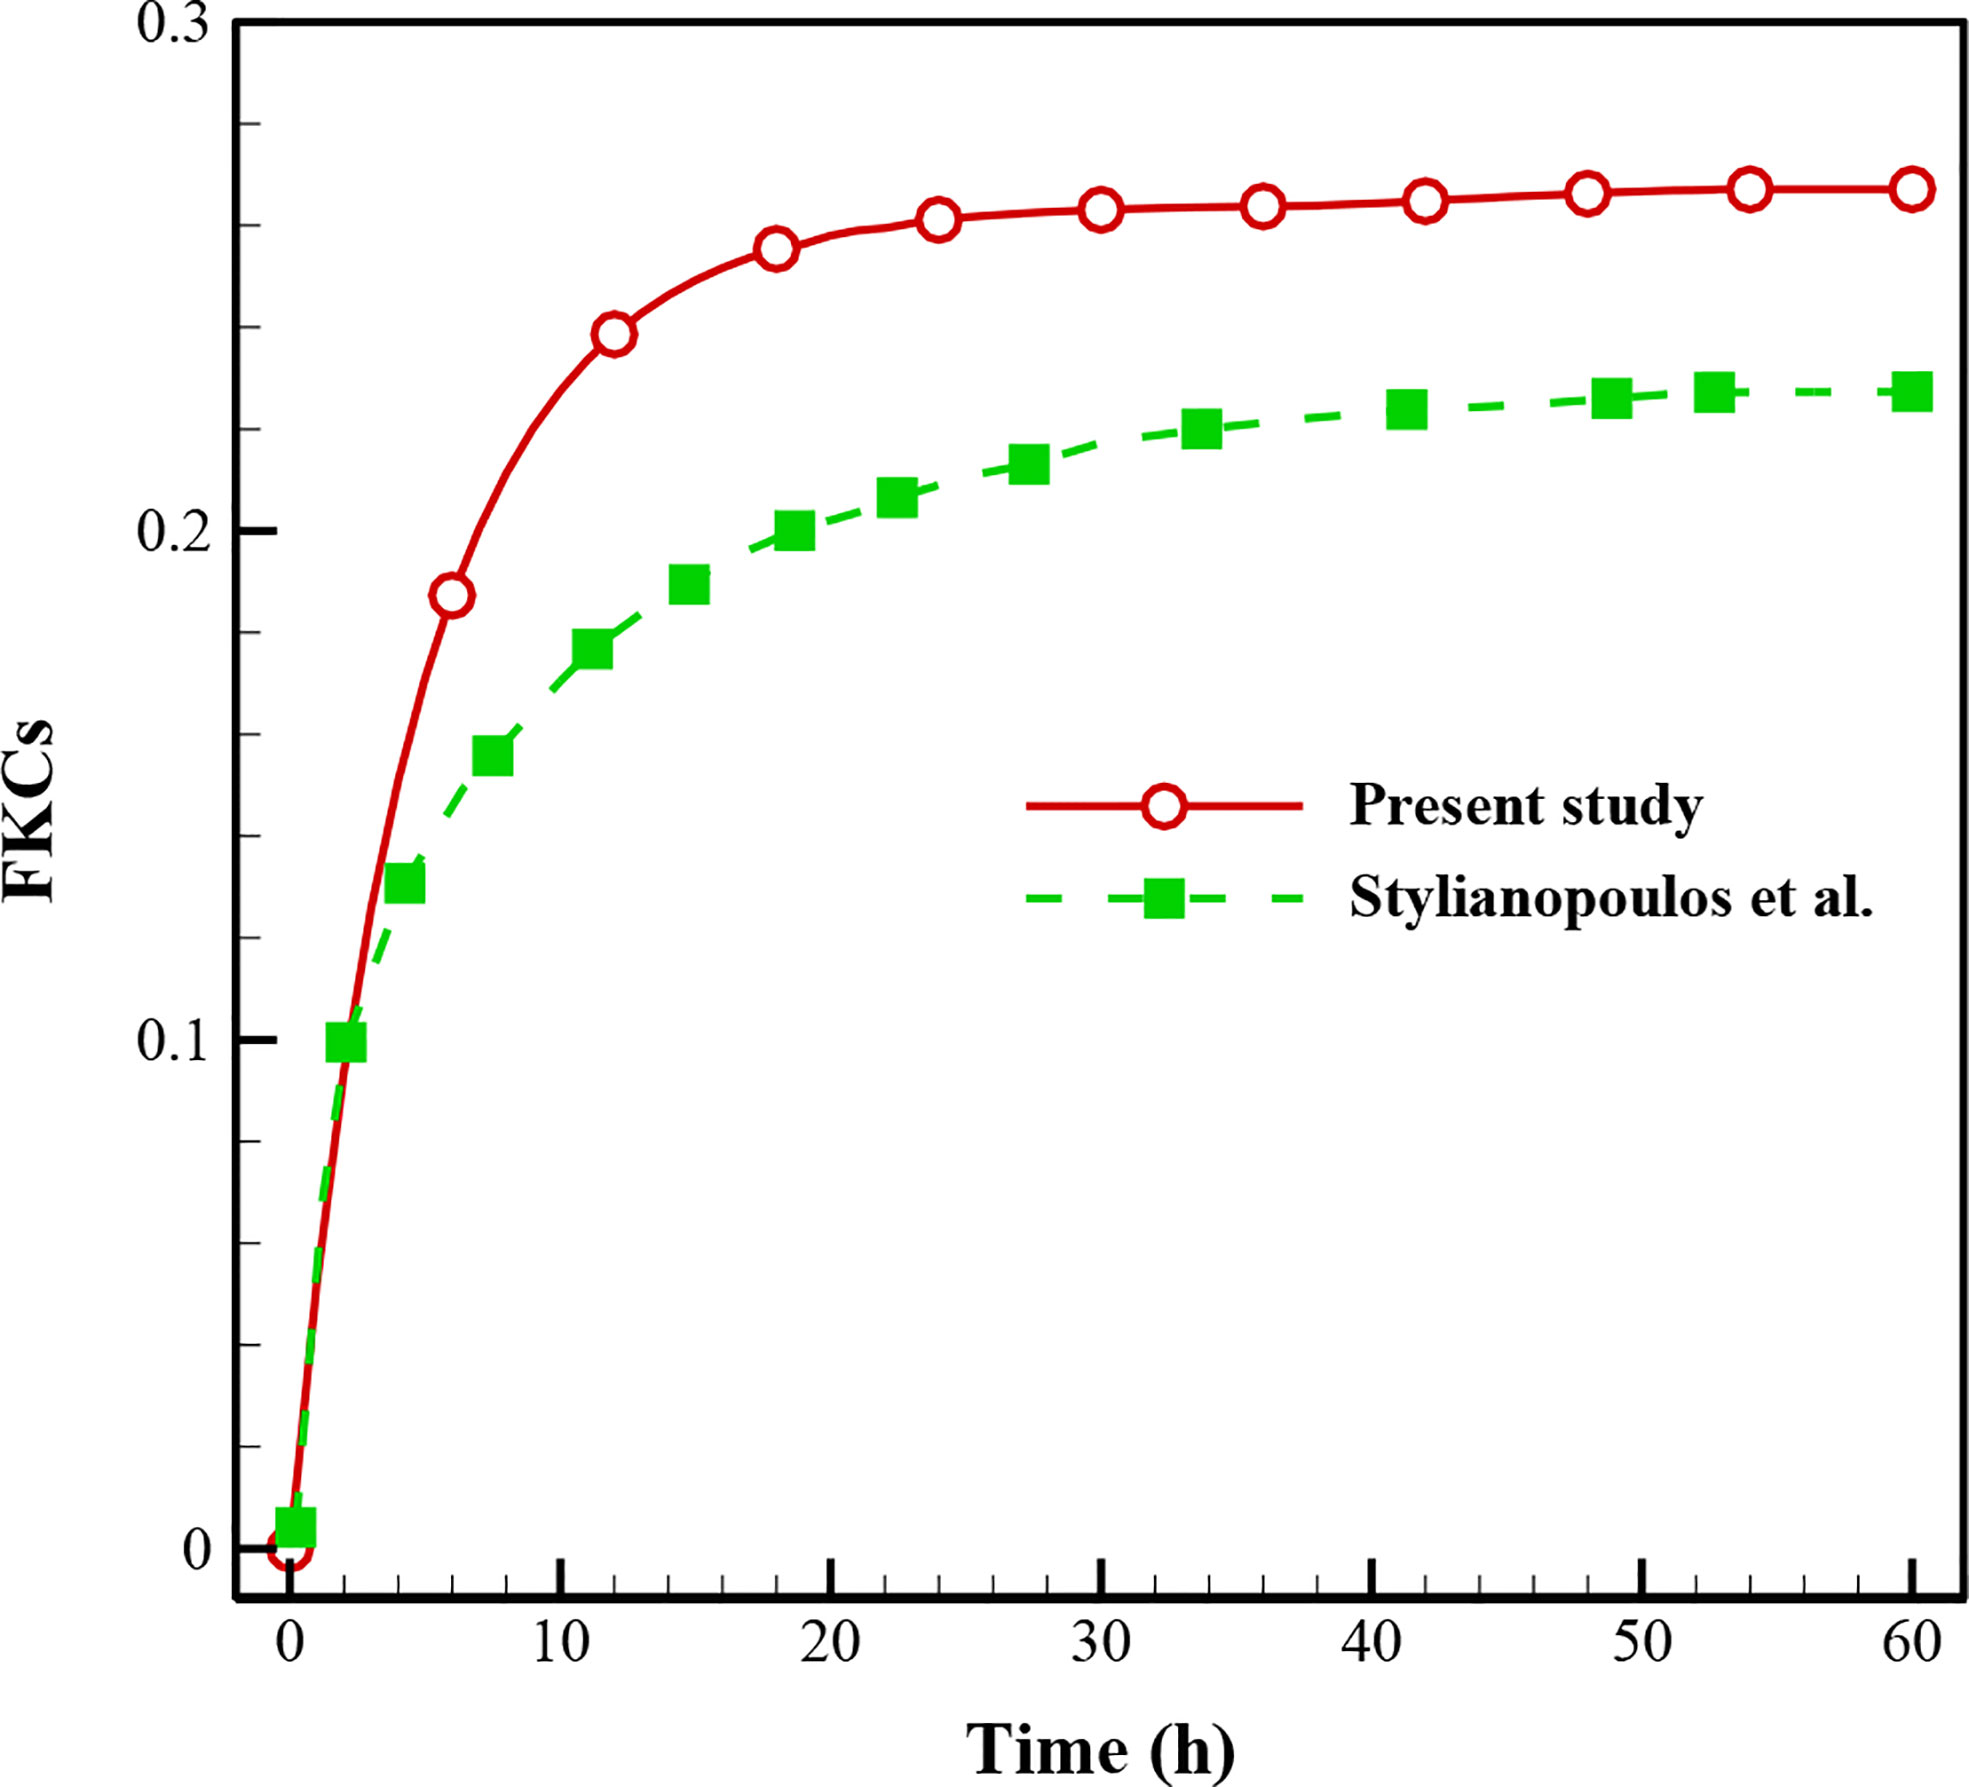
Figure 4 Comparison of the results with previously published study (28) using FKCs over time.
Baseline Model Analysis
The spatial-temporal distribution of the non-dimensional concentrations of drug that is taken up by TCs in the tumor and surrounding normal tissue for three investigated DDSs ─single-stage (conventional chemotherapy), two-stage, and three-stage ─ are shown in Figures 5–7. These non-dimensional concentrations were obtained at a given time by dividing that concentration at any point by the maximum concentration in the entire field. Total concentration is defined as the sum of various drug concentrations. In single-state DDS, free drug concentration reduces over time and the drug gradually turns into a bound drug. Then, the bound drug slowly enters the intracellular space and is consumed there. It is also obvious that drug concentration in the tumor is greater than that in the normal tissue. The reason for this is the greater extravasation rate from microvasculature in the tumor area and additionally the highly-dense MVD in this region. The highest value for total concentration takes place in the tumor zone and this value is several times higher than the concentration in the normal tissue. In two-stage DDS, the loads of NPs are released in the interstitium in a free drug form and the remaining process is similar to single-state system. In three-stage DDS, the primary NPs release the second NPs, and the remaining process is similar to previous two-stage DDS. represents the internalization of drugs to the cellular space, determining the succeed of drug delivery in killing cancer cells (i.e., leading to higher FKCs). Another important factor for efficient drug delivery is uniform distribution of drug in tumor, expressing the penetration depth of drugs extravasated from microvascular network. Comparison of the distribution of different drug concentrations in three investigated systems demonstrates that three-stage DDS provides much more uniform drug distribution than the other two ones. After that, two-stage system has more efficient drug distribution compared to single-stage DDS. From Figures 5–7, it is also clear that in conventional chemotherapy, there exist a small concentration of drug in healthy tissue, leading to side effects; whereas, in both NSDDSs, the side effects are negligible.
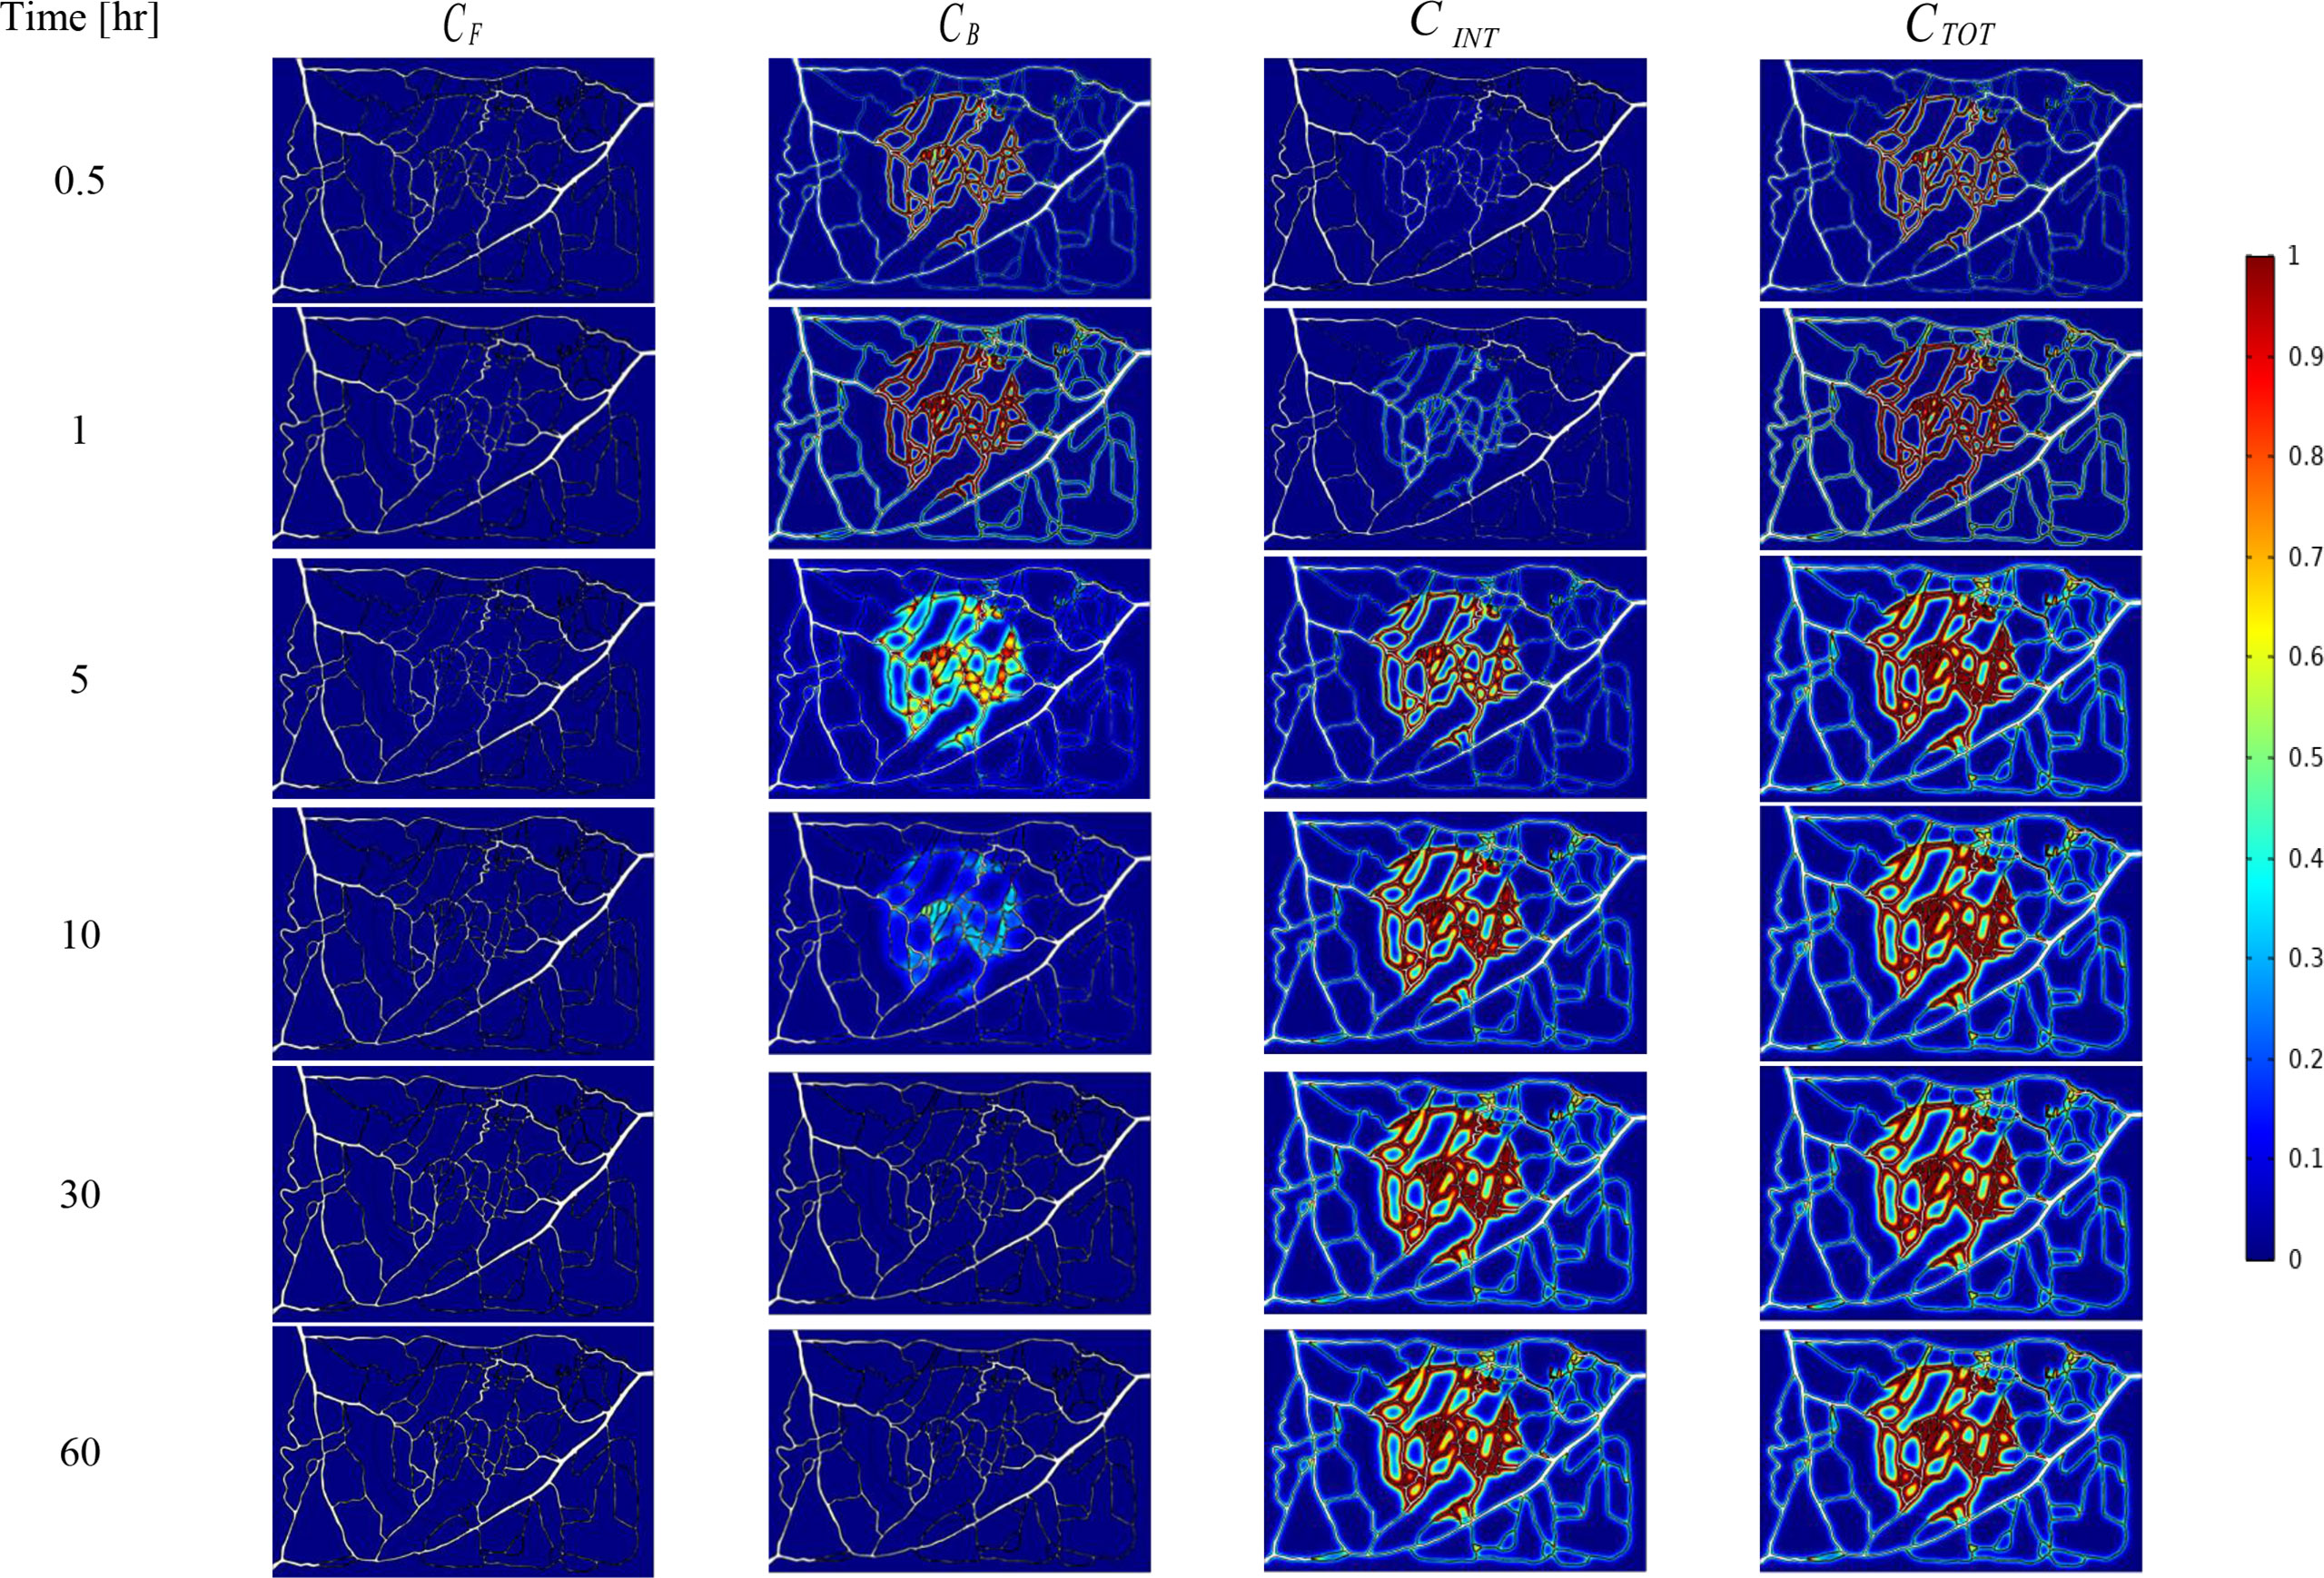
Figure 5 Spatiotemporal distributions of concentrations of chemotherapy drug in tumor and its surrounding normal tissue with increasing time. These non-dimensional concentrations were calculated at a given time by dividing that concentration at any point of geometry by the maximum concentration in the whole domain.
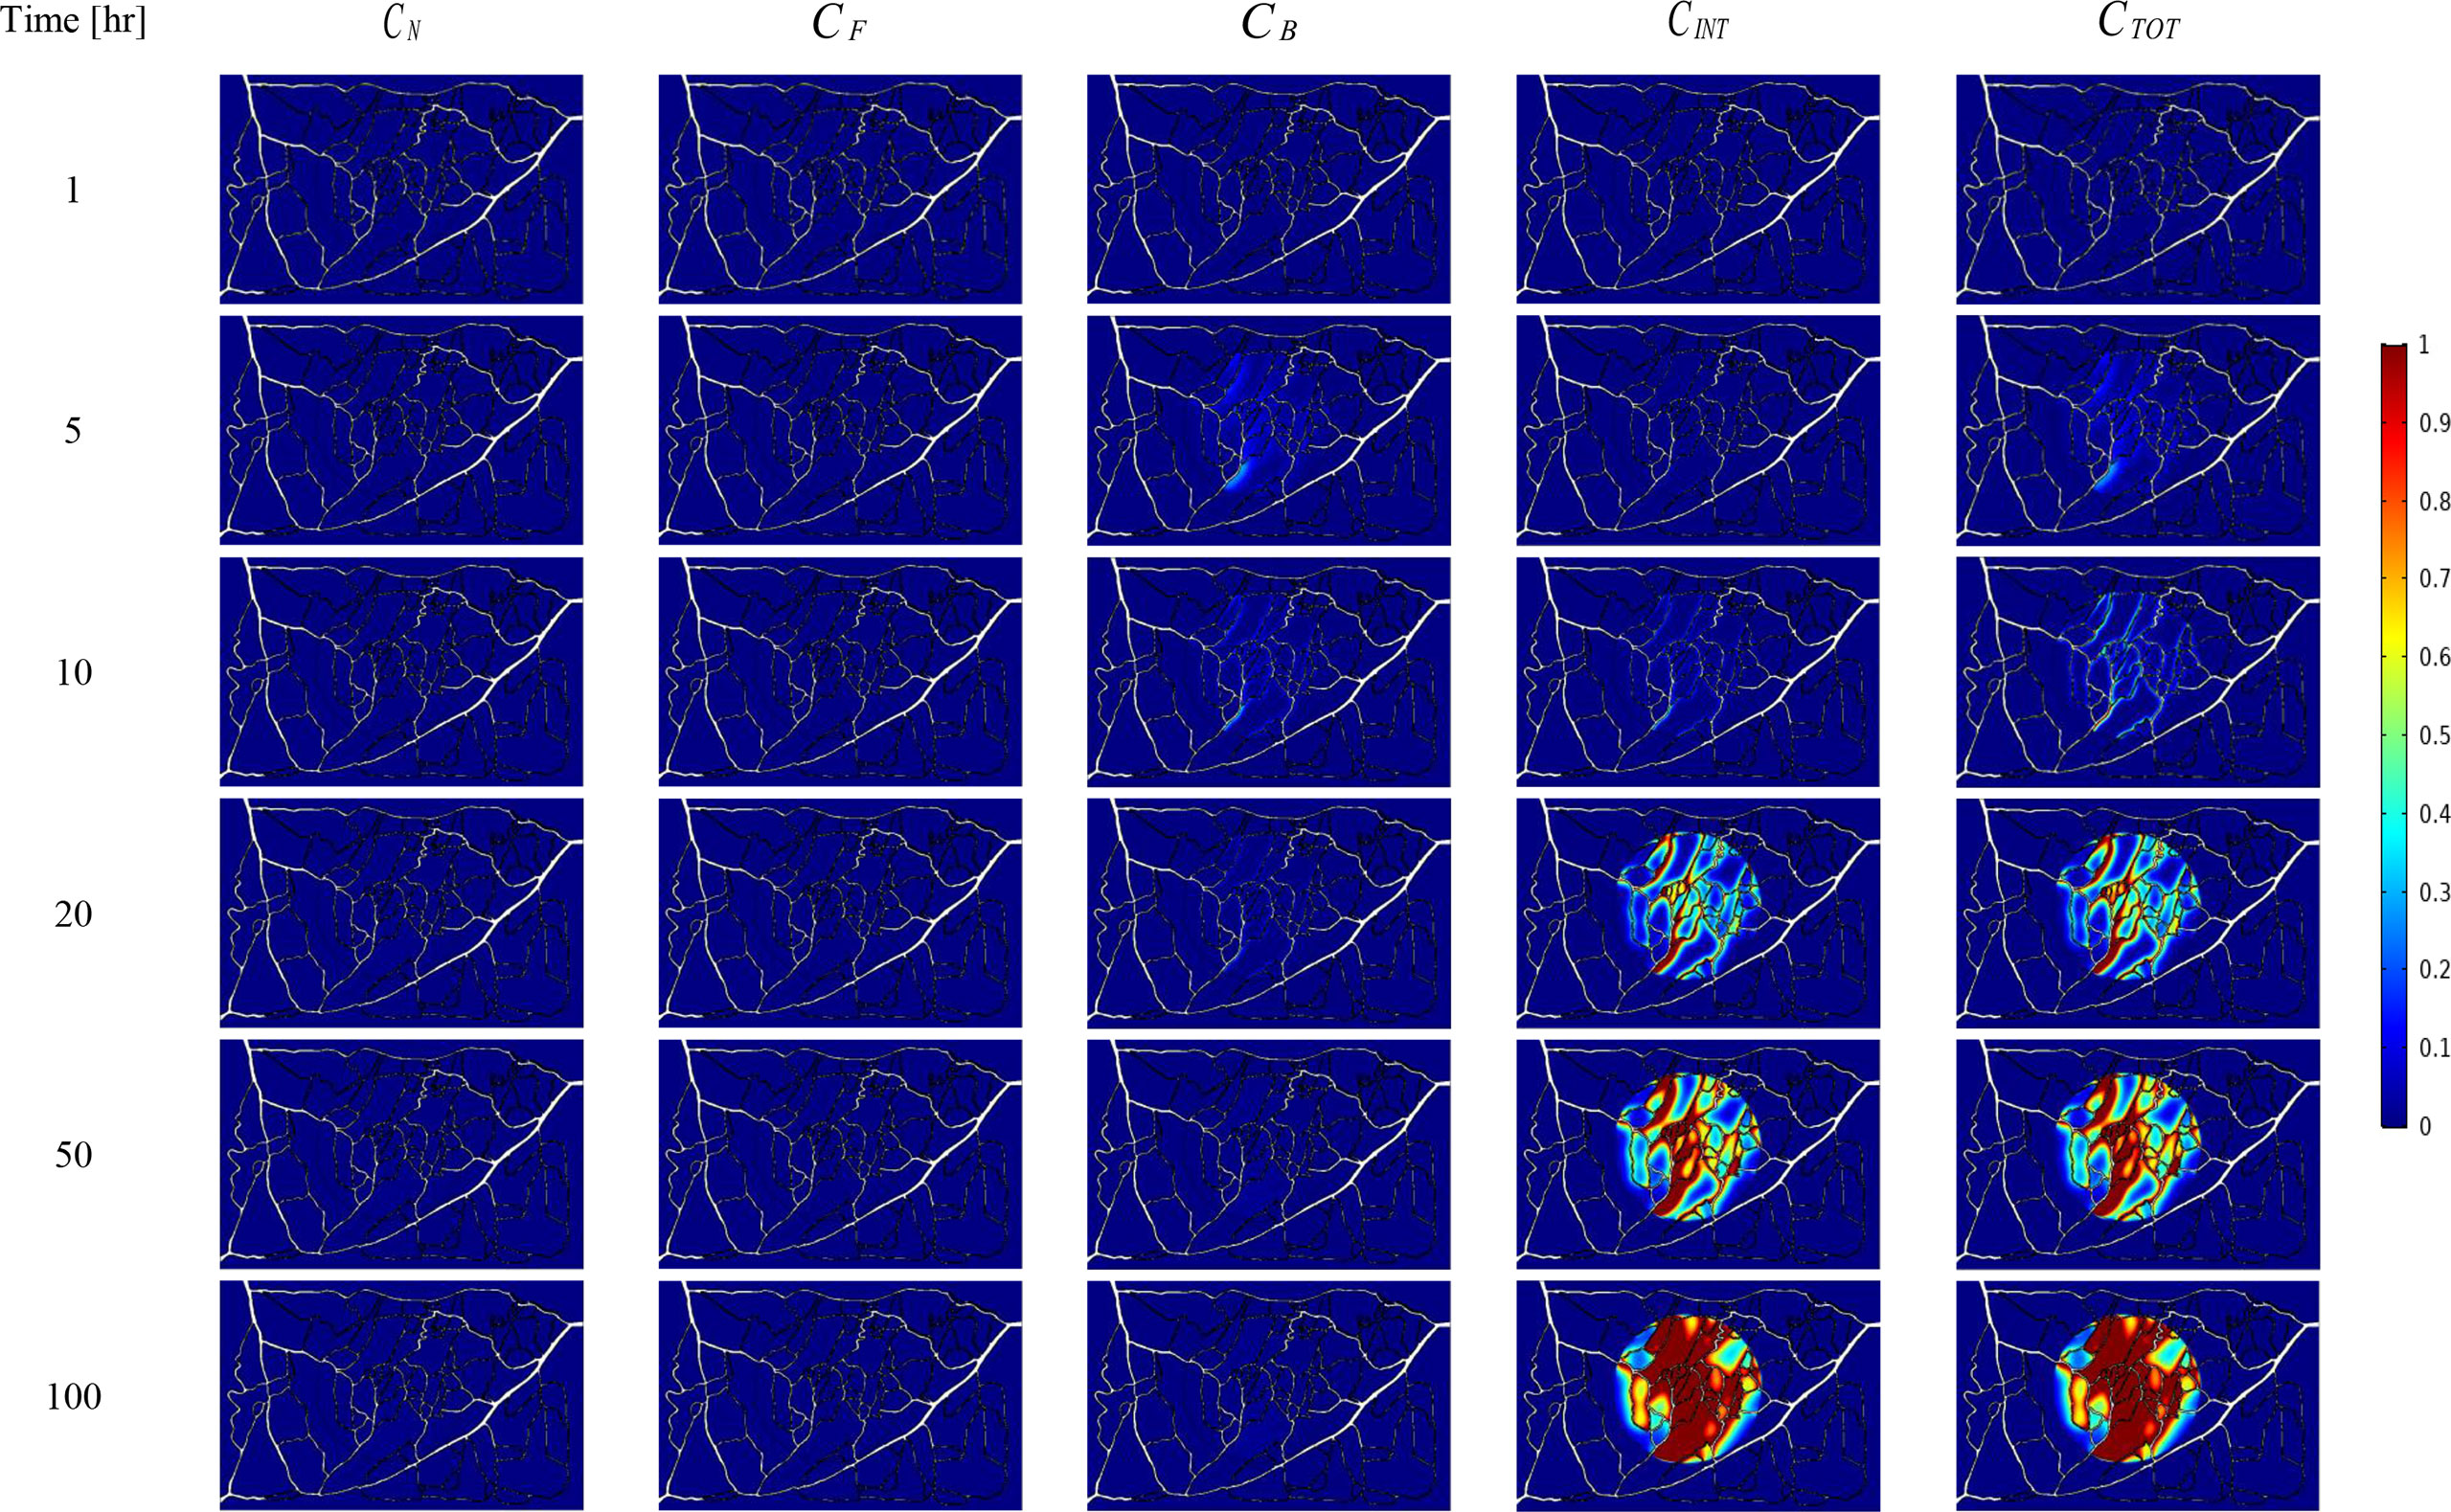
Figure 6 Spatiotemporal distributions of concentrations of drug-loaded NPs in tumor and its surrounding normal tissue with increasing time.
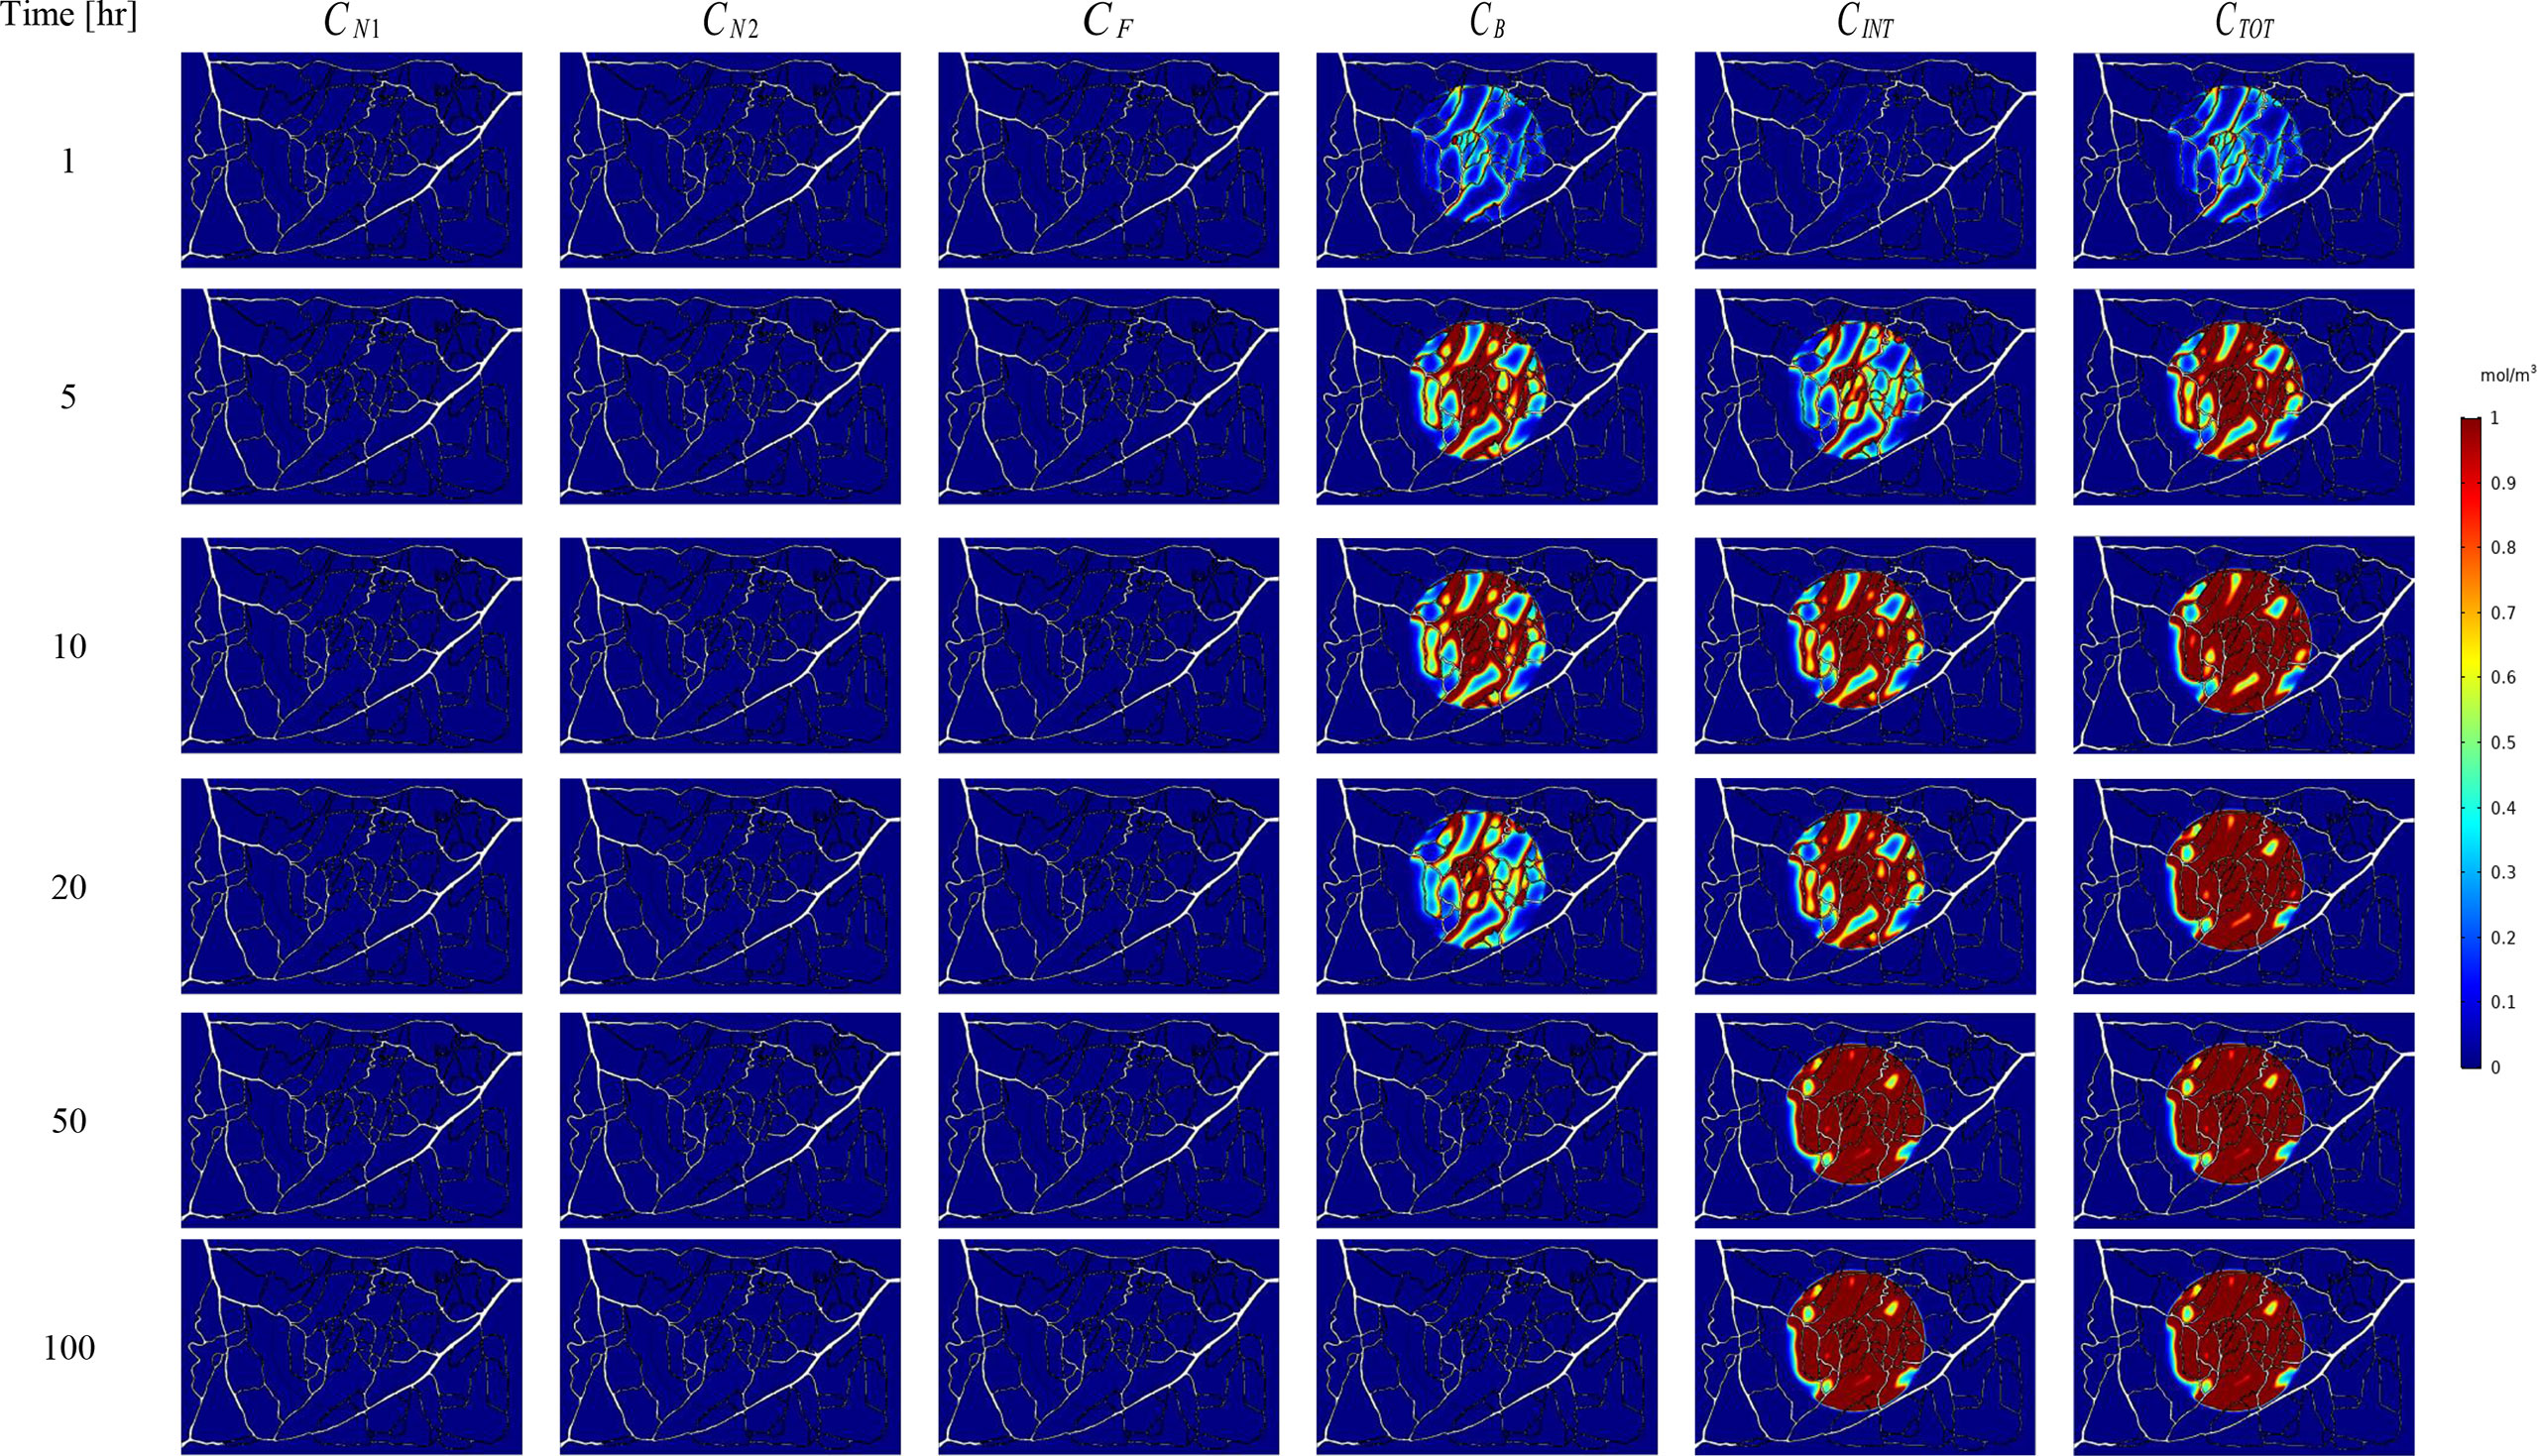
Figure 7 Spatiotemporal distributions of concentrations of three-stage NPs in tumor and its surrounding normal tissue with increasing time.
Analysis of NP Drug Delivery System
Parameters of the TME that inhibit the delivery of NPs into the tumor include the size-dependency of the transport both across the tumor microvessel wall and then via the interstitial space of tumor. Transport across the tumor vessel wall is determined by the relative size of the particle compared to the VWP size. On the other hand, not only the size but also other parameters of drug, such as the drug release kinetics might play a crucial role in the outcome of the therapy. Therefore, one of the main goals of the present study is to determine under what circumstances two-stage and three-stage DDSs can be beneficial, relative to one another or to conventional chemotherapy. In the following, the results are presented for two- and three-stage DDSs. Then, a parameter study is carried out to examine the effect of three important parameters ─size of NPs, binding affinity, release rate of drug─ on the real geometry of tumor.
Two-Stage Drug Delivery System
The effect of release rate of drug for two sizes of NPs are demonstrated in Figure 8. Overall, FKCs for NPs with the size of 20nm is higher than that of 100nm, in all investigate release rates of drug. The main reason is the greater blood half-life of smaller NPs compared to larger ones. Therefore, a 20nm NP is expected to circulate in the blood for a longer time in comparison with a 100nm particle, further improving efficacy of delivery systems. Moreover, it is demonstrated that slower and continuous release of the chemotherapeutic agents from NPs have better treatment results compared to faster release rate.
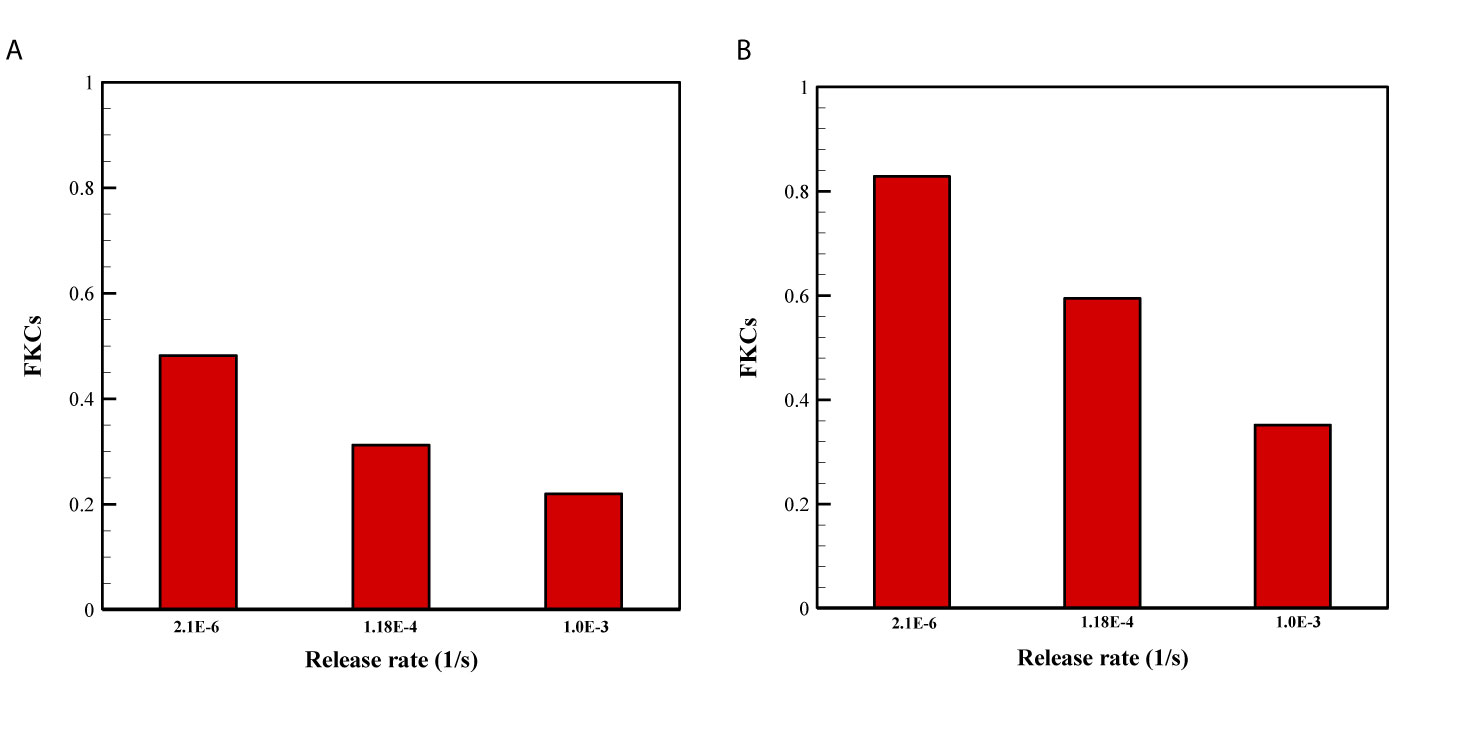
Figure 8 Comparison of treatment efficacy of two NP sizes for different release rates. KON was set to 15[m3/[(mol.s)] in all cases. (A) 100 nm, (B) 20 nm.
NP delivery systems may have other functions in addition to acting as carriers of drug. One of these functions is to control the release rate of therapeutic agents from the NPs (2). Release rate from drug-loaded nanocarriers directly determines the toxicity and anticancer activity of a DDS. Depending on various factors such as the NP formulation, fabrication method, surrounding environment, etc., release rate can vary across a wide range. For instance, stealth liposomes can provide sustainable release over weeks, while TSLs are designed to release their payloads in a short time. Hence, to cover all these wide ranges, the release rate is changed from 2.1×10⁻⁶ to 1×10⁻³ [1/s] in this study. A very rapid drug release before the NPs have penetrated deep into the tumor may result in non-uniform drug distribution, while a very slow release may cause most NPs to be cleared out before reaching the tumor as well as it may cause multi-drug resistance (29). Moreover, release rate of drug should be regulated based on maximum efficacy in TC kill and minimum side effects. Sustained release with the goal of drug delivery over a long period of time is important for drugs that are rapidly metabolized and excreted. Sustained release can stabilize plasma concentrations of the drug at a constant level, thus reduces the need for higher doses of the drug, which results in reducing side effects.
Three-Stage NP Drug Delivery System
In addition to enhancing the tumoral penetration depth, multi-stage NP delivery systems can provide further tunability in the spatial delivery control to solid tumors (8, 28). Due to the physiological obstacles that a chemotherapeutic agent must encounter, a multi-stage DDS can improve treatment efficacy by altering its physical properties (including shape, size, flexibility, charge, and/or surface coating) to suit the transport across each obstacle (8). As interest in increasingly complicated DDSs grows, we face a corresponding challenge to set the model parameters. In this study, we had presented two common scenarios for multi-stage DDS: (i) a 100-nm particle, which released secondary 10-nm particles; and (ii) a 20-nm particle, which released secondary 5-nm particles.
Based on Figure 9 for the three-stage DDSs, we assumed multiple different possible states for release rate constants (i.e., Kel1 and Kel2) of the secondary particle and the drug. The results enable a set of observations as to how release rate constants affect the efficacy of drugs. The four most predominant are: (i) overall, the second scenario (NP1 = 20nm and NP2 = 5nm) has higher treatment efficacy, almost in all investigated states, compared to the first scenario (NP1 = 100nm and NP2 = 10nm); (ii) in low binding rates, the high release rates have better performance; (iii) in moderate and high binding rates, the NP release must have high release rates and the drug release must have the lower release rates; (iv) the least treatment efficacy occurs when both release rates are slow.
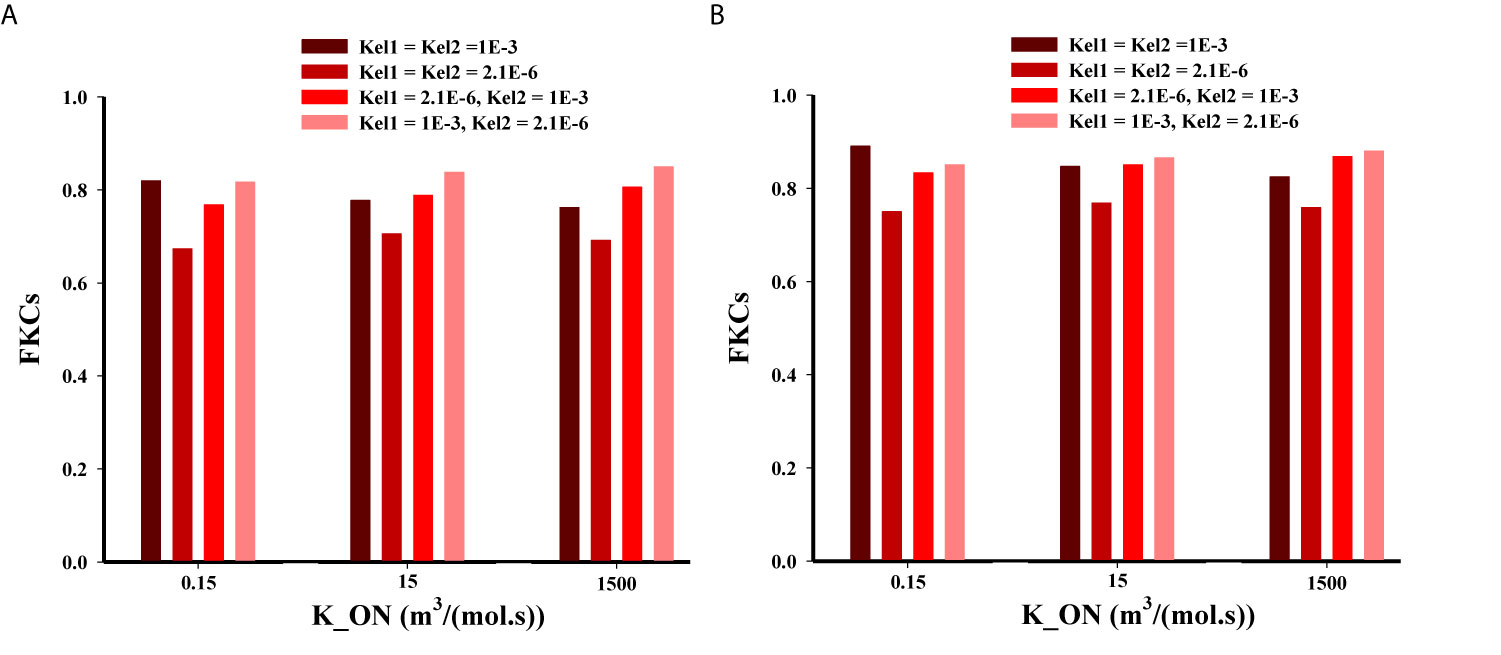
Figure 9 Comparison of treatment efficacy of two multi-stage delivery scenarios for different values of KON, Kel1, and Kel2. (A) NP1=100nm and NP2=10nm, (B) NP1=20nm and NP2=5nm.
A high binding affinity of drug agents to receptors of cancer-cell leads to a higher drug concentration in the intracellular space of tumor, and it simultaneously decreases the drug concentration in tumor tissue. In other words, with a higher binding affinity, more drugs are taken up by cancer cells, reducing the drug level in the interstitium. Binding affinity plays different roles in the delivery of smaller or larger particles because in smaller particles the diffusion mechanism is more dominant than convection, while in larger particles the convection via vessel-walls is more dominant in the transport across blood vessels. It should be mentioned that a very high binding affinity of the NPs leads to aggregation nearby the vessels that NPs are extravasated from. On the other hand, for transport from microvessels to tissue, NP efficacy depends on the kinetics of drug release from particles (28). Eventually, the released drug may also rapidly bind to the cells, causing heterogeneous and incomplete distribution within tumor (62). After simultaneous investigation of the impacts of NP size, binding affinity, and the release rate of drugs, it is predicted that NP penetration from tumor microvessels would be affected (29). Indeed, there is a competition between diffusion in the ECM (which depends on NP size) and binding affinity and/or the release rate of drugs. However, the one of the main conclusions is that all these three parameters should be considered together and studying their impact alone does not provide the right policy on optimal design of NSDDSs.
Treatment Evaluation
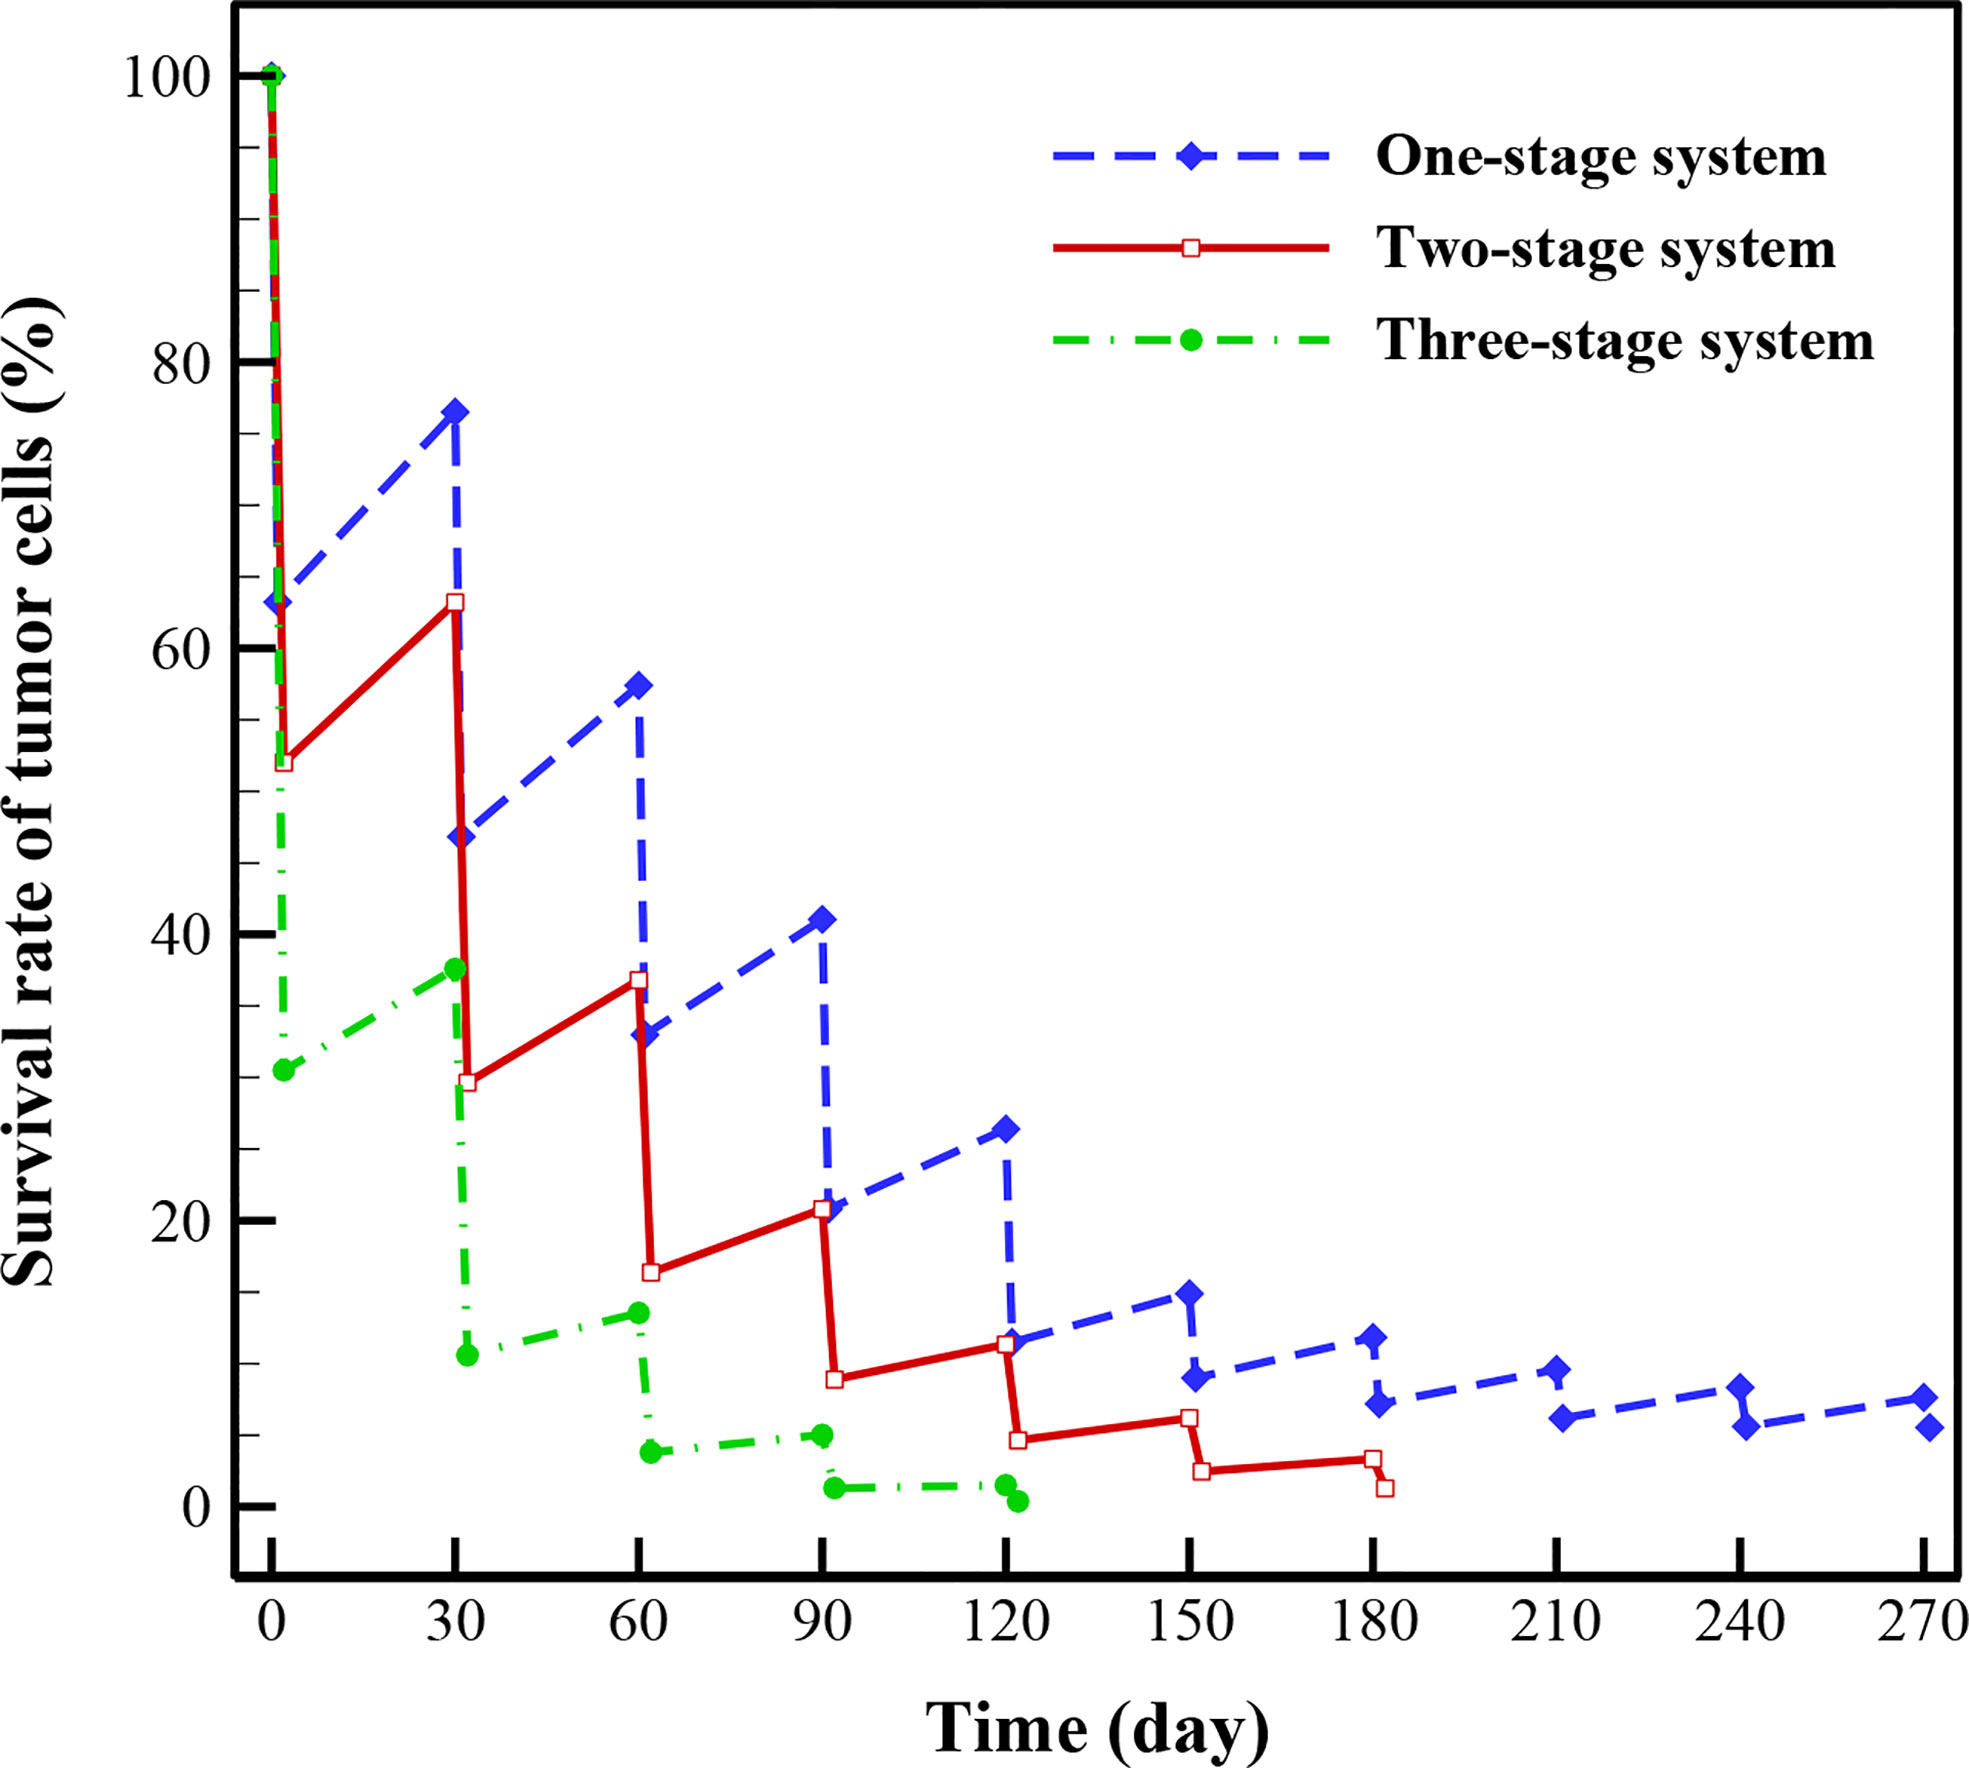
In this section, the treatment outcomes of three investigated drug delivery systems are calculated by considering 1-month drug-free breaks between treatments. As demonstrated in Figure 10, three-stage system has better treatment outcome than two-stage and one-stage (i.e., conventional chemotherapy) systems, implying superiority based on higher rate of killing TCs and shorter treatment time, simultaneously. For the conventional chemotherapy, the respective efficacies of the first, second, and third stages of treatment in reducing the TCs are about 36.78%, 29.67%, and 24.41%. This rate is 20.24% for the fourth stage, 14.9% for the fifth stage, 5.9% for the sixth stage, 4.65% for the seventh stage, 3.42% for the sixth stage, 2.73% for the ninth stage, and 2.11% for the tenth stage. Tumor regrowth between the first and second stages of treatment, between the second and third stages, and up to the end of the process in the tenth stage are calculated to be 13.28%, 10.57%, 8.06%, 5.59%, 3.4%, 2.85%, 2.4%, 2.17%, and 2.03%, respectively. At the last stage of treatment, it is obvious that the regrowth of TCs is about 2.03%, while the treatment efficacy is about 2.11%, implying that for this size of tumor using conventional chemotherapy alone is not the best choice and need more cycles of treatments, so an adjuvant therapy would be suggested at this size of tumor. In general, after seven treatments, 5.54% of the initial tumor cells remain for conventional chemotherapy.
Results indicate that after 5 treatments with three-stage system, 99.6% of TCs are killed, while two-stage and one-stage system respectively kill 95.6% and 88.5% of TCs in the same period. It should be mentioned that the rate of killing TCs for the two-stage system reaches 98.9% after 7 cycles of treatment. This rate is also 94.46% for one-stage system after 10 treatment cycles. As a consequence, the treatment efficacies for both the NSDDSs have shown significant improvements compared to conventional chemotherapy. Results of the case study show that the survival rates of TCs after several treatment cycles offer significant prognostic insight about the survival rate and the cell regrowth percentage. Being able to evaluate the efficacy of a treatment scenario using multi-scale computational modeling is very helpful in clinical situations.
Conclusion
In the present work, a mathematical model of drug transport is proposed to predict delivery of chemotherapeutic drugs, either in their free form or encapsulated in NPs. Parameters of the model describing physiological and biological characteristics of tissue and drug are extracted from experimental data in the literature. The model has been applied to realistic tumor reconstructed from actual image of vascularized tumor to: (i) understand the transport steps of non-encapsulated and encapsulated drugs, and (ii) elucidate the impact of drug properties on drug delivery and treatment. The main findings are as follows:
● Spatiotemporal drug distribution illustrates that the complexity of the capillary network is the main factor for non-uniform drug distribution in the tumor.
● The FKCs of tumor for two-stage DDS with smaller size of NPs (20nm) is higher than that of larger ones (100nm), in all investigate release rates. Slower and continuous release of the chemotherapeutic agents from NPs have better treatment outcomes in comparison with faster release rate.
● For three-stage DDSs, in intermediate and higher binding affinities, it is desirable for the secondary particle to be released with faster rate, and the drug with slower rate. In lower binding affinities, the high release rates have better performance
● Three-stage system has better treatment results relative to two-stage and one-stage systems, reaching 99.6% effectiveness in killing TCs after 5 treatments; while two-stage and one-stage system respectively kill 95.6% and 88.5% of TCs in the same period.
Overall, a mathematical framework has been developed for drug delivery in both free and encapsulated forms to provide qualitative and mechanistic understanding of transport of drug in solid tumors. The effect of treatment outcomes considering tumor recurrence between the two presented models is highly complementary to PK/PD models as it considers both the spatial and temporal scales at the same time, while PK/PD models merely consider the temporal scales. Moreover, different equation parameters in the present study have physiological and bio-chemical implications (e.g., intravascular pressure, microvascular density, microvascular diameter, permeability, diffusion coefficient to name a few), whereas PK/PD methods might involve a parameter to express several parameters.
It should be mentioned that anti-angiogenic agent (here, TSP2) has effects on real tumor geometry and changes of permeability, but we have no discussion about TSP2 in the present study. On the other hand, if we have three images for three different states (negative control, treatment with TSP2 and without treatment), the mathematical modeling can include the new geometry of microvascular networks. This is an interesting suggestion for future studies. Additionally, this method can be applied on each images of tumor because the geometry of tumor can be obtained after image-processing; however, in this study, we have chosen an actual image from the literature due to the lack of experimental set-up in our group.
Protection systems for NPs such as PEGylation as well as adjustable parameters of NP design, all try to enhance drug half-life in the circulation system, which can increase drug delivery into the tumor and reduce side effects to healthy tissue. Furthermore, NPs can be manipulated to release their loaded drugs if exposed to a specific external (e.g., ultrasound or magnetic field) or internal (e.g., pH or enzyme) stimulus. Multi stimuli-responsive DDSs ─combination of internal and external stimuli─ have not only succeeded in targeted drug delivery but also in the multi-modal cancer diagnosis and treatment. In addition to enhancing efficacy of encapsulation, these systems may enhance the drugs half-life. Our presented approach has the potential of modeling these targeting systems. For example, by simultaneously solving bio-heat and wave equations with the presented equations, the drug delivery through thermo-sensitive NPs can be modeled.
Data Availability Statement
The original contributions presented in the study are included in the article. Further inquiries can be directed to the corresponding author.
Author Contributions
Data curation, FM. Investigation, FM, MS, and MM. Methodology, FM. Project administration, FM and MS. Resources, FM. Software: FM and MM. Supervision, MS and AR. Validation: FM. Visualization, FM and MM. Writing – original draft, FM. Writing – review and editing, MS, MM, and AR. Funding acquisition, AR. All authors contributed to the article and approved the submitted version.
Funding
The authors wish to acknowledge funding from the Natural Sciences and Engineering Research Council of Canada (NSERC) Discovery Grant RGPIN-2019-06467, as well as the BC Cancer Foundation.
Conflict of Interest
The authors declare that the research was conducted in the absence of any commercial or financial relationships that could be construed as a potential conflict of interest.
References
1. Ng TSC, Garlin MA, Weissleder R, Miller MA. Improving Nanotherapy Delivery and Action Through Image-Guided Systems Pharmacology. Theranostics (2020) 10(3):968–97. doi: 10.7150/thno.37215
2. Moradi Kashkooli F, Soltani M, Souri M. Controlled Anti-Cancer Drug Release Through Advanced Nano-Drug Delivery Systems: Static and Dynamic Targeting Strategies. J Controlled Release (2020) 327:316–49. doi: 10.1016/j.jconrel.2020.08.012
3. Decuzzi P. Facilitating the Clinical Integration of Nanomedicines: The Roles of Theoretical and Computational Scientists. ACS nano (2016) 10:8133–8. doi: 10.1021/acsnano.6b05536
4. Gabizon A, Catane R, Uziely B, Kaufman B, Safra T, Cohen R, et al. Prolonged Circulation Time and Enhanced Accumulation in Malignant Exudates of Doxorubicin Encapsulated in Polyethylene-Glycol Coated Liposomes. Cancer Res (1994) 54:987–92.
5. Vaage J, Barberá-Guillem E, Abra R, Huang A, Working P. Tissue Distribution and Therapeutic Effect of Intravenous Free or Encapsulated Liposomal Doxorubicin on Human Prostate Carcinoma Xenografts. Cancer (1994) 73:1478–84. doi: 10.1002/1097-0142(19940301)73:5<1478::AID-CNCR2820730526>3.0.CO;2-1
6. Batist G, Ramakrishnan G, Rao CS, Chandrasekharan A, Gutheil J, Guthrie T, et al. Reduced Cardiotoxicity and Preserved Antitumor Efficacy of Liposome-Encapsulated Doxorubicin and Cyclophosphamide Compared With Conventional Doxorubicin and Cyclophosphamide in a Randomized, Multicenter Trial of Metastatic Breast Cancer. J Clin Oncol (2001) 19:1444–54. doi: 10.1200/JCO.2001.19.5.1444
7. Sun D, Zhou S, Gao W. What Went Wrong With Anticancer Nanomedicine Design and How to Make it Right. ACS Nano (2020) 14(10):12281–90. doi: 10.1021/acsnano.9b09713
8. Jain RK, Stylianopoulos T. Delivering Nanomedicine to Solid Tumors. Nat Rev Clin Oncol (2010) 7(11):653–64. doi: 10.1038/nrclinonc.2010.139
9. Lane LA. Physics in Nanomedicine: Phenomena Governing the In Vivo Performance of Nanoparticles. Appl Phys Rev (2020) 7:011316. doi: 10.1063/1.5052455
10. Popović Z, Liu W, Chauhan VP, Lee J, Wong C, Greytak AB, et al. A Nanoparticle Size Series for In Vivo Fluorescence Imaging. Angewandte Chemie (2010) 122:8831–4. doi: 10.1002/ange.201003142
11. Stylianopoulos T, Wong C, Bawendi MG, Jain RK, Fukumura D. Multistage Nanoparticles for Improved Delivery Into Tumor Tissue. Methods enzymol Elsevier (2012) 508:109–30. doi: 10.1016/B978-0-12-391860-4.00006-9
12. Niu Y, Zhu J, Li Y, Shi H, Gong Y, Li R, et al. Size Shrinkable Drug Delivery Nanosystems and Priming the Tumor Microenvironment for Deep Intratumoral Penetration of Nanoparticles. J Controlled Release (2018) 277:35–47. doi: 10.1016/j.jconrel.2018.03.012
13. Wong C, Stylianopoulos T, Cui J, Martin J, Chauhan VP, Jiang W, et al. Multistage Nanoparticle Delivery System for Deep Penetration Into Tumor Tissue. Proc Natl Acad Sci (2011) 108:2426–31. doi: 10.1073/pnas.1018382108
14. Baxter LT, Jain RK. Transport of Fluid and Macromolecules in Tumors. I. Role of Interstitial Pressure and Convection. Microvasc Res (1989) 37:77–104. doi: 10.1016/0026-2862(89)90074-5
15. Soltani M, Chen P. Numerical Modeling of Fluid Flow in Solid Tumors. PloS One (2011) 6:e20344. doi: 10.1371/journal.pone.0020344
16. Sefidgar M, Soltani M, Raahemifar K, Sadeghi M, Bazmara H, Bazargan M, et al. Numerical Modeling of Drug Delivery in a Dynamic Solid Tumor Microvasculature. Microvasc Res (2015) 99:43–56. doi: 10.1016/j.mvr.2015.02.007
17. Moradi Kashkooli F, Soltani M, Rezaeian M, Taatizadeh E, Hamedi M-H. Image-Based Spatio-Temporal Model of Drug Delivery in a Heterogeneous Vasculature of a Solid Tumor—Computational Approach. Microvasc Res (2019) 123:111–24. doi: 10.1016/j.mvr.2019.01.005
18. Moradi Kashkooli F, Soltani M, Hamedi MH. Drug Delivery to Solid Tumors With Heterogeneous Microvascular Networks: Novel Insights From Image-Based Numerical Modeling. Eur J Pharm Sci (2020) 151:105399. doi: 10.1016/j.ejps.2020.105399
19. Baxter LT, Jain RK. Transport of Fluid and Macromolecules in Tumors. (II) Role of Heterogeneous Perfusion and Lymphatics. Microvasc Res (1990) 40:246–63. doi: 10.1016/0026-2862(90)90023-K
20. El-Kareh AW, Secomb TW. A Mathematical Model for Comparison of Bolus Injection, Continuous Infusion, and Liposomal Delivery of Doxorubicin to Tumor Cells. Neoplasia (New York NY) (2000) 2:325. doi: 10.1038/sj.neo.7900096
21. Zhang A, Mi X, Yang G, Xu LX. Numerical Study of Thermally Targeted Liposomal Drug Delivery in Tumor. J heat transfer (2009) 131(4):043209. doi: 10.1115/1.3072952
22. Hendriks BS, Reynolds JG, Klinz SG, Geretti E, Lee H, Leonard SC, et al. Multiscale Kinetic Modeling of Liposomal Doxorubicin Delivery Quantifies the Role of Tumor and Drug-Specific Parameters in Local Delivery to Tumors. CPT Pharmacometrics Syst Pharmacol (2012) 1(11):e15. doi: 10.1038/psp.2012.16
23. Chauhan VP, Stylianopoulos T, Martin JD, Popović Z, Chen O, Kamoun WS, et al. Normalization of Tumour Blood Vessels Improves the Delivery of Nanomedicines in a Size-Dependent Manner. Nat Nanotechnol (2012) 7:383–8. doi: 10.1038/nnano.2012.45
24. Gasselhuber A, Dreher MR, Rattay F, Wood BJ, Haemmerich D. Comparison of Conventional Chemotherapy, Stealth Liposomes and Temperature-Sensitive Liposomes in a Mathematical Model. PloS One (2012) 7(10):e47453. doi: 10.1371/journal.pone.0047453
25. Zhan W, Xu XY. A Mathematical Model for Thermosensitive Liposomal Delivery of Doxorubicin to Solid Tumour. J Drug Deliv (2013) 2013:172529. doi: 10.1155/2013/172529
26. Stylianopoulos T, Soteriou K, Fukumura D, Jain RK. Cationic Nanoparticles Have Superior Transvascular Flux Into Solid Tumors: Insights From a Mathematical Model. Ann Biomed Eng (2013) 41:68–77. doi: 10.1007/s10439-012-0630-4
27. Kim MJ, Gillies RJ, Rejniak KA. Current Advances in Mathematical Modeling of Anti-Cancer Drug Penetration Into Tumor Tissues. Front Oncol (2013) 3:278. doi: 10.3389/fonc.2013.00278
28. Stylianopoulos T, Economides E-A, Baish JW, Fukumura D, Jain RK. Towards Optimal Design of Cancer Nanomedicines: Multi-stage Nanoparticles for the Treatment of Solid Tumors. Ann Biomed Eng (2015) 43:2291–300. doi: 10.1007/s10439-015-1276-9
29. Stylianopoulos T, Jain RK. Design Considerations for Nanotherapeutics in Oncology. Nanomed: Nanotechnol Biol Med (2015) 11:1893–907. doi: 10.1016/j.nano.2015.07.015
30. Chou C-Y, Chang W-I, Horng T-L, Lin W-L. Numerical Modeling of Nanodrug Distribution in Tumors With Heterogeneous Vasculature. PloS One (2017) 12:e0189802. doi: 10.1371/journal.pone.0189802
31. Zhan W, Wang C-H. Convection Enhanced Delivery of Liposome Encapsulated Doxorubicin for Brain Tumour Therapy. J Controlled Release (2018) 285:212–29. doi: 10.1016/j.jconrel.2018.07.006
32. Shamsi M, Sedaghatkish A, Dejam M, Saghafian M, Mohammadi M, Sanati-Nezhad A. Magnetically Assisted Intraperitoneal Drug Delivery for Cancer Chemotherapy. Drug Deliv (2018) 25:846–61. doi: 10.1080/10717544.2018.1455764
33. Stylianopoulos T, Munn LL, Jain RK. Reengineering the Physical Microenvironment of Tumors to Improve Drug Delivery and Efficacy: From Mathematical Modeling to Bench to Bedside. Trends Cancer (2018) 4(4):292–319. doi: 10.1016/j.trecan.2018.02.005
34. Huang Y, Gu B, Liu C, Stebbing J, Gedroyc W, Thanou M, et al. Thermosensitive Liposome-Mediated Drug Delivery in Chemotherapy: Mathematical Modelling for Spatio-Temporal Drug Distribution and Model-Based Optimisation. Pharmaceutics (2019) 11(12):637. doi: 10.3390/pharmaceutics11120637
35. Rezaeian M, Sedaghatkish A, Soltani M. Numerical Modeling of High-Intensity Focused Ultrasound-Mediated Intraperitoneal Delivery of Thermosensitive Liposomal Doxorubicin for Cancer Chemotherapy. Drug Delivery (2019) 26:898–917. doi: 10.1080/10717544.2019.1660435
36. Shamsi M, Mohammadi A, Manshadi MK, Sanati-Nezhad A. Mathematical and Computational Modeling of Nano-Engineered Drug Delivery Systems. J Controlled Release (2019) 307:150–65. doi: 10.1016/j.jconrel.2019.06.014
37. He H, Liu C, Liu Y, Liu X, Wu Y, Fan J, et al. Mathematical Modeling of the Heterogeneous Distributions of Nanomedicines in Solid Tumors. Eur J Pharm Biopharm (2019) 142:153–64. doi: 10.1016/j.ejpb.2019.06.005
38. Dogra P, Butner JD, Chuang Y, Caserta S, Goel S, Brinker CJ, et al. Mathematical Modeling in Cancer Nanomedicine: A Review. Biomed Microdevices (2019) 21:40. doi: 10.1007/s10544-019-0380-2
39. Soltani M, Tehrani MHH, Moradi Kashkooli F, Rezaeian M. Effects of Magnetic Nanoparticle Diffusion on Microwave Ablation Treatment: A Numerical Approach. J Magn Magn Mater (2020) 514:167196. doi: 10.1016/j.jmmm.2020.167196
40. Wirthl B, Kremheller J, Schrefler BA, Wall WA. Extension of a Multiphase Tumour Growth Model to Study Nanoparticle Delivery to Solid Tumours. PloS One (2020) 15(2):e0228443. doi: 10.1371/journal.pone.0228443
41. Wijeratne PA, Vavourakis V. A Quantitative in Silico Platform for Simulating Cytotoxic and Nanoparticle Drug Delivery to Solid Tumours. Interface Focus (2019) 9: (3):20180063. doi: 10.1098/rsfs.2018.0063
42. Dogra P, Butner JD, Ramírez JR, Chuang Y-L, Noureddine A, Brinker CJ, et al. A Mathematical Model for Nanomedicine Pharmacokinetics and Tumor Delivery. Comput Struct Biotechnol J (2020) 18:518–31. doi: 10.1016/j.csbj.2020.02.014
43. Shojaee P, Niroomand-Oscuii H, Sefidgar M, Alinezhad L. Effect of Nanoparticle Size, Magnetic Intensity, and Tumor Distance on the Distribution of the Magnetic Nanoparticles in a Heterogeneous Tumor Microenvironment. J Magn Magn Mater (2020) 498:166089. doi: 10.1016/j.jmmm.2019.166089
44. Stillman NR, Kovacevic M, Balaz I, Hauert S. In Silico Modelling of Cancer Nanomedicine, Across Scales and Transport Barriers. NPJ Comput Mater (2020) 6:92. doi: 10.1038/s41524-020-00366-8
45. Moradi Kashkooli F, Soltani M, Souri M, Meaney C, Kohandel M. Nexus Between in Silico and In Vivo Models to Enhance Clinical Translation of Nanomedicine. Nano Today (2021) 36:101057. doi: 10.1016/j.nantod.2020.101057
46. Soltani M, Sefidgar M, Bazmara H, Casey ME, Subramaniam RM, Wahl RL, et al. Spatiotemporal Distribution Modeling of PET Tracer Uptake in Solid Tumors. Ann Nucl Med (2017) 31:109–24. doi: 10.1007/s12149-016-1141-4
47. Mascheroni P, Schrefler BA. In Silico Models for Nanomedicine: Recent Developments. Curr med Chem (2018) 25:4192–207. doi: 10.2174/0929867324666170417120725
48. Peer D, Karp JM, Hong S, Farokhzad OC, Margalit R, Langer R. Nanocarriers as An Emerging Platform for Cancer Therapy. Nat Nanotechnol (2007) 2(12):751–60. doi: 10.1038/nnano.2007.387
49. Truskey GA, Yuan F, Katz DF. Transport Phenomena in Biological Systems. Upper Saddle River, New Jersey: Pearson Education, Inc. (2004).
50. Sefidgar M, Soltani M, Raahemifar K, Bazmara H, Nayinian SMM, Bazargan M. Effect of Tumor Shape, Size, and Tissue Transport Properties on Drug Delivery to Solid Tumors. J Biol Eng (2014) 8:12. doi: 10.1186/1754-1611-8-12
51. Mpekris F, Angeli S, Pirentis AP, Stylianopoulos T. Stress-Mediated Progression of Solid Tumors: Effect of Mechanical Stress on Tissue Oxygenation, Cancer Cell Proliferation, and Drug Delivery. Biomech Model Mechanobiol (2015) 14:1391–402. doi: 10.1007/s10237-015-0682-0
52. Eikenberry S. A Tumor Cord Model for Doxorubicin Delivery and Dose Optimization in Solid Tumors. Theoritical Biol Med Model (2009) 6:16. doi: 10.1186/1742-4682-6-16
53. Mpekris F, Baish JW, Stylianopoulos T, Jain RK. Role of Vascular Normalization in Benefit From Metronomic Chemotherapy. Proc Natl Acad Sci (2017) 114:1994–9. doi: 10.1073/pnas.1700340114
54. Kerr D, Kerr A, Freshney R, Kaye S. Comparative Intracellular Uptake of Adriamycin and 4’-Deoxydoxorubicin by Non-Small Cell Lung Tumor Cells in Culture and Its Relationship to Cell Survival. Biochem Pharmacol (1986) 35(16):2817–23. doi: 10.1016/0006-2952(86)90195-4
55. Yorke E, Fuks Z, Norton L, Whitmore W, Ling C. Modeling the Development of Metastases From Primary and Locally Recurrent Tumors: Comparison With a Clinical Data Base for Prostatic Cancer. Cancer Res (1993) 53:2987–93.
56. Jung KY, Cho SW, Kim YA, Kim D, Oh B-C, Park DJ, et al. Cancers With Higher Density of Tumor-Associated Macrophages Were Associated With Poor Survival Rates. J Pathol Trans Med (2015) 49:318. doi: 10.4132/jptm.2015.06.01
57. Moradi Kashkooli F, Soltani M, Rezaeian M, Meaney C, Hamedi MH, Kohandel M. Effect of Vascular Normalization on Drug Delivery to Different Stages of Tumor Progression: In-Silico Analysis. J Drug Delivery Sci Technol (2020) 60:101989. doi: 10.1016/j.jddst.2020.101989
58. Moradi Kashkooli F, Soltani M, Momeni MM. Computational Modeling of Drug Delivery to Solid Tumors: A Pilot Study Based on a Real Image. J Drug Deliv Sci Technol (2021) 62:102347. doi: 10.1016/j.jddst.2021.102347
59. Deen W. Hindered Transport of Large Molecules in Liquid-Filled Pores. AIChE J (1987) 33:1409–25. doi: 10.1002/aic.690330902
60. Roudnicky F, Yoon SY, Poghosyan S, Schwager S, Poyet C, Vella G, et al. Alternative Transcription of a Shorter, Non-Anti-Angiogenic Thrombospondin-2 Variant in Cancer-Associated Blood Vessels. Oncogene (2018) 37:2573–85. doi: 10.1038/s41388-018-0129-z
61. McDougall SR, Anderson AR, Chaplain MA. Mathematical Modelling of Dynamic Adaptive Tumour-Induced Angiogenesis: Clinical Implications and Therapeutic Targeting Strategies. J Theor Biol (2006) 241:564–89. doi: 10.1016/j.jtbi.2005.12.022
Keywords: solid tumors, drug delivery, nanomedicine, drug-loaded nanocarriers, tumor penetration, image-based model, treatment efficacy
Citation: Moradi Kashkooli F, Soltani M, Momeni MM and Rahmim A (2021) Enhanced Drug Delivery to Solid Tumors via Drug-Loaded Nanocarriers: An Image-Based Computational Framework. Front. Oncol. 11:655781. doi: 10.3389/fonc.2021.655781
Received: 19 January 2021; Accepted: 26 May 2021;
Published: 24 June 2021.
Edited by:
Yuxia Tang, Nanjing University, ChinaReviewed by:
Anju Gupta, University of Toledo, United StatesFrancesco Giansanti, University of L’Aquila, Italy
Copyright © 2021 Moradi Kashkooli, Soltani, Momeni and Rahmim. This is an open-access article distributed under the terms of the Creative Commons Attribution License (CC BY). The use, distribution or reproduction in other forums is permitted, provided the original author(s) and the copyright owner(s) are credited and that the original publication in this journal is cited, in accordance with accepted academic practice. No use, distribution or reproduction is permitted which does not comply with these terms.
*Correspondence: M. Soltani, bXNvbHRhbmlAdXdhdGVybG9vLmNh
 Farshad Moradi Kashkooli1
 M. Soltani