 Teng Deng
 Yizhen Gong2†
 Xiwen Liao
- 1Department of Neurosurgery, Guangxi Medical University Cancer Hospital, Nanning, China
- 2Evidence-based Medicine Teaching and Research Section, Affiliated Hospital of Guilin Medical University, Guilin, China
- 3Department of Hepatobiliary Surgery, The First Affiliated Hospital of Guangxi Medical University, Nanning, China
Objective: The present study used the RNA sequencing (RNA-seq) dataset to identify prognostic snoRNAs and construct a prognostic signature of The Cancer Genome Atla (TCGA) lower grade glioma (LGG) cohort, and comprehensive analysis of this signature.
Methods: RNA-seq dataset of 488 patients from TCGA LGG cohort were included in this study. Comprehensive analysis including function enrichment, gene set enrichment analysis (GSEA), immune infiltration, cancer immune microenvironment, and connectivity map (CMap) were used to evaluate the snoRNAs prognostic signature.
Results: We identified 21 LGG prognostic snoRNAs and constructed a novel eleven-snoRNA prognostic signature for LGG patients. Survival analysis suggests that this signature is an independent prognostic risk factor for LGG, and the prognosis of LGG patients with a high-risk phenotype is poor (adjusted P = 0.003, adjusted hazard ratio = 2.076, 95% confidence interval = 1.290–3.340). GSEA and functional enrichment analysis suggest that this signature may be involved in the following biological processes and signaling pathways: such as cell cycle, Wnt, mitogen-activated protein kinase, janus kinase/signal transducer and activator of tran-ions, T cell receptor, nuclear factor-kappa B signaling pathway. CMap analysis screened out ten targeted therapy drugs for this signature: 15-delta prostaglandin J2, MG-262, vorinostat, 5155877, puromycin, anisomycin, withaferin A, ciclopirox, chloropyrazine and megestrol. We also found that high- and low-risk score phenotypes of LGG patients have significant differences in immune infiltration and cancer immune microenvironment.
Conclusions: The present study identified a novel eleven-snoRNA prognostic signature of LGG and performed a integrative analysis of its molecular mechanisms and relationship with tumor immunity.
Introduction
Tumors derived from the neuroepithelium are collectively called gliomas and are the most common malignant primary intracranial tumor (1). Lower-grade gliomas are well-differentiated gliomas, and their preferred treatment is surgery, followed by radiotherapy, chemotherapy, immunotherapy, and targeted therapy. Just like any other cancers, glioma is also due to the interaction of innate genetic risk factors and environmental carcinogenic factors (e.g., radiation exposure). Some known genetic disease, such as neurofibromatosis (type I), is genetic susceptibility factor for glioma (2). With the development of high-throughput sequencing technology, we have found that more and more genetic variants are connected with the occurrence, development and clinical outcome of cancers. TCGA is a database resource for whole-genome multi-omics sequencing of 33 human cancers based on high-throughput sequencing technology (3). It can provide the whole genome multi-omics data set of glioma, so that we can further explore its genetic variation (4).
SnoRNA belong to a small non-coding RNA, mostly enriched in nucleolus (5). SnoRNA plays an important role in the splicing processing and post-transcriptional modification of ribosomal precursor RNA. Previous research reports suggested that snoRNAs were dysregulated between glioma tumor and adjacent non-tumor tissues, and involved in the regulation of cancer cell apoptosis, proliferation and invasion, including in glioma (6–8). However, there are few reports on the prognostic value of snoRNA in gliomas (8). We found that there is no research report on screening LGG prognostic snoRNAs based on genome-wide dataset. To fill this gap, we designed and implemented this study. The present study was used the RNA sequencing (RNA-seq) dataset to screen prognostic-related snoRNAs and construct a prognostic signature for The Cancer Genome Atla (TCGA) lower grade glioma (LGG) cohort, and conduct a comprehensive investigation of its molecular mechanisms and relationship with tumor immunity.
Materials and Methods
Data Source
The original level 3 raw RNA sequencing (RNA-seq) dataset of lower grade glioma used in our study comes from TCGA data portal (4). Clinical parameters of TCGA LGG cohort were obtained from UCSC Xena (http://xena.ucsc.edu) (9). We obtained 940 snoRNAs from TCGA RNA-seq dataset into the current analysis. The original HTSeq-Counts RNA-seq data set was normalized in the R platform through the edgeR package (10). We eliminated snoRNAs with a mean value less than 1, and obtained a total of 137 snoRNAs for subsequent survival analysis. We obtained a total of 529 RNA-seq data sets of 511 patients from the TCGA data portal, and we excluded 18 recurrent cancer tissues. Of the 511 patients, we excluded five patients whose survival time was 0 or who had no survival time. We also excluded 18 patients who had a history of other malignancies or who received radiotherapy or chemotherapy before surgery. Finally, 488 patients were recruited for the subsequent comprehensive analysis, which included survival analysis and functional mechanism analysis. IDH1 mutation data of TCGA LGG cohort were obtained from cBioPortal for Cancer Genomics (https://www.cbioportal.org/index.do).
Survival Analysis of snoRNAs Signature
Prognostic snoRNAs screening was performed on the R platform using survival packet and univariate Cox proportional hazards regression model. The prognostic snoRNAs signature is constructed in the R platform using the step function. We use prognostic-related snoRNAs as variables into the multivariate Cox proportional hazard regression model, and the Cox regression coefficient (β) as the weight of each snoRNAs included in the signature to compose the risk score. The snoRNAs signature calculation formula was as follows: risk score = Exp of snoRNA1 × β1snoRNA1 + Exp of snoRNA2 × β2snoRNA2 + Exp of snoRNAn × βnsnoRNAn (Exp: expression) (11–13). Subsequently, we also used the time-dependent ROC curve, nomogram, and combined effect survival analysis to conduct a comprehensive analysis of the prognostic value of this risk score signature in LGG. The nomogram was drawn in the R platform using the rms package. The time-dependent ROC curve was performed in the R platform using the survival ROC package. The combined effect survival analysis was performed in SPSS version 22.0 using the multivariate Cox proportional hazards regression model.
Functional Enrichment Analysis of snoRNAs Signature Based on Whole-Gene RNA-seq Dataset
SnoRNA is a small non-coding RNA encoded by introns, and its function is exerted through the regulation of protein-coding genes (PCGs). We use the Cor function and whole genome encoded RNA-seq dataset of LGG tumor tissues samples to screen the PCGs that related to snoRNAs, were performed on the R platform. We identified that the absolute value of Pearson correlation coefficient (r) between snoRNAs and genes were greater than 0.4 and P <0.05 considered to be the co-expression PCGs of snoRNA. The normalization of PCGs’ RNA-seq dataset was also performed by edgeR. Then, we use the Database for Annotation, Visualization and Integrated Discovery v6.8 (DAVID v6.8, https://david.ncifcrf.gov/home.jsp) online tool to perform functional annotations on the snoRNAs we have screened through the snoRNA co-expression PCGs (14). In addition, we also used the gene set enrichment analysis (GSEA, http://software.broadinstitute.org/gsea/index.jsp) desktop installer to perform functional enrichment analysis between high-risk and low-risk phenotypes for purpose of further investigate the molecular mechanisms of prognostic differences between this two phenotypes (15). For further investigate the molecular mechanism, we further used edgeR to screen differentially expressed genes (DEGs) between high-risk and low-risk phenotypes. Then we use DAVID v6.8 to annotate the functions of these DEGs. We subsequently used these DEGs and connectivity map (CMap, https://portals.broadinstitute.org/cmap/) online tool to identify potential drugs for LGG patients with a high-risk phenotype (16, 17). PubChem (https://pubchem.ncbi.nlm.nih.gov) and STITCH (http://stitch.embl.de/cgi/) online tools were applied to obtain the chemical structure of drugs and the drug-gene interaction networks, respectively (18, 19).
Tumor Immune Infiltration and Microenvironment Analysis
CIBERSORT package was used to compute the abundance and scale of 22 immune cells in LGG tumor tissues to assess the degree of immune infiltration of LGG tumor samples (20, 21). We use the ESTIMATE (Estimation of STromal and Immune cells in MAlignant Tumor tissues using Expression data) package and LGG’s whole genome RNA-seq dataset to calculate the tumor immune microenvironment on the R platform, including the values of immune and stromal cells (22).
Statistical Analysis
The calculation of FDR adopts Benjamini–Hochberg method (23). Survival analysis uses log-rank test of Kaplan–Meier algorithm, as well as univariate and multivariate Cox proportional hazards regression models. Clinical parameters with P <0.05 were included in multivariate Cox proportional hazards regression model for adjustment. Survival curves, heat maps and volcano maps were drawn on the R platform using the ggplot2 package. P <0.05 identified the difference to reach statistical significance. All statistics are computed by SPSS version 22.0.
Results
Survival Analysis of snoRNAs Signature
Clinical parameters of TCGA LGG cohort were summarized in Table 1. Through survival analysis, we obtained 21 snoRNAs that are markedly connected with the clinical outcome of LGG (Figure 1 and Table S1). Then we use the step function to screen a risk score signature from these 21 prognostic-related snoRNAs. Through the screening of the step function, we finally constructed a signature composed of 11 prognostic snoRNAs. The expression of risk score is below: risk score = (–0.2258) × Exp of SNORD73B + (0.1889) × Exp of SNORD91A + (–0.2338) × Exp of SNORA80D + (0.2783) × Exp of ACA59 + (0.3153) × Exp of SNORA63 + (0.2547) × Exp of SNORA72 + (–0.1293) × Exp of SNORA31 + (–0.2354) × Exp of SNORD115-45 + (0.2076) × Exp of SNORA22B + (–0.2054) × Exp of U3 + (–0.2230) × Exp of SNORA40. Kaplan–Meier curves of 11 prognostic snoRNAs were display in Figures 2A–K. By comparing the distribution between survival time of LGG patients and risk score, we found that patients with high risk score had poorer clinical outcome than those with low risk score (Figures 3A, B, log rank P <0.0001). We used multivariate Cox proportional hazard regression model to analyze risk score and found that LGG patients with high risk score had a higher risk of death (adjusted P = 0.003, adjusted HR = 2.076, 95%CI = 1.290–3.340). Then we used survivalROC to assess the accuracy of this risk score for predicting the clinical outcome of LGG patients. We found that this risk score had the highest accuracy in assess the one year prognosis of LGG patients, and the area under curve (AUC) was 0.850 (Figure 3C). The accuracy of the prognosis signature exceeded 0.7 in the clinical outcome prediction of LGG patients from one to five years (Figure 3C). We also use this prognostic signature and clinical parameters with P <0.01 to perform a joint effect survival analysis, these clinical parameters including age, grade, IDH1 mutation, radiation therapy and tumor location. The joint effect survival analysis can significantly more accurately classify LGG patients and identify subtypes of LGG patients with different prognostic outcomes (Table 2 and Figures 4A–E). Through the combined effect survival analysis, we found that the combination of age and risk score can significantly divide LGG patients into four subtypes with significant different prognosis (Table 2 and Figure 4A, all adjusted P <0.05). For understand the contribution of this prognostic signature to the clinical outcome of LGG patients, we constructed a nomogram base on eight LGG prognostic-related clinical parameters and risk score. Through the nomogram, we found that the risk score has the highest contribution to LGG survival, with scores ranging from 0 to 100 (Figure 5).
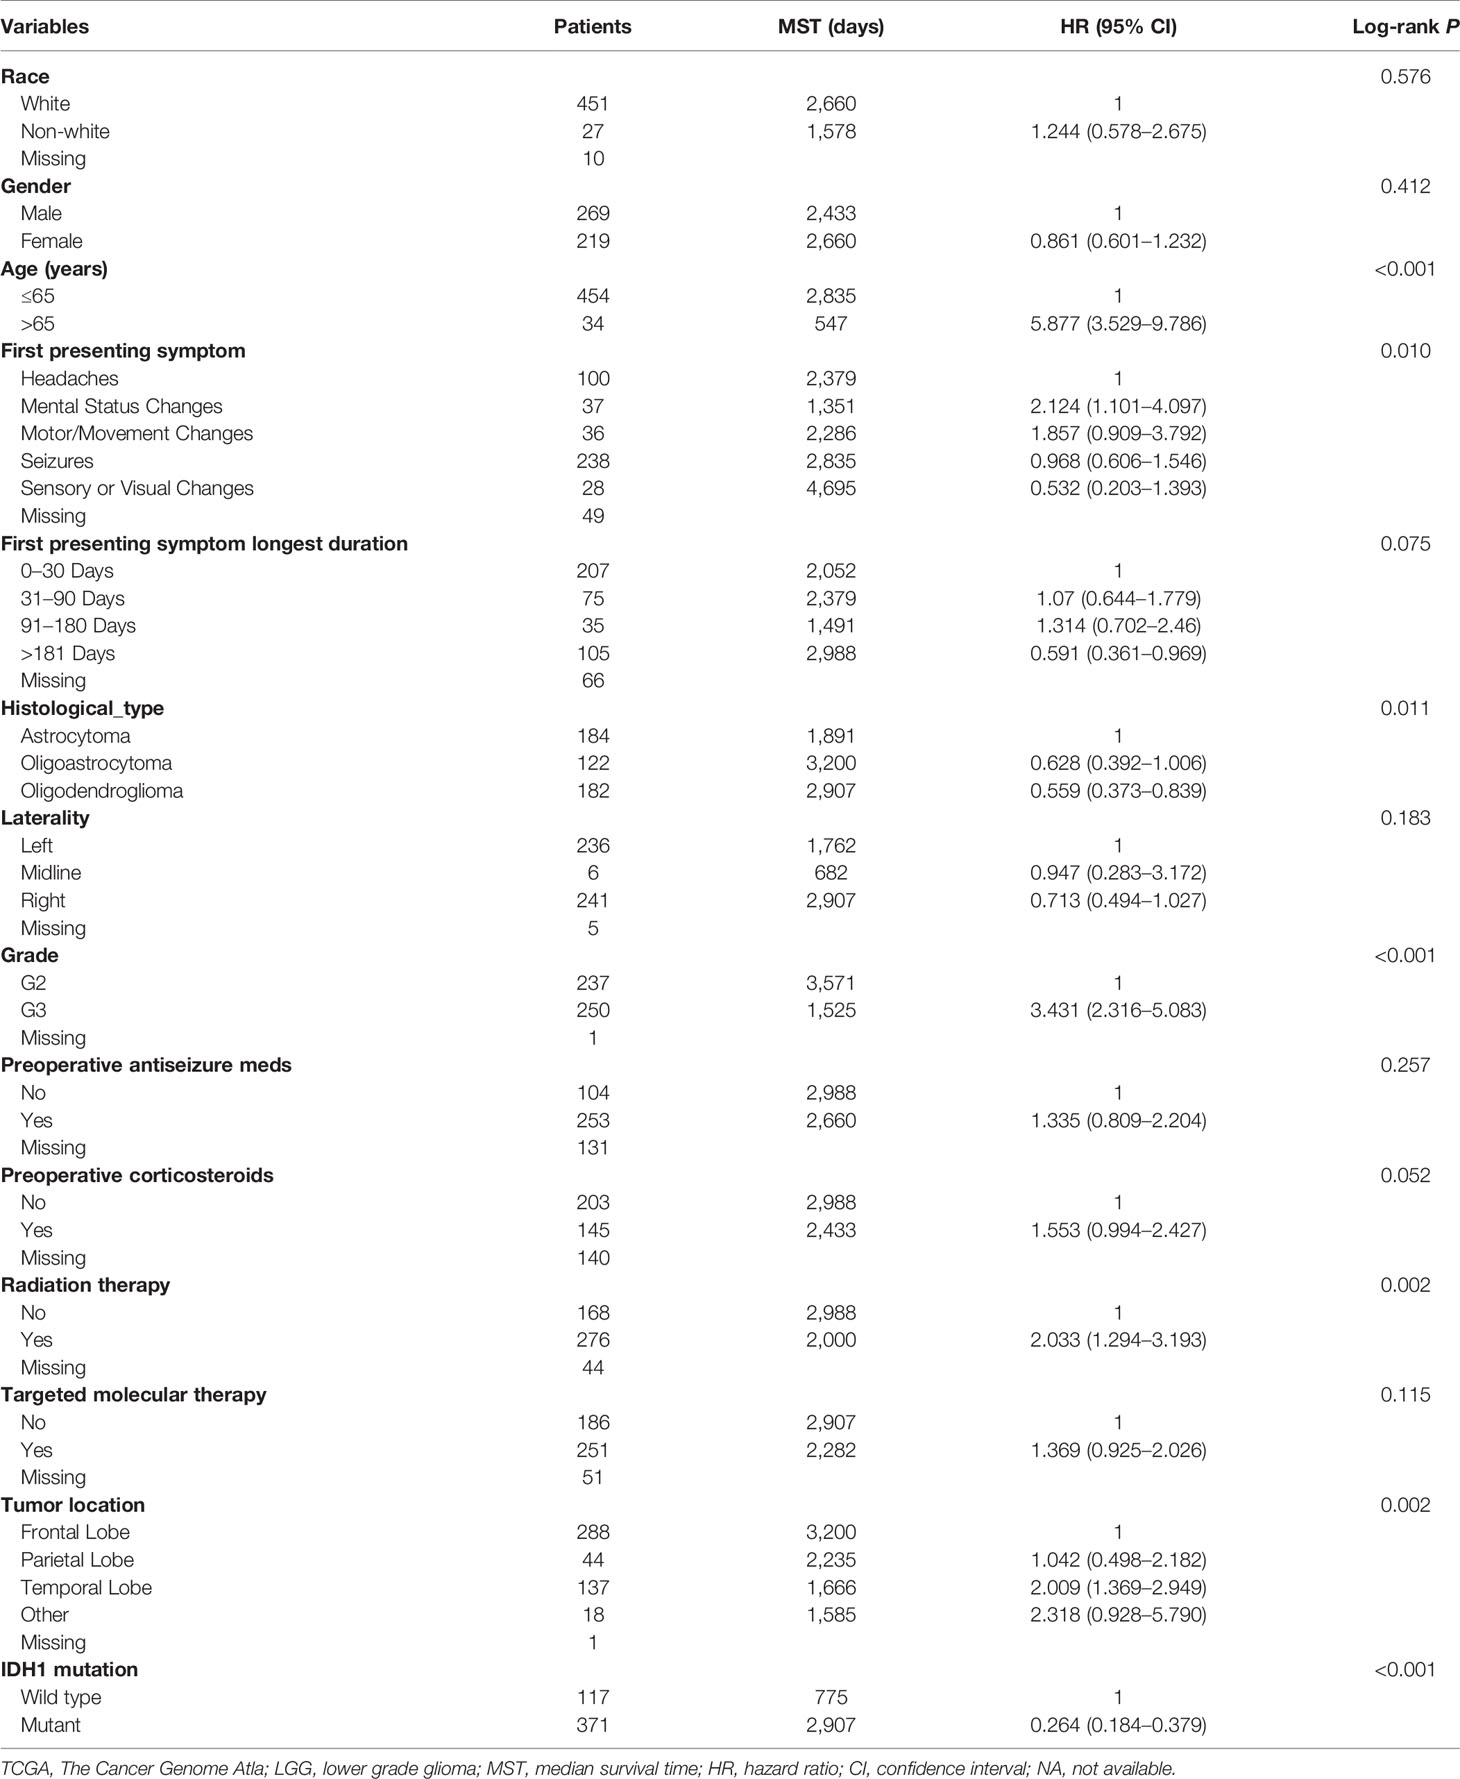
Table 1 Univariate survival analysis of clinical parameter in TCGA LGG cohort.
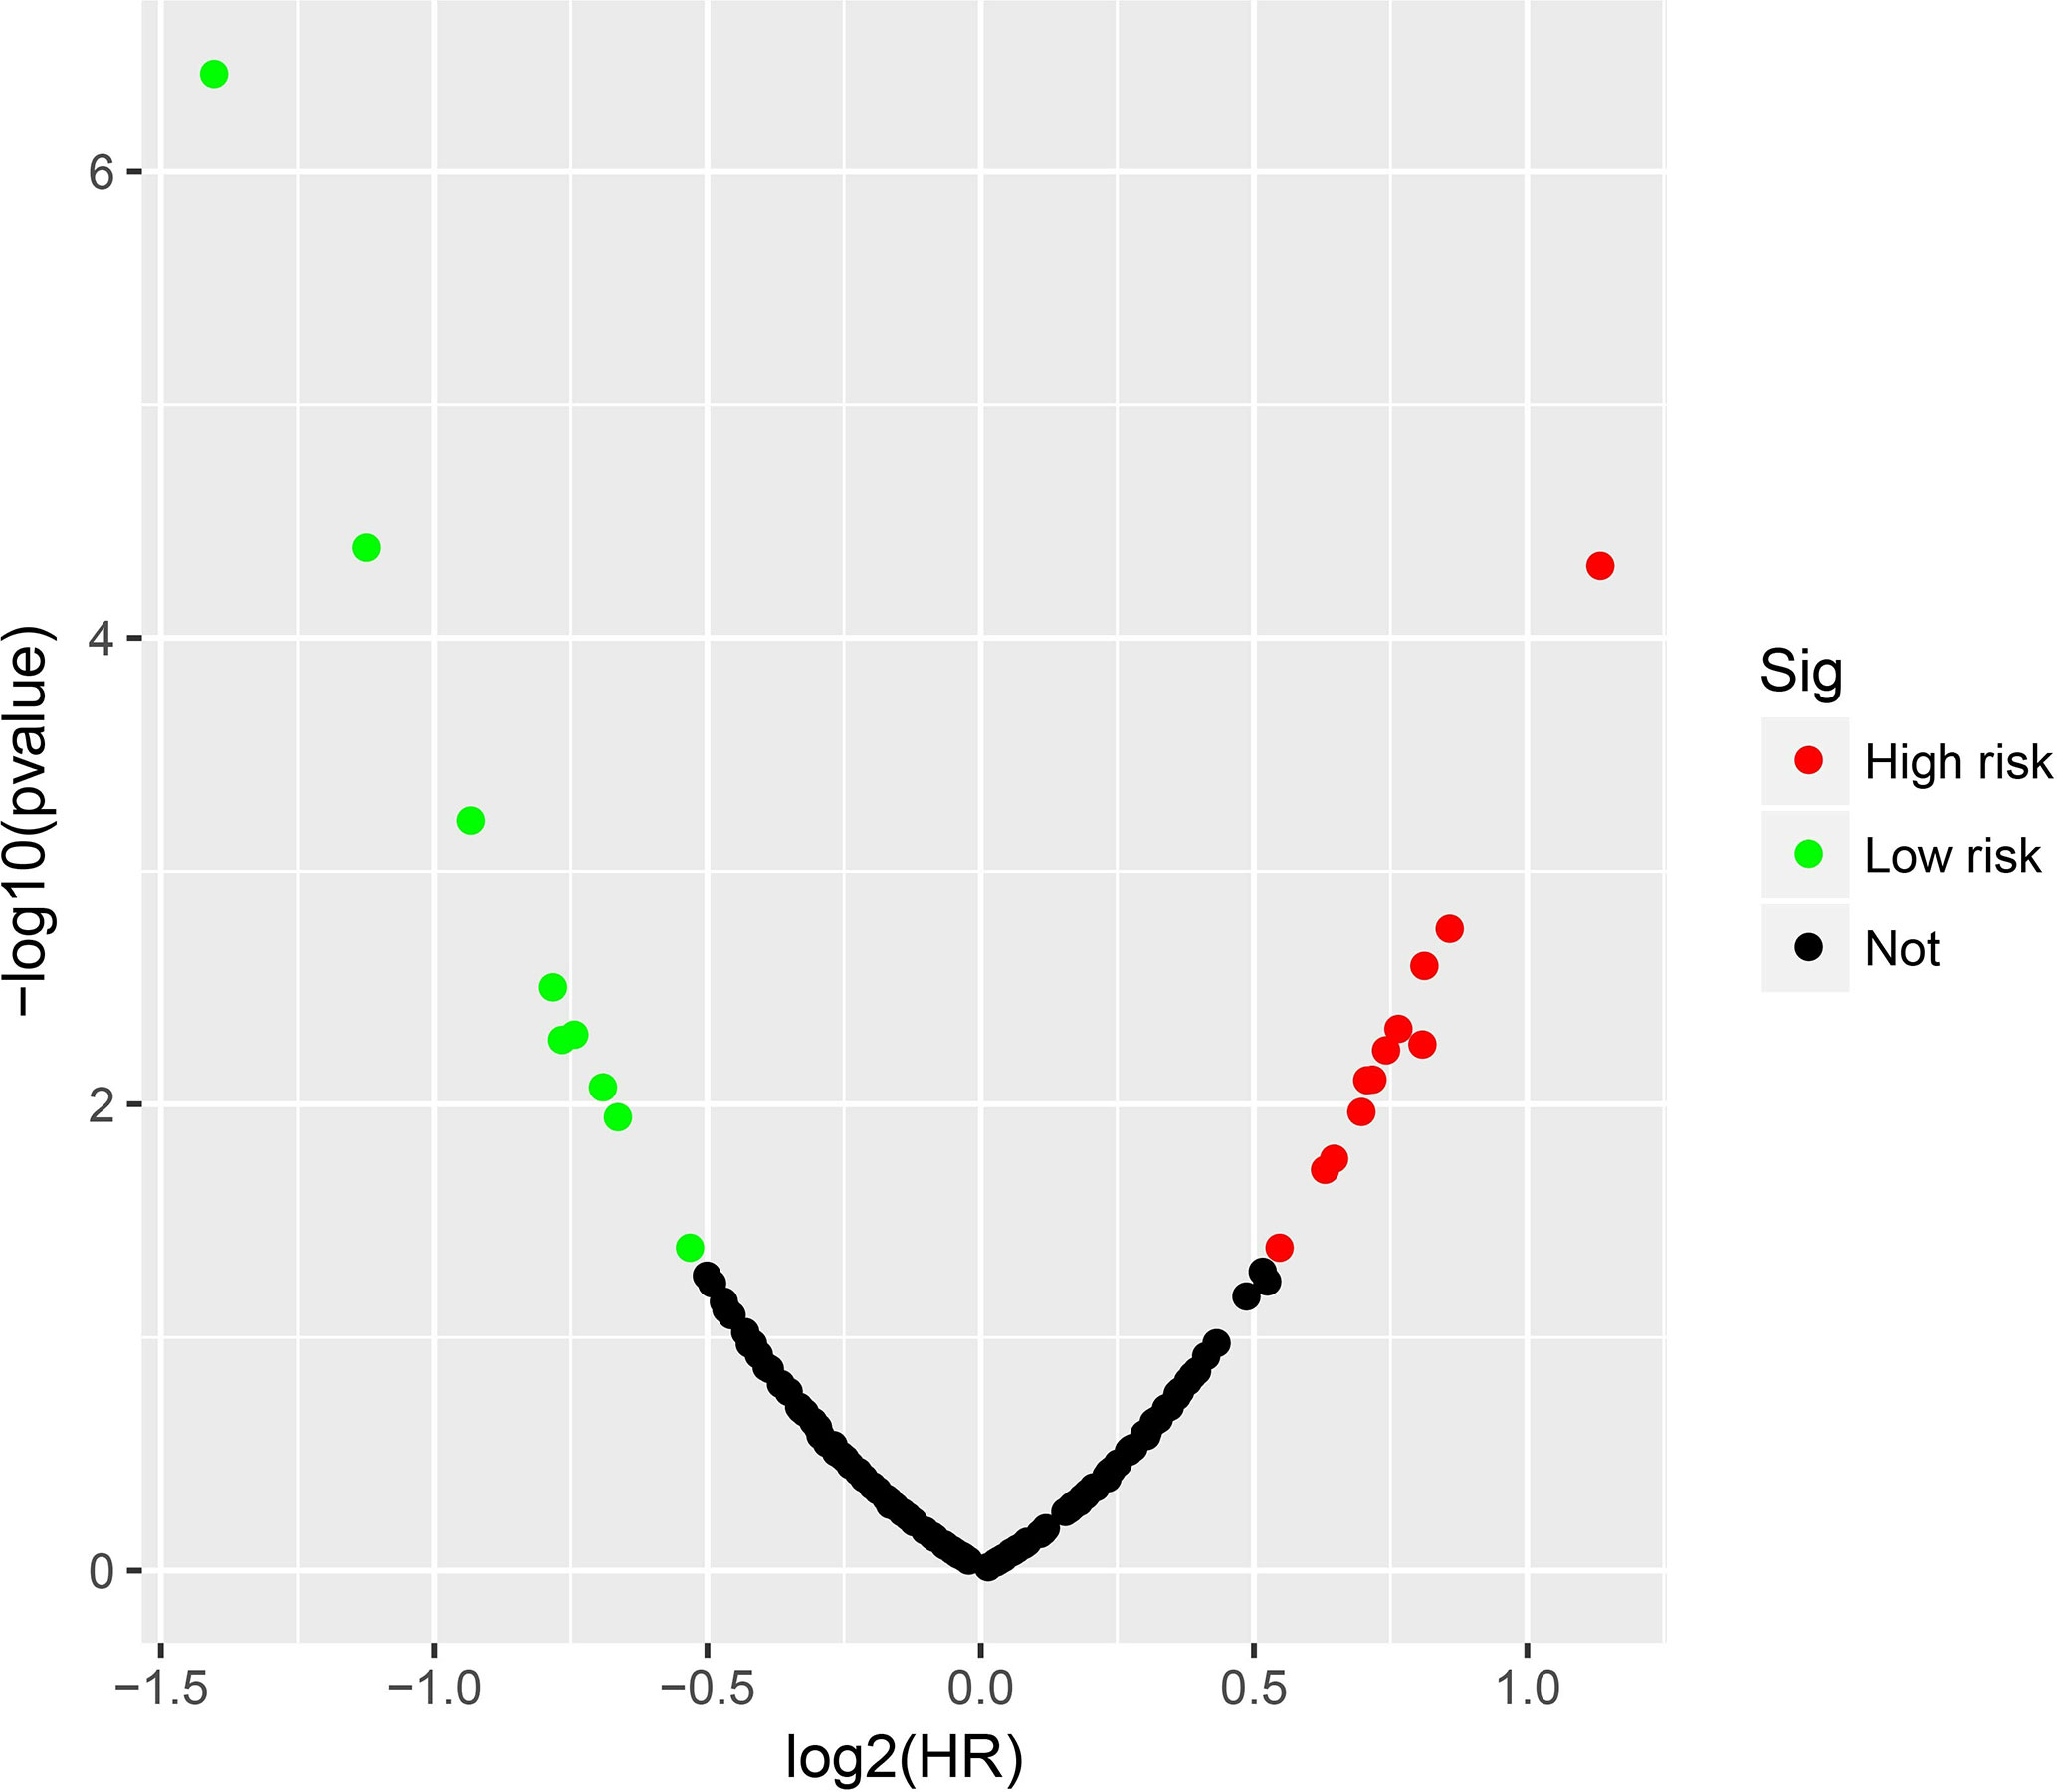
Figure 1 Volcano plot of snoRNAs survival analysis results in TCGA LGG cohort.
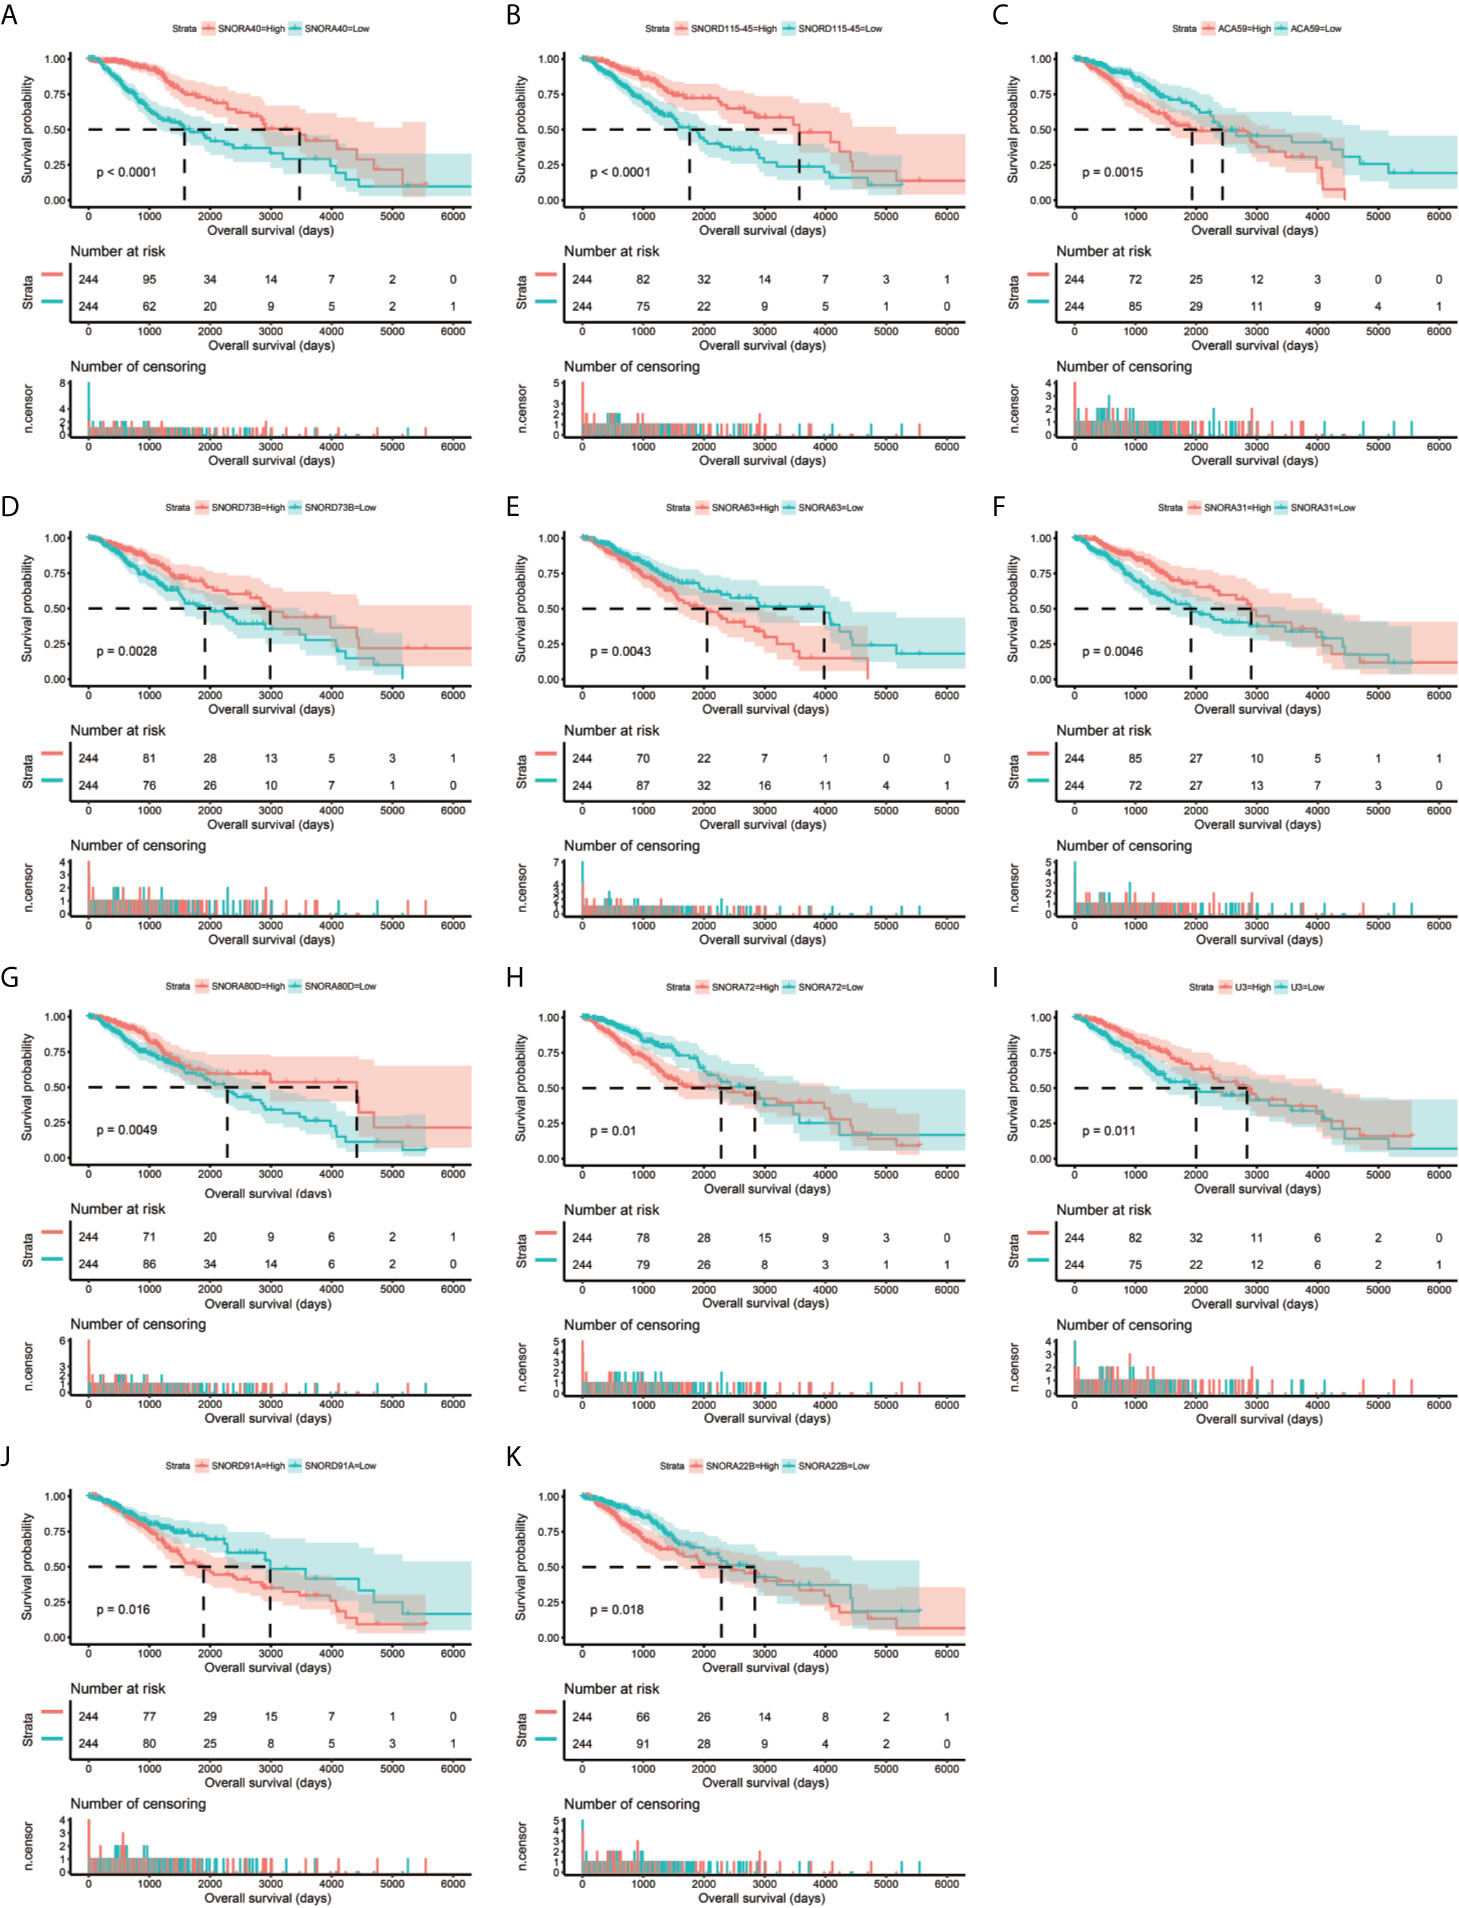
Figure 2 Kaplan–Meier survival curves of 11 snoRNAs that constitute the prognostic signature. SNORA40 (A), SNORD115-45 (B), ACA59 (C), SNORD73B (D), SNORA63 (E), SNORA31 (F), SNORA80D (G), SNORA72 (H), U3 (I), SNORD91A (J), ANORA22B (K).
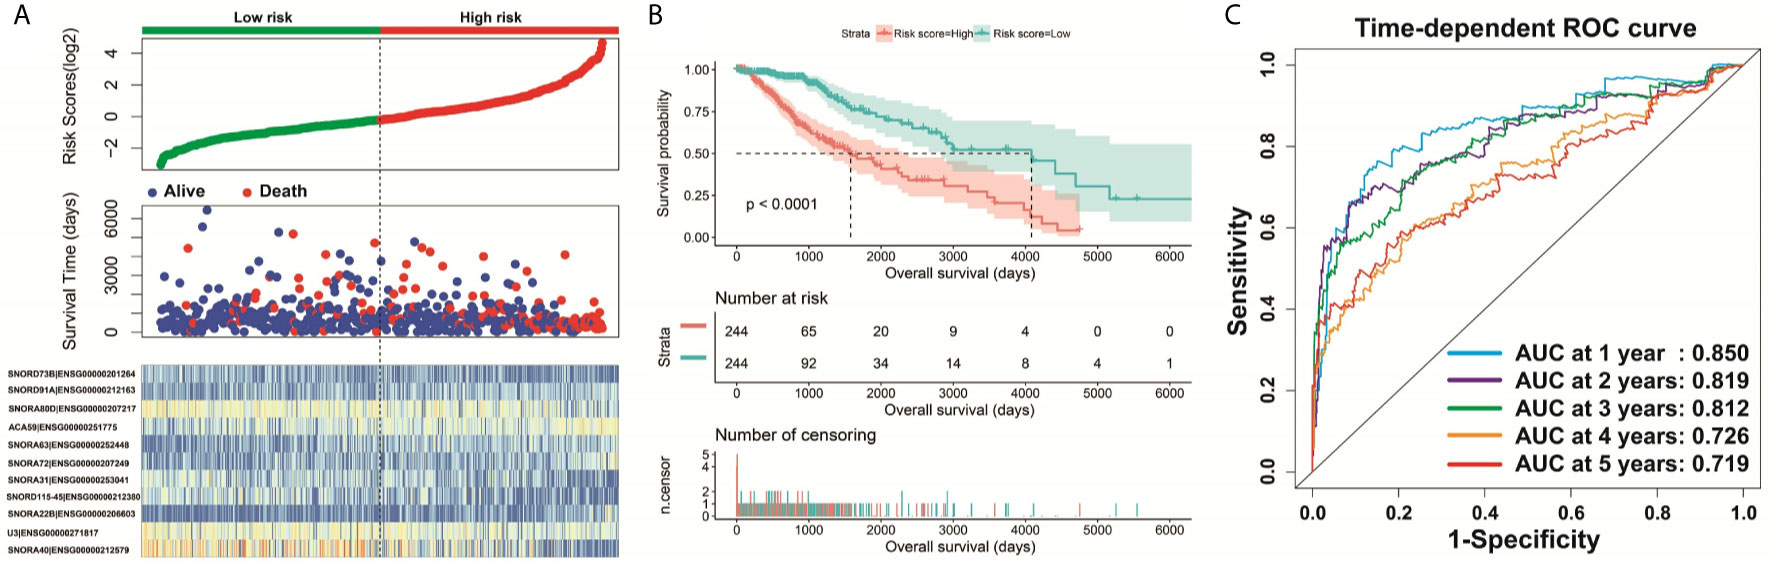
Figure 3 Survival analysis of risk score. (A) Distribution of risk score and survival time of LGG patients; (B) Kaplan–Meier survival curves of risk score; (C) Time-dependent ROC curve of risk score.
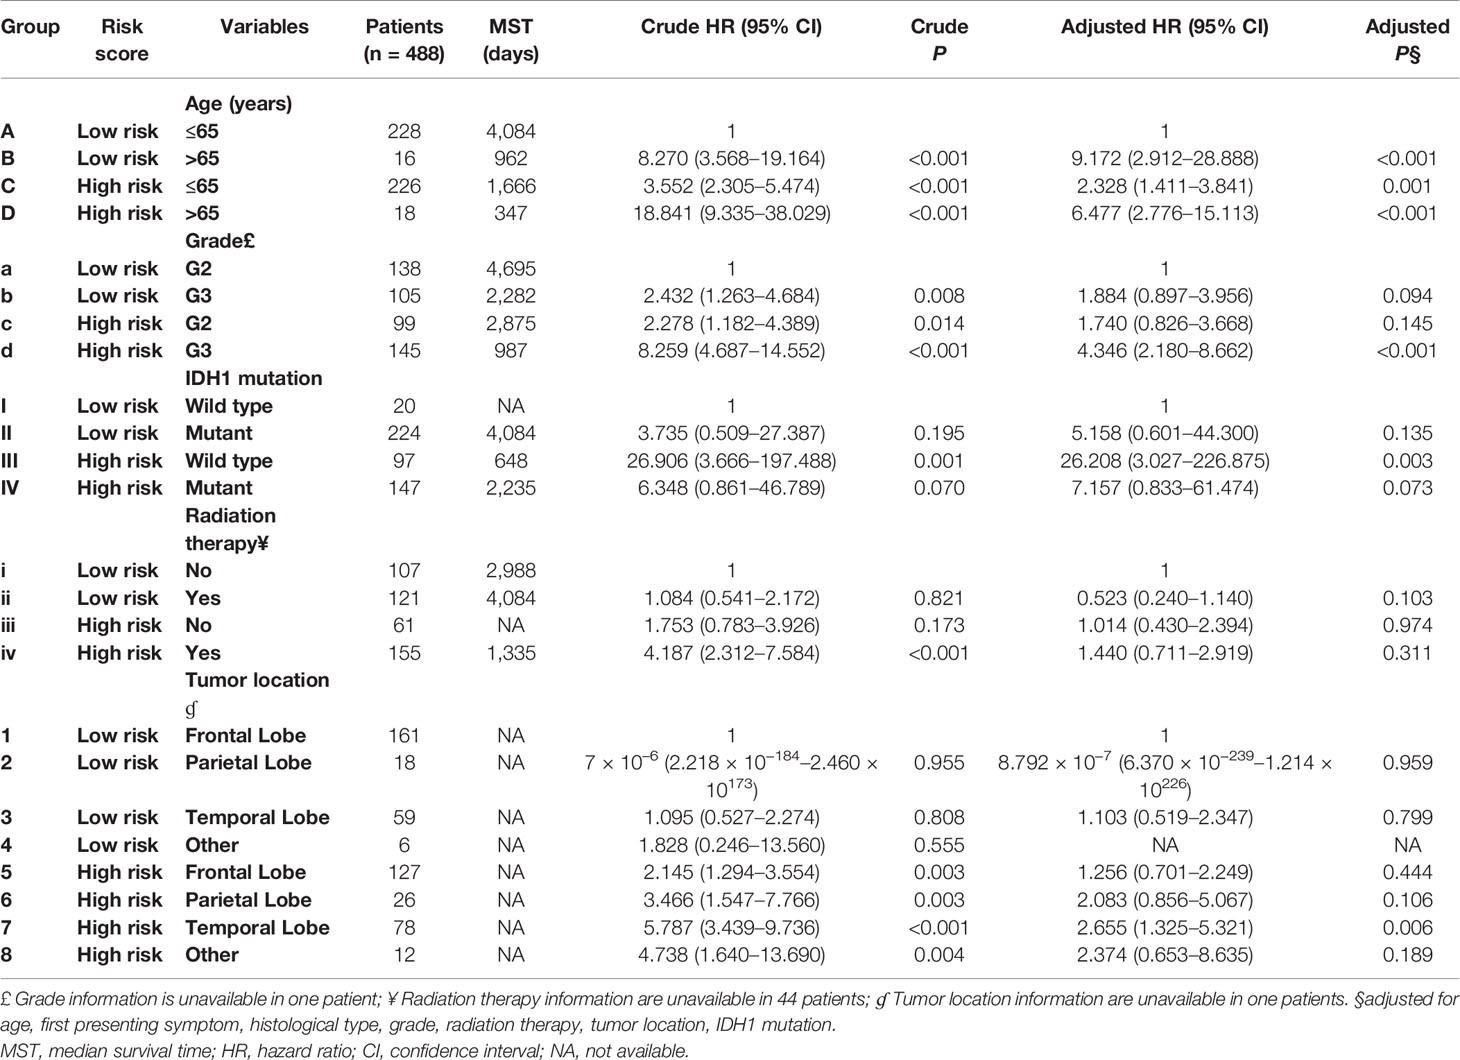
Table 2 Joint effect survival analysis of the prognostic signature and clinical parameters with P <0.01.
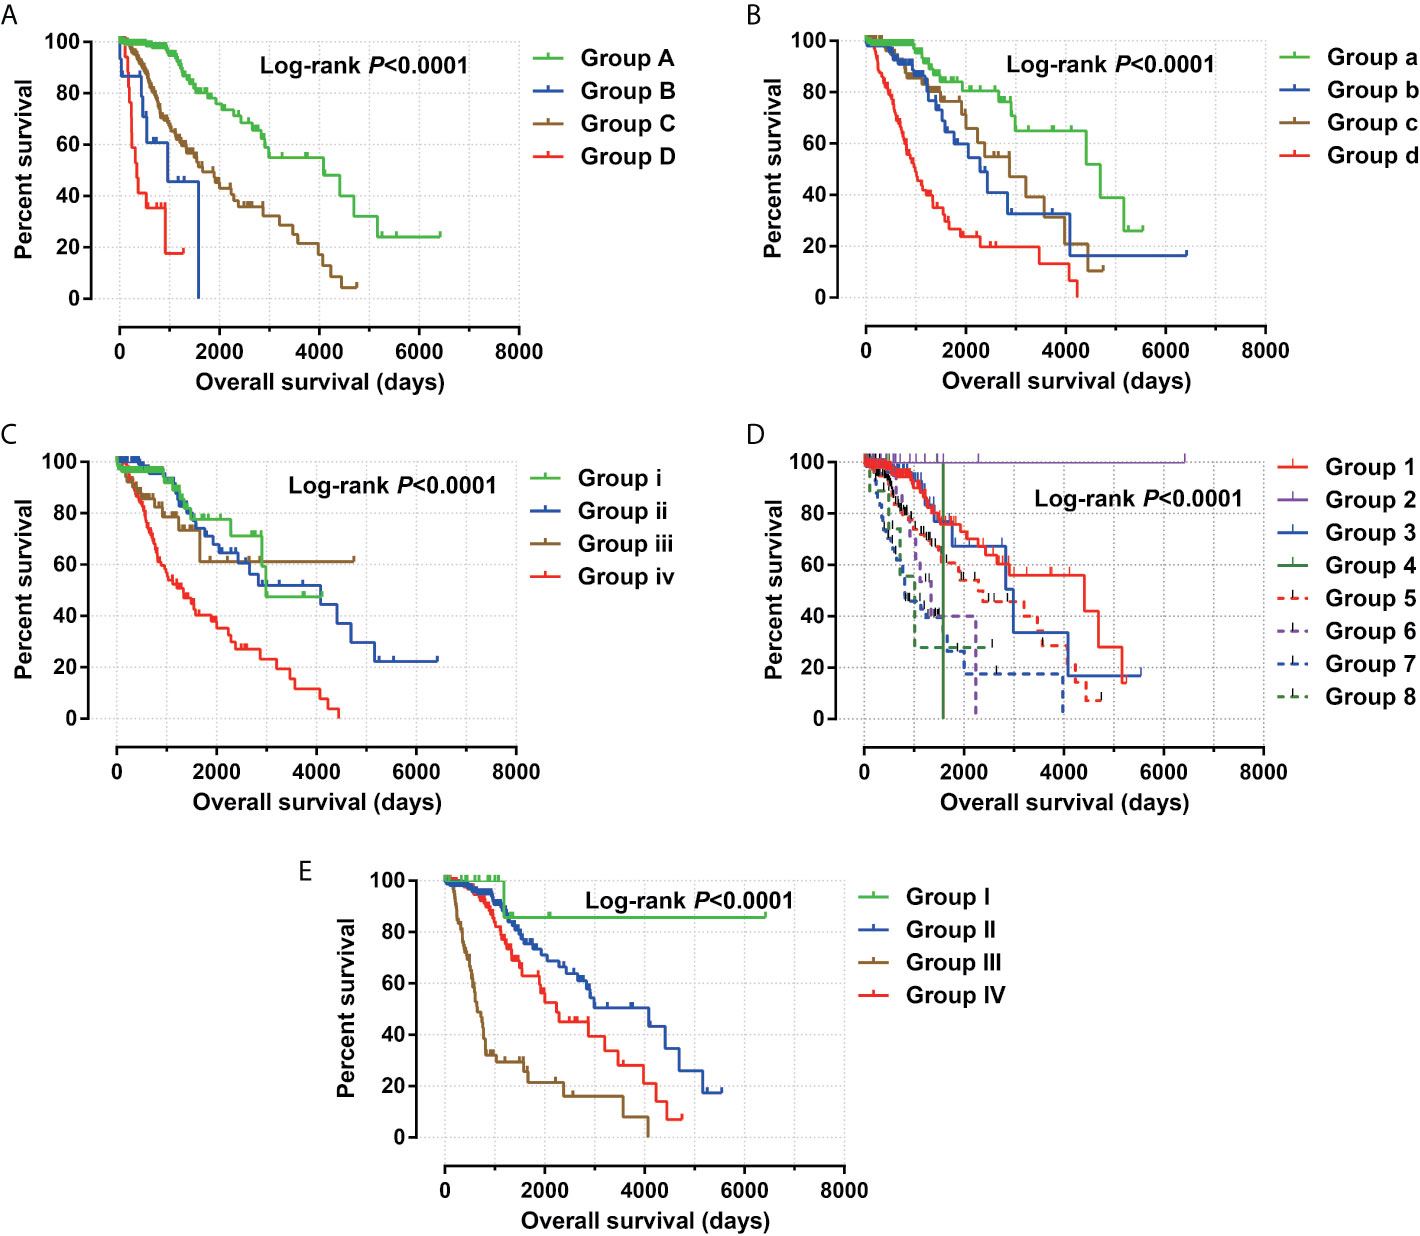
Figure 4 Joint effect survival analysis between risk score and clinical parameters. (A) Combination of risk score and age; (B) Combination of risk score and grade; (C) Combination of risk score and radiation therapy; (D) Combination of risk score and tumor location. (E) Combination of risk score and IDH1 mutation.
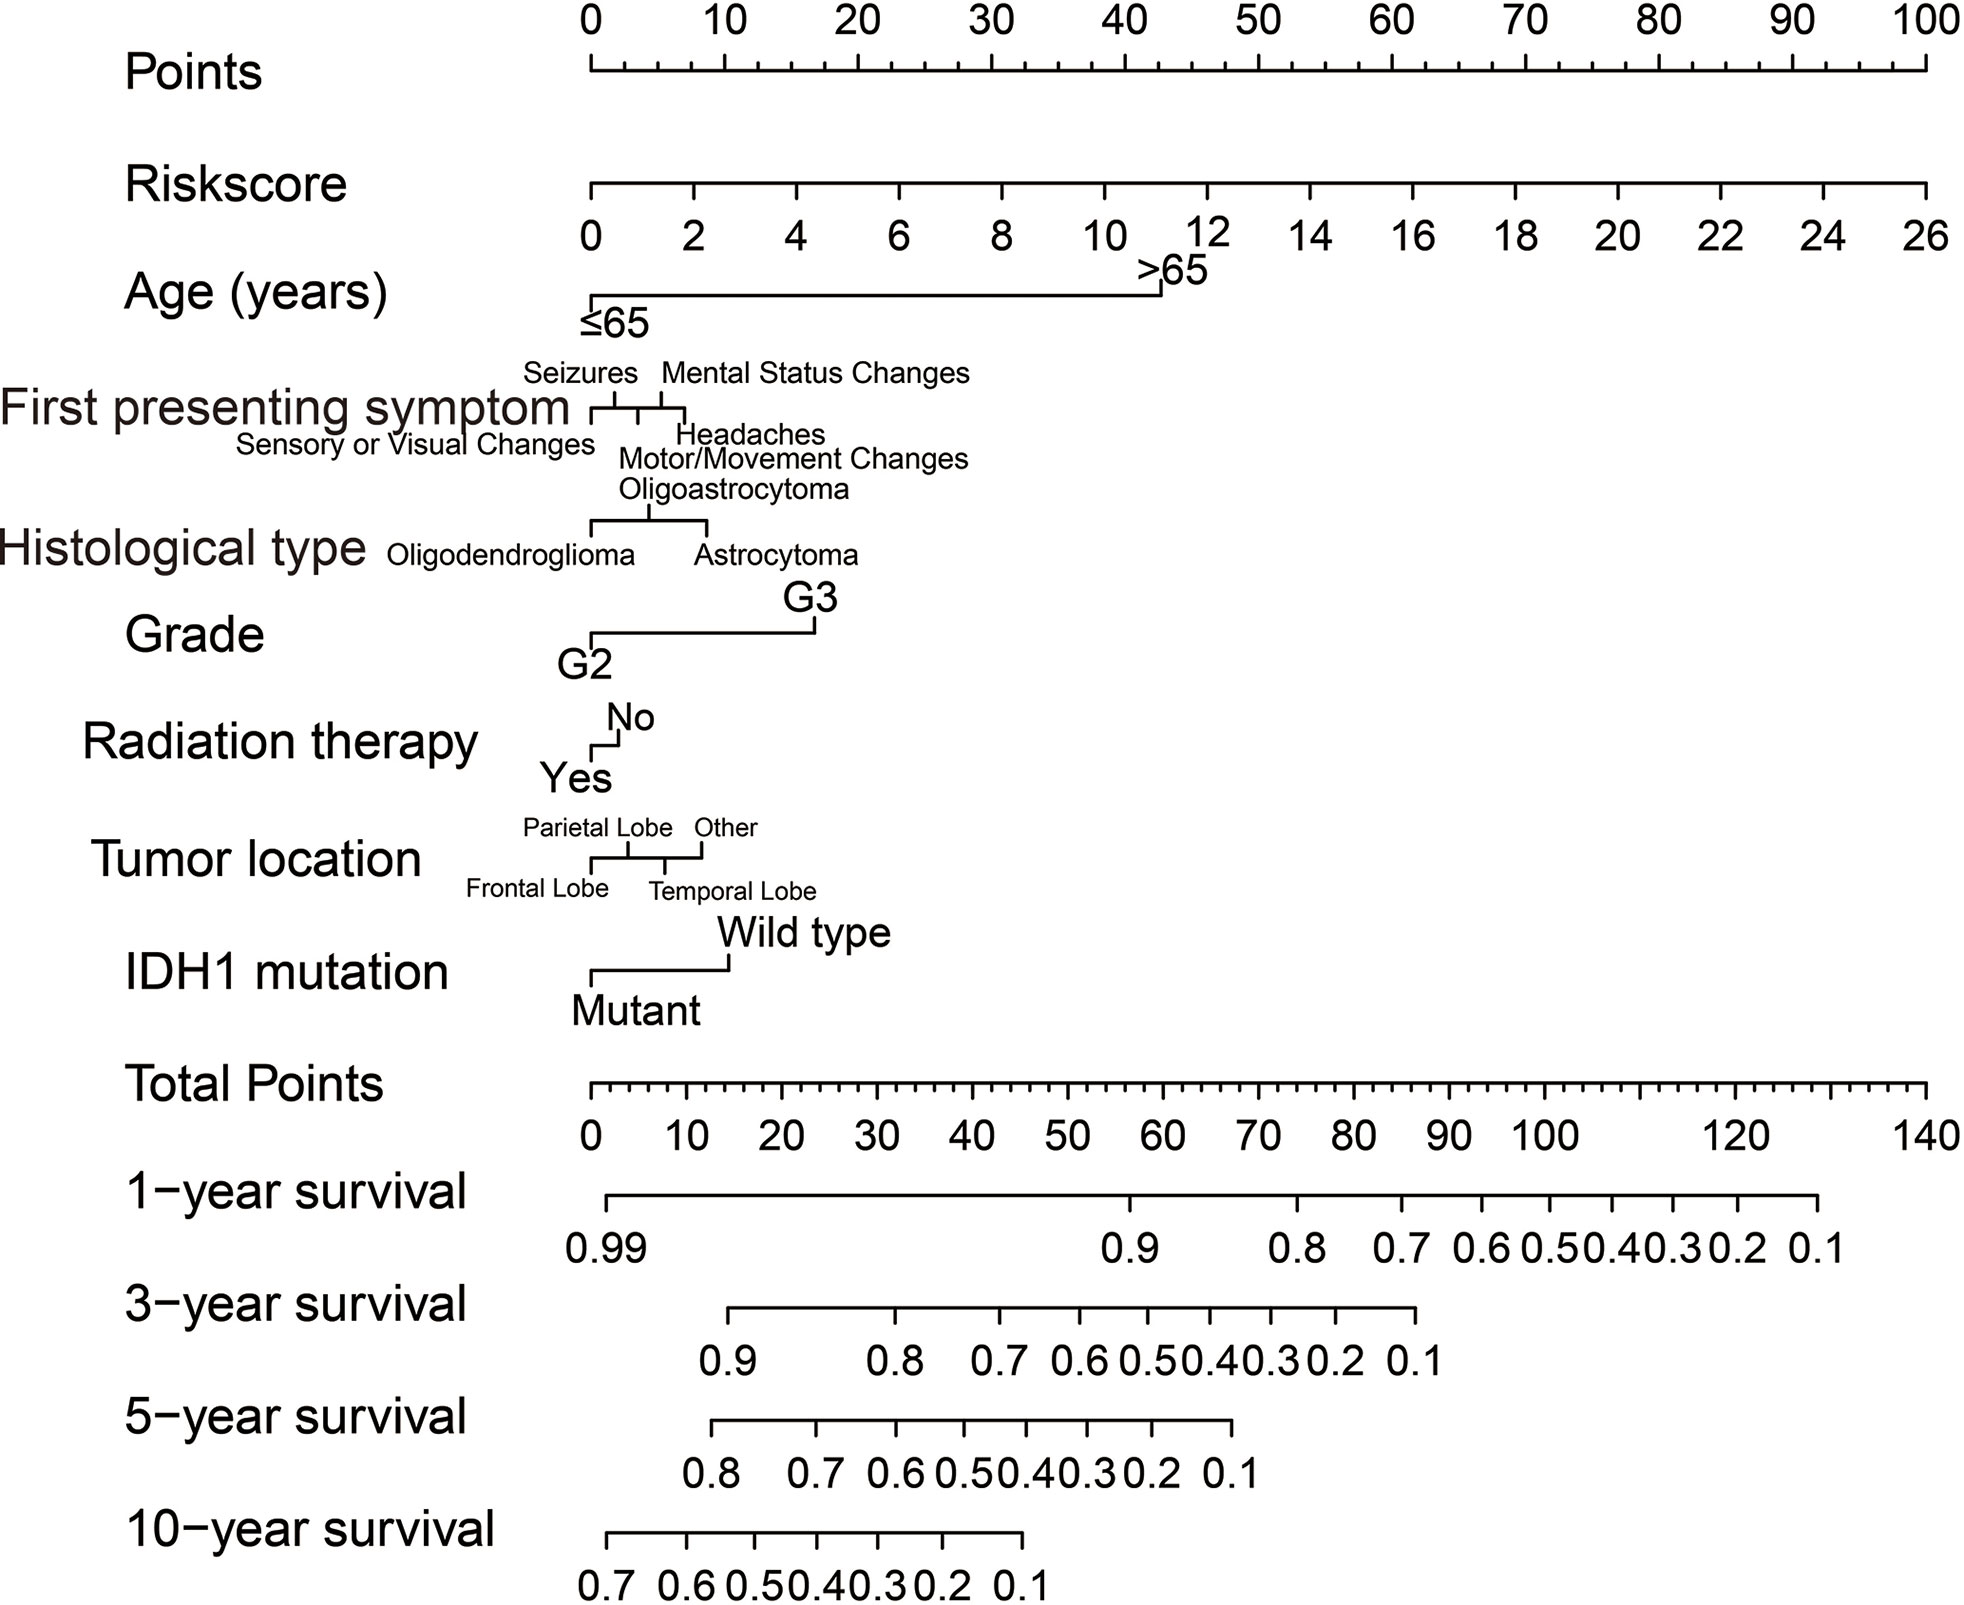
Figure 5 A nomogram constructed in TCGA LGG cohort based on risk score and clinical parameters.
Functional Enrichment Analysis of snoRNAs Signature
Through genome-wide co-expression analysis, 990 co-expression pairs of snoRNAs-PCGs were identified, and the snoRNAs-PCGs co-expression interaction network is shown in Figure S1, since we did not screen the co-expressed PCGs of SNORD91A in this cohort. Finally, we will screen the co-expressed genes of 10 snoRNAs into the subsequent functional enrichment analysis. Enrichment analysis reveals that these snoRNA co-expressed PCGs may work by participating in the following biological functions: DNA repair, neuromuscular process controlling balance, covalent chromatin modification, neurotransmitter secretion, voltage-gated calcium channel activity, NIK/NF-kappaB signaling, nervous system development, neuromuscular junction, neuronal action potential, protein polyubiquitination, chemical synaptic transmission, brain morphogenesis, regulation of long-term neuronal synaptic plasticity, positive regulation of GTPase activity, MAPK cascade, positive regulation of cyclin-dependent protein serine/threonine kinase activity involved in G1/S transition of mitotic cell cycle, protein kinase binding, regulation of cell cycle, synaptic vesicle cycle and glutamatergic synapse (Table S3). We also performed a multivariate survival analysis on these snoRNA co-expressed PCGs, and obtained 180 prognostic PCGs of LGG (Figure 6A). The top three significant PCGs are zinc finger protein 821 (ZNF821, Figure 6B), solute carrier family 8 member A3 (SLC8A3, Figure 6C) and cellular communication network factor 4 (CCN4, also named as WISP1, Figure 6D).
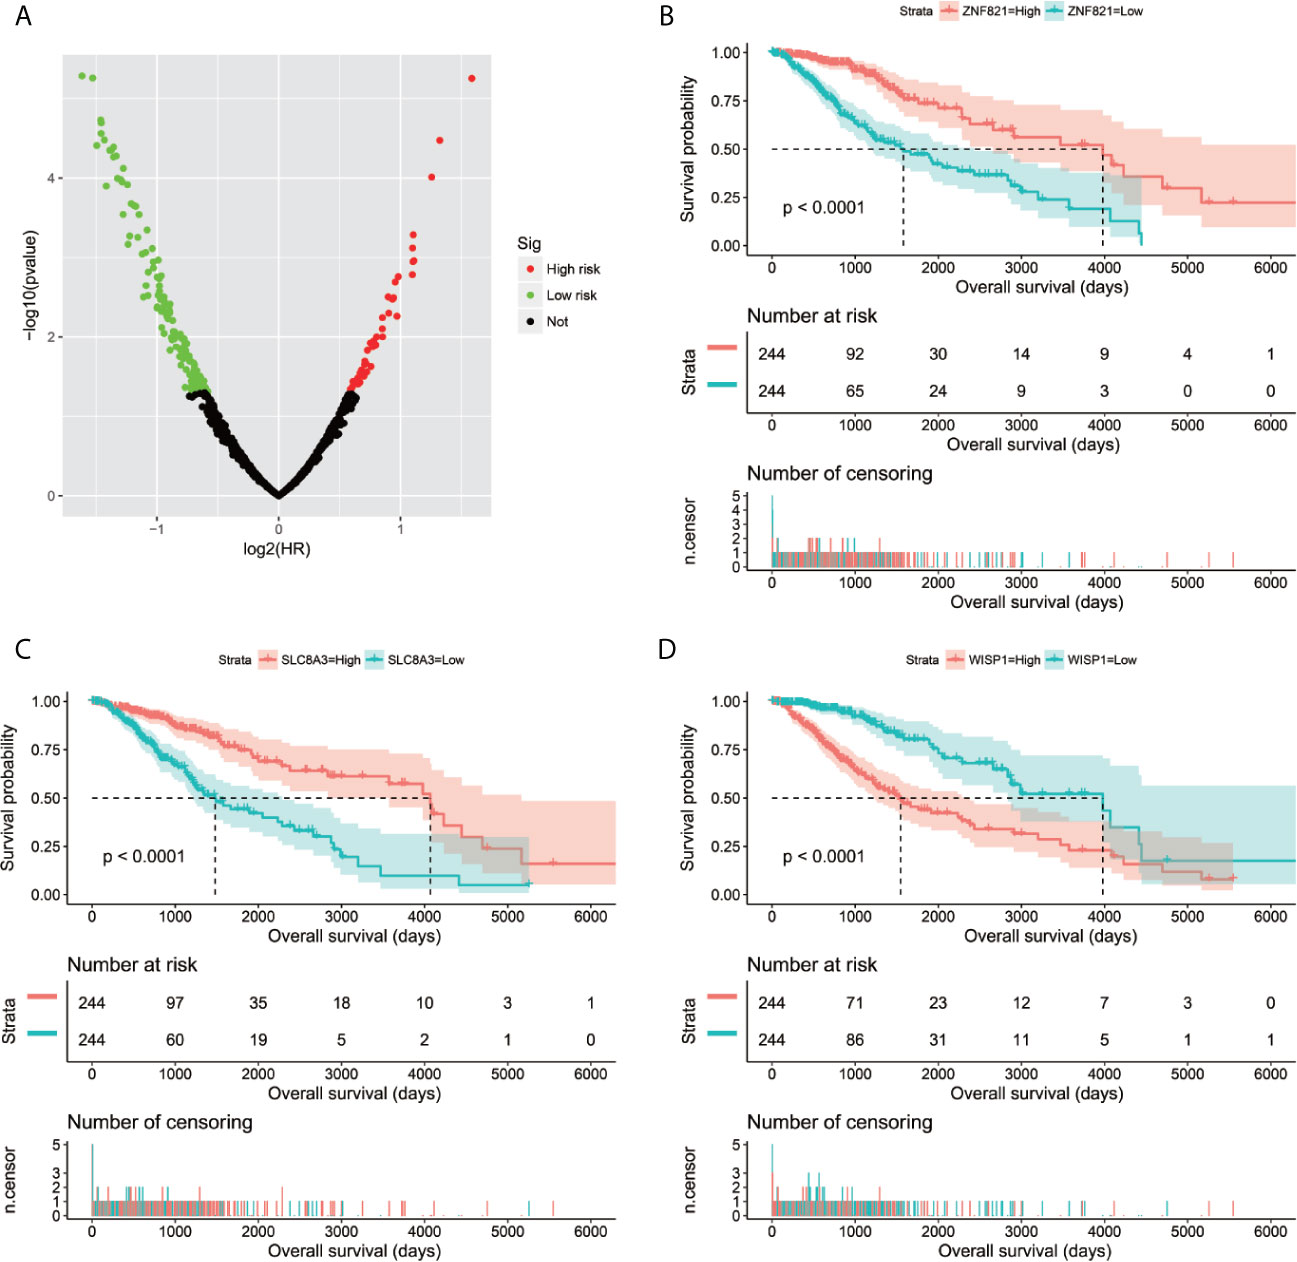
Figure 6 Survival analysis results of snoRNAs co-expressed PCGs in TCGA LGG cohort. (A) Volcano plot of snoRNAs co-expressed PCGs survival analysis results; (B) Kaplan–Meier survival curves of ZNF821; (C) Kaplan–Meier survival curves of SLC8A3; (D) Kaplan–Meier survival curves of WISP1.
In order to reveal the molecular mechanisms that cause the prognosis difference of LGG patients with high- and low-risk score phenotypes, we also compared patients with two phenotypes using the GSEA approach. GSEA using the c5 reference gene set suggested that LGG patients with high-risk score phenotypes are significantly different from low-risk score phenotypes in the following biological processes: integrin mediated signaling pathway, natural killer cell mediated immunity, cell adhesion mediated by integrin, kappa B kinase NF kappa B signaling, toll like receptor signaling pathway, T cell mediated immunity, regulation of tumor necrosis factor mediated signaling pathway, T cell receptor signaling pathway, Wnt activated receptor activity, hippo signaling, Wnt protein binding, receptor signaling pathway via STAT, regulation of cell cycle G1/S phase transition, NIK/NF kappa B signaling, tumor necrosis factor mediated signaling pathway, stem cell proliferation (Figures 7A–P). GSEA using the c2 reference gene set suggested that LGG patients with high-risk score phenotypes are significantly different from low-risk score phenotypes in the following pathways: CD8/TCR pathway, natural killer cell mediated cytotoxicity, B cell receptor signaling pathway, PI3KCI pathway, caspase pathway, TH1/TH2 pathway, P53 pathway, metastasis up, tumor vasculature up, JAK/STAT signaling pathway, cell adhesion molecules CAMs, P38/MAPK pathway, Wnt pathway require Myc, signaling by Rho gtpases, tumorigenesis up and NF-κB pathway (Figures S2A–P).
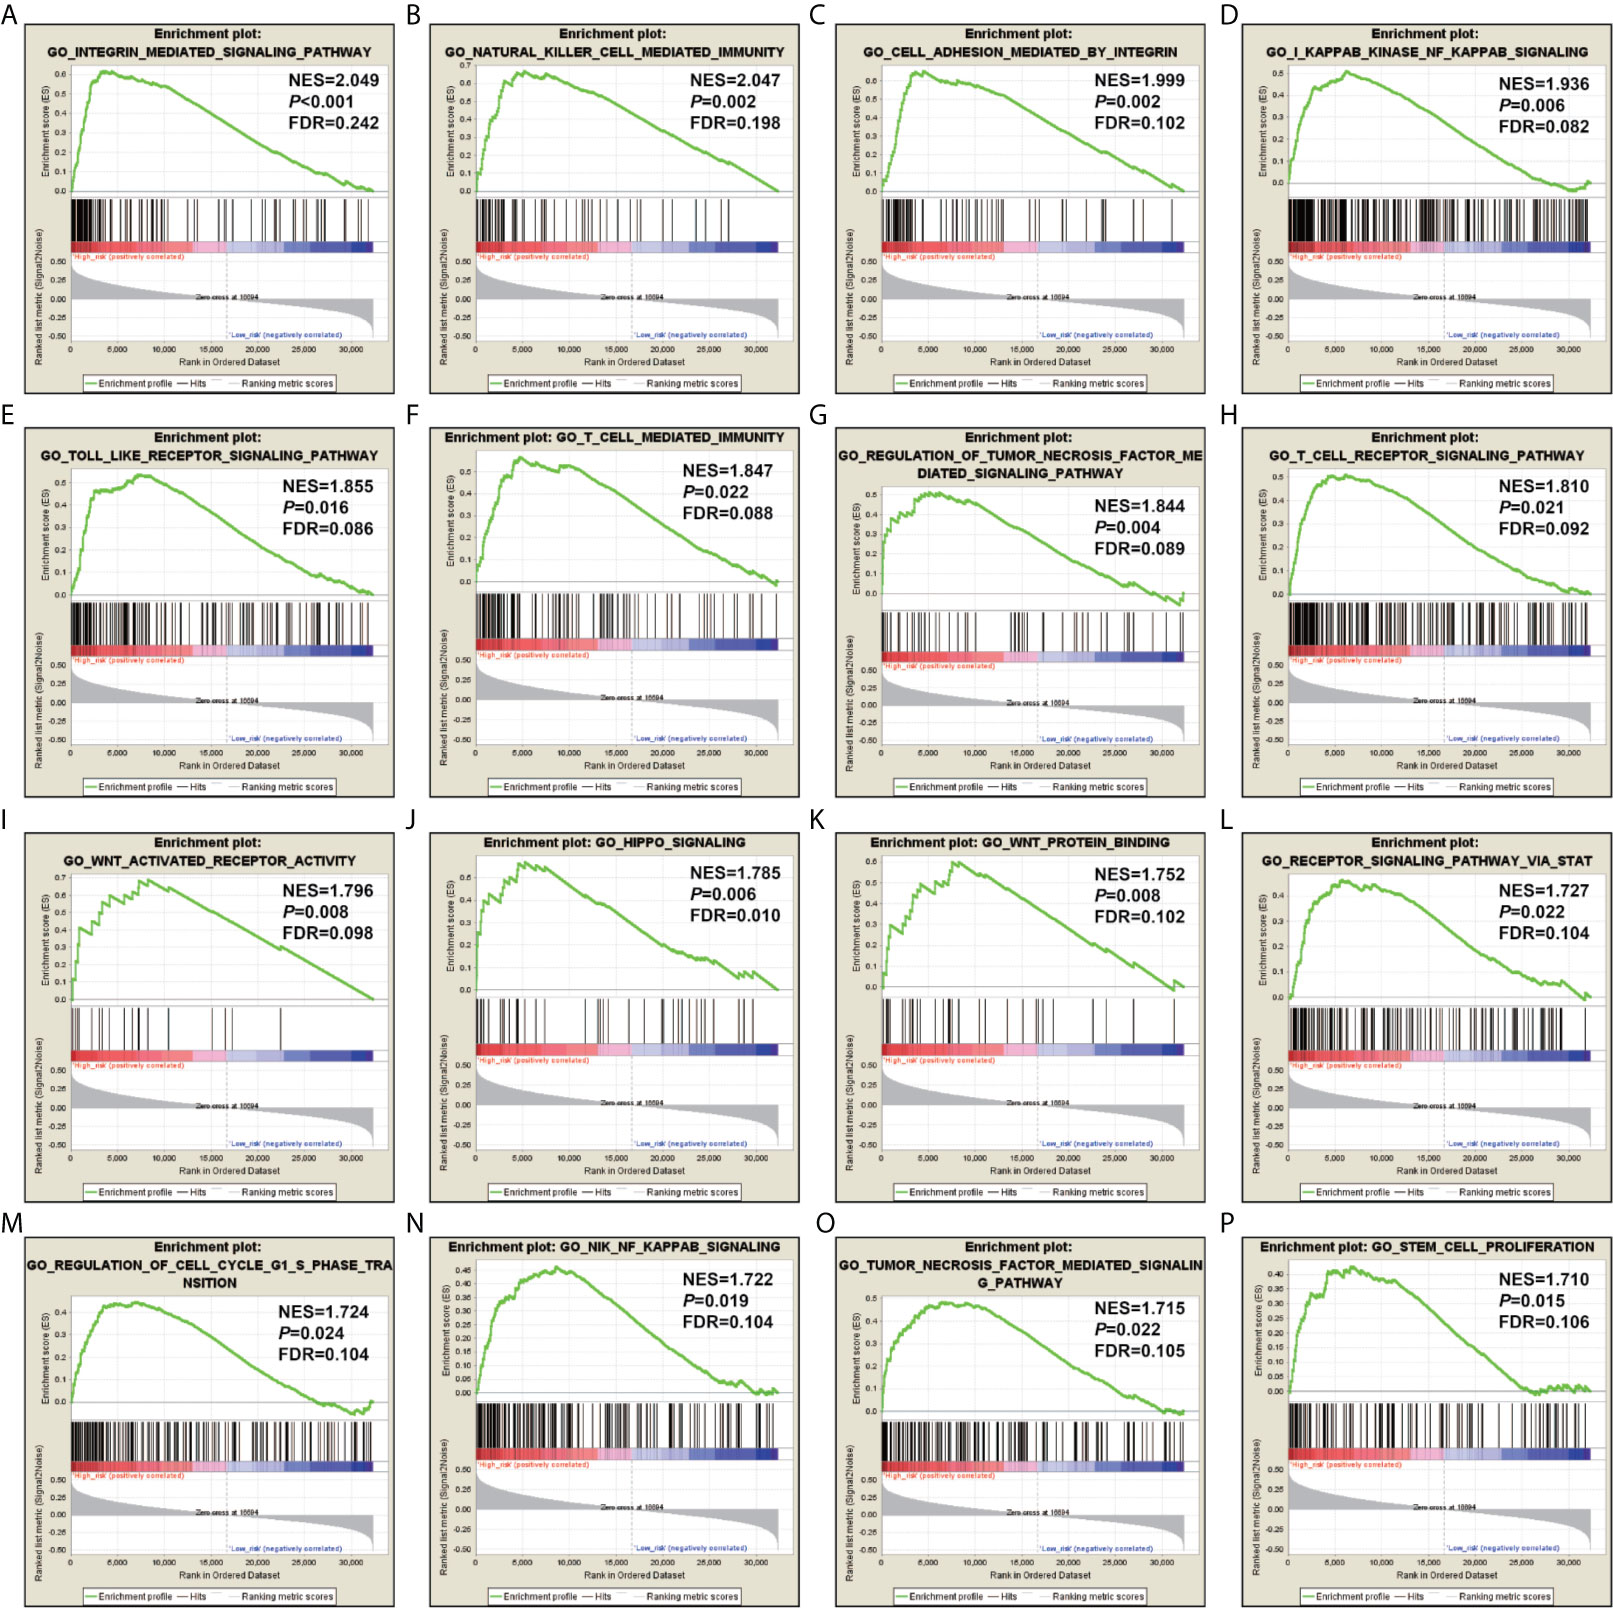
Figure 7 GSEA results using the c5 reference gene set. (A) integrin mediated signaling pathway; (B) natural killer cell mediated immunity; (C) cell adhesion mediated by integrin; (D) kappa B kinase NF kappa B signaling; (E) toll like receptor signaling pathway; (F) T cell mediated immunity; (G) regulation of tumor necrosis factor mediated signaling pathway; (H) T cell receptor signaling pathway; (I) Wnt activated receptor activity; (J) hippo signaling; (K) Wnt protein binding; (L) receptor signaling pathway via STAT; (M) regulation of cell cycle G1/S phase transition; (N) NIK/NF kappa B signaling; (O) tumor necrosis factor mediated signaling pathway; (P) stem cell proliferation.
We screened 1319 DEGs between high- and low-risk score phenotypes by edgeR, of them, 122 DEGs were down-regulation and 1197 DEGs were up-regulation (Figure 8, Figure S3 and Table S7). Functional enrichment revealed that these DEGs may function by participating in the following biological processes: positive regulation of cell proliferation, cell-cell signaling, positive regulation of ERK1 and ERK2 cascade, interferon-gamma-mediated signaling pathway, regulation of immune response, neuron migration, angiogenesis, positive regulation of cell migration, cytokine-mediated signaling pathway, cell adhesion, cellular response to interleukin-1, cell differentiation, positive regulation of T cell proliferation, positive regulation of cytosolic calcium ion concentration involved in phospholipase C-activating G-protein coupled signaling pathway, cell surface receptor signaling pathway, neuropeptide signaling pathway, JAK-STAT cascade, mitotic sister chromatid segregation, cell division, mitotic nuclear division, integrin binding, cell-matrix adhesion, T cell receptor signaling pathway, response to hypoxia, positive regulation of protein kinase B signaling, epithelial to mesenchymal transition, regulation of vascular endothelial growth factor production, positive regulation of MAPK cascade, cellular response to fibroblast growth factor stimulus, phosphatidylinositol-4,5-bisphosphate 3-kinase activity, Wnt-protein binding, cytokine–cytokine receptor interaction, ECM-receptor interaction, cell adhesion molecules (CAMs), focal adhesion, PI3K-Akt signaling pathway, Proteoglycans in cancer, cell cycle, chemokine signaling pathway, Jak-STAT signaling pathway, and transcriptional misregulation in cancer (Table S8). We also performed a multivariate survival analysis on these DEGs, and obtained 320 prognostic DEGs of LGG (Table S9 and Figure 9A). The top three significant DEGs were calcium binding protein 4 (CABP4, Figure 9B), elastin microfibril interfacer 3 (EMILIN3, Figure 9C) and ISL LIM homeobox 2 (ISL2, Figure 9D). We use these DEGs through the CMAP to identify the potential targeted therapy drugs of this snoRNAs prognostic signature in LGG. We have obtained ten targeted therapy drugs for this snoRNAs prognostic signature in LGG. These drugs are 15-delta prostaglandin J2, MG-262, vorinostat, 5155877, puromycin, anisomycin, withaferin A, ciclopirox, chloropyrazine and megestrol (Table 3). The chemical structures of nine drugs (except 15-delta prostaglandin J2) can be obtained through PubChem, which are shown in Figures 10A–I. Subsequently, we also constructed the drug-genes interaction network by STITCH, In addition to 15-delta prostaglandin J2 and 5155877, we can obtain drug-genes interaction network for the remaining 8 drugs (Figure S4). We found that these drugs can work by regulating genes that are differentially expressed between high and low-risk score phenotypes. MG-262 may function in LGG by regulating cyclin dependent kinase 4 (CDK4), NME/NM23 family member 8 (NME8), chloride intracellular channel 6 (CLIC6) and acyl-coa dehydrogenase long chain (ACADL), while withaferin A through regulating tubulin beta 6 class V (TUBB6), vimentin (VIM), DLG associated protein 5 (DLGAP5), CDK4, tubulin alpha 1c (TUBA1C), kinesin family member C1 (KIFC1). Vorinostat was function by regulating UDP glucuronosyltransferase family 2 member B17 (UGT2B17), suppressor of cytokine signaling 3 (SOCS3), epidermal growth factor receptor (EGFR), Fas ligand (FASLG) and matrix metallopeptidase 9 (MMP9). Ciclopirox was function by regulating lactotransferrin (LTF), arachidonate 15-lipoxygenase (ALOX15) and baculoviral IAP repeat containing 5 (BIRC5). Megestrol was function by regulating gamma-aminobutyric acid type A receptor subunit gamma 2 (GABRG2) and neuronal PAS domain protein 4 (NPAS4). Anisomycin was function by regulating MMP9, dual specificity phosphatase 9 (DUSP9), EGFR, interleukin 6 (IL6), resistin (RETN), growth differentiation factor 15 (GDF15), C-C motif chemokine ligand 20 (CCL20), proteoglycan 4 (PRG4) and mitogen-activated protein kinase 15 (MAPK15). Puromycin was function by regulating actin gamma 2, smooth muscle (ACTG2), fibronectin 1 (FN1), ATP binding cassette subfamily C member 3 (ABCC3), dipeptidyl peptidase 4 (DPP4), EGFR and syndecan 1 (SDC1).
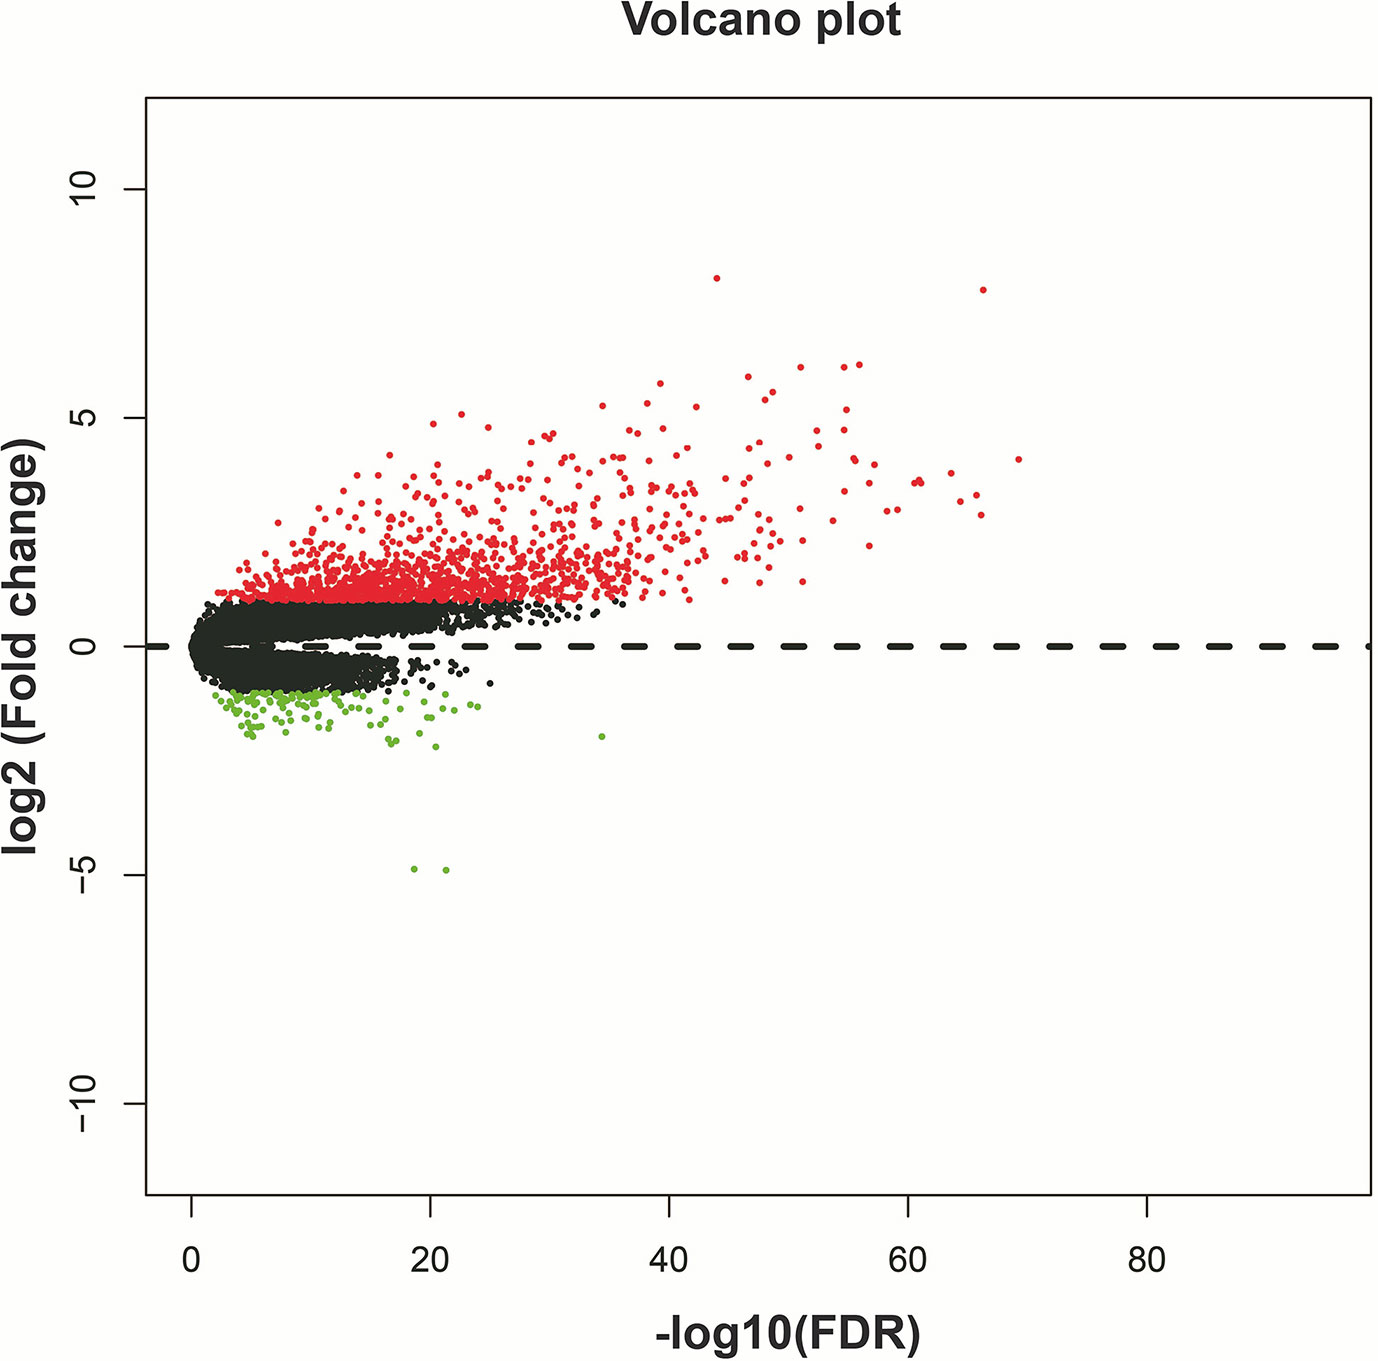
Figure 8 Volcano plot of DEGs between high- and low-risk score phenotypes.
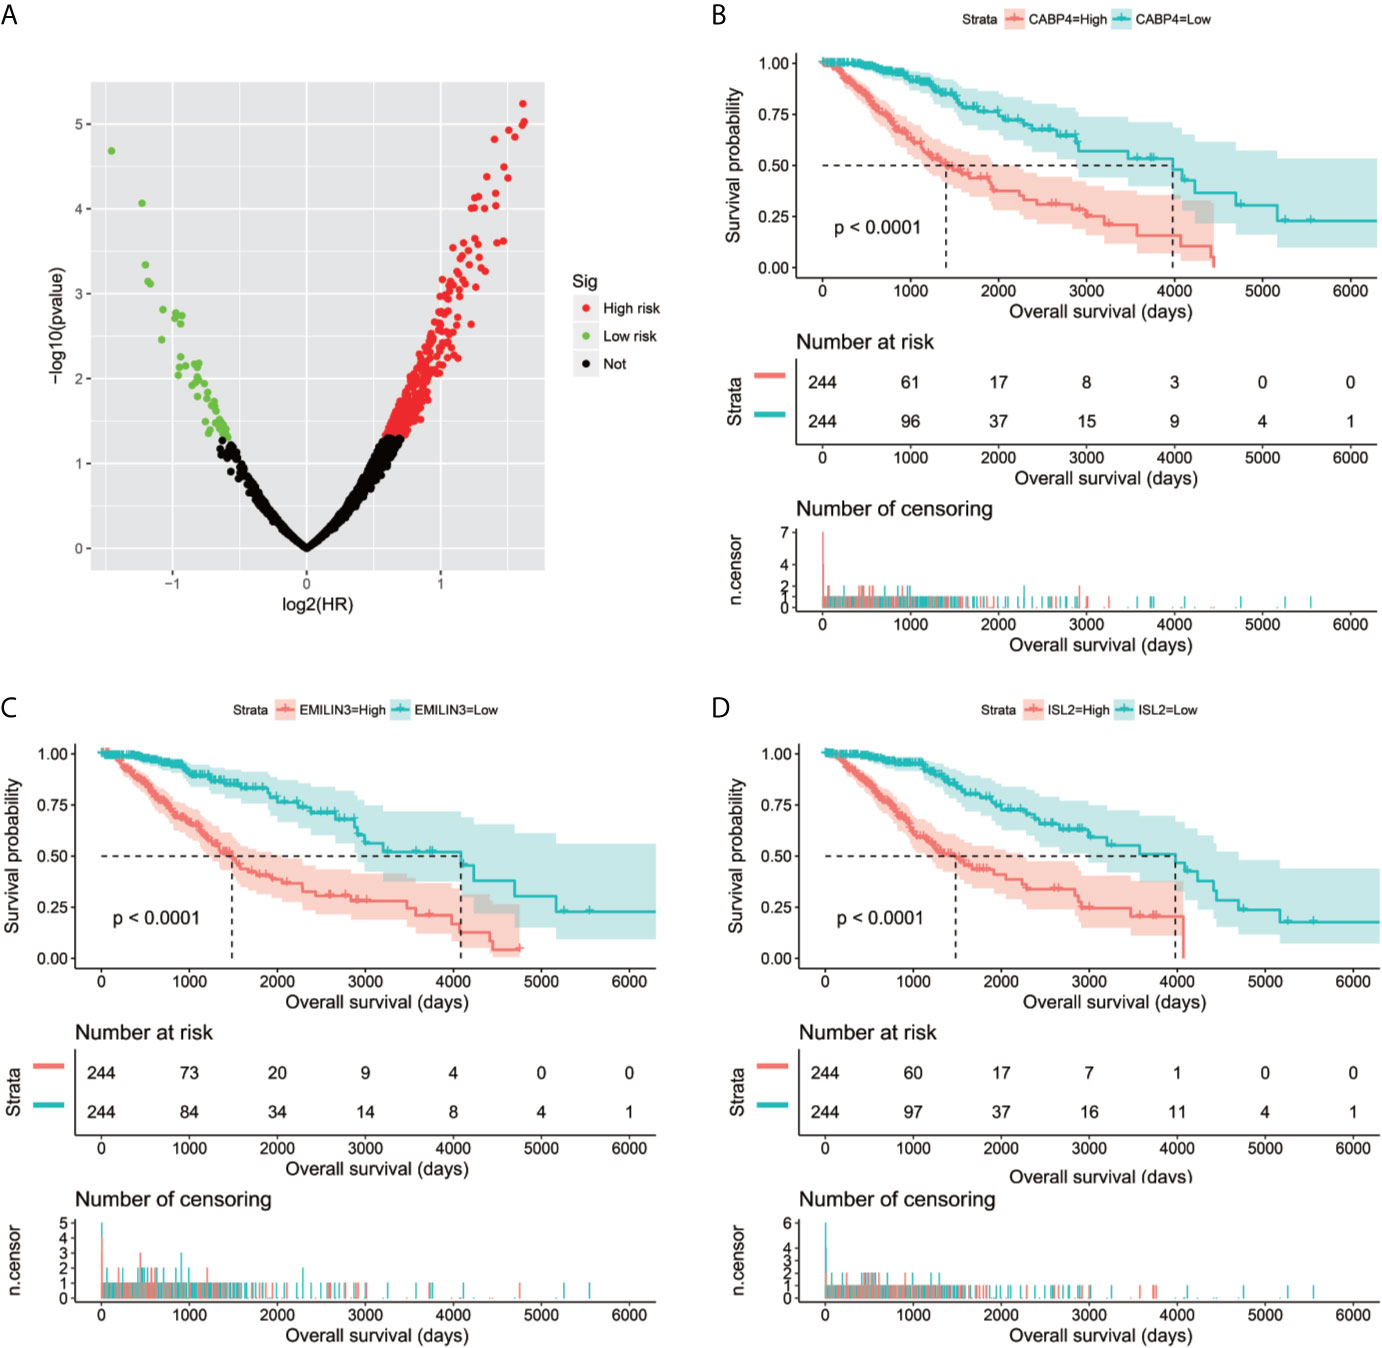
Figure 9 Survival analysis results of DEGs between high- and low-risk score phenotypes in TCGA LGG cohort. (A) Volcano plot of DEGs survival analysis results; (B) Kaplan–Meier survival curves of CABP4; (C) Kaplan–Meier survival curves of EMILIN3; (D) Kaplan–Meier survival curves of ISL2.
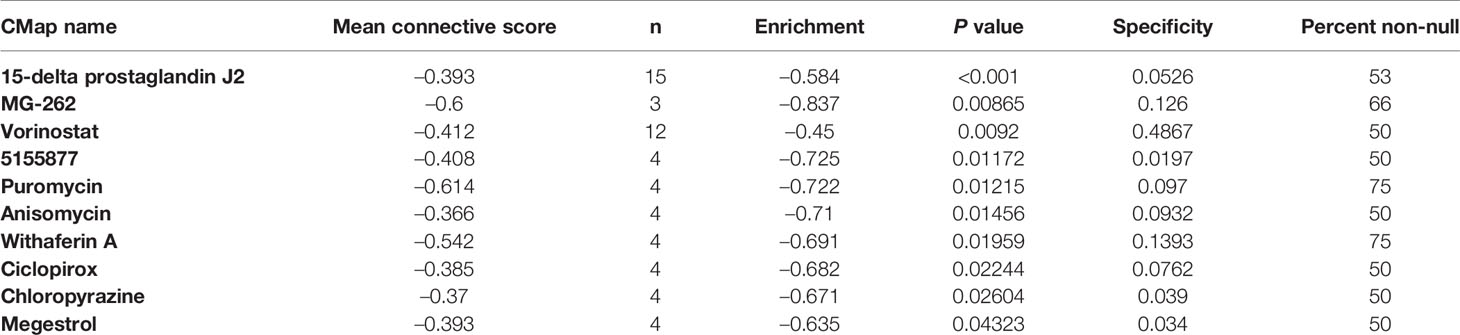
Table 3 Connectivity map analysis results.
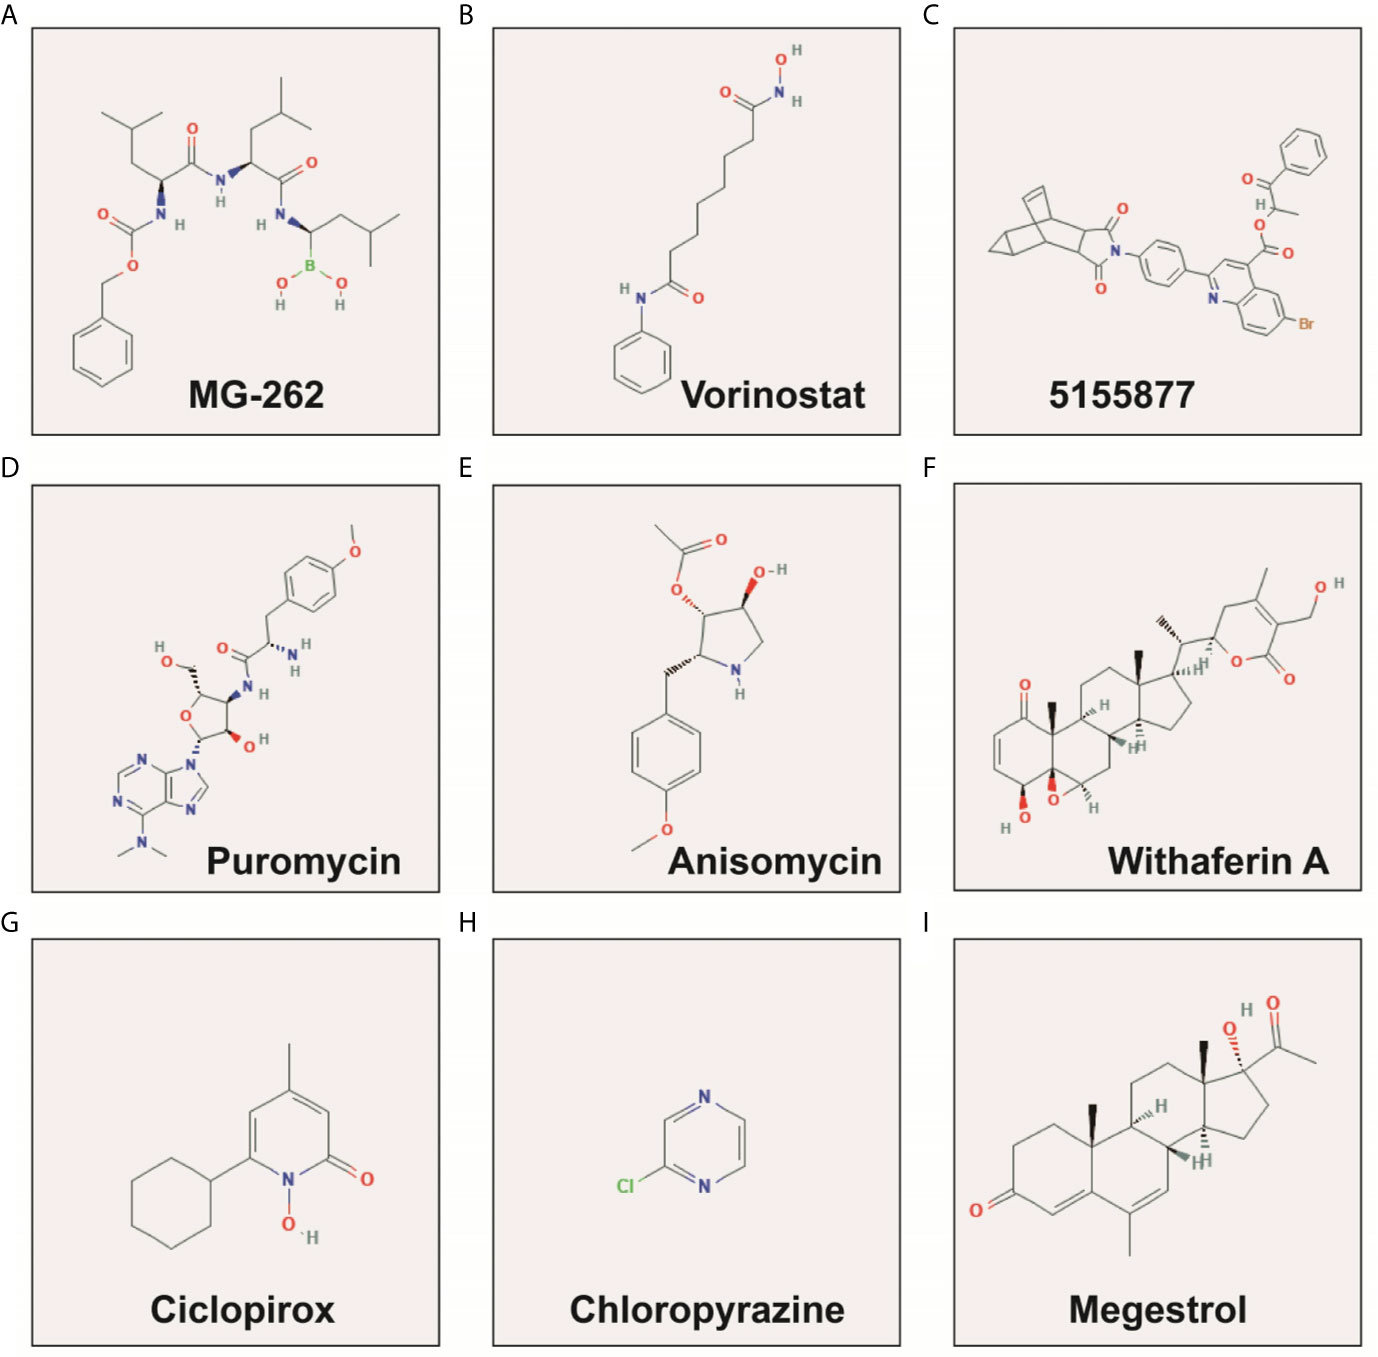
Figure 10 The chemical structure of the targeted therapeutic drugs of snoRNAs prognostic signature in LGG. (A) MG-262; (B) Vorinostat; (C) 5155877; (D) Puromycin; (E) Anisomycin; (F) Withaferin A; (G) Ciclopirox; (H) Chloropyrazine; (I) Megestrol.
Tumor Immune Infiltration and Microenvironment Analysis
By using CIBERSORT to assess the degree of infiltration of 22 immune cells in LGG tumor tissues, we finally obtained distribution histogram and abundance heatmap of immune cell infiltration of 116 LGG patients (Figures S5A–B), of which 52 patients were the low-risk score phenotype and 64 patients were high-risk score phenotype. By comparing the distribution of 22 immune cells between high- and low-risk score phenotypes of LGG patients, we found that eight immune cells, including T cell CD8, T cells follicular helper, T cells regulatory (Tregs), NK cells activated, Monocytes, Macrophages M1, Macrophages M2 and Eosinophils, showed significant differences between high- and low-risk score phenotypes (Figure 11). Among the eight types of immune cells, four types of immune cells [T cell CD8, T cells regulatory (Tregs), Macrophages M1and Macrophages M2] in the high-risk phenotype have a higher fraction than in the low-risk phenotype, whereas, four types of immune cells (T cells follicular helper, NK cells activated, Monocytes and Eosinophils) in the low-risk phenotype have a higher fraction than these in the high-risk phenotype (Figure 11). Subsequently, we also scored the immune cells and stromal cells in tumor tissues of 488 LGG patients. We found that all the stromal, immune, and ESTIMATE score for the tumor microenvironment of LGG patients were higher in the high-risk score phenotype (Figures 12A–C).
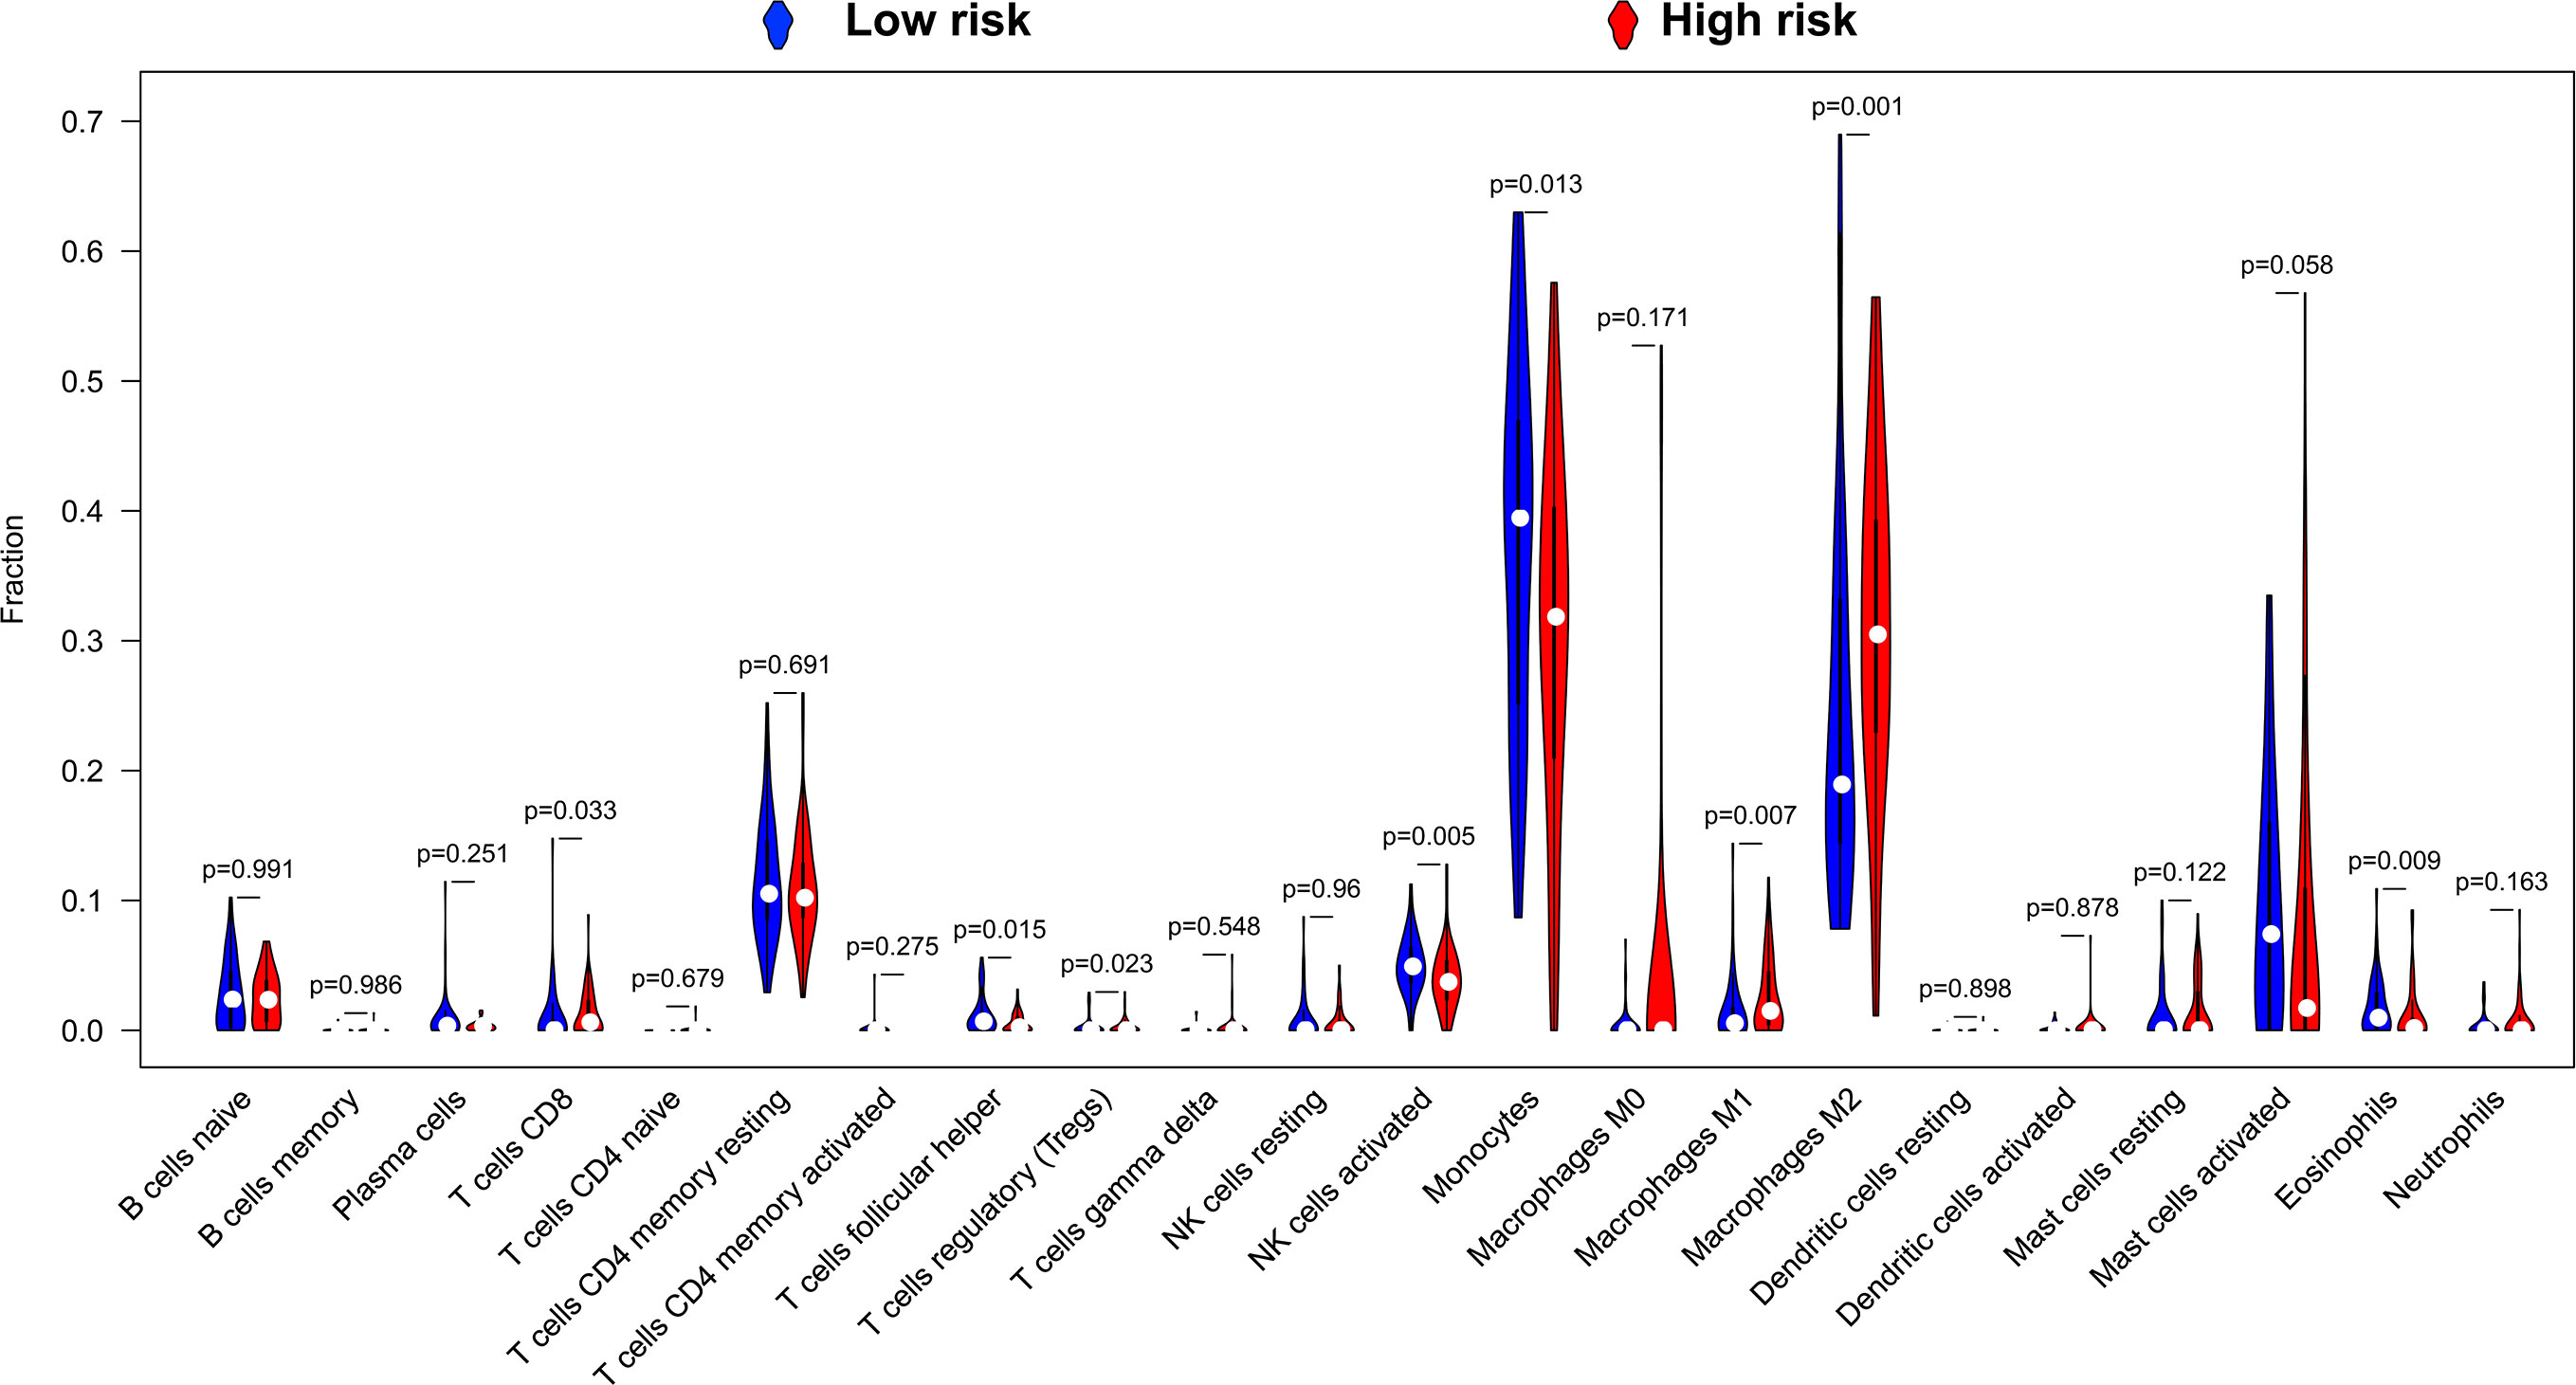
Figure 11 Violin plot of 22 immune cells infiltration between high- and low-risk score phenotypes.
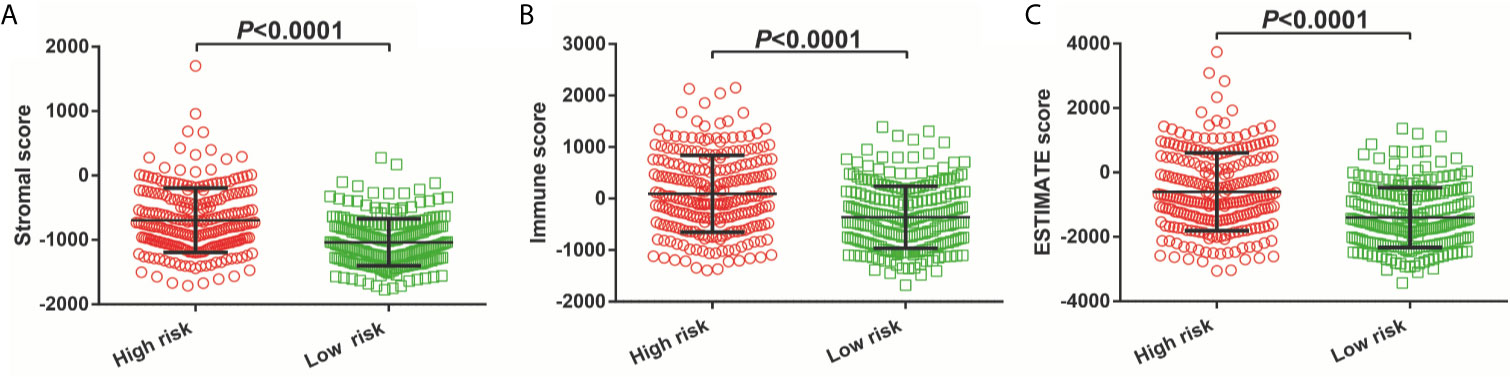
Figure 12 Immune microenvironment score between high- and low-risk score phenotypes. (A) Stromal score; (B) Immune score; (C) ESTIMATE score.
Discussion
There has been a small amount of literature that used the TCGA genome-wide data set to screen snoRNA prognostic biomarkers. Liu et al. used TCGA genome-wide RNA-seq dataset to investigate sarcoma prognostic-related snoRNAs, and identified 15 sarcoma prognostic-related snoRNAs, as well as constructed a sarcoma prognostic signature base on four snoRNAs (24). Cao et al. carried out screening for prognostic snoRNAs by using the least absolute and selection operator (LASSO) Cox regression method, and developed a bladder cancer prognostic signature composed of five snoRNAs (25). Both of the above studies confirmed that U3 can be used as a prognostic marker for corresponding tumors (24, 25). Similarly, Zhao et al. also constructed a renal clear cell carcinoma with six prognosis-related snoRNA signatures, and conducted functional enrichment analysis on these snoRNAs (26). Similar to previous studies, our current study also used TCGA RNA-seq dataset to investigate prognostic snoRNAs, and also found that U3 can be used as a prognostic biomarker for LGG. Therefore, we inferred that U3 could be used as prognostic biomarker in multiple cancers.
Lafaille et al. found that the genetic variation of SNORA31 was closely related to encephalitis in the forebrain. After alleles at corresponding sites of SNORA31 were knocked out, in vitro experiments proved that SNORA31 could change the sensitivity of neurons to herpes simplex virus-1 (27). The expression of SNORA31 was markedly down-regulated in CD19+ b-cells of chronic myeloid leukemia (CLL) patients compared with normal B-cells (28). Studies have shown that relapsing–remitting multiple sclerosis (RRMS) patients ncRNA–mRNA network is seriously affected by the disease, resulting in a large number of ncRNAs and mRNAs imbalance. By means of RNA sequencing, Irizar et al. found that SNORA40 was disorder in RRMS and might be a potential therapeutic target (29). We found that the rest of snoRNAs had not been reported before. We found for the first time that that these snoRNAs are related to LGG prognosis through whole-genome RNA sequencing data. Through the snoRNAs co-expression genes, GSEA and differentially expressed genes, we have a further understanding the function of this eleven-snoRNA prognostic signature. A large number of pathways and biological function gene sets enriched by this eleven-snoRNA prognostic signature have been reported as classic or novel cancer-related signaling pathways in previous studies, such as JAK/STAT, p38//MAPK, and Wnt signaling pathways.
Xiong et al. screened the differentially expressed genes between ovarian serous cystadencinoma (OSC) and ovarian specimens, and used CMap method to determine that three drugs, namely MG-132, puromycin and 15-delta prostaglandin J2, could be potential target drugs for OSC (30). Shi et al. also identified 15-delta Prostaglandin J2 as a potential therapeutic agent by comparing gene expression profiles in patients with diabetic nephropathy using bioinformatics analysis (31). Wei et al. through genome-wide data and CMAP analysis identified MC-262 as a potential targeted therapy for head and neck squamous cell carcinoma (HNSCC), and its potential target in HNSCC is proliferating cell nuclear antigen (32). Vorinostat in the treatment of glioma has been widely reported in previous studies. Clinical trials have shown that vorinostat combined with Bevacizumab or Temozolomide can be used in the treatment of glioma (33–35), as well recurrent malignant gliomas (36–39). Local Delivery of vorinostat can alter the tumor microenvironment, thereby inhibiting glioma recurrence (40). Vorinostat can also mediate the regulation of cell cycle regulatory proteins in glioma (41). Bortezomib can enhance the apoptosis of glioma cells induced by vorinostat (42). Puromycin exerts antitumor function in multiple cancers and can induce cancer cell apoptosis. The aminopeptidase inhibitors based on puromycin show high anti-tumor effect in vitro in hematologic malignancies and are expected to be potential therapeutic drugs for hematologic diseases (43). Puromycin can induce apoptosis of breast cancer cells MCF-7. Its apoptosis mechanism is not exerted by insulin-like growth factor-1 (IGF-1), but is affected by the level of IGF-1 receptor (44). Study have shown that puromycin can induce apoptosis of glioma cells, but its apoptotic mechanism is not exerted through the Fas/Fas ligand pathway and Bcl-2 has only a small protective effect on puromycin-induced apoptosis of glioma cells (45). Previous studies have shown that anisomycin has anticancer effects in a variety of cancers, but its molecular mechanisms are different in different cancers. Anisomycin can inhibit angiogenesis in ovarian cancer (OV) through take part in the ceRNA regulatory network (lncRNA−Meg3/miR−421/platelet derived growth factor receptor α axis), thereby inhibiting tumor cell growth (46). LncRNA β-site APP cleaving enzyme 1 antisense strand (BACE1-AS) is also a potential target of anisomycin in OV (47). Anisomycin plays an anti-tumor role in primary hepatocellular carcinoma by mediating natural killer cells, and its main molecular mechanism has been found by genome sequencing to be mediated by immunomodulatory genes (48). Anisomycin can be involved in inhibiting the proliferation of colorectal cancer cells by mediating GATA binding protein 6 (49). Anisomycin can improve the efficacy of BCR-ABL tyrosine kinase inhibitors in CLL by mediating Wnt/β-catenin signaling pathway (50). Anisomycin can also mediate phosphorylated mitogen-activated protein kinases (MAPKs) p38 and Jun N-terminal kinase (JNK) to increase the apoptosis of glucocorticoids-resistant acute lymphoblastic leukemia cell lines (51). Anisomycin can also increase the sensitivity of melanoma anti-tumor drugs (52). Anisomycin exerting an anti-tumor effect in osteosarcoma through induces cell cycle arrest and apoptosis by mediating mitochondrial biogenesis (53). Anisomycin in renal cell carcinoma cells can mediate Bcl-2/c-FLIP(L)/Mcl-1/death receptor 4 (DR4) to promote cell apoptosis and exert anti-tumor effects (54, 55). Anisomycin induces apoptosis of glioma cell lines (U251 and U87 cell lines) by down-regulating PP2A catalytic subunit in in vitro cell experiments (56). Studies found that withaferin A has great potential in anti-tumor therapy (57, 58), as well as in brain tumor (59, 60). The combination of Withaferin A and tumor treating fields can improve its anti-tumor effect (61). The potential molecular mechanism of Withaferin A in glioma may be exerted by NF-KB nuclear translocation, activation of caspase cascade and activating transcription factor 4(ATF4)-ATF3-CHOP axis (62, 63). Grogan et al. found that withaferin A can exert anti-tumor effects in glioblastoma multiforme through the Akt/mTOR signaling pathway, block the cell cycle of glioblastoma multiforme cells, induce apoptosis, and inhibit cell proliferation and invasion (64, 65). Ciclopirox is also a widely reported anti-tumor drug (66–69). However, after reviewing the literature, we have not found an anti-tumor study of ciclopirox in glioma. Megestrol exert anti-tumor effects in multiple cancers, but has not been reported in the treatment of glioma (70–72). Among the ten drugs we screened, 5155877 and chloropyrazine have not been reported in anti-tumor studies.
This study still has some limitations that need to be clarified. First, this study is a single-center study and lacks a validation cohort. Therefore, our results need further validation in a multi-center, large sample cohort. Second, the molecular mechanism analysis and drug prediction of snoRNA in this study are based on bioinformatics analysis methods, so our results require further verification by in vivo and in vitro experiments. Despite the above limitations, our research is still the first study to screen LGG prognosis snoRNAs based on whole-genome RNA-seq dataset. Our research is also the first to conduct a comprehensive analysis of LGG prognosis snoRNAs, including molecular mechanism, targeted drug prediction, tumor immune infiltration and tumor microenvironment. The above results can provide a basis for future study on clinical application and molecular mechanisms of snoRNAs in LGG.
Conclusion
In conclusion, our current study have identified 21 prognostic snoRNAs and constructed a novel eleven-snoRNA prognostic signature for LGG patients. GSEA and functional enrichment analysis suggest that this signature may be involved in the following biological processes and signaling pathways: such as cell cycle, Wnt, mitogen-activated protein kinase, janus kinase/signal transducer and activator of tran-ions, T cell receptor, nuclear factor-kappa B signaling pathway. CMap analysis screened out ten targeted therapy drugs for this signature: 15-delta prostaglandin J2, MG-262, vorinostat, 5155877, puromycin, anisomycin, withaferin A, ciclopirox, chloropyrazine and megestrol. We also found that high- and low-risk score phenotypes of LGG patients have significant differences in immune infiltration and cancer immune microenvironment. The novel findings of our study are the first comprehensive genome-wide investigation of the prognostic related snoRNAs in LGG and the preliminary identification of a novel prognostic snoRNAs signature. We used the bioinformatics analysis to identify the prognostic value and biological mechanisms of this signature. Since this study is based on a single-center study, our results still need to be further verified.
Data Availability Statement
The original contributions presented in the study are included in the article/Supplementary Material. Further inquiries can be directed to the corresponding author.
Author Contributions
TD: Study design and preparation of manuscript (equal contributors). YG: Study planning and literature search (equal contributors). XL: Data collection and analysis. XW: Literature analysis. XZ: Literature analysis. GZ: Data interpretation. LM: Study planning. All authors contributed to the article and approved the submitted version.
Conflict of Interest
The authors declare that the research was conducted in the absence of any commercial or financial relationships that could be construed as a potential conflict of interest.
Supplementary Material
The Supplementary Material for this article can be found online at: https://www.frontiersin.org/articles/10.3389/fonc.2021.650828/full#supplementary-material
References
1. Weller M, Wick W, Aldape K, Brada M, Berger M, Pfister SM, et al. Glioma. Nat Rev Dis Primers (2015) 1:15017. doi: 10.1038/nrdp.2015.17
2. Gutmann DH, Ferner RE, Listernick RH, Korf BR, Wolters PL, Johnson KJ. Neurofibromatosis Type 1. Nat Rev Dis Primers (2017) 3:17004. doi: 10.1038/nrdp.2017.4
3. Cancer Genome Atlas Research N, Weinstein JN, Collisson EA, Mills GB, Shaw KR, Ozenberger BA, et al. The Cancer Genome Atlas Pan-Cancer Analysis Project. Nat Genet (2013) 45:1113–20. doi: 10.1038/ng.2764
4. Cancer Genome Atlas Research N, Brat DJ, Verhaak RG, Aldape KD, Yung WK, Salama SR, et al. Comprehensive, Integrative Genomic Analysis of Diffuse Lower-Grade Gliomas. New Engl J Med (2015) 372:2481–98. doi: 10.1056/NEJMoa1402121
5. Kiss T. Small Nucleolar RNAs: An Abundant Group of Noncoding RNAs With Diverse Cellular Functions. Cell (2002) 109:145–8. doi: 10.1016/S0092-8674(02)00718-3
6. Xia XR, Li WC, Yu ZT, Li J, Peng CY, Jin L, et al. Effects of Small Nucleolar RNA SNORD44 on the Proliferation, Apoptosis and Invasion of Glioma Cells. Histochem Cell Biol (2020) 153:257–69. doi: 10.1007/s00418-020-01848-y
7. Chen L, Han L, Wei J, Zhang K, Shi Z, Duan R, et al. SNORD76, a Box C/D snoRNA, Acts as a Tumor Suppressor in Glioblastoma. Sci Rep (2015) 5:8588. doi: 10.1038/srep08588
8. Xu B, Ye MH, Lv SG, Wang QX, Wu MJ, Xiao B, et al. SNORD47, a Box C/D snoRNA, Suppresses Tumorigenesis in Glioblastoma. Oncotarget (2017) 8:43953–66. doi: 10.18632/oncotarget.16693
9. Goldman MJ, Craft B, Hastie M, Repecka K, McDade F, Kamath A, et al. Visualizing and Interpreting Cancer Genomics Data Via the Xena Platform. Nat Biotechnol (2020) 38:675–8. doi: 10.1038/s41587-020-0546-8
10. Robinson MD, McCarthy DJ, Smyth GK. edgeR: A Bioconductor Package for Differential Expression Analysis of Digital Gene Expression Data. Bioinformatics (2010) 26:139–40. doi: 10.1093/bioinformatics/btp616
11. Liao X, Zhu G, Huang R, Yang C, Wang X, Huang K, et al. Identification of Potential Prognostic microRNA Biomarkers for Predicting Survival in Patients With Hepatocellular Carcinoma. Cancer Manage Res (2018) 10:787–803. doi: 10.2147/CMAR.S161334
12. Liao X, Huang K, Huang R, Liu X, Han C, Yu L, et al. Genome-Scale Analysis to Identify Prognostic Markers in Patients With Early-Stage Pancreatic Ductal Adenocarcinoma After Pancreaticoduodenectomy. OncoTargets Ther (2017) 10:4493–506. doi: 10.2147/OTT.S142557
13. Liao X, Wang X, Huang K, Han C, Deng J, Yu T, et al. Integrated Analysis of Competing Endogenous RNA Network Revealing Potential Prognostic Biomarkers of Hepatocellular Carcinoma. J Cancer (2019) 10:3267–83. doi: 10.7150/jca.29986
14. Huang da W, Sherman BT, Lempicki RA. Systematic and Integrative Analysis of Large Gene Lists Using DAVID Bioinformatics Resources. Nat Protoc (2009) 4:44–57. doi: 10.1038/nprot.2008.211
15. Subramanian A, Tamayo P, Mootha VK, Mukherjee S, Ebert BL, Gillette MA, et al. Gene Set Enrichment Analysis: A Knowledge-Based Approach for Interpreting Genome-Wide Expression Profiles. Proc Natl Acad Sci U S A (2005) 102:15545–50. doi: 10.1073/pnas.0506580102
16. Lamb J, Crawford ED, Peck D, Modell JW, Blat IC, Wrobel MJ, et al. The Connectivity Map: Using Gene-Expression Signatures to Connect Small Molecules, Genes, and Disease. Science (2006) 313:1929–35. doi: 10.1126/science.1132939
17. Lamb J. The Connectivity Map: A New Tool for Biomedical Research. Nat Rev Cancer (2007) 7:54–60. doi: 10.1038/nrc2044
18. Kim S, Chen J, Cheng T, Gindulyte A, He J, He S, et al. PubChem 2019 Update: Improved Access to Chemical Data. Nucleic Acids Res (2019) 47:D1102–D9. doi: 10.1093/nar/gky1033
19. Szklarczyk D, Santos A, von Mering C, Jensen LJ, Bork P, Kuhn M. STITCH 5: Augmenting Protein-Chemical Interaction Networks With Tissue and Affinity Data. Nucleic Acids Res (2016) 44:D380–4. doi: 10.1093/nar/gkv1277
20. Newman AM, Liu CL, Green MR, Gentles AJ, Feng W, Xu Y, et al. Robust Enumeration of Cell Subsets From Tissue Expression Profiles. Nat Methods (2015) 12:453–7. doi: 10.1038/nmeth.3337
21. Chen B, Khodadoust MS, Liu CL, Newman AM, Alizadeh AA. Profiling Tumor Infiltrating Immune Cells With CIBERSORT. Methods Mol Biol (2018) 1711:243–59. doi: 10.1007/978-1-4939-7493-1_12
22. Yoshihara K, Shahmoradgoli M, Martinez E, Vegesna R, Kim H, Torres-Garcia W, et al. Inferring Tumour Purity and Stromal and Immune Cell Admixture From Expression Data. Nat Commun (2013) 4:2612. doi: 10.1038/ncomms3612
23. Benjamini Y, Drai D, Elmer G, Kafkafi N, Golani I. Controlling the False Discovery Rate in Behavior Genetics Research. Behav Brain Res (2001) 125:279–84. doi: 10.1016/S0166-4328(01)00297-2
24. Liu J, Liao X, Zhu X, Lv P, Li R. Identification of Potential Prognostic Small Nucleolar RNA Biomarkers for Predicting Overall Survival in Patients With Sarcoma. Cancer Med (2020) 9:7018–33. doi: 10.1002/cam4.3361
25. Cao R, Ma B, Yuan L, Wang G, Tian Y. Small Nucleolar RNAs Signature (SNORS) Identified Clinical Outcome and Prognosis of Bladder Cancer (BLCA). Cancer Cell Int (2020) 20:299. doi: 10.1186/s12935-020-01393-7
26. Zhao Y, Yan Y, Ma R, Lv X, Zhang L, Wang J, et al. Expression Signature of six-snoRNA Serves as Novel non-Invasive Biomarker for Diagnosis and Prognosis Prediction of Renal Clear Cell Carcinoma. J Cell Mol Med (2020) 24:2215–28. doi: 10.1111/jcmm.14886
27. Lafaille FG, Harschnitz O, Lee YS, Zhang P, Hasek ML, Kerner G, et al. Human SNORA31 Variations Impair Cortical Neuron-Intrinsic Immunity to HSV-1 and Underlie Herpes Simplex Encephalitis. Nat Med (2019) 25:1873–84. doi: 10.1038/s41591-019-0672-3
28. Ronchetti D, Mosca L, Cutrona G, Tuana G, Gentile M, Fabris S, et al. Small Nucleolar RNAs as New Biomarkers in Chronic Lymphocytic Leukemia. BMC Med Genomics (2013) 6:27. doi: 10.1186/1755-8794-6-27
29. Irizar H, Munoz-Culla M, Saenz-Cuesta M, Osorio-Querejeta I, Sepulveda L, Castillo-Trivino T, et al. Identification of ncRNAs as Potential Therapeutic Targets in Multiple Sclerosis Through Differential ncRNA - mRNA Network Analysis. BMC Genomics (2015) 16:250. doi: 10.1186/s12864-015-1396-5
30. Xiong DD, Qin Y, Xu WQ, He RQ, Wu HY, Wei DM, et al. A Network Pharmacology-Based Analysis of Multi-Target, Multi-Pathway, Multi-Compound Treatment for Ovarian Serous Cystadenocarcinoma. Clin Drug Investig (2018) 38:909–25. doi: 10.1007/s40261-018-0683-8
31. Shi J, Jiang S, Qiu D, Le W, Wang X, Lu Y, et al. Rapid Identification of Potential Drugs for Diabetic Nephropathy Using Whole-Genome Expression Profiles of Glomeruli. BioMed Res Int (2016) 2016:1634730. doi: 10.1155/2016/1634730
32. Wei GG, Gao L, Tang ZY, Lin P, Liang LB, Zeng JJ, et al. Drug Repositioning in Head and Neck Squamous Cell Carcinoma: An Integrated Pathway Analysis Based on Connectivity Map and Differential Gene Expression. Pathol Res Pract (2019) 215:152378. doi: 10.1016/j.prp.2019.03.007
33. Galanis E, Anderson SK, Miller CR, Sarkaria JN, Jaeckle K, Buckner JC, et al. Phase I/II Trial of Vorinostat Combined With Temozolomide and Radiation Therapy for Newly Diagnosed Glioblastoma: Results of Alliance N0874/Abtc 02. Neuro Oncol (2018) 20:546–56. doi: 10.1093/neuonc/nox161
34. Ghiaseddin A, Reardon D, Massey W, Mannerino A, Lipp ES, Herndon JE 2nd, et al. Phase II Study of Bevacizumab and Vorinostat for Patients With Recurrent World Health Organization Grade 4 Malignant Glioma. oncol (2018) 23:157–e21. doi: 10.1634/theoncologist.2017-0501
35. Lee EQ, Puduvalli VK, Reid JM, Kuhn JG, Lamborn KR, Cloughesy TF, et al. Phase I Study of Vorinostat in Combination With Temozolomide in Patients With High-Grade Gliomas: North American Brain Tumor Consortium Study 04-03. Clin Cancer Res (2012) 18:6032–9. doi: 10.1158/1078-0432.CCR-12-1841
36. Friday BB, Anderson SK, Buckner J, Yu C, Giannini C, Geoffroy F, et al. Phase II Trial of Vorinostat in Combination With Bortezomib in Recurrent Glioblastoma: A North Central Cancer Treatment Group Study. Neuro Oncol (2012) 14:215–21. doi: 10.1093/neuonc/nor198
37. Galanis E, Jaeckle KA, Maurer MJ, Reid JM, Ames MM, Hardwick JS, et al. Phase II Trial of Vorinostat in Recurrent Glioblastoma Multiforme: A North Central Cancer Treatment Group Study. J Clin Oncol (2009) 27:2052–8. doi: 10.1200/JCO.2008.19.0694
38. Chinnaiyan P, Chowdhary S, Potthast L, Prabhu A, Tsai YY, Sarcar B, et al. Phase I Trial of Vorinostat Combined With Bevacizumab and CPT-11 in Recurrent Glioblastoma. Neuro Oncol (2012) 14:93–100. doi: 10.1093/neuonc/nor187
39. Peters KB, Lipp ES, Miller E, Herndon JE 2nd, McSherry F, Desjardins A, et al. Phase I/II Trial of Vorinostat, Bevacizumab, and Daily Temozolomide for Recurrent Malignant Gliomas. J Neuro-oncol (2018) 137:349–56. doi: 10.1007/s11060-017-2724-1
40. Zhao G, Jia J, Wang L, Zhang Y, Yang H, Lu Y, et al. Local Delivery of Minocycline and Vorinostat Targets the Tumor Microenvironment to Inhibit the Recurrence of Glioma. OncoTargets Ther (2020) 13:11397–409. doi: 10.2147/OTT.S273527
41. Xu J, Sampath D, Lang FF, Prabhu S, Rao G, Fuller GN, et al. Vorinostat Modulates Cell Cycle Regulatory Proteins in Glioma Cells and Human Glioma Slice Cultures. J Neuro-Oncol (2011) 105:241–51. doi: 10.1007/s11060-011-0604-7
42. Premkumar DR, Jane EP, Agostino NR, DiDomenico JD, Pollack IF. Bortezomib-Induced Sensitization of Malignant Human Glioma Cells to Vorinostat-Induced Apoptosis Depends on Reactive Oxygen Species Production, Mitochondrial Dysfunction, Noxa Upregulation, Mcl-1 Cleavage, and DNA Damage. Mol Carcinogene (2013) 52:118–33. doi: 10.1002/mc.21835
43. Singh R, Williams J, Vince R. Puromycin Based Inhibitors of Aminopeptidases for the Potential Treatment of Hematologic Malignancies. Eur J Med Chem (2017) 139:325–36. doi: 10.1016/j.ejmech.2017.07.048
44. Soderlund G, Haarhaus M, Chisalita S, Arnqvist HJ. Inhibition of Puromycin-Induced Apoptosis in Breast Cancer Cells by IGF-I Occurs Simultaneously With Increased Protein Synthesis. Neoplasma (2004) 51:1–11.
45. Schlapbach R, Fontana A. Differential Activity of Bcl-2 and ICE Enzyme Family Protease Inhibitors on Fas and Puromycin-Induced Apoptosis of Glioma Cells. Biochim Biophys Acta (1997) 1359:174–80. doi: 10.1016/S0167-4889(97)00096-7
46. Ye W, Ni Z, Yicheng S, Pan H, Huang Y, Xiong Y, et al. Anisomycin Inhibits Angiogenesis in Ovarian Cancer by Attenuating the Molecular Sponge Effect of the lncRNAMeg3/miR421/PDGFRA Axis. Int J Oncol (2019) 55:1296–312. doi: 10.3892/ijo.2019.4887
47. Chen Q, Liu X, Xu L, Wang Y, Wang S, Li Q, et al. Long non-Coding RNA Bace1-AS is a Novel Target for Anisomycin-Mediated Suppression of Ovarian Cancer Stem Cell Proliferation and Invasion. Oncol Rep (2016) 35:1916–24. doi: 10.3892/or.2016.4571
48. Kim M, Lee SJ, Shin S, Park KS, Park SY, Lee CH. Novel Natural Killer Cell-Mediated Cancer Immunotherapeutic Activity of Anisomycin Against Hepatocellular Carcinoma Cells. Sci Rep (2018) 8:10668. doi: 10.1038/s41598-018-29048-8
49. Ushijima H, Horyozaki A, Maeda M. Anisomycin-Induced GATA-6 Degradation Accompanying a Decrease of Proliferation of Colorectal Cancer Cell. Biochem Biophys Res Commun (2016) 478:481–5. doi: 10.1016/j.bbrc.2016.05.139
50. Li Y, Hu J, Song H, Wu T. Antibiotic Anisomycin Selectively Targets Leukemia Cell Lines and Patient Samples Through Suppressing Wnt/beta-catenin Signaling. Biochem Biophys Res Commun (2018) 505:858–64. doi: 10.1016/j.bbrc.2018.09.183
51. Liu Y, Ge J, Li Q, Gu L, Guo X, Ma ZG, et al. Anisomycin Induces Apoptosis of Glucocorticoid Resistant Acute Lymphoblastic Leukemia CEM-C1 Cells Via Activation of Mitogen-Activated Protein Kinases p38 and JNK. Neoplasma (2013) 60:101–10. doi: 10.4149/neo_2013_014
52. Slipicevic A, Oy GF, Rosnes AK, Stakkestad O, Emilsen E, Engesaeter B, et al. Low-Dose Anisomycin Sensitizes Melanoma Cells to TRAIL Induced Apoptosis. Cancer Biol Ther (2013) 14:146–54. doi: 10.4161/cbt.22953
53. Cao C, Yu H, Wu F, Qi H, He J. Antibiotic Anisomycin Induces Cell Cycle Arrest and Apoptosis Through Inhibiting Mitochondrial Biogenesis in Osteosarcoma. J Bioenerg Biomembranes (2017) 49:437–43. doi: 10.1007/s10863-017-9734-8
54. Seo BR, Min KJ, Kim S, Park JW, Park WK, Lee TJ, et al. Anisomycin Treatment Enhances TRAIL-mediated Apoptosis in Renal Carcinoma Cells Through the Down-Regulation of Bcl-2, c-FLIP(L) and Mcl-1. Biochimie (2013) 95:858–65. doi: 10.1016/j.biochi.2012.12.002
55. Li Y, Wu X, Jin X, Wang J, Togo Y, Suzuki T, et al. Enhancement of Death Receptor 4-Mediated Apoptosis and Cytotoxicity in Renal Cell Carcinoma Cells by Anisomycin. Anti-Cancer Drugs (2017) 28:180–6. doi: 10.1097/CAD.0000000000000450
56. Li JY, Huang JY, Li M, Zhang H, Xing B, Chen G, et al. Anisomycin Induces Glioma Cell Death Via Down-Regulation of PP2A Catalytic Subunit In Vitro. Acta Pharmacol Sin (2012) 33:935–40. doi: 10.1038/aps.2012.46
57. Dutta R, Khalil R, Green R, Mohapatra SS, Mohapatra S. Withania Somnifera (Ashwagandha) and Withaferin a: Potential in Integrative Oncology. Int J Mol Sci (2019) 20:5310. doi: 10.3390/ijms20215310
58. Hassannia B, Logie E, Vandenabeele P, Vanden Berghe T, Vanden Berghe W. Withaferin A: From Ayurvedic Folk Medicine to Preclinical Anti-Cancer Drug. Biochem Pharmacol (2020) 173:113602. doi: 10.1016/j.bcp.2019.08.004
59. Dhami J, Chang E, Gambhir SS. Withaferin A and its Potential Role in Glioblastoma (GBM). J Neuro-Oncol (2017) 131:201–11. doi: 10.1007/s11060-016-2303-x
60. Marlow MM, Shah SS, Veliz EA, Ivan ME, Graham RM. Treatment of Adult and Pediatric High-Grade Gliomas With Withaferin a: Antitumor Mechanisms and Future Perspectives. J Nat Med (2017) 71:16–26. doi: 10.1007/s11418-016-1020-2
61. Chang E, Pohling C, Beygui N, Patel CB, Rosenberg J, Ha DH, et al. Synergistic Inhibition of Glioma Cell Proliferation by Withaferin A and Tumor Treating Fields. J Neuro-Oncol (2017) 134:259–68. doi: 10.1007/s11060-017-2534-5
62. Tang Q, Ren L, Liu J, Li W, Zheng X, Wang J, et al. Withaferin A Triggers G2/M Arrest and Intrinsic Apoptosis in Glioblastoma Cells Via ATF4-ATF3-CHOP Axis. Cell Proliferation (2020) 53:e12706. doi: 10.1111/cpr.12706
63. Hou WC, Miao XH, Ma LJ, Bai XX, Liu Q, Song L. Withaferin a Induces Apoptosis in Rat C6 Glioma Cells Through Regulating Nf-Kb Nuclear Translocation and Activation of Caspase Cascade. Afr J Tradit Complement Altern Med (2017) 14:319–24. doi: 10.21010/ajtcam.v14i2.33
64. Grogan PT, Sarkaria JN, Timmermann BN, Cohen MS. Oxidative Cytotoxic Agent Withaferin A Resensitizes Temozolomide-Resistant Glioblastomas Via MGMT Depletion and Induces Apoptosis Through Akt/mTOR Pathway Inhibitory Modulation. Investigational New Drugs (2014) 32:604–17. doi: 10.1007/s10637-014-0084-7
65. Grogan PT, Sleder KD, Samadi AK, Zhang H, Timmermann BN, Cohen MS. Cytotoxicity of Withaferin A in Glioblastomas Involves Induction of an Oxidative Stress-Mediated Heat Shock Response While Altering Akt/mTOR and MAPK Signaling Pathways. Investigational New Drugs (2013) 31:545–57. doi: 10.1007/s10637-012-9888-5
66. Shen T, Shang C, Zhou H, Luo Y, Barzegar M, Odaka Y, et al. Ciclopirox Inhibits Cancer Cell Proliferation by Suppression of Cdc25A. Genes Cancer (2017) 8:505–16. doi: 10.18632/genesandcancer.135
67. Al-Dali AM, Weiher H, Schmidt-Wolf IGH. Utilizing Ethacrynic Acid and Ciclopirox Olamine in Liver Cancer. Oncol Lett (2018) 16:6854–60. doi: 10.3892/ol.2018.9472
68. Huang YM, Cheng CH, Pan SL, Yang PM, Lin DY, Lee KH. Gene Expression Signature-Based Approach Identifies Antifungal Drug Ciclopirox as a Novel Inhibitor of HMGA2 in Colorectal Cancer. Biomolecules (2019) 9:688. doi: 10.3390/biom9110688
69. Zhou J, Zhang L, Wang M, Zhou L, Feng X, Yu L, et al. Cpx Targeting Dj-1 Triggers ROS-Induced Cell Death and Protective Autophagy in Colorectal Cancer. Theranostics (2019) 9:5577–94. doi: 10.7150/thno.34663
70. Sedlacek SM. An Overview of Megestrol Acetate for the Treatment of Advanced Breast Cancer. Semin Oncol (1988) 15:3–13.
71. Wen W, Lowe G, Roberts CM, Finlay J, Han ES, Glackin CA, et al. Pterostilbene, a Natural Phenolic Compound, Synergizes the Antineoplastic Effects of Megestrol Acetate in Endometrial Cancer. Sci Rep (2017) 7:12754. doi: 10.1038/s41598-017-12922-2
Keywords: small nucleolar RNA, lower grade glioma, The Cancer Genome Atlas, molecular mechanism, immune infiltration
Citation: Deng T, Gong Y, Liao X, Wang X, Zhou X, Zhu G and Mo L (2021) Integrative Analysis of a Novel Eleven-Small Nucleolar RNA Prognostic Signature in Patients With Lower Grade Glioma. Front. Oncol. 11:650828. doi: 10.3389/fonc.2021.650828
Received: 08 January 2021; Accepted: 12 May 2021;
Published: 07 June 2021.
Edited by:
Matthias Preusser, Medical University of Vienna, AustriaReviewed by:
Ji Zhang, Sun Yat-Sen University, ChinaStephen Bagley, University of Pennsylvania, United States
Copyright © 2021 Deng, Gong, Liao, Wang, Zhou, Zhu and Mo. This is an open-access article distributed under the terms of the Creative Commons Attribution License (CC BY). The use, distribution or reproduction in other forums is permitted, provided the original author(s) and the copyright owner(s) are credited and that the original publication in this journal is cited, in accordance with accepted academic practice. No use, distribution or reproduction is permitted which does not comply with these terms.
*Correspondence: Ligen Mo, bGlnZW5tb0AxNjMuY29t
†These authors have contributed equally to this work and share first authorship