
94% of researchers rate our articles as excellent or good
Learn more about the work of our research integrity team to safeguard the quality of each article we publish.
Find out more
ORIGINAL RESEARCH article
Front. Oncol., 18 May 2021
Sec. Genitourinary Oncology
Volume 11 - 2021 | https://doi.org/10.3389/fonc.2021.649761
This article is part of the Research TopicEmerging Molecular Signaling Pathways and Therapeutic Targets for Genitourinary Cancer MetastasisView all 18 articles
 Sen Li1,2,3Yongbiao Cheng1,2Gong Cheng1,2Tianbo Xu1,2Yuzhong Ye1,2Qi Miu1,2Qi Cao1,2Xiong Yang1,2
 Hailong Ruan1,2*Xiaoping Zhang1,2*
Renal cell carcinoma (RCC) is the most frequent malignant tumor of the kidney. 30% of patients with RCC are diagnosed at an advanced stage. Clear cell renal cell carcinoma (ccRCC) is the most common pathological subtype of RCC. Currently, advanced ccRCC lacks reliable diagnostic and prognostic markers. We explored the potential of SAA1 as a diagnostic and prognostic marker for advanced ccRCC. In this study, we mined and analyzed the public cancer databases (TCGA, UALCAN and GEPIA) to conclude that SAA1 was up-regulated at mRNA and protein levels in advanced ccRCC. We further found that hypomethylation of SAA1 promoter region was responsible for its high expression in ccRCC. Receiver operating characteristic curve (ROC) indicated that high SAA1 levels could distinguish advanced ccRCC patients from normal subjects (p < 0.0001). Kaplan-Meier curve analysis showed that high SAA1 levels predicted poor overall survival time (p < 0.0001) and poor disease-free survival time (p = 0.0003). Finally, the functional roles of SAA1 were examined using a si-SAA1 knockdown method in RCC cell lines. Our results suggest that SAA1 may possess the potential to serve as a diagnostic and prognostic biomarker for advanced ccRCC patients. Moreover, targeting SAA1 may represent as a novel therapeutic target for advanced ccRCC patients.
In the United States, renal cancer represents respectively the 6th and 8th most common malignancy in men and in women, accounting for about 3% of cancer deaths (1). Cancer statistics show that approximately 73,820 new cases of renal cancer and expected 14,770 deaths happened in the United States in 2019 (1). Clear cell renal cell carcinoma (ccRCC) is clinically divided into localized ccRCC (L-ccRCC), locally advanced ccRCC (LA-ccRCC), and metastatic ccRCC (M-ccRCC). L-ccRCC and LA-ccRCC can achieve clinical curative effect through nephron-sparing surgery or nephrectomy. M-ccRCC requires comprehensive medical treatment, including cytoreductive nephrectomy, molecular targeted therapy and immunotherapy (2–6). Although surgical treatment, targeted therapy and immunotherapy have acquired great progress in recent years, there are still many patients with advanced ccRCC or M-ccRCC die from this disease due to treatment tolerance (7, 8). Therefore, the progress and metastatic mechanisms of locally advanced ccRCC and M-ccRCC are the primary tasks of current research.
SAA1 protein belongs to a member of the serum amyloid A family of apolipoproteins. SAA1 is a major acute-phase protein whose expression is upregulated when the body is stressed by inflammation and tissue damage (9). In addition, SAA1 expression also can be induced following surgery or in advanced malignancies (10). SAA1 also plays a critical role in high-density lipoprotein metabolism and cholesterol homeostasis (11, 12). Extensive literatures have reported that SAA1 could contribute to cancer development and accelerate tumor progression and distant metastasis (10). For example, SAA1 enhances plasminogen activation to promote colon cancer progression (13). SAA1 may interact with the extracellular matrix to change its affinity to cells, leading to cell metastasis (14). In addition, a large number of studies have confirmed the positive correlation between SAA1 concentrations and tumor stage (15, 16). In a sample of 233 different tumor patients, higher SAA1 levels appeared in more advanced tumor patients (17). Moreover, the up-regulation of SAA1 could be used as a biomarker for a variety of malignant tumors (18–20). Most importantly, serum SAA1 was identified as a biomarker of distant metastases but not as an early tumor marker in RCC patients (21). However, the diagnostic and prognostic potential of SAA1 at the tumor tissue level and its biological function in ccRCC have not been reported.
In this study, we were committed to exploring the diagnostic and prognostic value of SAA1 in ccRCC, especially in advanced ccRCC, and strived to explore the therapeutic potential of targeting SAA1.
We downloaded the GSE11151 (22), GSE6344 (23) and GSE781 (24) datasets from the GEO database (https://www.ncbi.nlm.nih.gov/geo/), which is a public and shared cancer database. We took the top ten up-regulated genes in these three datasets to analyze the intersection genes.
The differentially expressed genes (DEGs) of GSE11151, GSE6344 and GSE781 datasets were identified using GEO2R (https://www.ncbi.nlm.nih.gov/geo/geo2r/), an available online analysis software for the GEO database, which was dependent on R language programming. According to the criteria of logFC ≥2 or logFC ≤-2 and adjusted p value < 0.05, DEGs from the three datasets were identified. We used the Wayne diagram to screen the intersection of three datasets with the top 10 up-regulated DEGs.
The mRNA expression data of SAA1 in ccRCC tissues and para-cancer tissues and clinicopathological features including gender, age, T stage, tumor grade, M stage, N stage, histopathological stage, overall survival (OS) were downloaded from TCGA-KIRC datasets (https://xenabrowser.net/heatmap/). Kaplan-Meier curves and ROC curves were analyzed using mRNA levels from TCGA-KIRC dataset.
SAA1 mRNA, protein expression and promoter methylation levels were evaluated using the UALCAN online analysis software (http://ualcan.path.uab.edu/index.html) (25).
SAA1 mRNA, overall survival and disease-free survival were also evaluated using GEPIA online analysis software (http://gepia.cancer-pku.cn/) (26).
The potential diagnostic value of SAA1 was evaluated using the receiver operating characteristic (ROC) curves by Graphpad Prism software.
Human RCC cell lines 786-O, ACHN, A-498, Caki-1 and normal renal tubular epithelial cells HK-2 were obtained from ATCC. OS-RC-2 cell line was a gift from the Department of Urology of Wuhan Tongji Hospital. All cell lines were cultured in DMEM medium containing 1% penicillin-streptomycin and 10% FBS. Small interfering RNA (si-RNA) against SAA1 and corresponding negative control (si-NC) were purchased from Ribobio Biological Co., Ltd. (Guangzhou, China). si-SAA1 sequences and si-NC sequences were transfected into cells using Lipofectamine 2000 reagent.
ccRCC tissues and adjacent normal tissues were fixed in 10% formalin, dehydrated, and embedded in paraffin sequentially. The paraffin sections were incubated with anti-SAA1 antibody overnight at 4°C. Transwell migration and invasion were performed using 24-well transwell chambers. The specific details of these experiments were previously described (27).
We collected ccRCC tissues and adjacent normal tissues of 30 case patients who were subjected to partial nephrectomies or nephrectomies at Wuhan Union Hospital between 2018 and 2019. All patients had signed an informed consent form. This study was approved by the Ethics Committee of Huazhong University of Science and Technology.
SPSS statistical software and Graphpad Prism 7.0 were used for statistical analysis. The SAA1 mRNA levels were analyzed among different clinicopathological features of ccRCC using the Mann-Whitney test. Pearson’s chi-square test was used to analyze the correlation between SAA1 expression levels and clinicopathological features of ccRCC. The ROC curve was used to distinguish ccRCC patients and obtain the area under the curve (AUC). The Kaplan-Meier curve was used to analyze the relationship between the expression level of SAA1 and the overall survival and progression-free survival of ccRCC patients. Each group of data is presented as mean ± SD. The p value<0.05 was considered statistically significant.
By analyzing three public cancer datasets, we found two intersection genes, SAA1 and CCL20, in these three datasets (Figure 1A). Next, we analyzed the correlation between the expression levels of these two genes and the overall and disease-free survival of patients with ccRCC. We found that only SAA1 expression was associated with prognosis in patients with ccRCC and high SAA1 expression indicated a worse prognosis (Figures 1B, C).
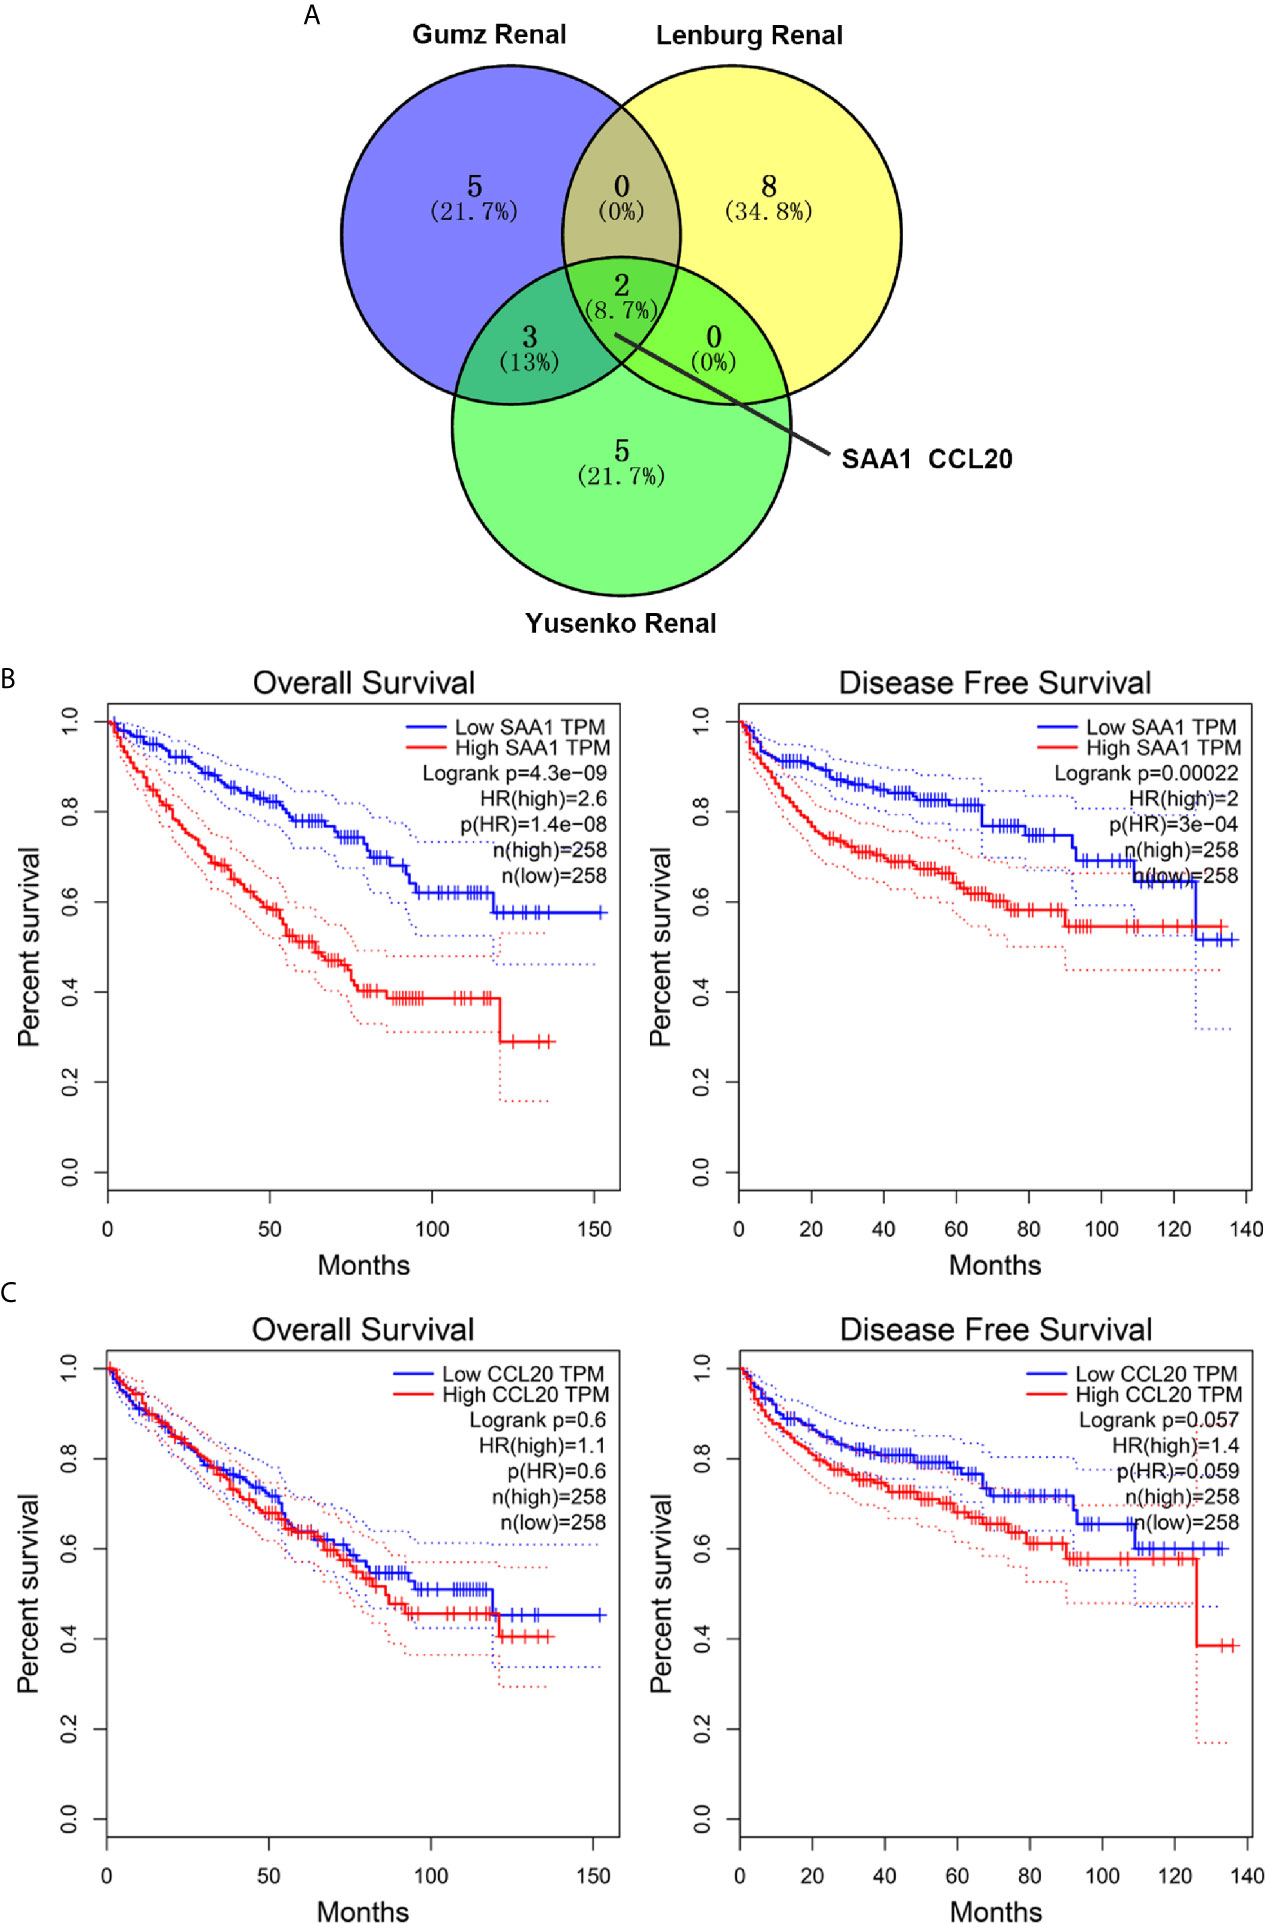
Figure 1 Screening and prognostic analysis of up-regulated target genes in ccRCC patients. (A) Wayne diagram showing top ten up-regulated genes in three public databases. (B) Kaplan Meier curve analysis for the effect of SAA1 expression on the prognosis of ccRCC patients. (C) Kaplan Meier curve analysis for the effect of CCL20 expression on the prognosis of ccRCC patients.
To verify the reliability of the above three studies, we analyzed the expression of SAA1 and its association with clinical pathological parameters in the TCGA database. As shown in Figure 2A, SAA1 expression in tumor tissues is upregulated at mRNA levels. Next, we analyzed the mRNA expression levels of SAA1 against T stage, N stage, M stage, Grade classification, histopathological stage and its correlation with these clinicopathological parameters in patients with ccRCC (Figures 2B–F and Table 1). Our analysis found that the mRNA expression of SAA1 was positively correlated with these clinicopathological parameters and that the mRNA expression of SAA1 increased significantly in higher tumor stages but did not increase or show a downward trend in early tumor stages (Figures 2B–F). These results suggested that elevated mRNA expression of SAA1 was predictive of advanced tumor stages. To make our study more precise, we also analyzed the expression of SAA1 in the UALCAN and GEPIA online tumor database websites. As shown in Figures 3A–F, high SAA1 expression mainly occurred in patients with advanced and metastatic ccRCC, which were consistent with the analysis results of the TCGA database. Similarly, we also analyzed the expression of SAA1 at the protein level, and the results showed that SAA1 protein expression increased significantly in patients with advanced ccRCC (Figures 4A–C). The above results indicate that SAA1 is highly expressed at mRNA and protein levels and predicts high stage risk in patients with advanced and metastatic ccRCC.
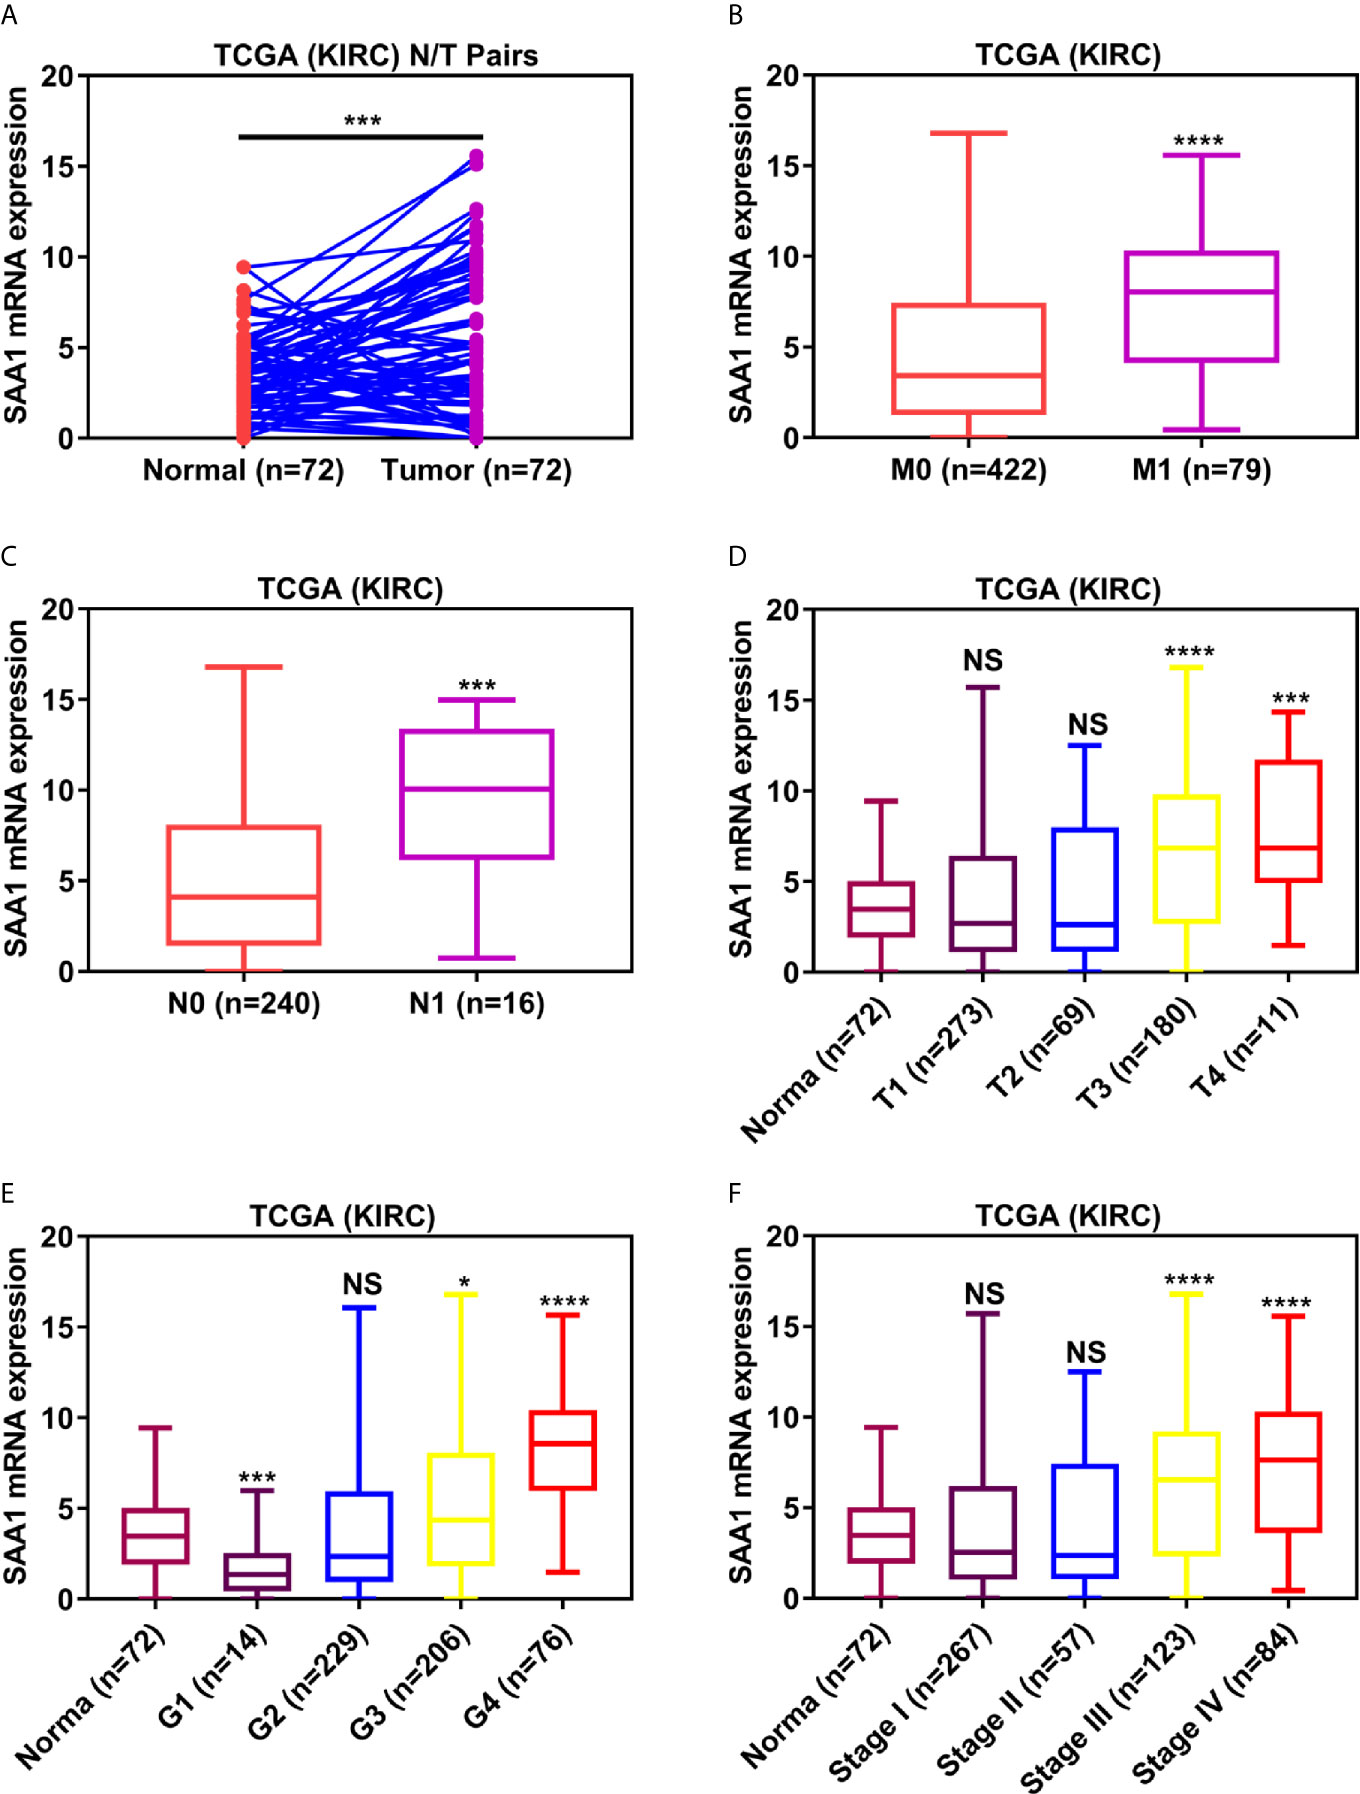
Figure 2 Analysis of SAA1 mRNA expression using TCGA database. (A) The mRNA expression levels of SAA1 were up-regulated in ccRCC samples, which were downloaded from TCGA-KIRC database containing 72 paired ccRCC samples. The expression levels of SAA1 mRNA were compared in various tumor stages: (B) M stage, (C) N stage, (D) T stage, (E) tumor grade, (F) TNM stage. (****P <0.0001, ***P <0.001, *P <0.05, NS means no significance, compared with the respective control).
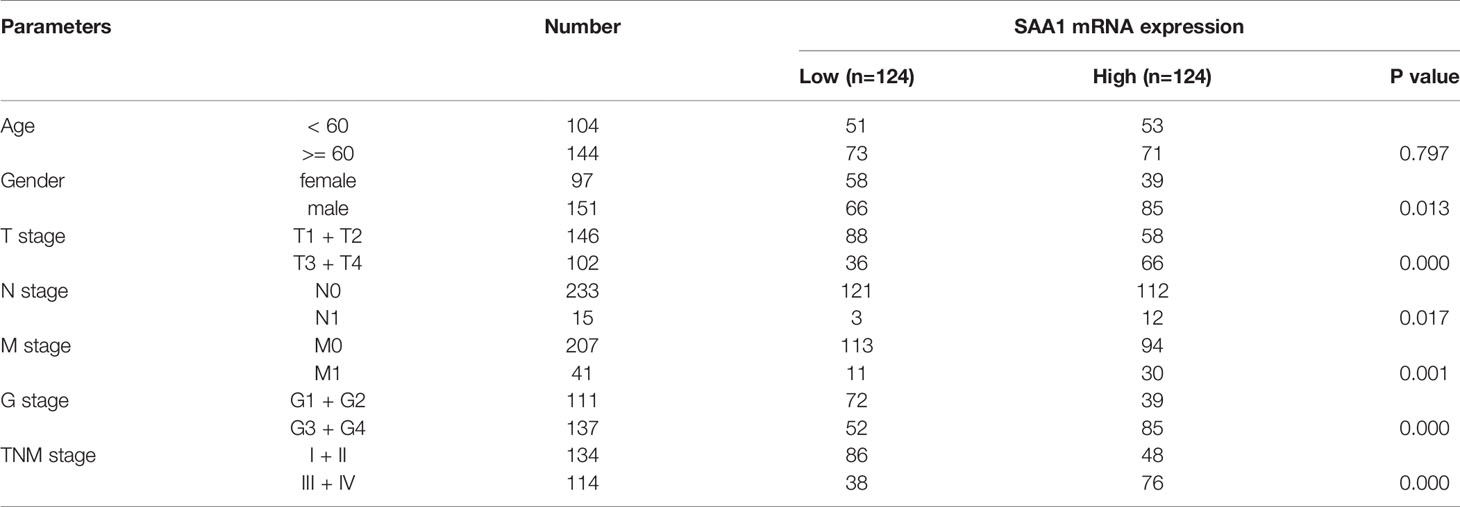
Table 1 Association of SAA1 mRNA expression with clinicopathological parameters in ccRCC patients.
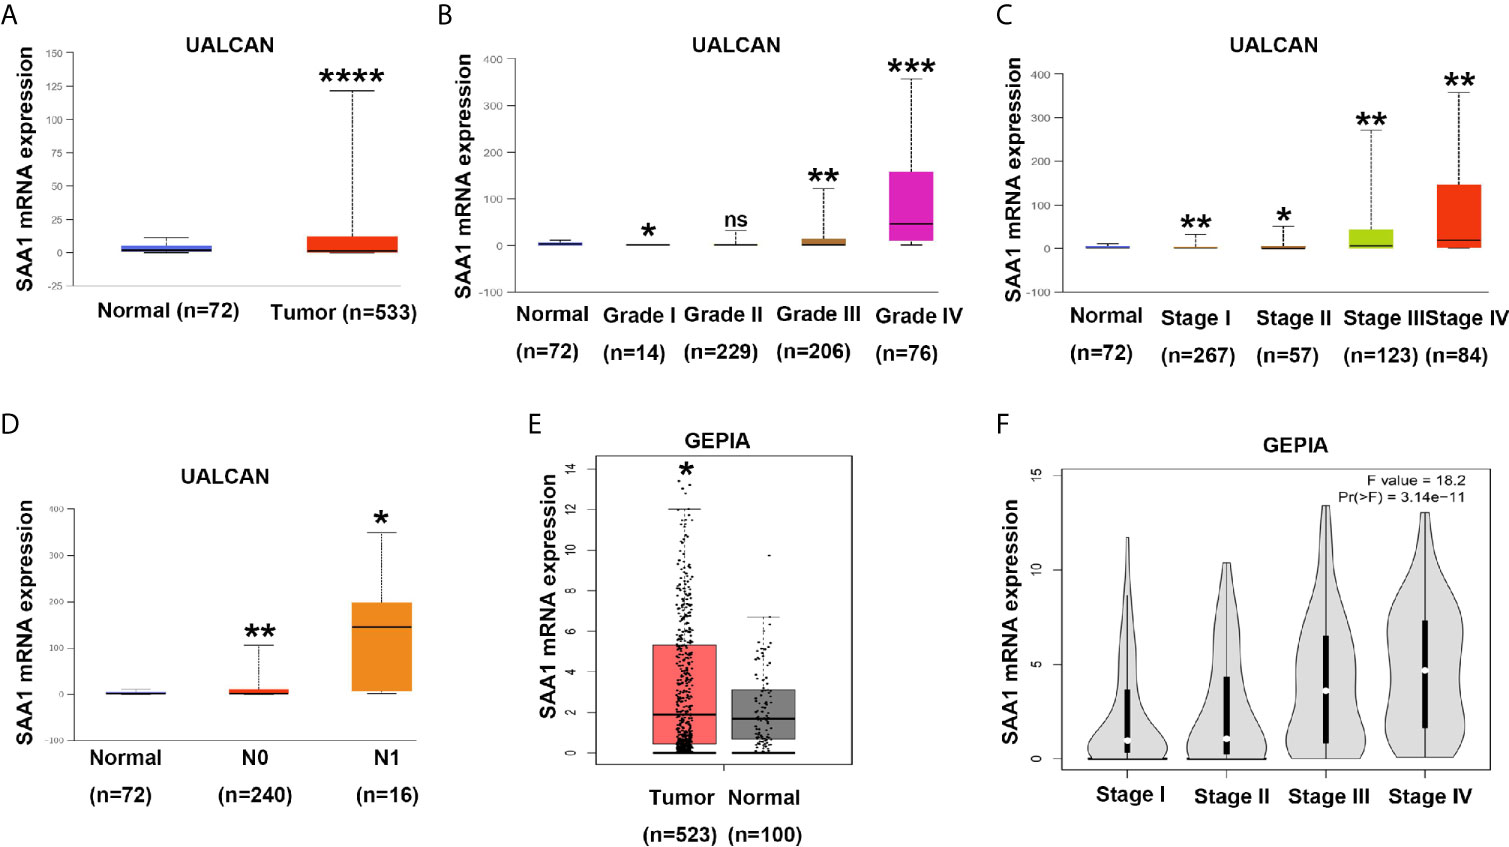
Figure 3 Analysis of SAA1 mRNA expression using UALCAN and GEPIA database. (A) The mRNA expression levels of SAA1 were up-regulated in ccRCC samples from UALCAN database. (B) The expression levels of SAA1 mRNA were compared in tumor grade from UALCAN database. (C) The expression levels of SAA1 mRNA were compared in TNM stage from UALCAN database. (D) The expression levels of SAA1 mRNA were compared in N stage from UALCAN database. (E) The mRNA expression levels of SAA1 were up-regulated in ccRCC samples from GEPIA database. (F) The expression levels of SAA1 mRNA were compared in TNM stage from GEPIA database. (****P<0.0001, ***P<0.001, **P<0.01, *P<0.05, NS means no significance, compared with the respective control).
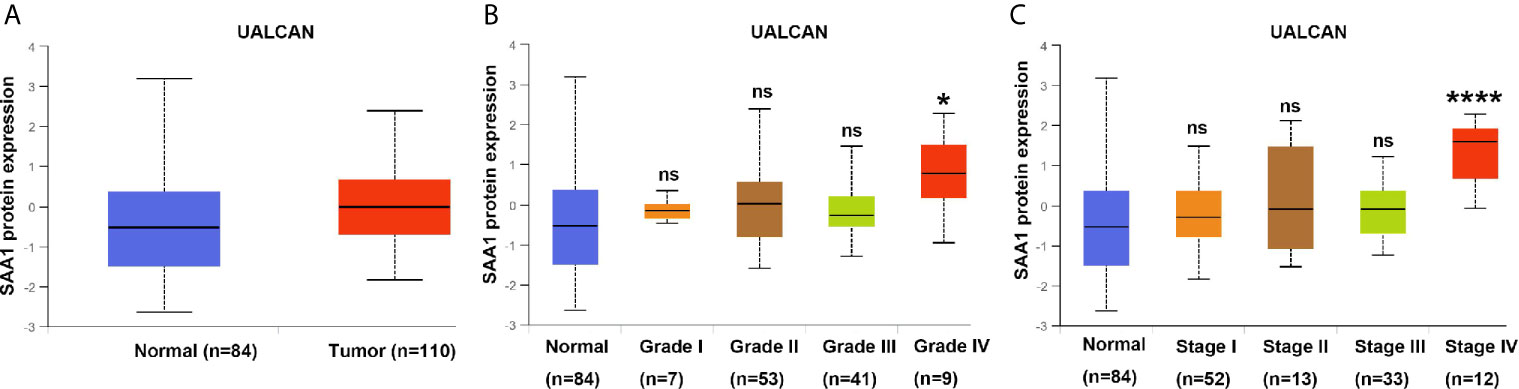
Figure 4 Analysis of SAA1 protein expression using UALCAN database. (A) The protein expression analysis of SAA1 in ccRCC samples from UALCAN database. (B) The protein expression levels of SAA1 were compared in tumor grade from UALCAN database. (C) The protein expression levels of SAA1 were compared in TNM stage from UALCAN database. (****P<0.0001, *P<0.05, NS means no significance, compared with the respective control).
DNA methylation modification is an important component of epigenetics, which can silence the expression of methylated genes. To understand the cause of SAA1 overexpression in advanced and metastatic ccRCC, we analyzed the methylation status of SAA1 gene through the UALCAN online database. As shown in Figure 5A, the SAA1 gene was hypomethylated in ccRCC tissues, while it was hypermethylated in normal kidney tissues. Moreover, with the increase of tumor stage and grade, the degree of SAA1 gene methylation decreased accordingly, which means that the degree of SAA1 gene methylation was inversely related to the tumor’s stage (Figures 5B–D). These results indicate that the upregulation of SAA1 expression is due to the low methylation levels of the SAA1 promoter region in ccRCC and its methylation levels are inversely correlated with tumor stage and grade.
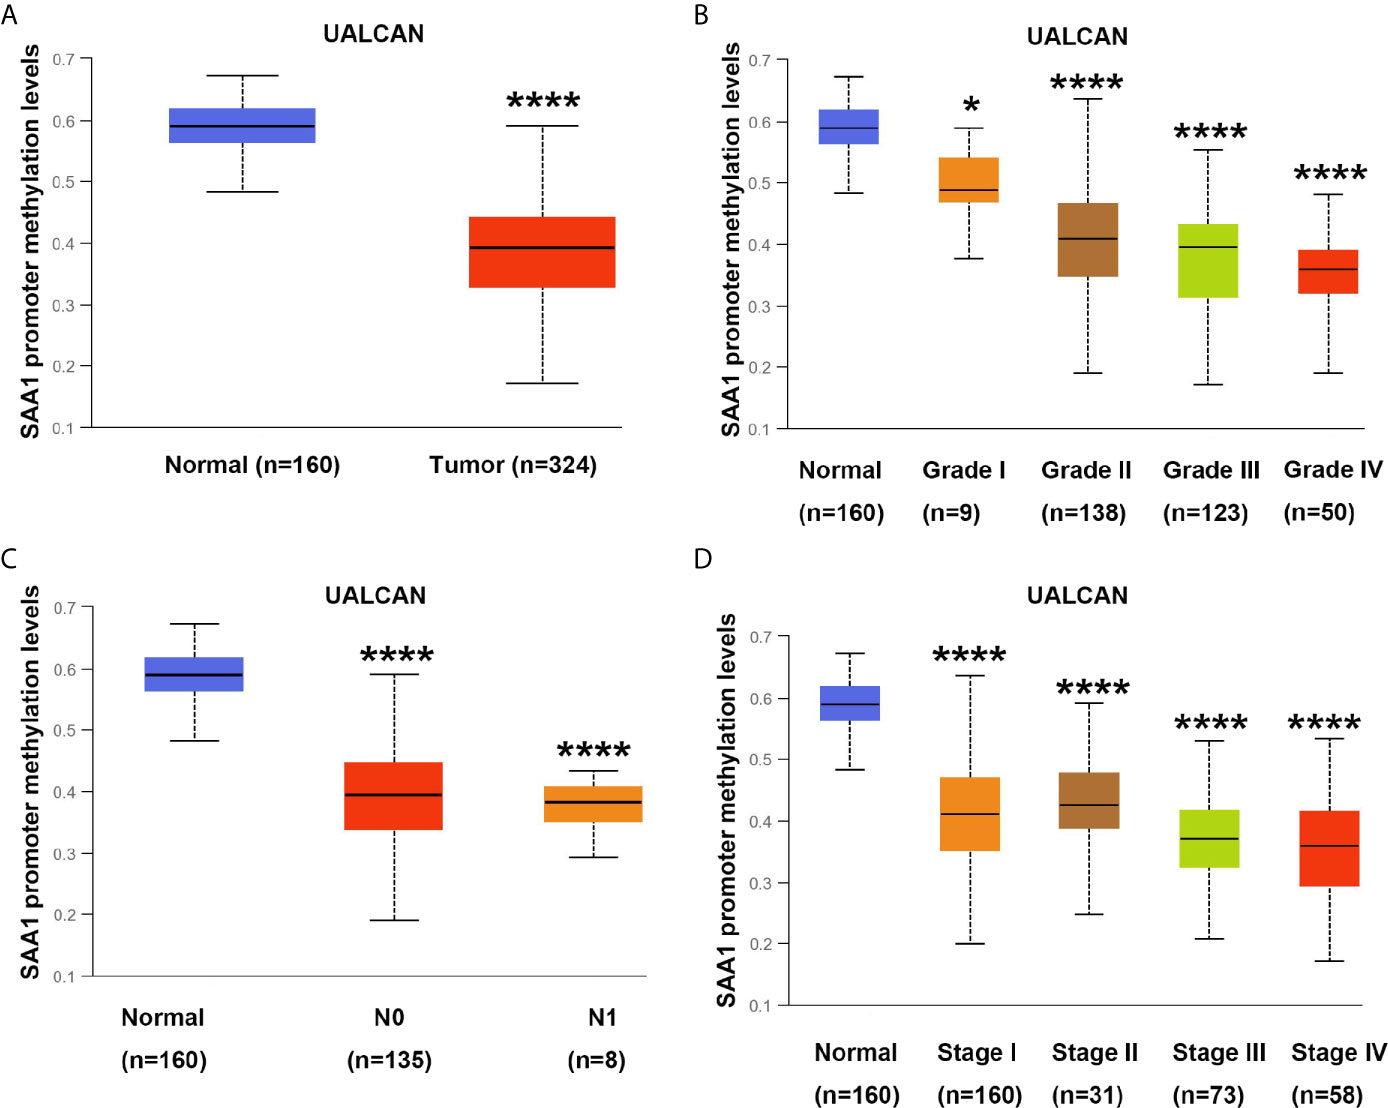
Figure 5 Analysis of methylation levels in SAA1 gene promoter region. (A) The methylation analysis of SAA1 gene promoter region in ccRCC samples from UALCAN database. (B) The methylation levels of SAA1 gene promoter region were compared in tumor grade from UALCAN database. (C) The methylation levels of SAA1 gene promoter region were compared in N stage from UALCAN database. (D) The methylation levels of SAA1 gene promoter region were compared in TNM stage from UALCAN database. (****P<0.0001, *P<0.05, compared with the respective control).
Biomarkers for tumor progression are still lacking in ccRCC patients. We found that SAA1 expression was significantly up-regulated at the mRNA and protein levels in patients with advanced and metastatic ccRCC. We wondered whether SAA1 could accurately diagnose patients with advanced and metastatic ccRCC. To determine the diagnostic value of SAA1, we performed ROC curve analysis between tumor tissues with different stage or grade and normal tissues. As shown in Figures 6A–D, high SAA1 levels could effectively distinguish advanced and metastatic ccRCC tissues from normal tissues (Normal/T4 (Figure 6A, AUC = 0.8157, p = 0.0008); Normal/N1 (Figure 6B, AUC = 0.8481, p < 0.0001); Normal/M1 (Figure 6B, AUC = 0.7917, p < 0.0001); Normal/G4 (Figure 6C, AUC = 0.8862, p < 0.0001); Normal/Stage IV (Figure 6D, AUC = 0.7737, p < 0.0001), but could not distinguish early ccRCC tissues from normal tissues. These results suggested that SAA1 could serve as a new diagnostic marker for patients with advanced and metastatic ccRCC. We wondered whether SAA1 predicts a similar prognosis in ccRCC patients with different stages and clinical parameters.
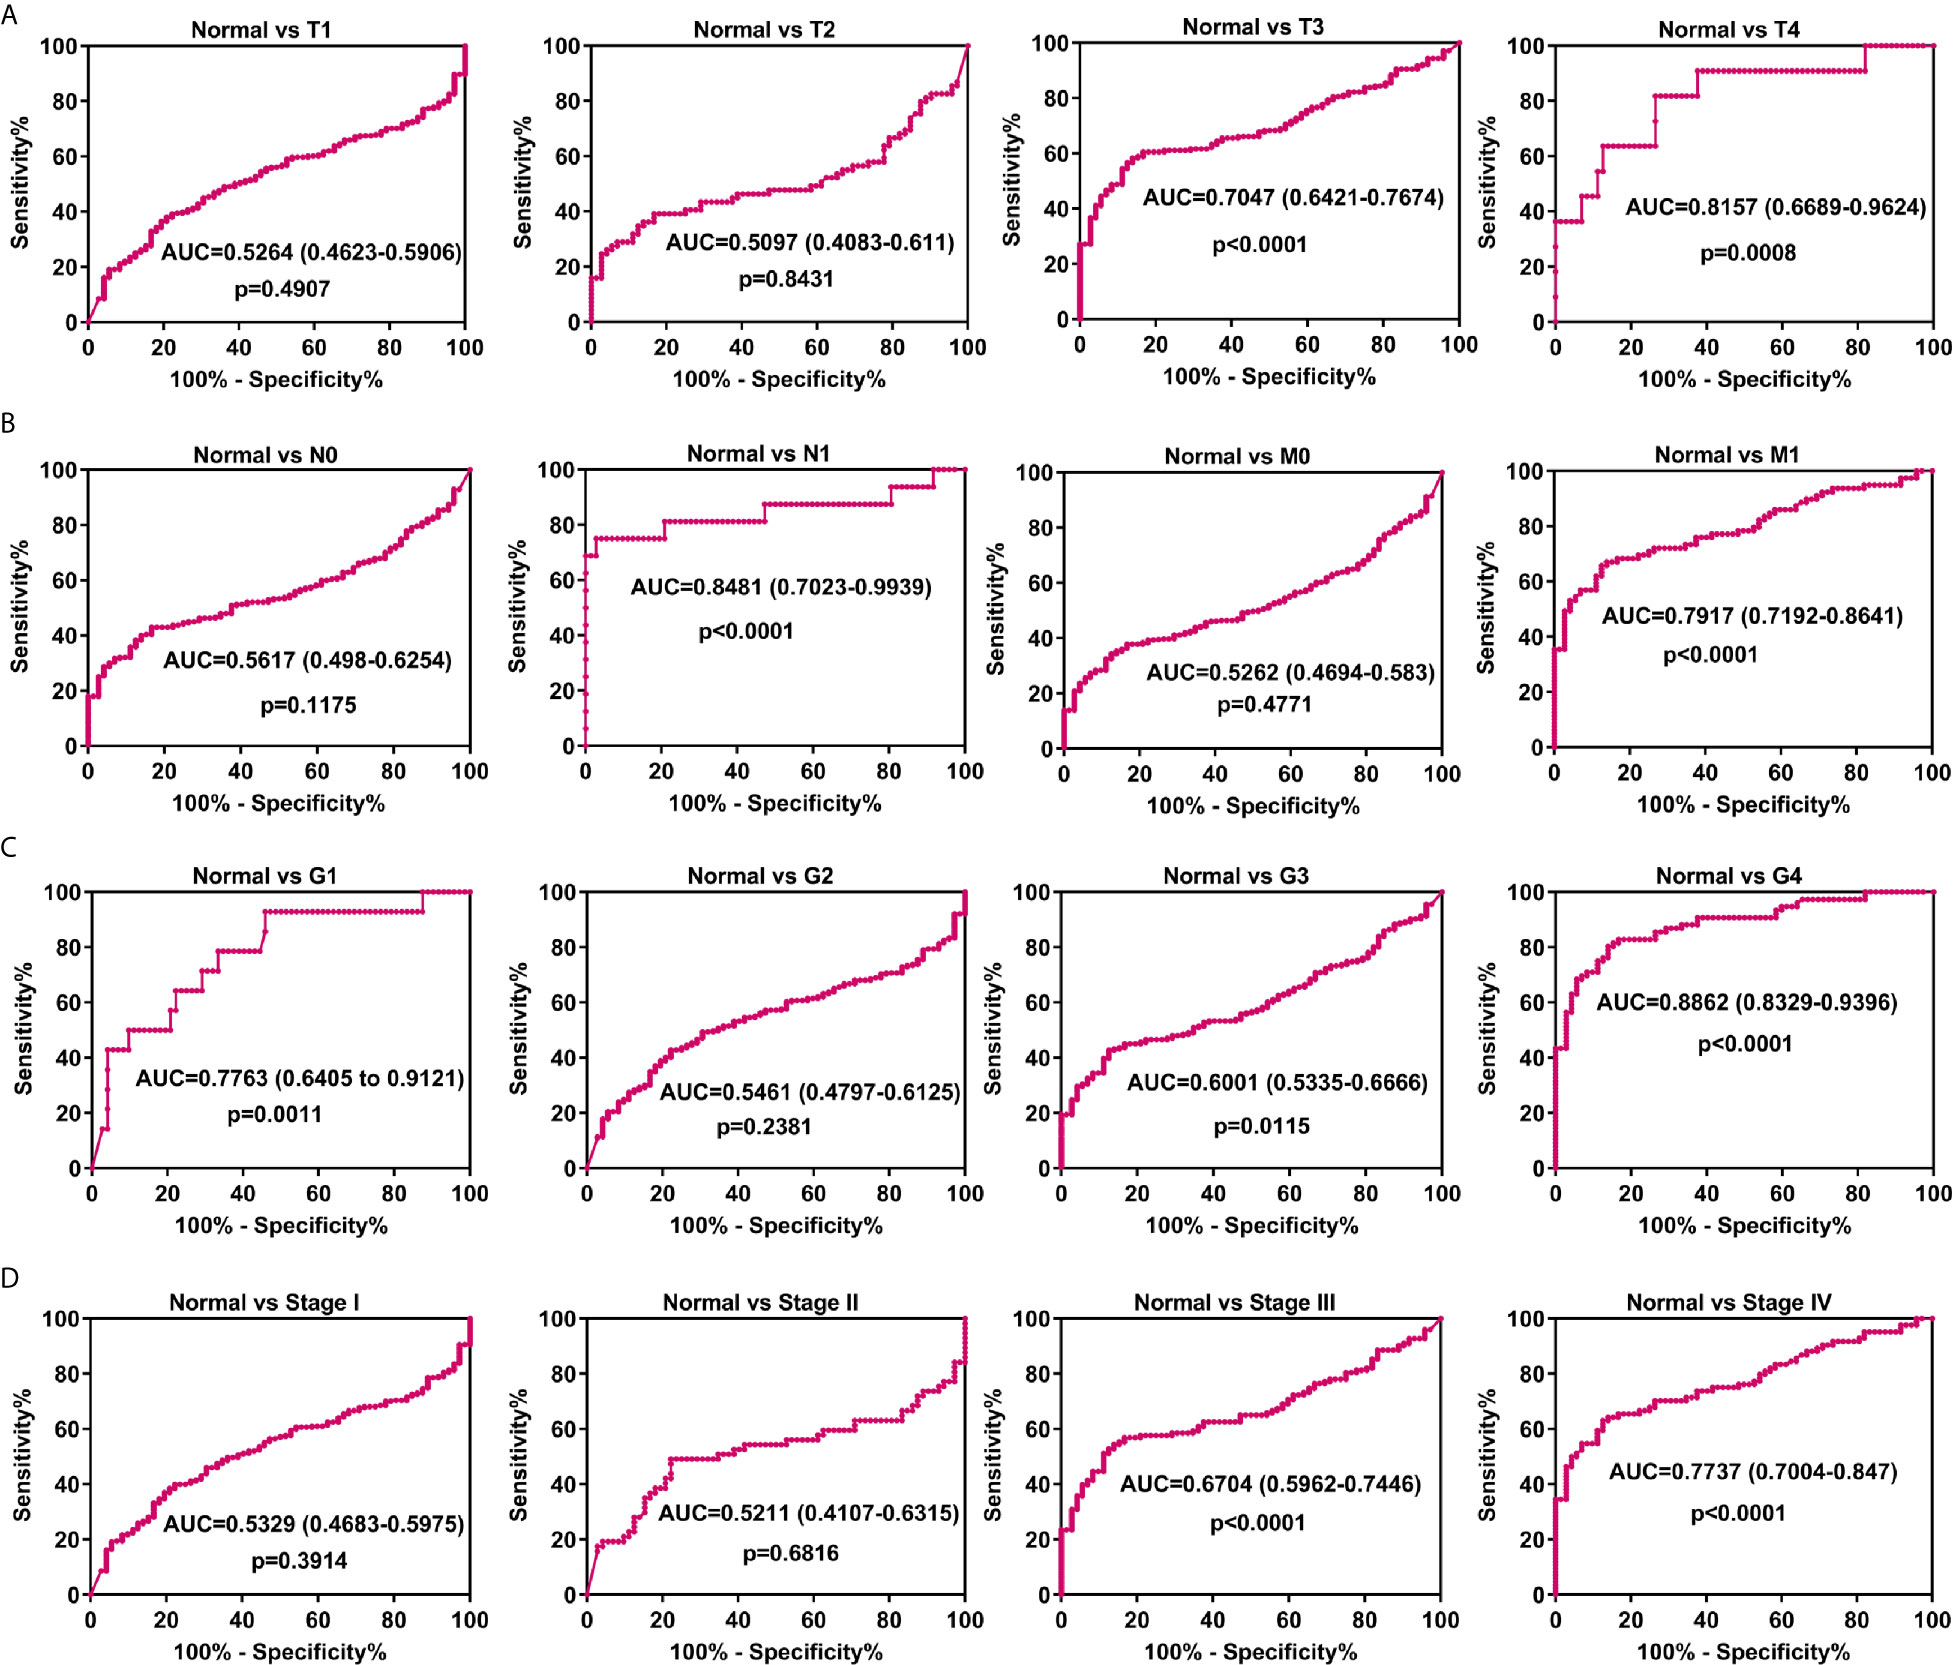
Figure 6 Analysis of the diagnostic value of SAA1 for advanced and metastatic ccRCC. (A) ROC curve analysis of the diagnostic value of SAA1 in patients with ccRCC at T stage. (B) ROC curve analysis of the diagnostic value of SAA1 in patients with ccRCC at N and M stages. (C) ROC curve analysis of the diagnostic value of SAA1 in patients with ccRCC at tumor grade. (D) ROC curve analysis of the diagnostic value of SAA1 in patients with ccRCC at TNM stage.
Our previous results have confirmed that high expression of SAA1 predicts poor overall and disease-free survival in patients with ccRCC (Figure 1B). Moreover, our COX regression analysis found that SAA1 could be used as an independent prognostic factor for ccRCC (Table 2). We wondered whether SAA1 predicted a similar prognosis in ccRCC patients with different stages and clinical parameters. Therefore, we performed Kaplan Meier curve analysis towards the expression of SAA1 in ccRCC patients with different stages and clinical parameters (Figures 7A–L). Our results indicated that high SAA1 expression could serve as a potential prognostic factor for ccRCC patients with T1 + T2 stage (Figure 7A, p = 0.0002), T3 + T4 stage (Figure 7B, p = 0.0030), N0 stage (Figure 7C, p < 0.0001), M0 stage (Figure 7D, p < 0.0001), G1 + G2 stage (Figure 7E, p = 0.0088), G3 + G4 stage (Figure 7F, p = 0.0014), Stage I+II (Figure 7G, p = 0.0004), Stage III+IV (Figure 7H, p = 0.0081), Female (Figure 7I, p < 0.0001), Male (Figure 7J, p = 0.0009), Age ≥ 60 years (Figure 7K, p < 0.0001), Age < 60 years (Figure 7L, p = 0.0044).
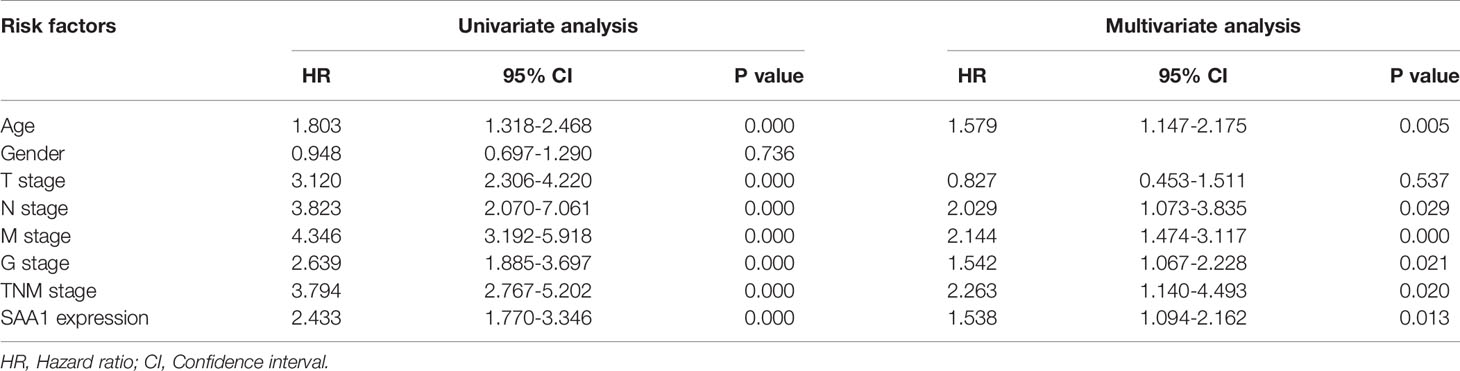
Table 2 COX regression analysis between prognostic risk factors and overall survival of ccRCC patients.
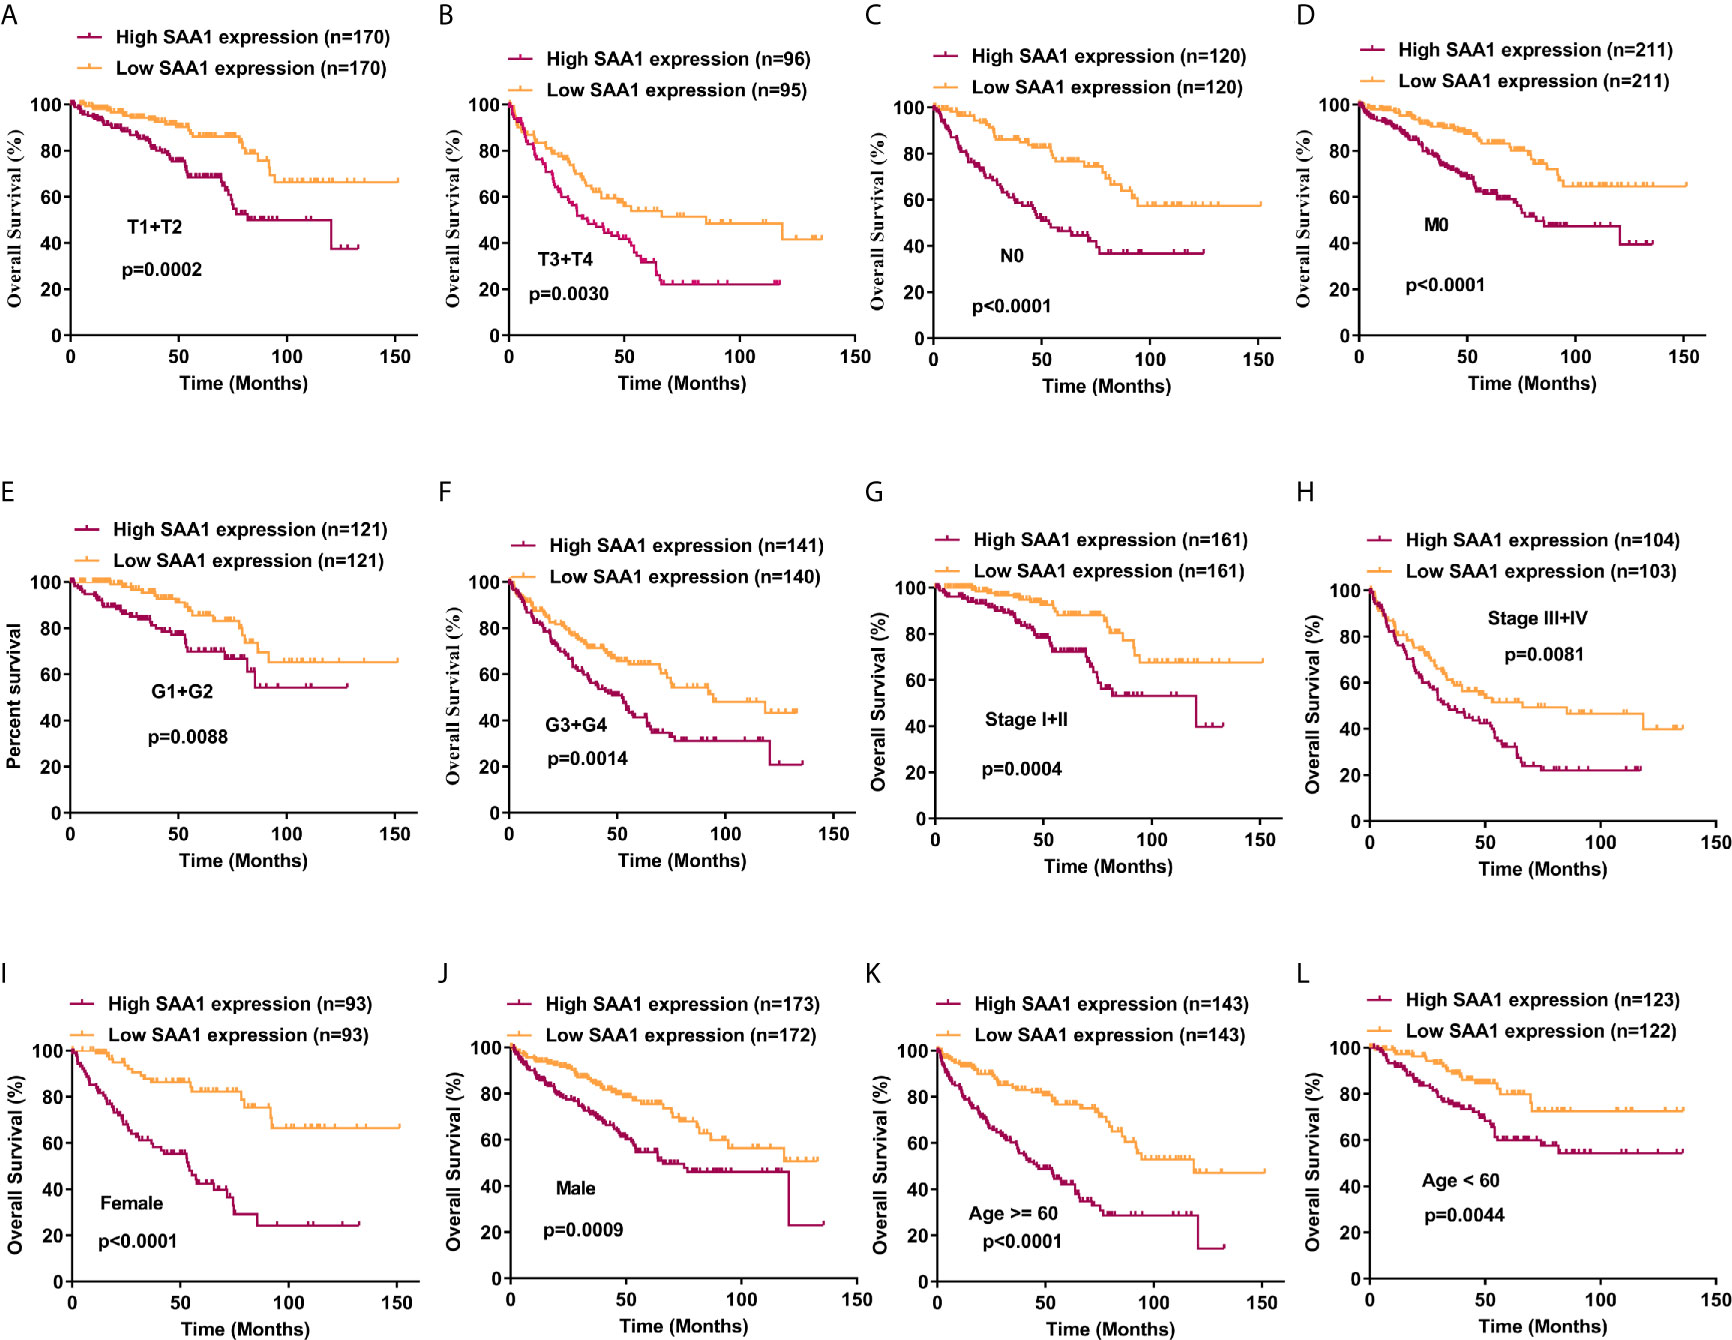
Figure 7 Analysis of the prognostic value of SAA1 for ccRCC. The ccRCC tissue samples from TCGA database were divided into low SAA1 expression group and high SAA1 expression group according to the median expression value of SAA1 mRNA level. The correlation between SAA1 expression and overall survival time of ccRCC patients was analyzed by Kaplan-Meier. (A-L) Overall survival analysis towards the expression of SAA1 mRNA was performed in subgroups of ccRCC patients: (A) T1+T2 stage, (B) T3+T4 stage, (C) N0 stage, (D) M0 stage, (E) G1+G2 stage, (F) G3+G4 stage, (G) Stage I+II, (H) Stage III+IV, (I) Female, (J) Male, (K) Age≥60 years, (L) Age<60 years.
To further confirm the results of the UALCAN, GEPIA and TCGA databases, SAA1 was subjected to western blotting in RCC cell lines and tissues. As shown in Figures 8A, B, the protein levels of SAA1 in RCC cell lines were significantly up-regulated compared with normal renal epithelial cell HK-2, and the protein levels of SAA1 in ccRCC tissues was also obviously overexpressed compared with adjacent normal tissues. The protein levels of SAA1 were also examined by immunohistochemistry (IHC) in paired ccRCC tissues, and the IHC results were consistent with the results of western blotting (Figure 8C). These results indicate that SAA1 is up-regulated in ccRCC cell lines and tissues, consistent with the results of UALCAN, GEPIA and TCGA database.
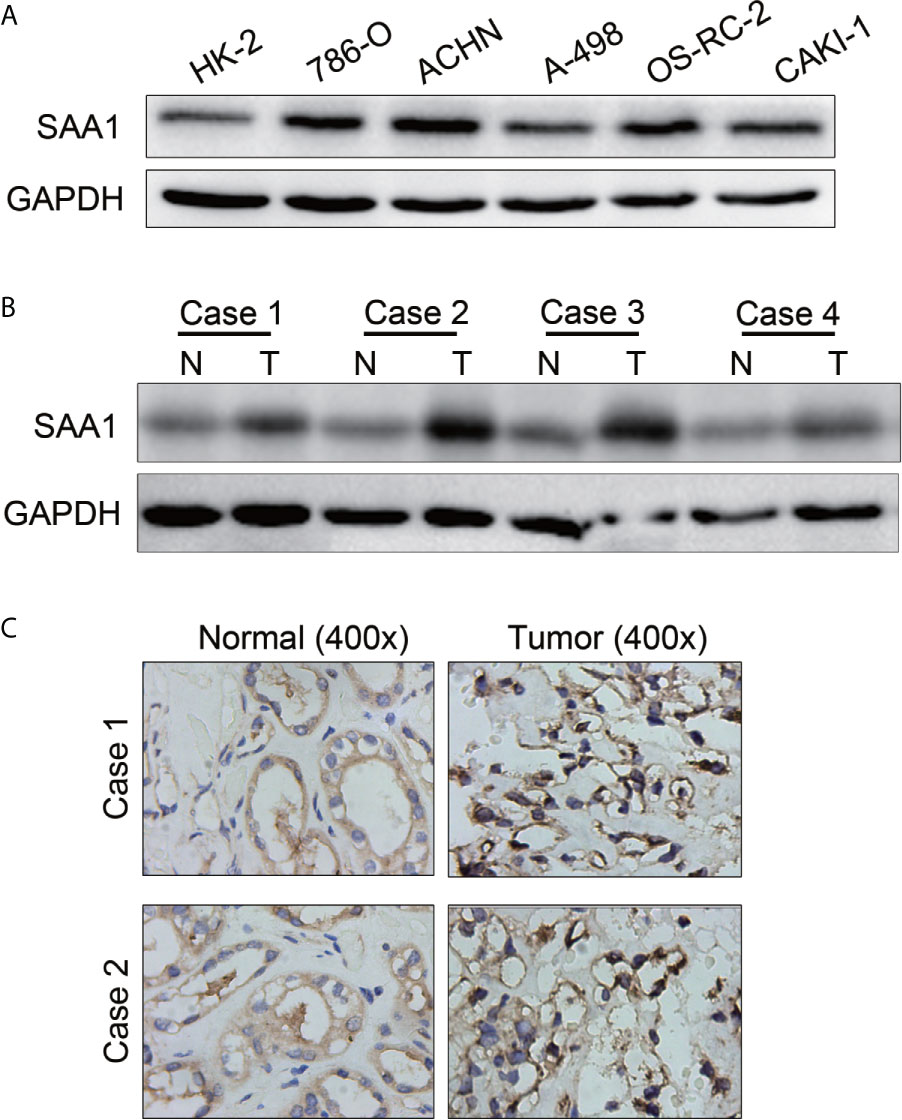
Figure 8 The protein levels of SAA1 in RCC cells and tissues. (A) Western blotting analysis of SAA1 expression levels in RCC cell lines (786-O, ACHN, A-498, OS-RC-2, Caki-1) and renal normal epithelial cells (HK-2). (B) Western blotting analysis of SAA1 protein levels in 4 pairs of ccRCC tissues (N, normal tissue; T, tumor tissue). (C) IHC analysis of SAA1 protein levels in normal renal tissues and ccRCC tissues.
To investigate whether SAA1 affects the migration and invasion of RCC cells, we performed the transwell assays. As shown in Figures 9A, B, knockdown of SAA1 significantly impaired the migration and invasion capability of 786-O and ACHN cells. These results reversely suggest that SAA1 promotes migration and invasion of RCC cells.
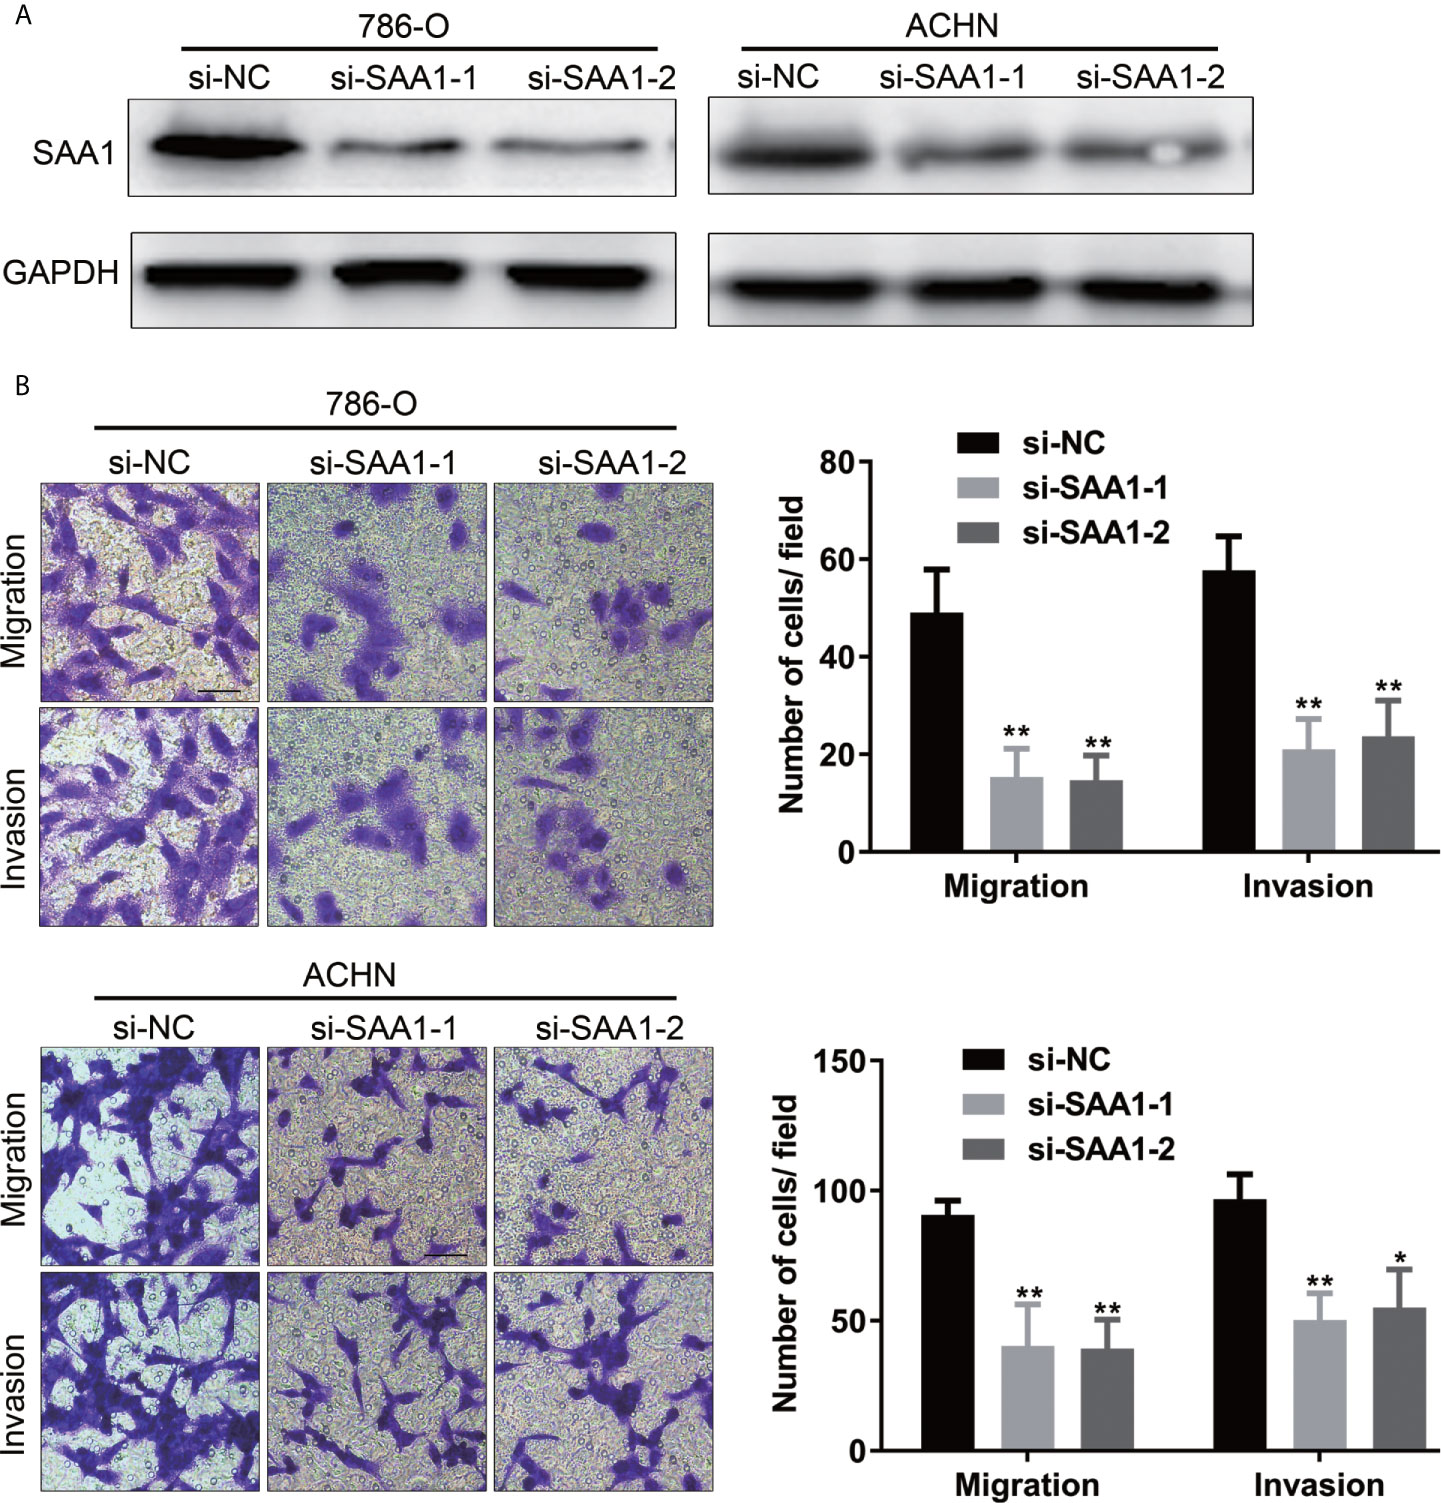
Figure 9 SAA1 knockdown significantly inhibits migration and invasion of RCC cells in vitro. (A, B) Transwell assays analysis of the effect of SAA1 knockdown on cell migration and invasion of 786-O and ACHN. (**P<0.01, *P<0.05, compared with si-NC group).
The most common malignant tumor of the kidney is renal cell carcinoma (RCC), and ccRCC is the most common pathological subtype of RCC. The surrounding abundant vascularization causes ccRCC to grow easily and metastasize through the blood (28). It is reported that about 15% of RCC patients have distant metastases at the time of diagnosis (29). Moreover, treatment options for patients with advanced and metastatic ccRCC are limited and their survival prognosis is poor. Therefore, biomarkers screening for ccRCC progression is the key to improve the diagnosis and treatment of advanced and metastatic ccRCC. However, there is still a lack of clinical biomarkers for ccRCC progression and therapeutic targets for biomarkers.
SAA1 is currently recognized as an acute phase protein. When the body suffers from inflammation, trauma, surgery or advanced malignant tumors, the expression of SAA1 is significantly up-regulated (30). SAA1 has been reported to play a critical role in high-density lipoprotein metabolism and cholesterol homeostasis (11, 12). In addition, the role of SAA1 in tumor progression and its potential as a biomarker have also been extensively studied. For example, a large number of studies have reported that SAA1 promotes tumor progression and accelerates distant metastasis (31, 32). High SAA1 expression could be used as a potential biomarker for a variety of malignant tumors (18–20). Previous studies reported that SAA1 possessed the potential to become a prognostic marker of RCC (33, 34). Moreover, another study reported that serum SAA1 has been identified as a biomarker of distant metastases but not as an early tumor marker in RCC patients (21). These studies, unfortunately, did not detect the expression of SAA1 at the level of tumor cells and tissues. In addition, studies on SAA1 as a diagnostic and prognostic marker for advanced and metastatic ccRCC lack the support of extensive public research data.
In this study, we used three publicly published ccRCC GSE datasets to mine the top ten up-regulated genes and used the Wayne diagram to take the intersection in the three datasets. As a result, we screened out two candidate genes, SAA1 and CCL20. Next, we performed a prognostic analysis of these two genes using data from the TCGA database and found that only SAA1 possessed a predictive significance for ccRCC patients. So we used SAA1 as our target gene. To verify the accuracy of our screened genes, we analyzed SAA1 expression using publicly available TCGA, UALCAN and GEPIA databases. The results indicate that SAA1 is upregulated not only at the mRNA level but also at the protein level in ccRCC patients and exhibits higher expression levels in advanced and metastatic ccRCC. Next, we analyzed the reasons for the upregulation of SAA1 in ccRCC and found that the methylation levels of the promoter region of SAA1 gene were reduced, especially in advanced and metastatic ccRCC. ROC curve analysis found that SAA1 could only distinguish patients with advanced and metastatic ccRCC from the normal population, while Kaplan Meier curve analysis indicated that high SAA1 expression always predicted a worse prognosis regardless of tumor stage. Functionally, SAA1 knockdown significantly inhibits the migration and invasion of RCC cells in vitro.
Collectively, we found that SAA1 expression was up-regulated in kidney cancer tissues and its high expression was predictive of advanced tumor stage. In addition, SAA1 could serve as a biomarker for the diagnosis and prognosis of advanced and metastatic renal cell carcinoma at the tumor tissue level. Targeted SAA1 therapy might provide new treatment directions and good prognosis for patients with advanced and metastatic ccRCC.
Unsatisfactorily, there are some flaws in our research. Such as, the specific mechanism and molecular pathways of SAA1-mediated ccRCC metastasis remain unclear. The functions of SAA1 in vivo are still unclear. Moreover, our prediction data on tumor diagnosis and prognosis are mainly derived from cancer databases, and there is a lack of clinical and prognostic data for metastatic renal cell carcinoma patients, such as the International Metastatic Renal-Cell Carcinoma Database Consortium (IMDC) risk score. In addition, the SAA1 expression level in tissue specimens of metastatic renal cell carcinoma and its relationship with the prognosis of patients are still unclear. In subsequent experiments, we will continue to carry out relevant studies on these shortcomings. However, our study confirms that SAA1 expression is significantly up-regulated in advanced and metastatic ccRCC and can effectively distinguish patients with advanced and metastatic ccRCC from the normal population.
In summary, for the first time, we have demonstrated that SAA1 expression is significantly upregulated at the mRNA and protein levels in advanced and metastatic ccRCC. Moreover, SAA1 has great potential as a diagnostic and prognostic marker for advanced and metastatic ccRCC. In addition, targeted SAA1 therapy provides a new treatment and strategy for patients with advanced and metastatic ccRCC.
The datasets presented in the study are included in the article, further inquiries can be directed to the corresponding authors.
The studies involving human participants were reviewed and approved by Huazhong University of Science and Technology. The patients/participants provided their written informed consent to participate in this study. Written informed consent was obtained from the individual(s) for the publication of any potentially identifiable images or data included in this article.
All authors contributed to the article and approved the submitted version.
This study was supported by grant from National Natural Sciences Foundation of China (82002706, 81874090).
The authors declare that the research was conducted in the absence of any commercial or financial relationships that could be construed as a potential conflict of interest.
1. Siegel RL, Miller KD, Jemal A. Cancer Statistics, 2019. CA Cancer J Clin (2019) 69:7–34. doi: 10.3322/caac.21551
2. Motzer RJ, Bacik J, Schwartz LH, Reuter V, Russo P, Marion S, et al. Prognostic Factors for Survival in Previously Treated Patients With Metastatic Renal Cell Carcinoma. J Clin Oncol (2004) 22:454–63. doi: 10.1200/JCO.2004.06.132
3. Flanigan RC, Mickisch G, Sylvester R, Tangen C, Van Poppel H, Crawford ED. Cytoreductive Nephrectomy in Patients With Metastatic Renal Cancer: A Combined Analysis. J Urol (2004) 171:1071–6. doi: 10.1097/01.ju.0000110610.61545.ae
4. Motzer RJ, Hutson TE, Tomczak P, Michaelson MD, Bukowski RM, Rixe O, et al. Sunitinib Versus Interferon Alfa in Metastatic Renal-Cell Carcinoma. N Engl J Med (2007) 356:115–24. doi: 10.1056/NEJMoa065044
5. Escudier B, Eisen T, Stadler WM, Szczylik C, Oudard S, Siebels M, et al. Sorafenib in Advanced Clear-Cell Renal-Cell Carcinoma. N Engl J Med (2007) 356:125–34. doi: 10.1056/NEJMoa060655
6. Garje R, An J, Greco A, Vaddepally RK, Zakharia Y. The Future of Immunotherapy-Based Combination Therapy in Metastatic Renal Cell Carcinoma. Cancers (Basel) (2020) 12. doi: 10.3390/cancers12010143
7. Park K, Lee JL, Park I, Park S, Ahn Y, Ahn J-H, et al. Comparative Efficacy of Vascular Endothelial Growth Factor (VEGF) Tyrosine Kinase Inhibitor (TKI) and Mammalian Target of Rapamycin (mTOR) Inhibitor as Second-Line Therapy in Patients With Metastatic Renal Cell Carcinoma After the Failure of First-Line VEGF TKI. Med Oncol (2012) 29:3291–7. doi: 10.1007/s12032-012-0227-7
8. Ascierto ML, McMiller TL, Berger AE, Danilova L, Anders RA, Netto GJ, et al. The Intratumoral Balance Between Metabolic and Immunologic Gene Expression is Associated With Anti-PD-1 Response in Patients With Renal Cell Carcinoma. Cancer Immunol Res (2016) 4:726–33. doi: 10.1158/2326-6066.CIR-16-0072
9. Gabay C, Kushner I. Acute-Phase Proteins and Other Systemic Responses to Inflammation. N Engl J Med (1999) 340:448–54. doi: 10.1056/NEJM199902113400607
10. Malle E, Sodin-Semrl S, Kovacevic A. Serum Amyloid A: An Acute-Phase Protein Involved in Tumour Pathogenesis. Cell Mol Life Sci (2009) 66:9–26. doi: 10.1007/s00018-008-8321-x
11. Prufer N, Kleuser B, van der Giet M. The Role of Serum Amyloid A and Sphingosine-1-Phosphate on High-Density Lipoprotein Functionality. Biol Chem (2015) 396:573–83. doi: 10.1515/hsz-2014-0192
12. Deetman PE, Bakker SJ, Dullaart RP. High Sensitive C-reactive Protein and Serum Amyloid A are Inversely Related to Serum Bilirubin: Effect-Modification by Metabolic Syndrome. Cardiovasc Diabetol (2013) 12:166. doi: 10.1186/1475-2840-12-166
13. Michaeli A, Finci-Yeheskel Z, Dishon S, Linke RP, Levin M, Urieli-Shoval S. Serum Amyloid A Enhances Plasminogen Activation: Implication for a Role in Colon Cancer. Biochem Biophys Res Commun (2008) 368:368–73. doi: 10.1016/j.bbrc.2008.01.079
14. Urieli-Shoval S, Shubinsky G, Linke RP, Fridkin M, Tabi I, Matzner Y. Adhesion of Human Platelets to Serum Amyloid a. Blood (2002) 99:1224–9. doi: 10.1182/blood.V99.4.1224
15. Biran H, Friedman N, Neumann L, Pras M, Shainkin-Kestenbaum R. Serum Amyloid A (SAA) Variations in Patients With Cancer: Correlation With Disease Activity, Stage, Primary Site, and Prognosis. J Clin Pathol (1986) 39:794–7. doi: 10.1136/jcp.39.7.794
16. Liu DH, Wang XM, Zhang LJ, Dai S-W, Liu L-Y, Liu J-F, et al. Serum Amyloid A Protein: A Potential Biomarker Correlated With Clinical Stage of Lung Cancer. BioMed Environ Sci (2007) 20:33–40.
17. Raynes JG, Cooper EH. Comparison of Serum Amyloid A Protein and C-reactive Protein Concentrations in Cancer and non-Malignant Disease. J Clin Pathol (1983) 36:798–803. doi: 10.1136/jcp.36.7.798
18. Chan DC, Chen CJ, Chu HC, Chang W-K, Yu J-C, Chen Y-J, et al. Evaluation of Serum Amyloid A as a Biomarker for Gastric Cancer. Ann Surg Oncol (2007) 14:84–93. doi: 10.1245/s10434-006-9091-z
19. Moshkovskii SA, Serebryakova MV, Kuteykin-Teplyakov KB, Tikhonova OV, Goufman EI, Zgoda VG, et al. Ovarian Cancer Marker of 11.7 kDa Detected by Proteomics is a Serum Amyloid A1. Proteomics (2005) 5:3790–7. doi: 10.1002/pmic.200401205
20. Yokoi K, Shih LC, Kobayashi R, Koomen J, Hawke D, Li D, et al. Serum Amyloid A as a Tumor Marker in Sera of Nude Mice With Orthotopic Human Pancreatic Cancer and in Plasma of Patients With Pancreatic Cancer. Int J Oncol (2005) 27:1361–9. doi: 10.3892/ijo.27.5.1361
21. Ramankulov A, Lein M, Johannsen M, Schrader M, Miller K, Loening SA, et al. Serum Amyloid A as Indicator of Distant Metastases But Not as Early Tumor Marker in Patients With Renal Cell Carcinoma. Cancer Lett (2008) 269:85–92. doi: 10.1016/j.canlet.2008.04.022
22. Yusenko MV, Kuiper RP, Boethe T, Ljungberg B, van Kessel AG, Kovacs G. High-Resolution DNA Copy Number and Gene Expression Analyses Distinguish Chromophobe Renal Cell Carcinomas and Renal Oncocytomas. BMC Cancer (2009) 9:152. doi: 10.1186/1471-2407-9-152
23. Gumz ML, Zou H, Kreinest PA, Childs AC, Belmonte LS, LeGrand SN, et al. Secreted Frizzled-Related Protein 1 Loss Contributes to Tumor Phenotype of Clear Cell Renal Cell Carcinoma. Clin Cancer Res (2007) 13:4740–9. doi: 10.1158/1078-0432.CCR-07-0143
24. Lenburg ME, Liou LS, Gerry NP, Frampton GM, Cohen HT, Christman MF. Previously Unidentified Changes in Renal Cell Carcinoma Gene Expression Identified by Parametric Analysis of Microarray Data. BMC Cancer (2003) 3:31. doi: 10.1186/1471-2407-3-31
25. Chandrashekar DS, Bashel B, Balasubramanya SAH, Creighton CJ, Ponce-Rodriguez I, Chakravarthi BVSK, et al. UALCAN: A Portal for Facilitating Tumor Subgroup Gene Expression and Survival Analyses. Neoplasia (2017) 19:649–58. doi: 10.1016/j.neo.2017.05.002
26. Tang Z, Li C, Kang B, Gao G, Li C, Zhang Z. GEPIA: A Web Server for Cancer and Normal Gene Expression Profiling and Interactive Analyses. Nucleic Acids Res (2017) 45:W98–102. doi: 10.1093/nar/gkx247
27. Ruan H, Yang H, Wei H, Xiao W, Lou N, Qiu B, et al. Overexpression of SOX4 Promotes Cell Migration and Invasion of Renal Cell Carcinoma by Inducing Epithelial-Mesenchymal Transition. Int J Oncol (2017) 51:336–46. doi: 10.3892/ijo.2017.4010
28. Cutz JC, Guan J, Bayani J, Yoshimoto M, Xue H, Sutcliffe M, et al. Establishment in Severe Combined Immunodeficiency Mice of Subrenal Capsule Xenografts and Transplantable Tumor Lines From a Variety of Primary Human Lung Cancers: Potential Models for Studying Tumor Progression-Related Changes. Clin Cancer Res (2006) 12:4043–54. doi: 10.1158/1078-0432.CCR-06-0252
29. Siegel RL, Miller KD, Jemal A. Cancer Statistics, 2018. CA Cancer J Clin (2018) 68:7–30. doi: 10.3322/caac.21442
30. Cheng N, Liang Y, Du X, Ye RD. Serum Amyloid A Promotes LPS Clearance and Suppresses LPS-induced Inflammation and Tissue Injury. EMBO Rep (2018) 19. doi: 10.15252/embr.201745517
31. Lin CY, Yang ST, Shen SC, Hsieh Y-C, Hsu F-T, Chen C-Y, et al. Serum Amyloid A1 in Combination With Integrin alphaVbeta3 Increases Glioblastoma Cells Mobility and Progression. Mol Oncol (2018) 12:756–71. doi: 10.1002/1878-0261.12196
32. Hansen MT, Forst B, Cremers N, Quagliata L, Ambartsumian N, Grum-Schwensen B, et al. A Link Between Inflammation and Metastasis: Serum Amyloid A1 and A3 Induce Metastasis, and are Targets of Metastasis-Inducing S100A4. Oncogene (2015) 34:424–35. doi: 10.1038/onc.2013.568
33. Vermaat JS, van der Tweel I, Mehra N, Sleijfer S, Haanen JB, Roodhart JM, et al. Two-Protein Signature of Novel Serological Markers apolipoprotein-A2 and Serum Amyloid Alpha Predicts Prognosis in Patients With Metastatic Renal Cell Cancer and Improves the Currently Used Prognostic Survival Models. Ann Oncol (2010) 21:1472–81. doi: 10.1093/annonc/mdp559
Keywords: SAA1, diagnosis, prognosis, biomarker, renal cancer
Citation: Li S, Cheng Y, Cheng G, Xu T, Ye Y, Miu Q, Cao Q, Yang X, Ruan H and Zhang X (2021) High SAA1 Expression Predicts Advanced Tumors in Renal Cancer. Front. Oncol. 11:649761. doi: 10.3389/fonc.2021.649761
Received: 05 January 2021; Accepted: 14 April 2021;
Published: 18 May 2021.
Edited by:
Meng Zhang, First Affiliated Hospital of Anhui Medical University, ChinaCopyright © 2021 Li, Cheng, Cheng, Xu, Ye, Miu, Cao, Yang, Ruan and Zhang. This is an open-access article distributed under the terms of the Creative Commons Attribution License (CC BY). The use, distribution or reproduction in other forums is permitted, provided the original author(s) and the copyright owner(s) are credited and that the original publication in this journal is cited, in accordance with accepted academic practice. No use, distribution or reproduction is permitted which does not comply with these terms.
*Correspondence: Hailong Ruan, aGxydWFuMjAxOEBodXN0LmVkdS5jbg==
Xiaoping Zhang, eHpoYW5nQGh1c3QuZWR1LmNu
Disclaimer: All claims expressed in this article are solely those of the authors and do not necessarily represent those of their affiliated organizations, or those of the publisher, the editors and the reviewers. Any product that may be evaluated in this article or claim that may be made by its manufacturer is not guaranteed or endorsed by the publisher.
Research integrity at Frontiers
Learn more about the work of our research integrity team to safeguard the quality of each article we publish.