Corrigendum: Value of Pyruvate Carboxylase in Thyroid Fine-Needle Aspiration Wash-Out Fluid for Predicting Papillary Thyroid Cancer Lymph Node Metastasis
 Chang Liu
 Lu Zhang2†
 Yang Liu
- 1Department of Nuclear Medicine, Ruijin Hospital, Shanghai Jiao Tong University School of Medicine, Shanghai, China
- 2Department of Ultrasound, Ruijin Hospital, Shanghai Jiao Tong University School of Medicine, Shanghai, China
The incidence of papillary thyroid carcinoma (PTC) is increasing. Lymph node metastatic status of PTC is a major factor for decision marking of surgery and surgical extend, however, no reliable tool exists for prediction of PTC nodal metastasis, for example, ultrasound cannot qualitatively diagnose and effectively detect central lymph node metastasis (CLNM). Therefore, the development of a new diagnostic biomarker is crucial for CLNM. Metabolic dysregulation is an important factor associated with malignancy and metastasis of tumors. Pyruvate carboxylase (PC) is a major anaplerotic enzyme that catalyzes the carboxylation of pyruvate to form oxaloacetate, which has been suggested to be involved in the tumorigenesis of several cancers, including PTC. This study aimed to explore the role of PC expression in thyroid fine-needle aspiration (FNA) wash-out fluid for predicting CLNM in PTC, and to explore how PC is involved in PTC development. The expression levels of PC in PTC tissues and normal thyroid tissues were first compared based on bioinformatics analysis of public databases, including the Gene Expression Profiling (GEPIA), Oncomine and Gene Expression Omnibus (GEO) databases. Then, the PC mRNA and protein expression levels were measured by RT-PCR and Immunohistochemistry (IHC) in surgical tissues from a total of 42 patients with surgically confirmed PTC, and compared in patients with and without CLNM. Further, to assess PC expression in diagnostic biopsies, a total of 71 thyroid nodule patients with ultrasound-guided FNA wash-out fluid samples and cytological diagnosis were prospectively enrolled in the study. Then, we analyzed the mechanism of PC-mediated PTC progression in vitro. This study showed that PC expression was higher in PTC tissues and thyroid FNA wash-out fluid samples from patients with CLNM than those from patients without CLNM, and that PC-induced PTC metastasis may occur through the TGF-β/Smad-regulated epithelial–mesenchymal transition (EMT) pathway.
Introduction
Thyroid carcinoma is the most common endocrine tumor in the world, and its worldwide incidence has significantly increased recently (1, 2). Nearly 90% of thyroid cancers (THCAs), including papillary thyroid carcinoma (PTC) and follicular thyroid carcinoma (FTC), are well differentiated (3). PTC is the most common subtype, accounting for 80–85% of all malignant thyroid tumors (2). PTCs exhibit indolent biological behavior (4), and the 5-year survival rate reaches almost 95% after treatment (5), including surgery and radioactive iodine therapy. There is a debate about whether or not PTC, especially papillary thyroid microcarcinoma (PTMC), is overdiagnosed and overtreated. Ito et al. (6) reported that only a small portion of PTMCs showed progression and suggested that subclinical low-risk PTMC should be surveilled instead of treated by immediate surgery. On the other hand, some PTMCs show nodular enlargement and early lymph node metastasis during the surveillance period (7). Thus, it is critical to develop a tool to identify patients with early nodal metastasis to guide clinical management.
Cancer cell proliferation requires energy, which is dependent on cellular metabolism (8). In proliferating cancer cells, the replenishment of intermediates for the tricarboxylic acid (TCA) cycle provides biosynthetic precursors for the synthesis of proteins, nucleic acids and lipids (9, 10). The pyruvate carboxylase (PC)-mediated anaplerosis pathway for TCA intermediates is implicated in the progression of a variety of cancers. For example, compared with that in non-small-cell lung cancer (NSCLC) without metastasis, the expression of PC is increased in NSCLC with metastasis (11, 12). In the early stages of NSCLC, PC knockdown can significantly increase TCA activity and inhibit biosynthesis (12). It has also been reported that, compared to that in primary tumors, PC-catalyzed generation of oxaloacetate occurs at a higher rate in breast cancer with lung metastasis (13–15). Chen et al. (16)found that a small molecule ZY444, which binds to PC, can significantly inhibit breast cancer growth and metastasis in vitro and in vivo. In particular, Strickaert et al. reported that PC-mediated replenishment of the TCA cycle plays a leading role in PTC and knockdown PC influence thyroid cancer cells progression abilities (17). However, it is unknown how PC affects the clinical manifestations of THCA and what is the underlying mechanism.
At present, the main clinical diagnostic methods of PTC are ultrasonography and fine-needle aspiration biopsy (FNAB) (18). However, given the inherent limitations of current diagnostic methods, it is difficult to identify central lymph node metastasis (CLNM) located in the neck, particularly the areas surrounded by the hyoid bone and the sternal notch (19), the initial sites of lymph node metastasis (20). With the development of basic medical research, molecular genetic alterations have been increasingly studied, and many tumor biomarkers have been found, improving the accuracy of PTC risk categories (4). The most widely studied and clinically used PTC tumor markers are BRAF and TERT promoter mutations (21). Although the incidences of the two mutations are 83.7 and 7.5–27%, respectively (22, 23), neither has been shown significant prognostic value for predicting the high-risk clinicopathological features of PTC (24). Therefore, it is important to explore other tumor markers that could potentially predict the aggressive biological behavior of PTC, including nodal metastasis. The study aimed to test the hypothesis that PC expression in the thyroid nodule FNA wash-out fluid can potentially predict thyroid cancer regional nodal metastasis as diagnosed after surgery, and further to explore the underlying mechanism.
Materials and Methods
Gene Expression Data Acquisition and Bioinformatics Analysis
Gene Expression Profiling Interactive Analysis (GEPIA)-(http://gepia.cancer-pku.cn/) (25) is an online server for the profiling and interactive analyses of gene expression in cancer and normal samples. Oncomine (https://www.oncomine.org/) (26, 27) is an online cancer microarray database and integrated data-mining platform. We searched PC in the two databases to analyze PC expression in THCA and other types of cancer. In addition, we used expression profiling arrays (GSE60542) from Gene Expression Omnibus databases to analyze the differentially expressed genes between THCA tissues from patients with or without lymph metastasis. The GSE60542 dataset was analyzed by the Affymetrix Human Genome Array with the annotation platform GPL570 [HG-U133_plus_2]. The GSE60542 dataset contained 14 PTC samples from patients with no lymph node metastasis, 19 samples from patients with lymph node invasion and 10 control samples from patients with normal thyroids. Using R packages, we assessed the raw GSE60542 dataset by background correction, normalization, expression calculation, and probe integration. Robust multiarray averages (RMAs) and mismatch probes (PMs) were created for processing the datasets. P-values were adjusted by the Benjamini–Hochberg method, and fold changes (FC) were calculated using the false discovery rate (FDR) procedure. Differentially expressed genes (DEGs) with a |log2-fold change| >1 and P <0.05 in PTC samples versus normal samples were selected. The basic features from the Gene Expression Omnibus (GEO) database are shown in Table 1.
TABLE 1
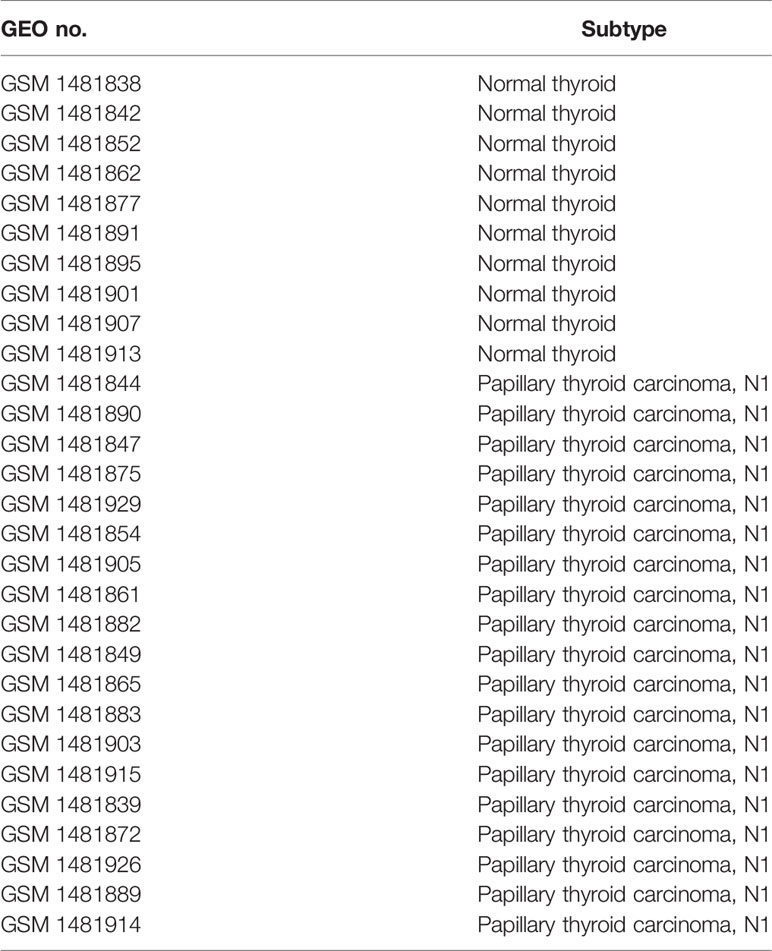
Table 1 Basic features of the GSE 60542 database.
Patient Populations With Surgically Confirmed PTC
The study enrolled 42 patients with surgically confirmed PTC and available surgical tissues from July to November 2018. The clinical characteristics of the patients are shown in Table 2.
TABLE 2
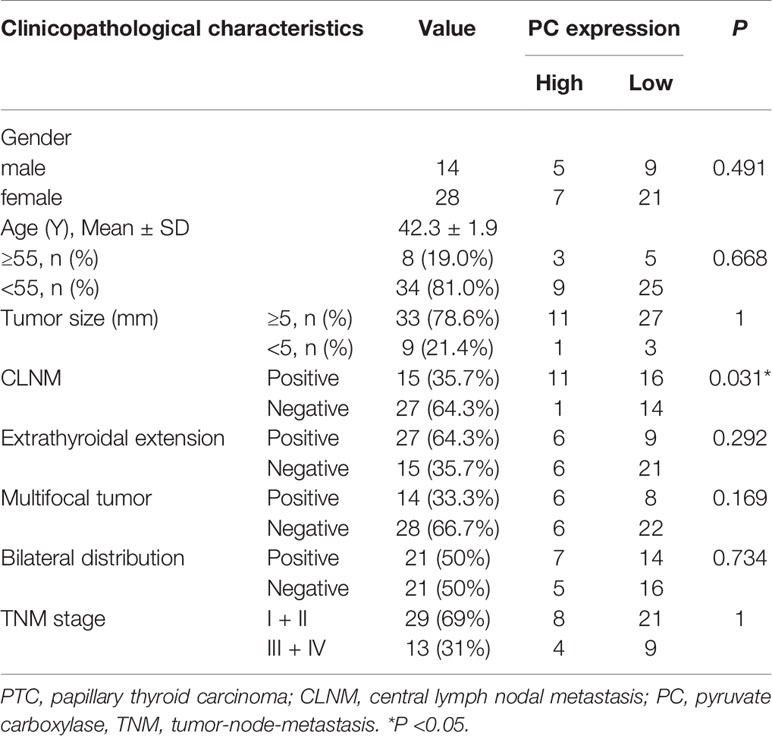
Table 2 Clinicopathological characteristics of 42 surgically confirmed PTC patients.
Patient Populations With Thyroid Nodules
A total of 71 patients with thyroid nodules and FNA wash-out fluid samples from November 2019 to January 2020 were also included. Fifty-two of the 71 patients were diagnosed with PTC, and 19 had benign nodules based on cytological findings. Thirty-four of the 52 cytologically diagnosed PTC patients underwent total thyroidectomy and central nodal dissection with final tissue sample confirmation. The clinical characteristics of the patients are shown in Table 3.
TABLE 3
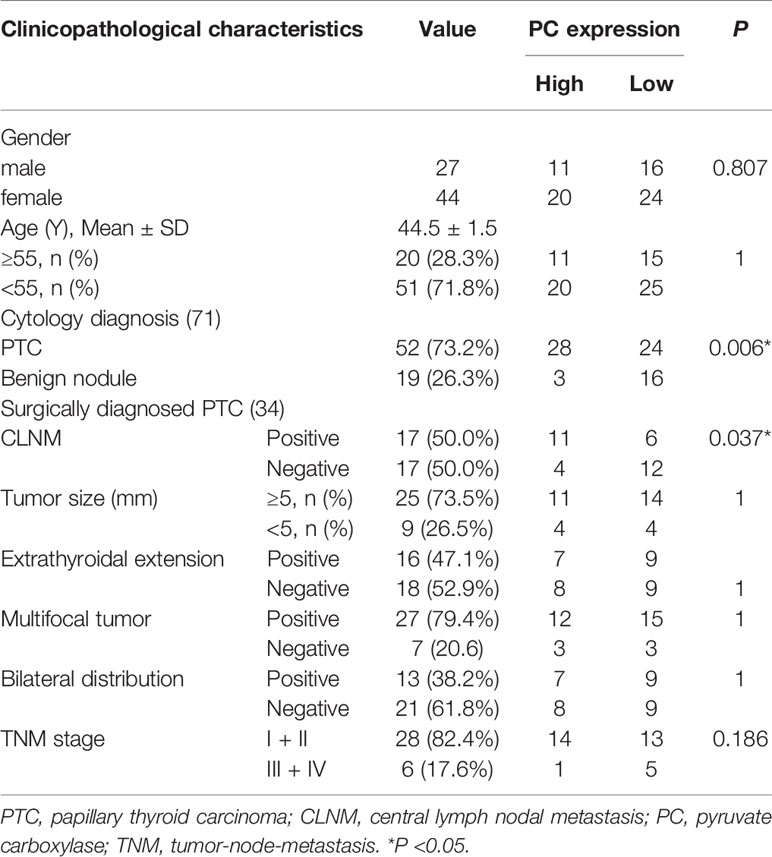
Table 3 Clinicopathological characteristics of 71 thyroid nodule patients.
Sample Preparation
Surgical PTC tissues were divided into two parts: one part was fixed in 4% paraformaldehyde, and the other part was preserved in RNA protector and frozen at −80°C. For ultrasound-guided FNA, three passes were performed for each thyroid nodule, and direct smears were prepared from each pass for hematoxylin and eosin (HE) staining after air drying. Thyroid FNA wash-out fluid with RNA protector was collected from needles. According to the 8th Edition of the American Joint Committee on Cancer (AJCC) TNM staging Systems for thyroid cancer, we divided all surgical PTC patients into early stage I or II, and later stage III or IV.
Quantitative Real-Time Reverse Transcription PCR
RNA was extracted from PTC tissues using TRIzol (Sangon Biotech, Shanghai, China). RNA of the thyroid nodule FNA wash-out fluid samples was extracted following the RNA kit protocol (Qiagen Hilden, Germany). Total RNA was first reverse-transcribed into cDNA using PrimeScript™ RT Master Mix (TaKaRa Bio Inc., Japan) (37°C for 15 min, 85°C for 5 s, and cooled to 4°C). RT-PCR of PC and the reference gene β-actin was performed following the protocol for TB Green® Premix Ex Taq™ II (TaKaRa Bio Inc., Japan) in an Applied Biosystems 7500 Real-Time PCR System. The temperature cycling protocol consisted of 30 sec denaturation at 95°C, followed by 40 cycles of 95°C for 5 s and 60°C for 34 s. The 40 cycles were followed by 95°C for 15 s, 60°C for 1 min, and 95°C for 15 s. The PC primers used in this study were 5’-ATGTTGCCCACAACTTCAGCAAGC-3’ (forward primer) and 5’-AGTTGAGGGAGTCAAACACACGGA-3’ (reverse primer). The TGF-βR1 primers used in this study were 5’-GTGACAGATGGGCTCTGCTT-3’ (forward primer) and 5’-AGGGCCAGTAGTTGGAAGTT-3’ (reverse primer). The β-actin primers were 5’-GCACCACACCTTCTACAATG-3’ (forward primer) and 5’-TGCTTGCTGATCCACATCTG-3’ (reverse primer). The PC mRNA expression level was normalized to that of β-actin. Cycle threshold (Ct) values below 35 were used in this study. The 2−Δ Ct of PC mRNA–β-actin mRNA was used to evaluate the expression levels of PC.
Immunohistochemistry (IHC)
Forty-two PTC tissues were soaked in 4% paraformaldehyde, embedded in paraffin, and cut into 4 μm thick slices. The staining intensity was evaluated by two pathologists who did not know the patient’s condition. Assess the percentage of positive cells by score: <10%, 0; 10–25%, 1; 26–50%, 2; 51–75%, 3; and 75%, 4. Assess the intensity of positive cells by score: 0 (negative), 1 (weak), 2 (moderate), 3 (moderately strong), or 4 (strong). The percentage of positive cells multiplied by the intensity score is the final score: <2, (−); ≥2–<7, (+); ≥7–<12, (++); ≥12 (+++).
Cell Culture and Transfections
The human PTC cell line TPC1 was cultured in RPMI-1640 medium (Gibco, Thermo Scientific, MA, USA) containing 10% fetal bovine serum (FBS) (Gibco, Thermo Scientific, MA, USA) and 1 penicillin in 37°C and 5% CO2 culture. A lentiviral vector containing PC short hairpin RNA (shRNA), TGF-βR1 cDNA and its negative control was purchased from Hanbio (Shanghai, China) and transfected into TPC1 cells. Stable lentivirus-infected TPC1 cells were cultured in complete medium and screened with 1 µg/ml puromycin.
Western Blotting
The cells were lysed with RIPA buffer (Epizyme, Shanghai, China) for 30 min on ice. The protein concentration was measured using a BCA protein assay kit (Epizyme, Shanghai, China). The protein was loaded onto a 4–20% SDS-PAGE gradient gel (Tanon, Shanghai, China) and then transferred to a polyvinylidene fluoride (PVDF) membrane (Millipore, Michigan, USA). After blocking, the membrane was incubated with the primary antibody overnight at 4°C and then washed three times with 1 × TBST (Tris buffered saline and Tween 20), and then the secondary antibody was incubated for 1 h. Finally, the membrane was rinsed with 1 × TBST three times and detected by an enhanced chemiluminescence kit (Tanon, Shanghai, China). The antibodies used were PC (Santa Cruz Biotechnology, TX, USA), Snail1 (Affinity Biosciences, OH, USA), ZEB1 (Affinity Biosciences, OH, USA), phospho-Smad2/3 (Cell Signaling Technology, MA, USA), Smad2/3 (Cell Signaling Technology, MA, USA), TGF-βR1 (Affinity Biosciences, OH, USA), E-cadherin (Affinity Biosciences, OH, USA), Vimentin (Affinity Biosciences, OH, USA), and GAPDH (BBI Solutions, Shanghai, China).
Cell Counting Kit (CCK-8) Assay
The cells were cultured on a 96-well plate at a density of 1 × 10⁴ cells/well. Twenty-four hours later, 10 μl of CCK8 reagent was added to each well and incubated for 4 h at 37°C with 5% CO2. Then, a microplate reader was used to read the absorbance at 450 nm.
Wound Healing
Wound healing was used to determine the migration ability of cells. Cells were seeded in a six-well plate at a density of 1 × 10⁶/ml and cultured at 37°C with 5% CO2 to a cell density of 100%. A 200 μl pipette tip was used to make a straight line and incubated for 48 h. The width of the scratch was observed under a microscope (Carl Zeiss, Germany).
Transwell Assay
A total of 3 × 10⁵ cells were suspended in 500 μl serum-free medium and added to the upper chamber of a Transwell plate (Costar, USA). Then, 750 μl of 20% FBS-containing medium was added to the lower chamber. The culture was continued for 48 h, and the cells were fixed with 4% paraformaldehyde and stained with 0.1% crystal violet. The invaded cells were counted with a microscope (Carl Zeiss, Germany).
Statistical Analyses
Unless otherwise indicated, the data are expressed as the median [interquartile range]. The mRNA expression levels of PC in patients with cytologically diagnosed PTC were compared to those in patients with benign nodules using the Mann–Whitney U test. The chi-square test analyses for the association between clinicopathologic factors and PC expression level of surgically diagnosed PTC patients. The binary logistic regression test was used for multivariate analysis. Unpaired t tests were used for comparisons between two groups. All statistical analyses were conducted using SPSS 22.0. For all analyses, P <0.05 was considered statistically significant.
Results
Online Dataset Analysis of PC Expression in THCA
PC mRNA expression in the GEPIA datasets differed in different types of tumors (Figures 1A, B) but was significantly overexpressed in THCA (Figures 1C, D). In addition, the expression of PC was also significantly higher in PTC than in normal tissues in two separate public datasets in Oncomine. In Vasko’s dataset, PC was overexpressed in THCA samples versus normal samples with a fold change of 2.516 (Figure 2A). In He’s dataset, PC was also highly expressed with a fold change of 2.061 (Figure 2B). According to GSE60542, the PC expression level was significantly higher in PTC samples from patients with or without lymph metastasis tissues than in normal thyroid tissues, and the fold changes were 1.10 and 1.22, respectively (Figure 2C).
FIGURE 1
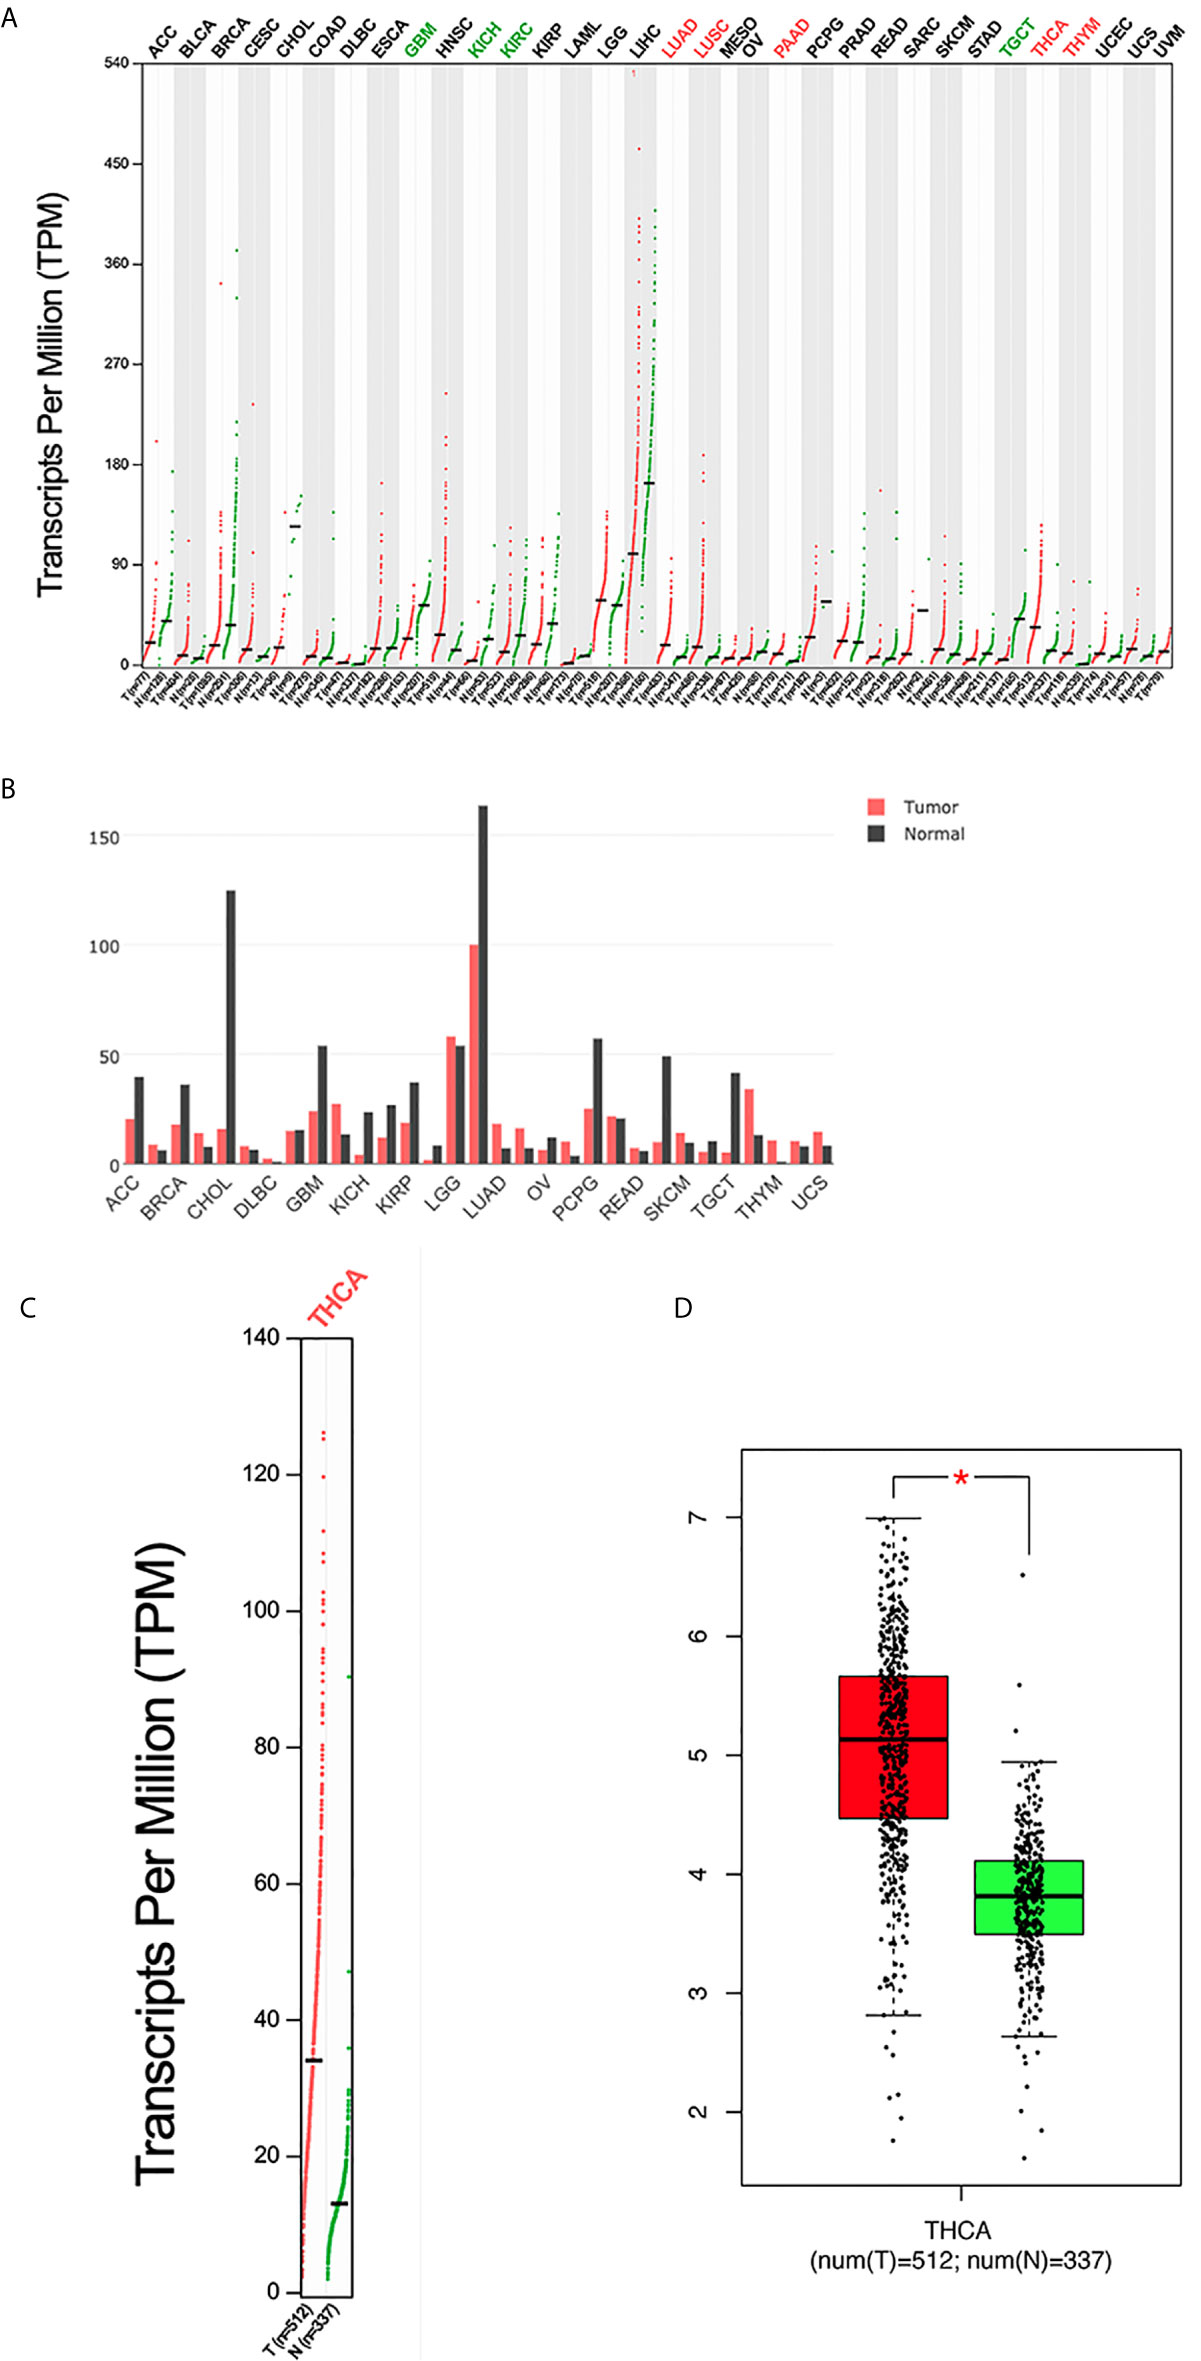
Figure 1 The expression profile of PC according to the GEPIA database. (A) The expression of PC in all tumor samples and paired normal tissues (dot plot). Each dot represents the expression of a sample. (B) The expression of PC in all tumor samples and paired normal tissues (bar plot). The height of bar represents the median expression of certain tumor type or normal tissue. (C) The expression of PC in THCA (dot plot); |log2FC| = 1 and P <0.01. (D) The expression of PC in THCA (box plot); |log2FC| = 1 and *P < 0.01. GEPIA, Gene Expression Profiling Interactive Analysis; T, tumor; N, normal; ACC, adrenocortical carcinoma; BLCA, bladder urothelial carcinoma; BRCA, breast invasive carcinoma; CESC, cervical squamous cell carcinoma and endocervical adenocarcinoma; CHOL, cholangiocarcinoma; COAD, colon adenocarcinoma; DLBC, lymphoid neoplasm diffuse large B-cell lymphoma; ESCA, esophageal carcinoma; GBM, glioblastoma multiforme; HNSC, head and neck squamous cell carcinoma; KICH, kidney chromophobe; KIRC, kidney renal clear cell carcinoma; KIRP, kidney renal papillary cell carcinoma; LAML, acute myeloid leukemia; LGG, brain lower grade glioma; LIHC, liver hepatocellular carcinoma; LUAD, lung adenocarcinoma; LUSC, lung squamous cell carcinoma; MESO, mesothelioma; OV, ovarian serous cystadenocarcinoma; PAAD, pancreatic adenocarcinoma; PCPG, pheochromocytoma and paraganglioma; PRAD, prostate adenocarcinoma; READ, rectum adenocarcinoma; SARC, sarcoma; SKCM, skin cutaneous melanoma; STAD, stomach adenocarcinoma; TGCT, testicular germ cell tumor; THCA, thyroid carcinoma; THYM, thymoma; UCEC, uterine corpus endometrial carcinoma; UCS, uterine carcinosarcoma; UVM, uveal melanoma.
FIGURE 2
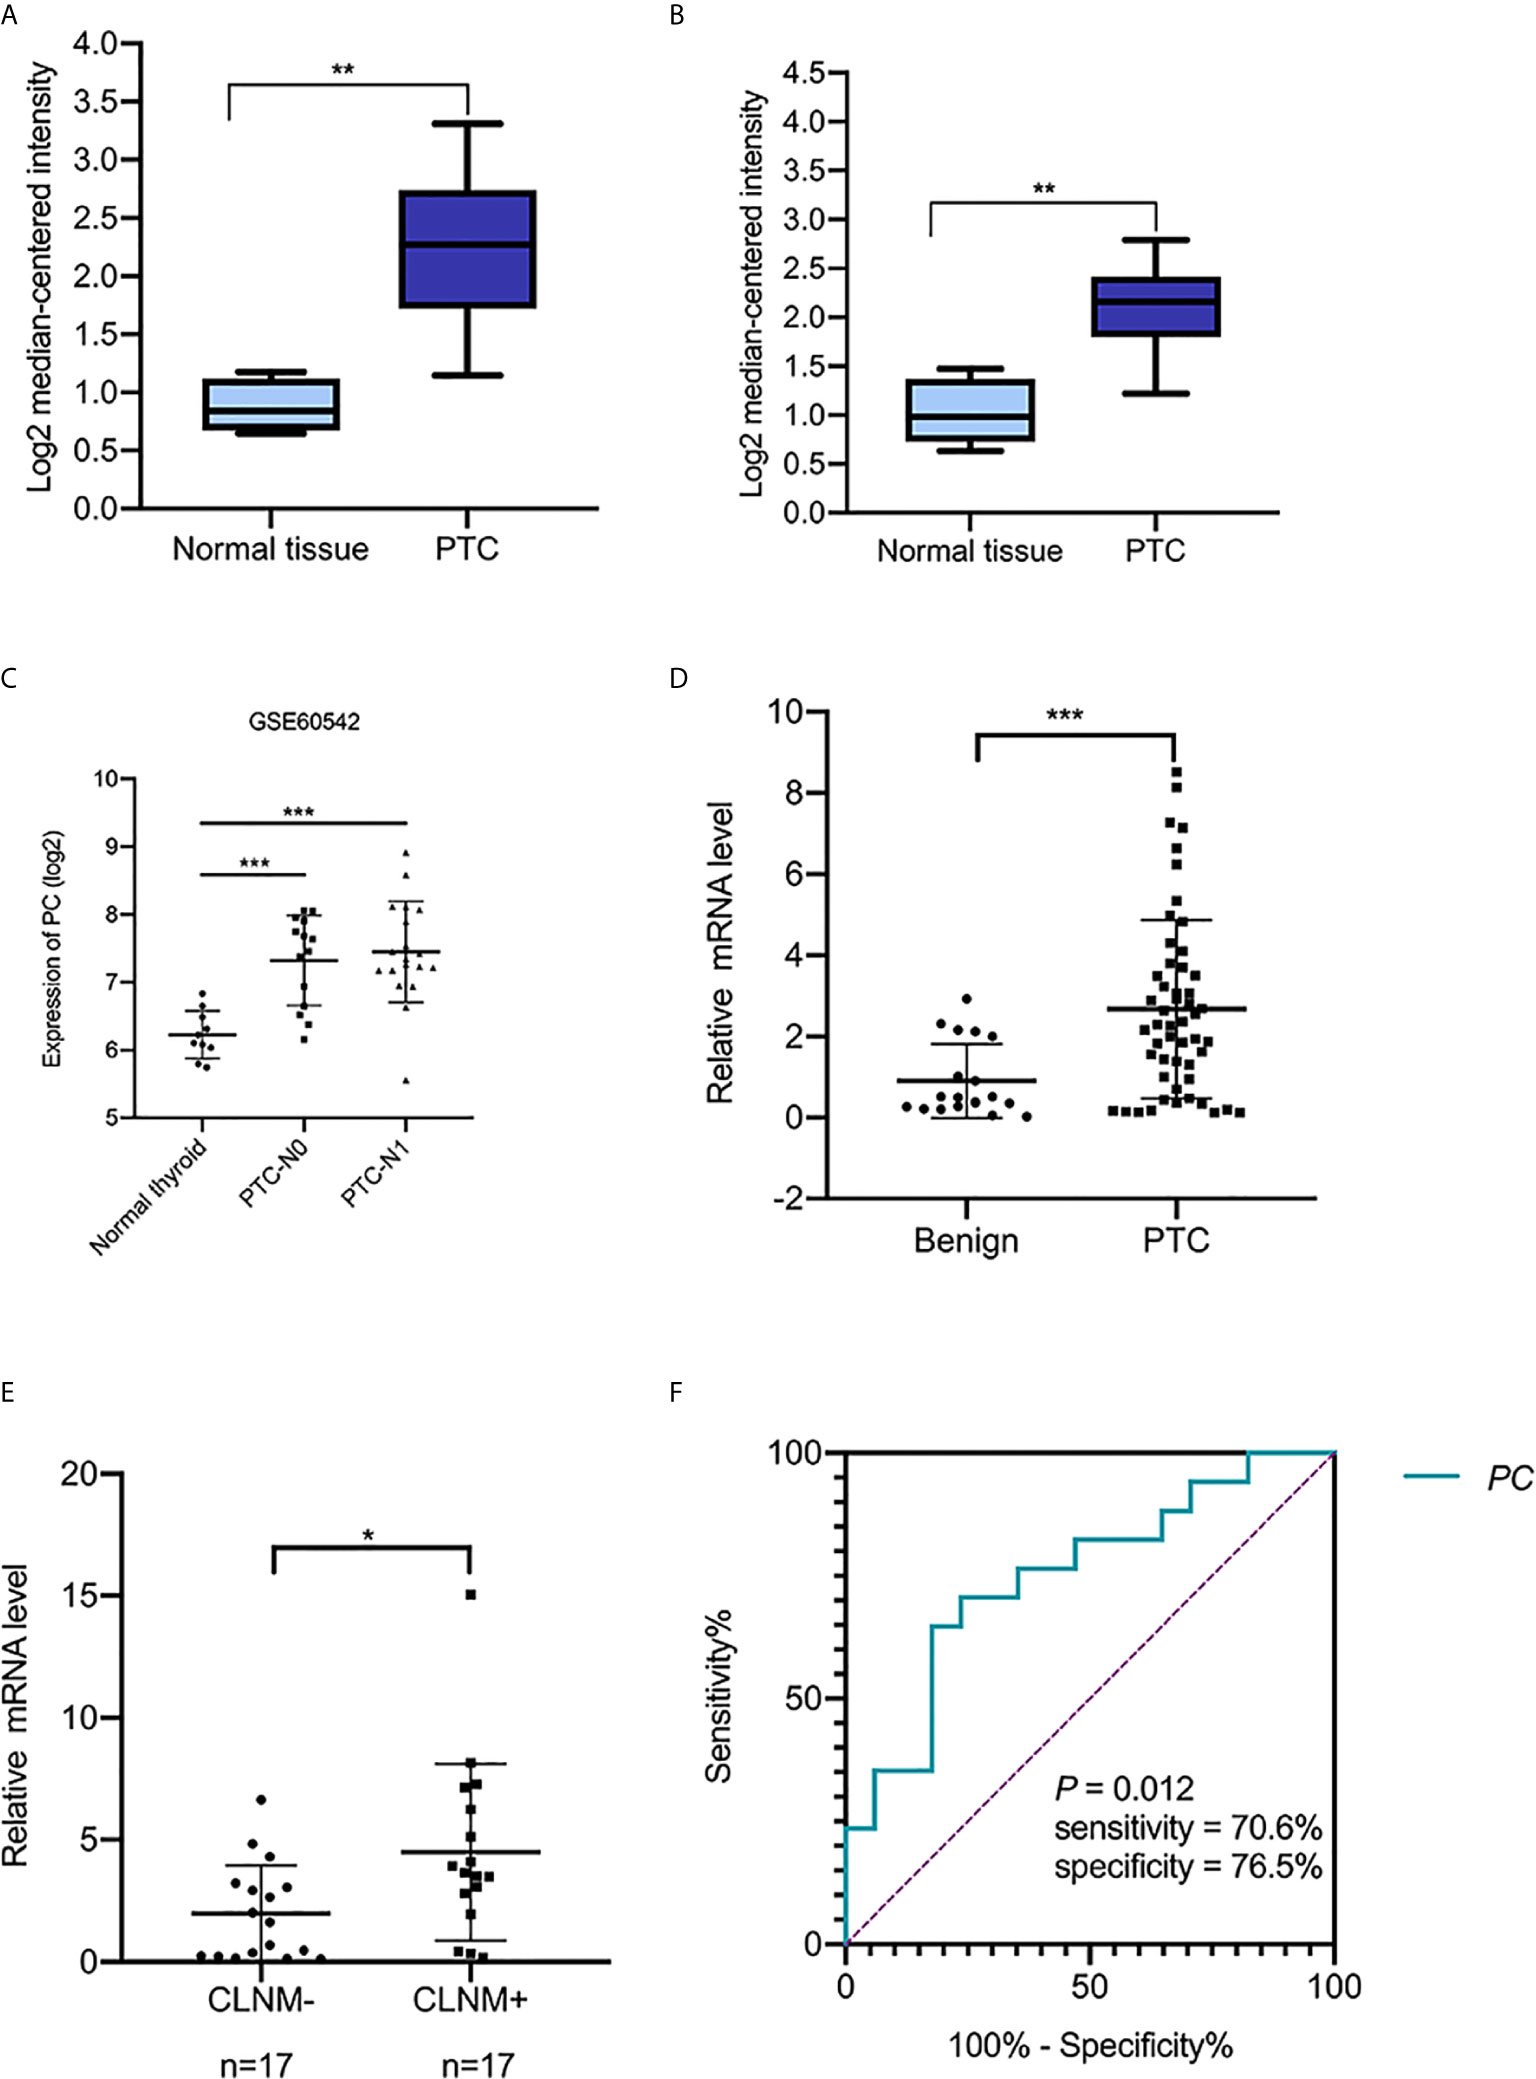
Figure 2 The transcript levels of PC in the Oncomine and GEO datasets and RT-PCR analysis of PC mRNA expression levels in thyroid FNA wash-out fluid. (A) PC level in the THCA dataset (Vasko’s dataset), (**P <0.01). (B) PC levels in the THCA dataset (He’s dataset), (**P <0.01). (C) PC levels in THCA dataset (GSE60542). ***P <0.001 (D) The expression of PC in 52 PTC FNA wash-out fluid samples and 19 benign nodule FNA wash-out fluid samples based on cytological diagnosis was examined using RT-PCR assays. **P <0.01. (E) Expression of PC in 34 surgically diagnosed PTCs from patients with or without CLNM. *P <0.05. (F) AUC for identifying PTC with CLNM using the PC mRNA expression level. The AUC was 0.751 (P = 0.012; 95% CI, 0.585–0.917). AUC, area under the receiver operating characteristic curve; PC, pyruvate carboxylase; PTC, papillary thyroid carcinoma; PTC-N0, papillary thyroid carcinoma without lymph metastasis; PTC-N1, papillary thyroid carcinoma with lymph metastasis; CLNM, central lymph node metastasis; CI, confidence interval.
The Difference of PC mRNA Expression in PTC Tumor Tissues From Patients With or Without CLNM
To confirm the PC mRNA overexpression in THCA with lymph metastasis, as observed in the above online datasets, we measured the PC mRNA levels in surgical tissues of 42 surgically diagnosed PTC patients to further assess the relationship between PC and CLNM. There were 15 PTC patients without CLNM and 27 patients with CLNM. PC mRNA expression was higher in CLNM-positive patients than in CLNM-negative patients [6.490 (2.351–10.002) vs. 2.430 (1.466–4.976); P = 0.014]. Based on the median value of PC mRNA expression, the samples were divided into PC high level group and low level group. Chi-square test showed that high level group of PC had more CLNM (P = 0.031). Further analysis showed there is no difference between PC level and other factors, such as gender (P = 0.491), age (P = 0.668), extrathyroidal extension (P = 0.292), multifocal (P = 0.169), bilateral distribution (P = 0.734), and TNM staging (P = 1) (Table 2).
PC Expression and Patient Age Were Independent Predictors of PTC With CLNM After FNA
The abovementioned factors were measured in surgical tissues. To investigate the nodal metastasis predictive role of PC from the preoperative diagnostic ultrasound-guided FNA fluids, PC expression levels were measured in 71 thyroid nodule FNA wash-out fluid samples. The 71 patients were divided into two groups according to their cytological diagnosis: 52 had PTC, and 19 had benign thyroid diseases. A Mann–Whitney U test showed that PC expression levels were significantly higher in those with PTCs than in those with benign nodules [2.456 (0.442–3.779) vs. 0.498 (0.262–2.010), P = 0.005; Figure 2D], consistent with the public dataset results described above. Additional, Chi-square test showed that high level group of PC associated with high PTC (P = 0.006). But there is no difference between PC level and gender (P = 0.807) and age (P = 1) (Table 3).
Thirty-four out of the 52 PTC patients underwent total thyroidectomy and nodal dissection with a final diagnosis of nodal metastasis status. PC expression level was found higher in the CLNM-positive group than in the CLNM-negative group [3.665 (2.378–6.691) vs. 1.621 (0.228–3.144), P = 0.013; Figure 2E]. Univariable logistic regression analysis revealed that PC expression and ages <55 were associated with CLNM (all P <0.05), but extrathyroid invasion, multiple-site invasion, bilateral invasion were not associated with CLNM. Multivariable analysis confirmed that PC and younger age were independent predictors of CLNM (Table 4).
TABLE 4
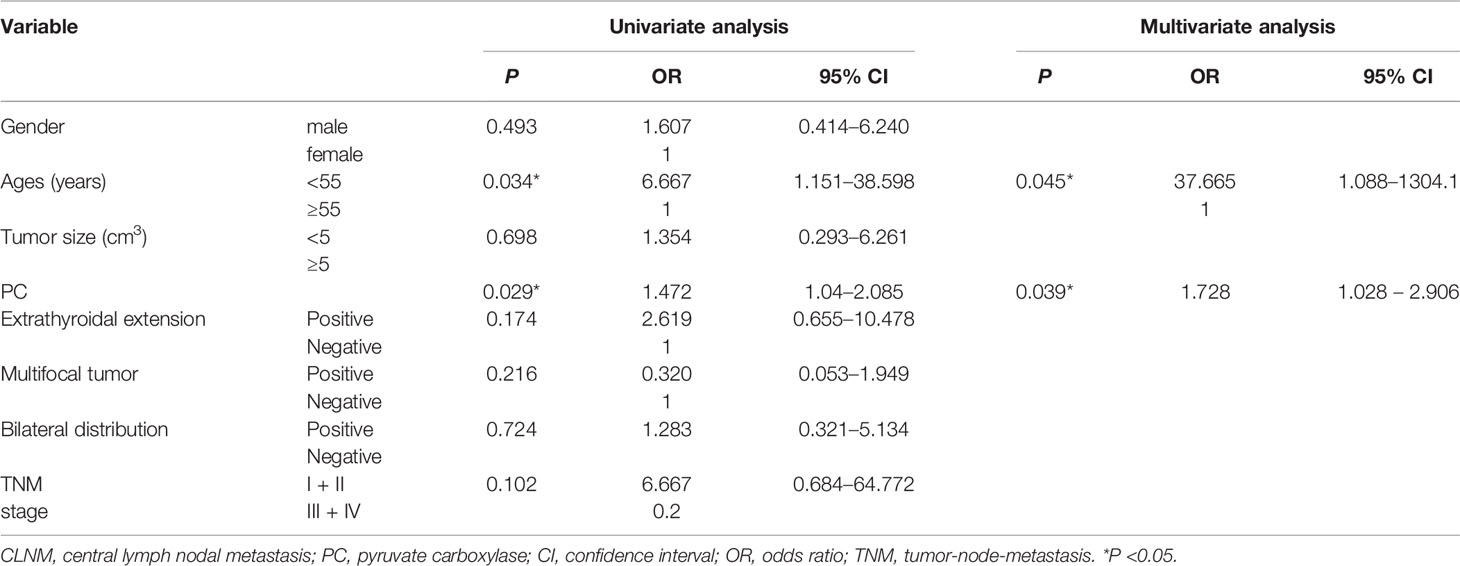
Table 4 Univariable and multivariate analyses of predictive factors for CLNM in patients with PTC after FNA.
To test the sensitivity and specificity of PC expression as a biomarker for PTC with CLNM, we applied ROC curve analysis. The area under the curve (AUC) was 0.751 (P = 0.013, Figure 2F). The sensitivity and specificity were 70.6 and 76.5%, respectively. The results suggest that PC expression is potentially a novel biomarker for CLNM of PTC.
The Difference of PC Protein Expression in PTC Tumor Tissues From Patients With or Without CLNM
The above results suggest that PC mRNA may be related to CLNM of PTC, so we further investigated the relationship between the protein expression of PC in PTC tissues from patients with or without CLNM by IHC. The PC protein expression levels were significantly higher in CLNM-positive patients than in CLNM-negative patients (P <0.0001) (Figures 3A–C): out of the 15 CLNM positive samples, eight (53%) were (+) and seven (47%) were (++), while, of the 27 CLNM negative samples, nine (33%) were (−) and 18 (67%) were (+). The increased expression of both the PC mRNA and protein in the tissues with CLNM suggests that PC may play an important role in the malignant biological behavior of PTC, but the specific mechanism is still unclear.
FIGURE 3
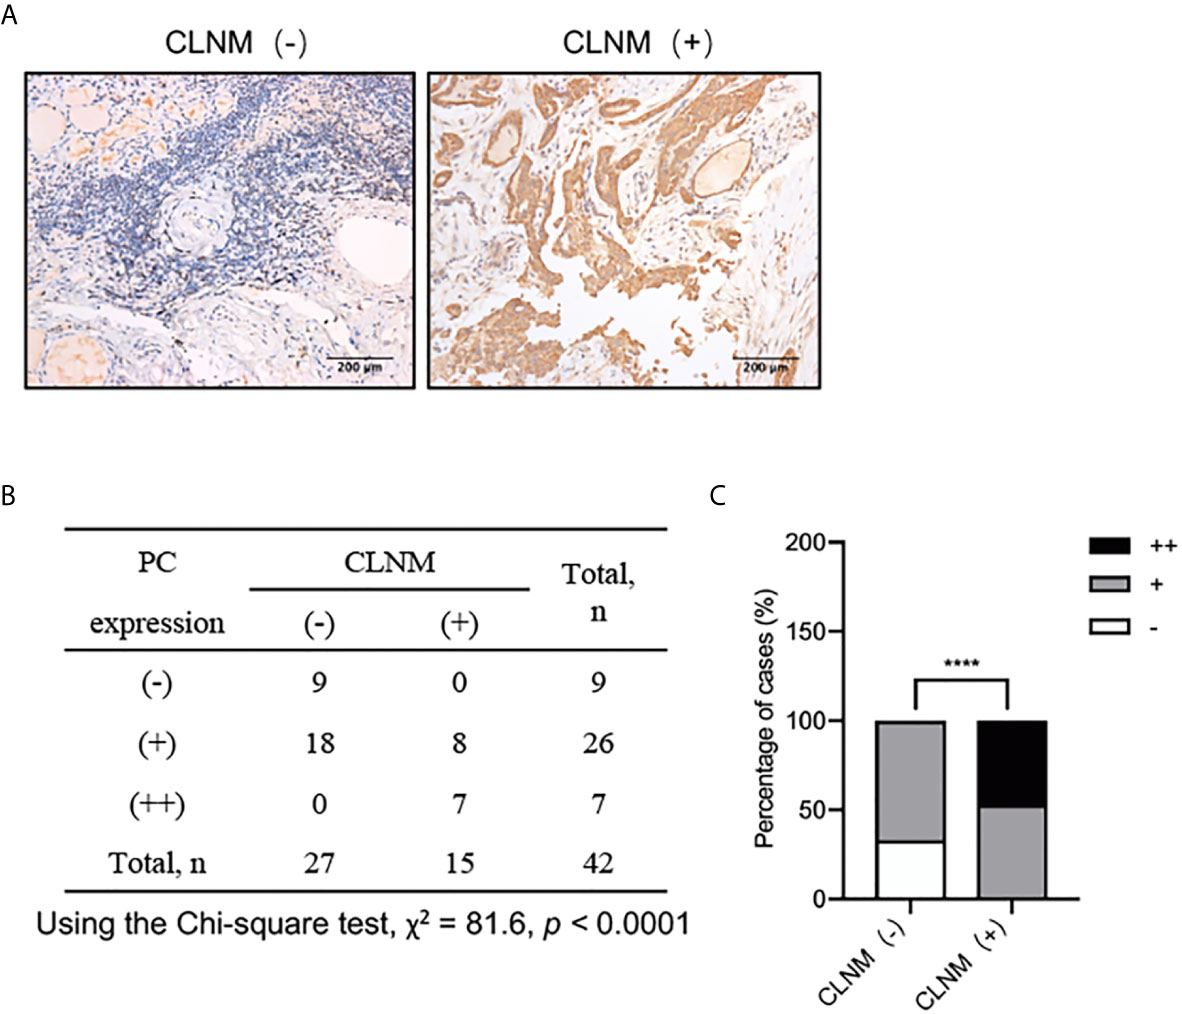
Figure 3 IHC analysis of PC protein expression levels in 42 surgically diagnosed PTCs with or without CLNM. (A) Representative IHC images of PTC samples form patients with or without CLNM. (B) Chi-square analysis of the protein expression levels of PC between PTC samples from patients with CLNM and PTC samples from patients without CLNM, as show in the histogram plot. (C) ****P <0.0001. CLNM, central lymph nodal metastasis; IHC, immunohistochemistry.
PC Promotes TPC1 Cell Migration and Invasion
To analysis the mechanism of PC in THCA cell aggressiveness, we first constructed transgenic TPC1 cells stably expressing PC knockdown lentivirus (LV-shPC) and a negative control lentivirus (LV-NC) (Figures 4A, B). CCK8, wound healing, and Transwell assays showed that the proliferation, migration, and invasion ability were significantly decreased in LV-shPC cells compared to LV-NC cells (Figures 4C–E).
FIGURE 4
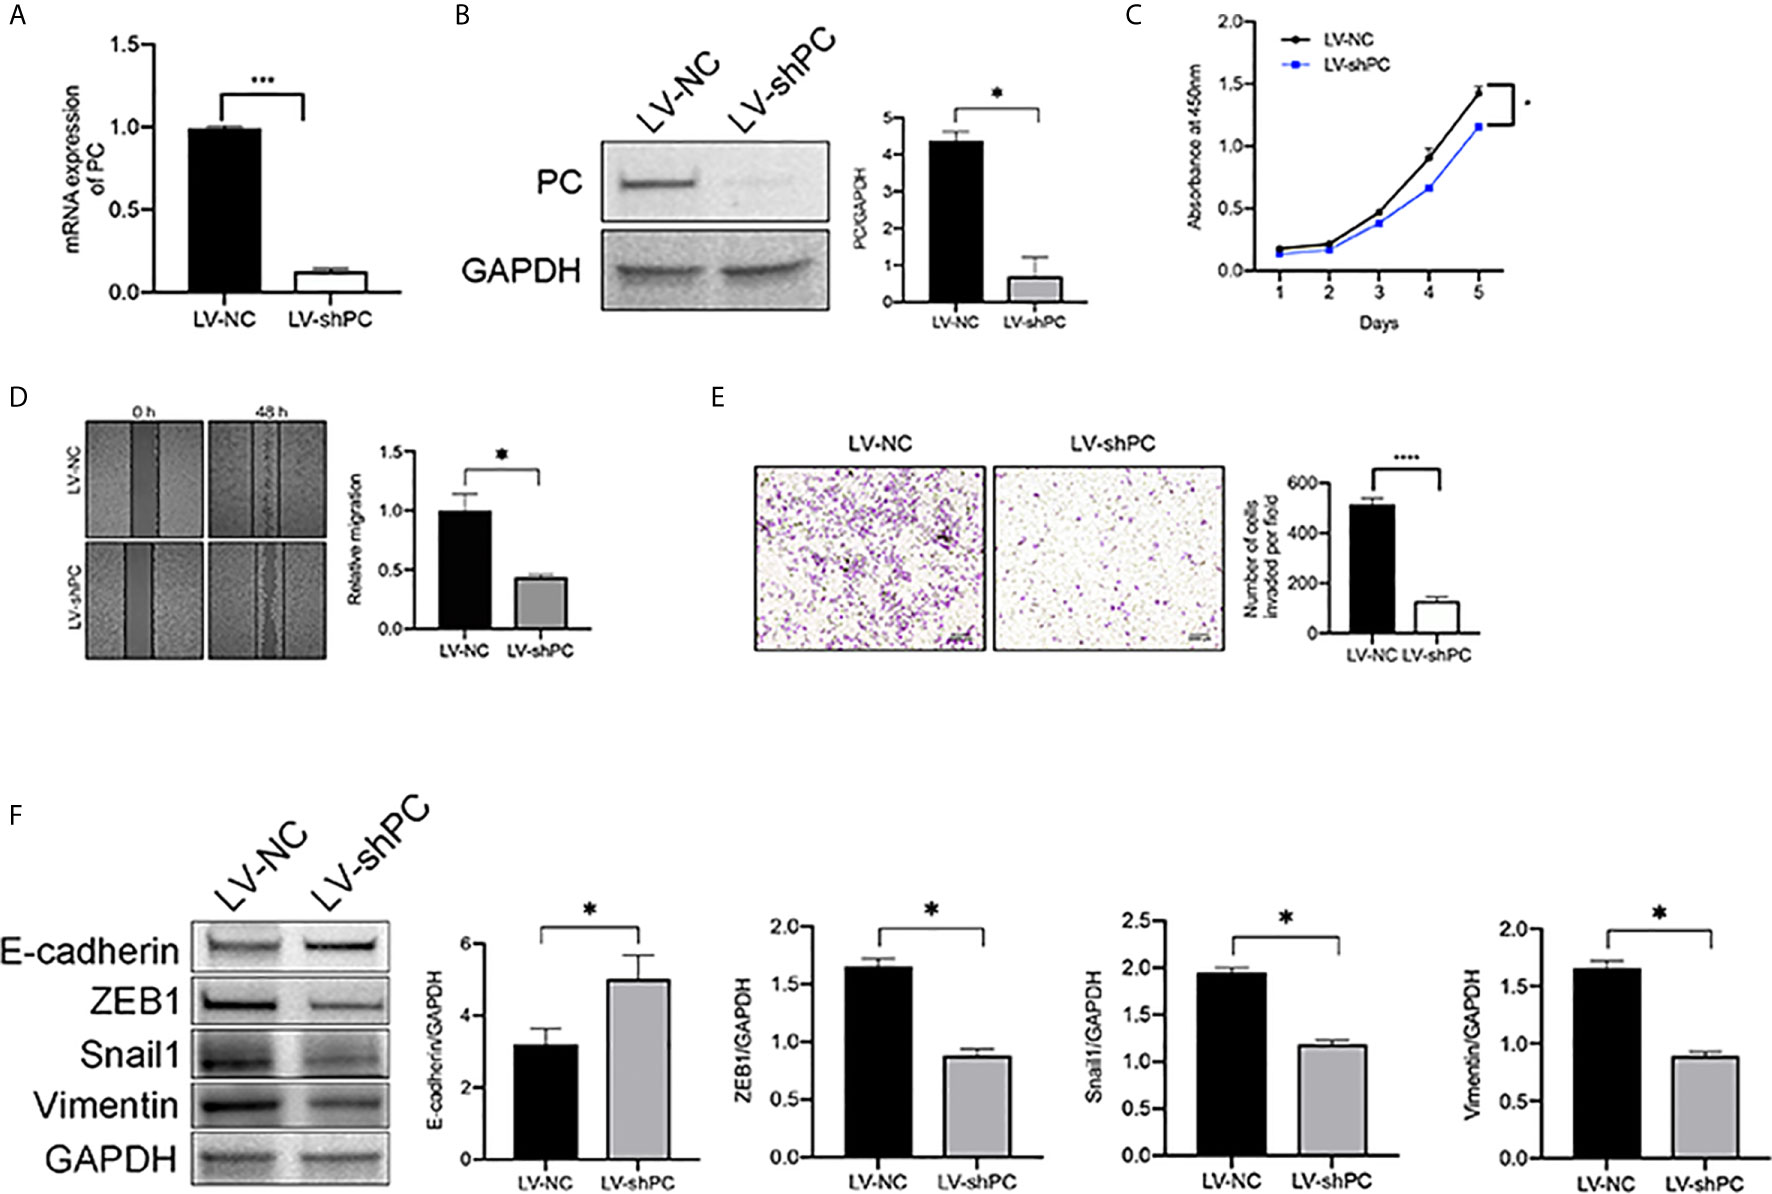
Figure 4 PC knockdown inhibit the migration and invasion of PTC cells. (A) qRT-PCR analysis of PC mRNA expression in the PTC cell line (TPC1) as indicated. ***P <0.001 (B) Western blotting was used to evaluate PC protein expression in TPC1 cells as indicated. The average quantification obtained by densitometric analysis (Image J) of the blot of PC expression. Data are expressed as mean ± SEM. *P <0.05. (C) CCK-8 assay was used to detect the proliferation of the indicated TPC1 cells. *P <0.05. (D) A wound-healing assay was applied to assess the migration ability of different TPC1 cells (LV-NC, LV-shPC). Representative images and quantification of cell counts normalized by controls are shown. *P <0.05 (E) Transwell invasion assays were applied to assess the motility of different TPC1 cells with a 4× objective lens. ****P <0.0001. The number of invaded cells is shown in histograms on the right. (F) Western blot analysis of E-cadherin, Snail1, Vimentin, and ZEB1 expression in LV-NC cells compared with LV-shPC cells. The average quantification obtained by densitometric analysis (Image J) of the blot of proteins expression. Data are expressed as mean ± SEM. *P <0.05. The full blot is provided in the Supplementary File.
PTC is a kind of tumor originating form follicular epithelial cells (28–31). Epithelial origin tumors are largely dependent on epithelial–mesenchymal transition (EMT) for metastasis (32, 33). Thus, we explored whether PC is related to EMT activation in PTC at cellular level. Consistently with our hypothesis, western blot assay results showed that the protein levels of EMT transcription factors (34), such as zinc finger E-box-binding homenbox1 (ZEB1), Snail1, and Vimentin, were decreased and that the protein levels of E-cadherin was increased in LV-shPC cells compared to LV-NC cells (Figure 4F). The results suggest that PC is related to PTC aggression.
PC Induces EMT in TPC1 Cells via the TGF-β/Smad Pathway
It has been reported that, EMT can be activated by transforming growth factor beta 1 (TGF-β1) signaling through the Smad pathway (35–38). We hypothesized that PC induces TPC1 cell proliferation, migration, and invasion through the TGF-β/Smad pathway.
Both the mRNA and protein expressions of TGF-βR1 were significantly decreased in LV-shPC cells compared to LV-NC cells (Figures 5A, B). Compared to those in LV-shPC cells, the proteins of ZEB1, Snali1, Vimentin, and P-Smad2/3 were upregulated and the protein level of E-cadherin was downregulated in LV-shPC-TGF-βR1 cells (Figures 5C, D). In addition, the proliferation, migration, and invasion abilities were significantly increased in LV-shPC-TGF-βR1 cells compared to LV-shPC cells (Figures 5E–G). These results suggest that PC induces PTC cells aggressiveness through the TGF-β/Smad pathway (Figure 6).
FIGURE 5
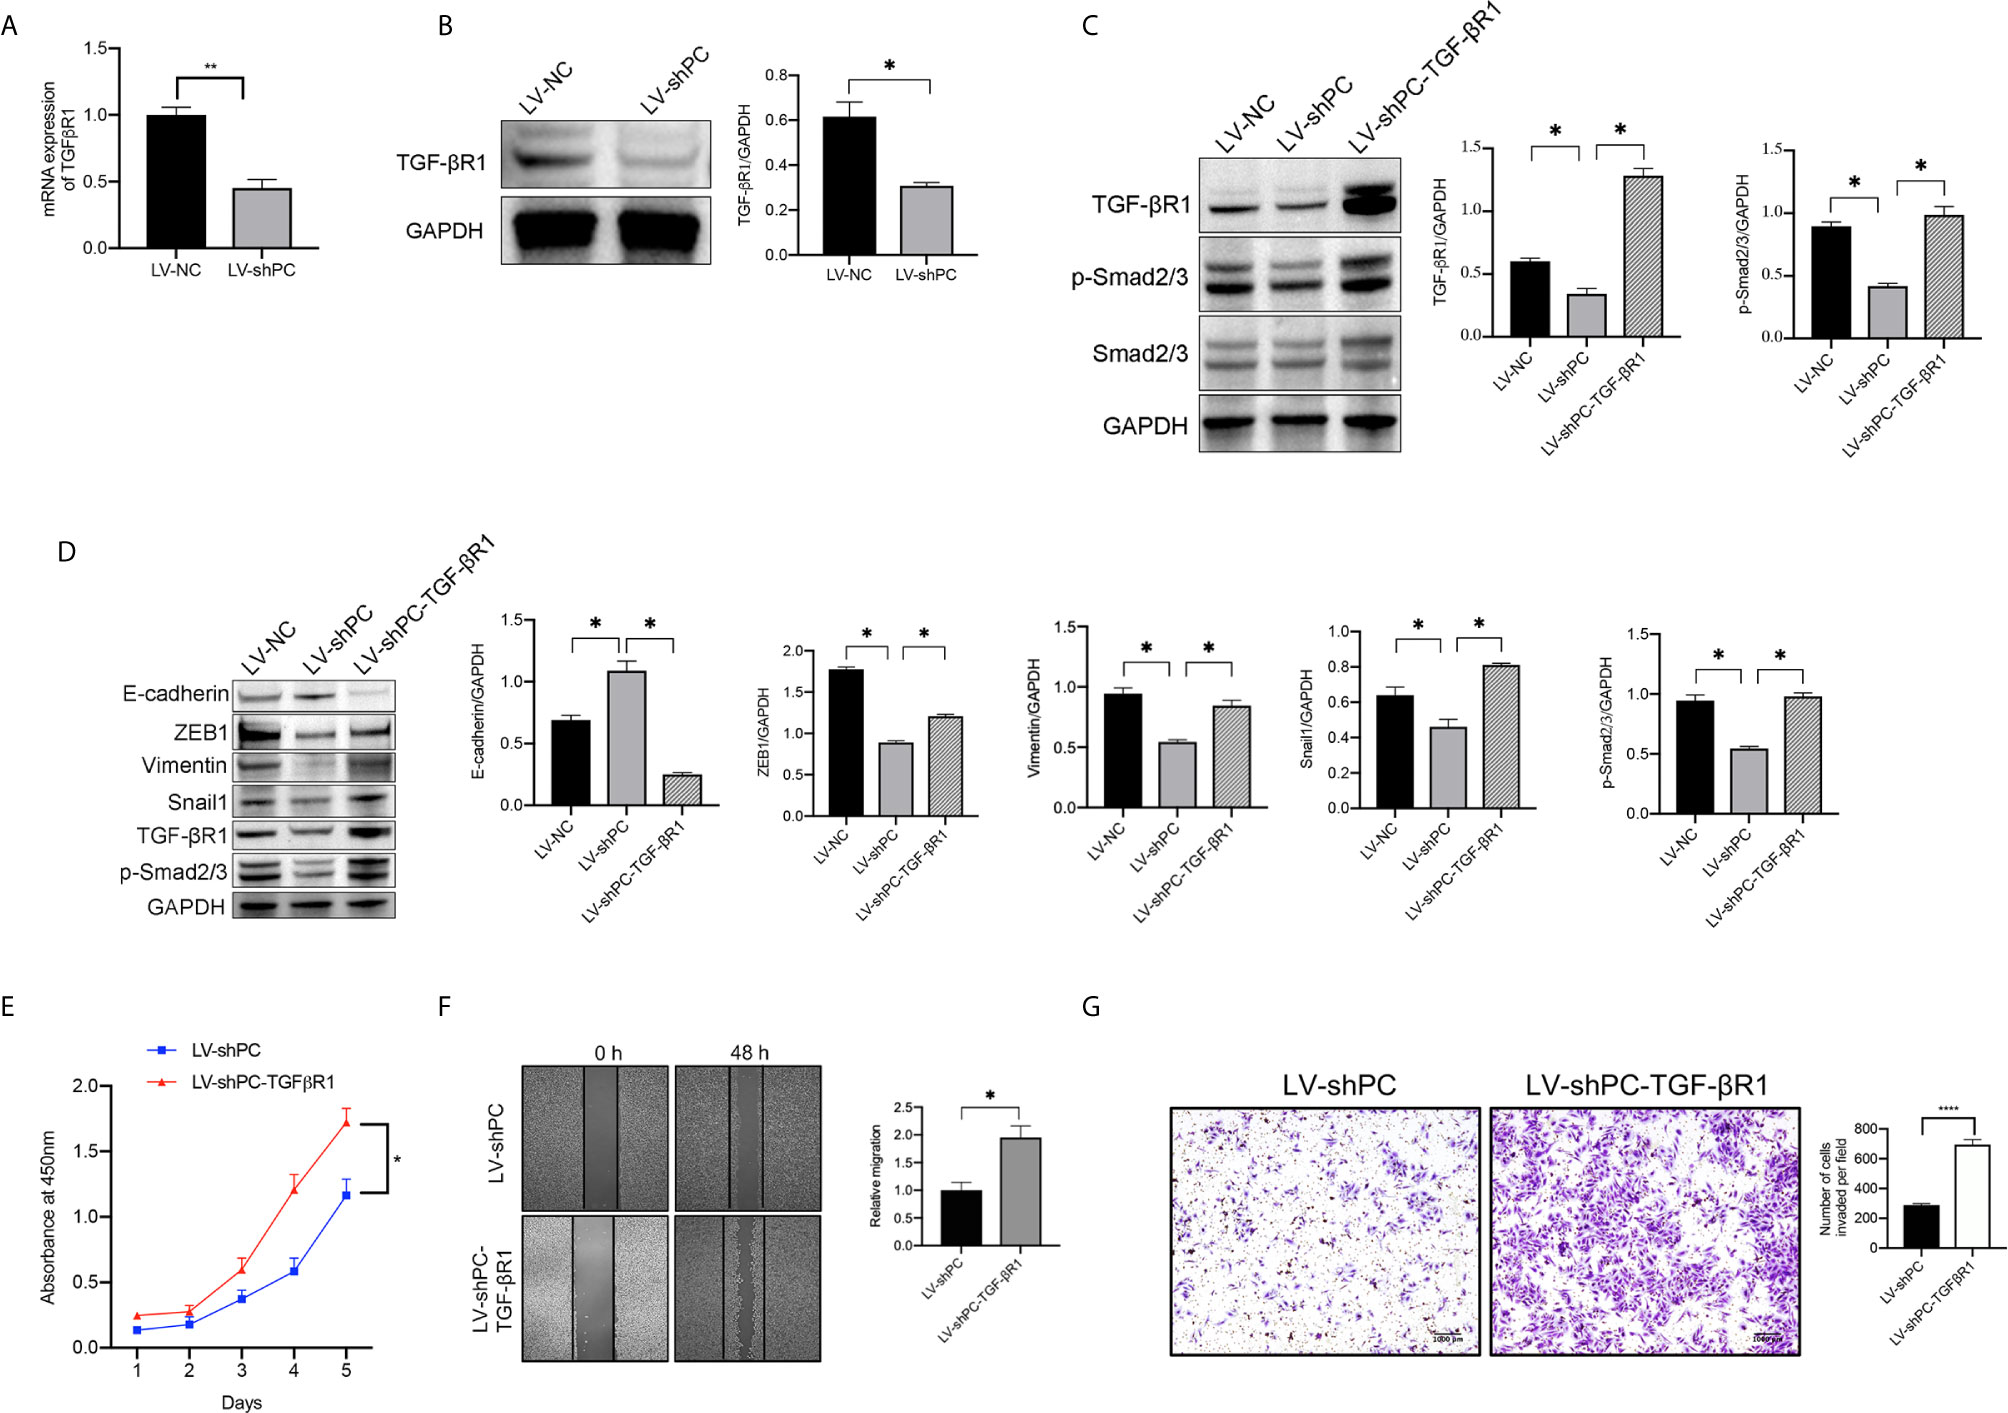
Figure 5 PC induces EMT in PTC cells by activating the TGF-β/Smad signaling pathway. (A) qRT-PCR analysis of TGF-βR1mRNA expression in TPC1 cells as indicated. **P <0.01 (B) Western blotting was used to evaluate TGF-βR1 protein expression in TPC1 cells as indicated. The average quantification obtained by densitometric analysis (Image J) of the blot of TGF-βR1 expression. Data are expressed as mean ± SEM. *P <0.05. (C) Western blot analysis of TGF-βR1, P-Smad2/3, and Smad2/3 protein expression in TPC1 cells as indicated. The average quantification obtained by densitometric analysis (Image J) of the blot of proteins expression. Data are expressed as mean ± SEM. *P <0.05. (D) Western blotting was used to evaluate E-cadherin, Vimentin, ZEB1, Snail1, TGF-βR1, and P-Smad2/3 protein expression in TPC1 cells as indicated; The average quantification obtained by densitometric analysis (Image J) of the blot of proteins expression. Data are expressed as mean ± SEM. *P <0.05. The full blot is provided in the Supplementary File. (E) CCK-8 assay was used to detect the proliferation of the indicated TPC1 cells. *P <0.05. (F) A wound-healing assay was applied to assess the migration ability of different TPC1 cells (LV-sh, LV-shPC- TGF-βR1). Representative images and quantification of cell counts normalized by controls are shown. *P <0.05 (G) Transwell invasion assays were applied to assess the motility of different TPC1 cells with a 4× objective lens. ****P <0.0001. The number of invaded cells is shown in histograms on the below.
FIGURE 6
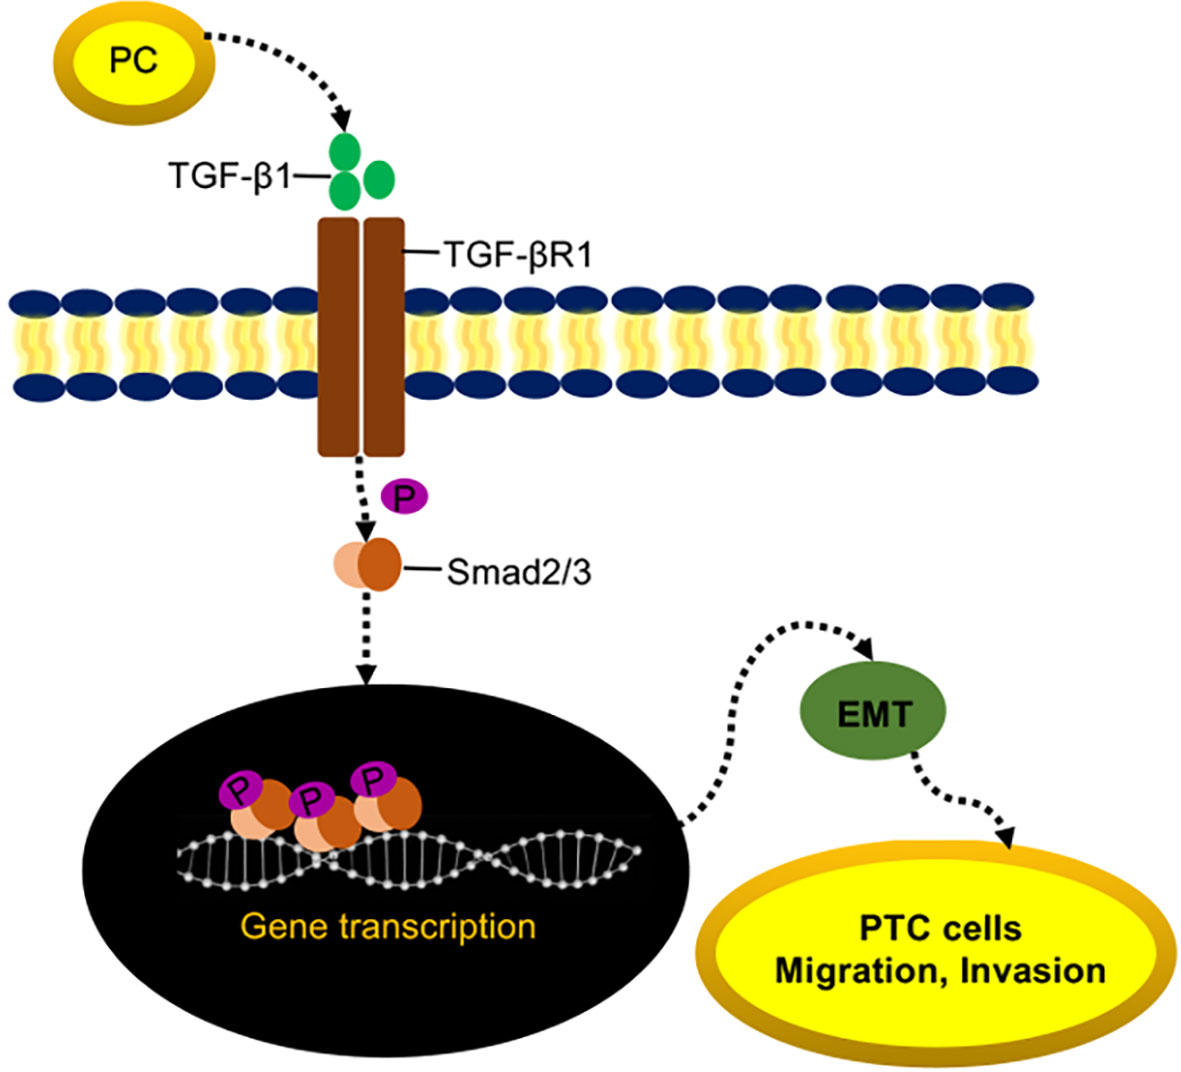
Figure 6 Proposed model of PC-mediated PTC migration and invasion.
Discussion
Although most PTCs tend to have “bioinert” characteristics, some show higher invasive and aggressive clinical features. Cervical lymph node metastasis is a common aggressive clinical feature, occurring in nearly half of PTC patients (39) and in 20–90% of PTMC patients (40, 41). A review of a Surveillance, Epidemiology, and End Results (SEER) database study found that cervical lymph node metastases indicate a high risk of locoregional recurrence and poor survival (42–44). Bake et al. (45) reported that PTC with lymph node metastasis group had a shorter disease-free survival period than the group without lymph node metastasis. Detection of metastasis in greater than 30% of the monitored lymph nodes is a significant independent prognostic factor in PTC (46). CLNM, representing metastasis to the sentinel cervical lymph node, is also a risk factor for recurrence (47). However, it is often difficult to recognize central lymph nodes via ultrasonography (48).
Molecular tests have improved the accuracy of ultrasound-guided FNA cytology (49–51), but there is no effective molecular marker for predicting lymph node metastasis. Although BRAFV600E and TERTC228T mutations are widely assessed in the clinic, 40% of PTCs with distant metastases are negative for BRAF or TERT genetic mutation (52). Liu et al. (53) found that the TERTC228T mutation and the BRAFV600E mutation led to dedifferentiation and aggressive biological behavior in THCA (54). However, the probability of the BRAFV600E and TERTC228T mutations occurring simultaneously in PTC is 13% (55). In addition, Ren et al. (56) reported that the coexistence of BRAFV600E and TERTC228T mutations has no obvious correlation with PTC lymph node metastasis. Hence, finding a new biomarker is important in the management of PTC.
Overexpression of PC is found in many human cancers (13, 57, 58). We performed bioinformatics analysis of online databases and found that the PC mRNA expression level was significantly higher in the PTC group than in the normal group, which was confirmed in our PTC patient surgical tumor tissues and thyroid nodule FNA wash-out fluid samples. In addition, both the mRNA and protein expression levels of PC were higher in the CLNM-positive PTC group than in the CLNM-negative group. Based on the univariate and multivariate analyses, we found that PC was a risk factor for CLNM in the PTC. Age younger than 55 was also a risk factor. This is consistent with Liu et al.’s findings (59). Factors such as extrathyroidal extension, multifocal tumors, bilateral distribution, and TNM staging were not risk factors in our study, although prior study from Feng et al. indicated that extrathyroid invasion is a risk factor (60). In Liu’s studies (61) multifocality was not risk factors either, consistently with our study. Bilateral invasion is more controversial. Yan and Xu’s studies (62, 63) showed that bilateral invasion is a risk factor, but not in the study of Zhang et al. (64).
As PC show a significant role in PTC progression and metastasis, we further explored the molecular mechanism. EMT is a typical feature in tumor metastasis. E-cadherin is an important intercellular adhesion molecule that maintains the phenotype of epithelial cells. Decreased expression of E-cadherin is an important sign of EMT. This study found that silencing PC can inhibit the proliferation, invasion and metastasis of THCA cells, upregulate the E-cadherin protein expression and decrease Vimentin, Snail1and ZEB1 protein expression. These results suggest that PC induces the EMT of PTC.
The TGF-β/Smad signaling pathway induces cancer cells immune escape, metastasis and angiogenesis by regulating EMT (65–67). The protein expression levels of P-Smad2/3 and TGF-βR1 can reflect the status of the TGF-β/Smad signal pathway, and increased protein expression of P-Smad2/3 and TGF-βR1 indicates that the TGF-β/Smad signaling pathway is activated. In contrast, decrease in P-Smad2/3 and TGF-βR1 protein expression indicates that the TGF-β/Smad signaling pathway is inhibited (68–70). This study found that silencing PC can reduce the protein expression of P-Smad2/3 and TGF-βR1 proteins in cells and thus inhibit EMT. However, the effect can be recused by overexpressing TGF-βR1, indicating that the mechanism by which silencing PC inhibits the malignant biological behavior of THCA cells may be related to inhibition of the TGF-β/Smad signaling pathway, which thereby inhibits EMT in THCA cells. We postulate that it is most likely thorough indirect action and less likely by direct binding, as PC is an intracellular enzyme. Further studies are needed to elucidate the underlying activation mechanism.
Our results showed that PC expression in thyroid FNA wash-out fluid may be an independent predictor for CLNM in PTC. Surgical nodal dissection should be considered in PTC patients with increased PC mRNA expression in the thyroid FNA wash-out fluid. This approach may improve patient prognosis and survival rates, which could be confirmed prospectively in the future study. Alternatively, active surveillance should be suitable for patients with low or no PC expression, which may improve the quality of life of PTC patients.
In conclusion, our study is the first to report that PC in the thyroid FNA wash-out fluid is an independent predictor for CLNM in PTC. The mechanism by which PC promotes PTC progression may be related to inducing the activation of the TGF-β/Smad signaling pathway, thereby promoting EMT in THCA cells.
Data Availability Statement
The datasets presented in this study can be found in online repositories. The names of the repository/repositories and accession number(s) can be found in the article/Supplementary Material.
Ethics Statement
This project was approved by the Ethical Committee of the Rui Jin Hospital of Shanghai JiaoTong University School of Medicine and written informed consent was obtained from all patients.
Author Contributions
CL and LZ contributed equally to the article. CL contributed to the collection of the thyroid FNA wash-out fluid samples, RT-PCR, data analysis for the work, and drafting the manuscript. LZ contributed to the operation of ultrasound-guided fine-needle aspiration and data analysis for the work. YL and QZ contributed to the collection of the surgical tissues. YP and YZ contributed to the conception and design of the work and critically revised the manuscript. All authors contributed to the article and approved the submitted version.
Funding
This work was supported by the National Natural Science Foundation of china (nos. 81471688, 81671720, 81801726, and 81971644), the Foundation of National Facility for Translational Medicine (Shanghai) (TMSK-2020-116), and the Shanghai Sailing Program (18YF1414300).
Conflict of Interest
The authors declare that the research was conducted in the absence of any commercial or financial relationships that could be construed as a potential conflict of interest.
Supplementary Material
The Supplementary Material for this article can be found onlineat: https://www.frontiersin.org/articles/10.3389/fonc.2021.643416/full#supplementary-material
References
1. La Vecchia C, Malvezzi M, Bosetti C, Garavello W, Bertuccio P, Levi F, et al. Thyroid Cancer Mortality and Incidence: A Global Overview. Int J Cancer (2015) 136:2187–95. doi: 10.1002/ijc.29251
2. Liang J, Cai W, Feng D, Teng H, Mao F, Jiang Y, et al. Genetic Landscape of Papillary Thyroid Carcinoma in the Chinese Population. J Pathol (2018) 244:215–26. doi: 10.1002/path.5005
3. Lim H, Devesa SS, Sosa JA, Check D, Kitahara CM. Trends in Thyroid Cancer Incidence and Mortality in the United States, 1974-2013. JAMA (2017) 317:1338–48. doi: 10.1001/jama.2017.2719
4. Abdullah MI, Junit SM, Ng KL, Jayapalan JJ, Karikalan B, Hashim OH. Papillary Thyroid Cancer: Genetic Alterations and Molecular Biomarker Investigations. Int J Med Sci (2019) 16:450–60. doi: 10.7150/ijms.29935
5. McLeod DS, Sawka AM, Cooper DS. Controversies in Primary Treatment of Low-Risk Papillary Thyroid Cancer. Lancet (2013) 381:1046–57. doi: 10.1016/S0140-6736(12)62205-3
6. Ito Y, Miyauchi A, Kihara M, Higashiyama T, Kobayashi K, Miya A. Patient Age is Significantly Related to the Progression of Papillary Microcarcinoma of the Thyroid Under Observation. Thyroid (2014) 24:27–34. doi: 10.1089/thy.2013.0367
7. Papaioannou C, Lamnisos D, Kyriacou K, Lyssiotis T, Constantinides V, Frangos S, et al. Lymph Node Metastasis and Extrathyroidal Extension in Papillary Thyroid Microcarcinoma in Cyprus: Suspicious Subcentimeter Nodules Should Undergo FNA When Multifocality is Suspected. J Thyroid Res (2020) 2020:3567658. doi: 10.1155/2020/3567658
8. DeBerardinis RJ, Chandel NS. Fundamentals of Cancer Metabolism. Sci Adv (2016) 2(5):e1600200. doi: 10.1126/sciadv.1600200
9. DeBerardinis RJ, Lum JJ, Hatzivassiliou G, Thompson CB. The Biology of Cancer: Metabolic Reprogramming Fuels Cell Growth and Proliferation. Cell Metab (2008) 7:11–20. doi: 10.1016/j.cmet.2007.10.002
10. Martinez-Reyes I, Chandel NS. Waste Not, Want Not: Lactate Oxidation Fuels the TCA Cycle. Cell Metab (2017) 26:803–04. doi: 10.1016/j.cmet.2017.11.005
11. Hensley CT, DeBerardinis RJ. In Vivo Analysis of Lung Cancer Metabolism: Nothing Like the Real Thing. J Clin Invest (2015) 125:495–7. doi: 10.1172/JCI79188
12. Sellers K, Fox MP, Bousamra M 2nd, Slone SP, Higashi RM, Miller DM, et al. Pyruvate Carboxylase is Critical for non-Small-Cell Lung Cancer Proliferation. J Clin Invest (2015) 125:687–98. doi: 10.1172/JCI72873
13. Christen S, Lorendeau D, Schmieder R, Broekaert D, Metzger K, Veys K, et al. Breast Cancer-Derived Lung Metastases Show Increased Pyruvate Carboxylase-Dependent Anaplerosis. Cell Rep (2016) 17:837–48. doi: 10.1016/j.celrep.2016.09.042
14. Phannasil P, Ansari IH, El Azzouny M, Longacre MJ, Rattanapornsompong K, Burant CF, et al. Mass Spectrometry Analysis Shows the Biosynthetic Pathways Supported by Pyruvate Carboxylase in Highly Invasive Breast Cancer Cells. Biochim Biophys Acta Mol Basis Dis (2017) 1863:537–51. doi: 10.1016/j.bbadis.2016.11.021
15. Shinde A, Wilmanski T, Chen H, Teegarden D, Wendt MK. Pyruvate Carboxylase Supports the Pulmonary Tropism of Metastatic Breast Cancer. Breast Cancer Res (2018) 20:76. doi: 10.1186/s13058-018-1008-9
16. Lin Q, He Y, Wang X, Zhang Y, Hu M, Guo W, et al. Targeting Pyruvate Carboxylase by a Small Molecule Suppresses Breast Cancer Progression. Adv Sci (Weinh) (2020) 7:1903483. doi: 10.1002/advs.201903483
17. Strickaert A, Corbet C, Spinette SA, Craciun L, Dom G, Andry G, et al. Reprogramming of Energy Metabolism: Increased Expression and Roles of Pyruvate Carboxylase in Papillary Thyroid Cancer. Thyroid (2019) 29:845–57. doi: 10.1089/thy.2018.0435
18. Haugen BR, Alexander EK, Bible KC, Doherty GM, Mandel SJ, Nikiforov YE, et al. 2015 American Thyroid Association Management Guidelines for Adult Patients With Thyroid Nodules and Differentiated Thyroid Cancer: The American Thyroid Association Guidelines Task Force on Thyroid Nodules and Differentiated Thyroid Cancer. Thyroid (2016) 26:1–133. doi: 10.1089/thy.2015.0020
19. Hughes DT, Doherty GM. Central Neck Dissection for Papillary Thyroid Cancer. Cancer Control (2011) 18:83–8. doi: 10.1177/107327481101800202
20. Wang CC, Friedman L, Kennedy GC, Wang H, Kebebew E, Steward DL, et al. A Large Multicenter Correlation Study of Thyroid Nodule Cytopathology and Histopathology. Thyroid (2011) 21:243–51. doi: 10.1089/thy.2010.0243
21. Chen TY, Lorch JH, Wong KS, Barletta JA. Histologic Features of BRAF V600e-Mutant Anaplastic Thyroid Carcinoma. Histopathology (2020) 77(2):314–20. doi: 10.1111/his.14144
22. Liu XL, Bishop J, Shan Y, Pai S, Liu DX, Murugan AK, et al. Highly Prevalent TERT Promoter Mutations in Aggressive Thyroid Cancers. Endocr-Relat Cancer (2013) 20:603–10. doi: 10.1530/Erc-13-0210
23. Yan C, Huang M, Li X, Wang T, Ling R. Relationship Between BRAF V600E and Clinical Features in Papillary Thyroid Carcinoma. Endocr Connect (2019) 8:988–96. doi: 10.1530/EC-19-0246
24. Cappola AR, Mandel SJ. Molecular Testing in Thyroid Cancer: BRAF Mutation Status and Mortality. JAMA (2013) 309:1529–30. doi: 10.1001/jama.2013.3620
25. Tang Z, Li C, Kang B, Gao G, Li C, Zhang Z. GEPIA: A Web Server for Cancer and Normal Gene Expression Profiling and Interactive Analyses. Nucleic Acids Res (2017) 45:W98–W102. doi: 10.1093/nar/gkx247
26. Rhodes DR, Kalyana-Sundaram S, Mahavisno V, Varambally R, Yu J, Briggs BB, et al. Oncomine 3.0: Genes, Pathways, and Networks in a Collection of 18,000 Cancer Gene Expression Profiles. Neoplasia (2007) 9:166–80. doi: 10.1593/neo.07112
27. Rhodes DR, Yu J, Shanker K, Deshpande N, Varambally R, Ghosh D, et al. ONCOMINE: A Cancer Microarray Database and Integrated Data-Mining Platform. Neoplasia (2004) 6:1–6. doi: 10.1016/s1476-5586(04)80047-2
28. Acquaviva G, Visani M, Repaci A, Rhoden KJ, de Biase D, Pession A, et al. Molecular Pathology of Thyroid Tumours of Follicular Cells: A Review of Genetic Alterations and Their Clinicopathological Relevance. Histopathology (2018) 72:6–31. doi: 10.1111/his.13380
29. Akram R, Wiltshire JJ, Wadsley J, Balasubramanian SP. Adult Thyroglossal Duct Carcinoma of Thyroid Epithelial Origin: A Retrospective Observational Study. Indian J Otolaryngol Head Neck Surg (2016) 68:522–27. doi: 10.1007/s12070-016-1019-8
30. Baloch Z, Mete O, Asa SL. Immunohistochemical Biomarkers in Thyroid Pathology. Endocr Pathol (2018) 29:91–112. doi: 10.1007/s12022-018-9532-9
31. Muthusamy S, Azhar Sha S, Abdullah Suhaimi SN, Kassim N, Mahasin M, Mohd Saleh MF, et al. CD56 Expression in Benign and Malignant Thyroid Lesions. Malays J Pathol (2018) 40:111–19.
32. Mendonsa AM, Na TY, Gumbiner BM. E-Cadherin in Contact Inhibition and Cancer. Oncogene (2018) 37:4769–80. doi: 10.1038/s41388-018-0304-2
33. Pastushenko I, Blanpain C. Emt Transition States During Tumor Progression and Metastasis. Trends Cell Biol (2019) 29:212–26. doi: 10.1016/j.tcb.2018.12.001
34. Diaz VM, Vinas-Castells R, Garcia de Herreros A. Regulation of the Protein Stability of EMT Transcription Factors. Cell Adh Migr (2014) 8:418–28. doi: 10.4161/19336918.2014.969998
35. Hoot KE, Lighthall J, Han G, Lu SL, Li A, Ju W, et al. Keratinocyte-Specific Smad2 Ablation Results in Increased Epithelial-Mesenchymal Transition During Skin Cancer Formation and Progression. J Clin Invest (2008) 118:2722–32. doi: 10.1172/JCI33713
36. Katsuno Y, Lamouille S, Derynck R. TGF-Beta Signaling and Epithelial-Mesenchymal Transition in Cancer Progression. Curr Opin Oncol (2013) 25:76–84. doi: 10.1097/CCO.0b013e32835b6371
37. Moustakas A, Heldin CH. Induction of Epithelial-Mesenchymal Transition by Transforming Growth Factor Beta. Semin Cancer Biol (2012) 22:446–54. doi: 10.1016/j.semcancer.2012.04.002
38. Moustakas A, Heldin CH. Signaling Networks Guiding Epithelial-Mesenchymal Transitions During Embryogenesis and Cancer Progression. Cancer Sci (2007) 98:1512–20. doi: 10.1111/j.1349-7006.2007.00550.x
39. Amit M, Tam S, Boonsripitayanon M, Cabanillas ME, Busaidy NL, Grubbs EG, et al. Association of Lymph Node Density With Survival of Patients With Papillary Thyroid Cancer. JAMA Otolaryngol Head Neck Surg (2018) 144:108–14. doi: 10.1001/jamaoto.2017.2416
40. Grebe SK, Hay ID. Thyroid Cancer Nodal Metastases: Biologic Significance and Therapeutic Considerations. Surg Oncol Clin N Am (1996) 5:43–63.
41. Kouvaraki MA, Shapiro SE, Fornage BD, Edeiken-Monro BS, Sherman SI, Vassilopoulou-Sellin R, et al. Role of Preoperative Ultrasonography in the Surgical Management of Patients With Thyroid Cancer. Surgery (2003) 134:946–54; discussion 54-5. doi: 10.1016/s0039-6060(03)00424-0
42. McLeod DS. Current Concepts and Future Directions in Differentiated Thyroid Cancer. Clin Biochem Rev (2010) 31:9–19.
43. Schlumberger MJ. Papillary and Follicular Thyroid Carcinoma. N Engl J Med (1998) 338:297–306. doi: 10.1056/NEJM199801293380506
44. Zheng KS, Zeng Y, Chen C, Wu YZ, Chen B, Ying WB, et al. [Risk Factors of Cervical Lymph Node Metastasis in Papillary Thyroid Microcarcinoma:An Analysis Based on Data From the Surveillance, Epidemiology and End Results Database]. Zhongguo Yi Xue Ke Xue Yuan Xue Bao (2018) 40:736–43. doi: 10.3881/j.issn.1000-503X.10747
45. Baek SK, Jung KY, Kang SM, Kwon SY, Woo JS, Cho SH, et al. Clinical Risk Factors Associated With Cervical Lymph Node Recurrence in Papillary Thyroid Carcinoma. Thyroid (2010) 20:147–52. doi: 10.1089/thy.2008.0243
46. Vas Nunes JH, Clark JR, Gao K, Chua E, Campbell P, Niles N, et al. Prognostic Implications of Lymph Node Yield and Lymph Node Ratio in Papillary Thyroid Carcinoma. Thyroid (2013) 23:811–6. doi: 10.1089/thy.2012.0460
47. Rajeev P, Ahmed S, Ezzat TM, Sadler GP, Mihai R. The Number of Positive Lymph Nodes in the Central Compartment has Prognostic Impact in Papillary Thyroid Cancer. Langenbecks Arch Surg (2013) 398:377–82. doi: 10.1007/s00423-012-1041-6
48. Machens A, Hinze R, Thomusch O, Dralle H. Pattern of Nodal Metastasis for Primary and Reoperative Thyroid Cancer. World J Surg (2002) 26:22–8. doi: 10.1007/s00268-001-0176-3
49. Alexander EK, Kennedy GC, Baloch ZW, Cibas ES, Chudova D, Diggans J, et al. Preoperative Diagnosis of Benign Thyroid Nodules With Indeterminate Cytology. N Engl J Med (2012) 367:705–15. doi: 10.1056/NEJMoa1203208
50. Eszlinger M, Lau L, Ghaznavi S, Symonds C, Chandarana SP, Khalil M, et al. Molecular Profiling of Thyroid Nodule Fine-Needle Aspiration Cytology. Nat Rev Endocrinol (2017) 13:415–24. doi: 10.1038/nrendo.2017.24
51. Wiseman SM, Haddad Z, Walker B, Vergara IA, Sierocinski T, Crisan A, et al. Whole-Transcriptome Profiling of Thyroid Nodules Identifies Expression-Based Signatures for Accurate Thyroid Cancer Diagnosis. J Clin Endocrinol Metab (2013) 98:4072–9. doi: 10.1210/jc.2013-1991
52. Bae JS, Kim Y, Jeon S, Kim SH, Kim TJ, Lee S, et al. Clinical Utility of TERT Promoter Mutations and ALK Rearrangement in Thyroid Cancer Patients With a High Prevalence of the BRAF V600E Mutation. Diagn Pathol (2016) 11:21. doi: 10.1186/s13000-016-0458-6
53. Liu XL, Qu S, Liu RY, Sheng CJ, Shi XG, Zhu GW, et al. Tert Promoter Mutations and Their Association With BRAF V600e Mutation and Aggressive Clinicopathological Characteristics of Thyroid Cancer. J Clin Endocr Metab (2014) 99:E1130–E36. doi: 10.1210/jc.2013-4048
54. Giorgenon TMV, Carrijo FT, Arruda MA, Cerqueira TLO, Barreto HR, Cabral JB, et al. Preoperative Detection of TERT Promoter and BRAFV600E Mutations in Papillary Thyroid Carcinoma in High-Risk Thyroid Nodules. Arch Endocrinol Metab (2019) 63:107–12. doi: 10.20945/2359-3997000000116
55. Lee SE, Hwang TS, Choi YL, Han HS, Kim WS, Jang MH, et al. Prognostic Significance of TERT Promoter Mutations in Papillary Thyroid Carcinomas in a BRAF(V600E) Mutation-Prevalent Population. Thyroid (2016) 26:901–10. doi: 10.1089/thy.2015.0488
56. Ren H, Shen Y, Hu D, He W, Zhou J, Cao Y, et al. Co-Existence of BRAF(V600E) and TERT Promoter Mutations in Papillary Thyroid Carcinoma is Associated With Tumor Aggressiveness, But Not With Lymph Node Metastasis. Cancer Manag Res (2018) 10:1005–13. doi: 10.2147/CMAR.S159583
57. Elia I, Schmieder R, Christen S, Fendt SM. Organ-Specific Cancer Metabolism and Its Potential for Therapy. Handb Exp Pharmacol (2016) 233:321–53. doi: 10.1007/164_2015_10
58. Hensley CT, Faubert B, Yuan Q, Lev-Cohain N, Jin E, Kim J, et al. Metabolic Heterogeneity in Human Lung Tumors. Cell (2016) 164:681–94. doi: 10.1016/j.cell.2015.12.034
59. Liu C, Xiao C, Chen J, Li X, Feng Z, Gao Q, et al. Risk Factor Analysis for Predicting Cervical Lymph Node Metastasis in Papillary Thyroid Carcinoma: A Study of 966 Patients. BMC Cancer (2019) 19:622. doi: 10.1186/s12885-019-5835-6
60. Feng JW, Yang XH, Wu BQ, Sun DL, Jiang Y, Qu Z. Predictive Factors for Central Lymph Node and Lateral Cervical Lymph Node Metastases in Papillary Thyroid Carcinoma. Clin Transl Oncol (2019) 21:1482–91. doi: 10.1007/s12094-019-02076-0
61. Liu W, Cheng R, Su Y, Diao C, Qian J, Zhang J, et al. Risk Factors of Central Lymph Node Metastasis of Papillary Thyroid Carcinoma: A Single-Center Retrospective Analysis of 3273 Cases. Med (Baltimore) (2017) 96:e8365. doi: 10.1097/MD.0000000000008365
62. Xu D, Lv X, Wang S, Dai W. Risk Factors for Predicting Central Lymph Node Metastasis in Papillary Thyroid Microcarcinoma. Int J Clin Exp Pathol (2014) 7:6199–205.
63. Yan H, Zhou X, Jin H, Li X, Zheng M, Ming X, et al. A Study on Central Lymph Node Metastasis in 543 Cn0 Papillary Thyroid Carcinoma Patients. Int J Endocrinol (2016) 2016:1878194. doi: 10.1155/2016/1878194
64. Zhang L, Wei WJ, Ji QH, Zhu YX, Wang ZY, Wang Y, et al. Risk Factors for Neck Nodal Metastasis in Papillary Thyroid Microcarcinoma: A Study of 1066 Patients. J Clin Endocrinol Metab (2012) 97:1250–7. doi: 10.1210/jc.2011-1546
65. Chou JL, Chen LY, Lai HC, Chan MW. TGF-Beta: Friend or Foe? The Role of TGF-beta/SMAD Signaling in Epigenetic Silencing of Ovarian Cancer and its Implication in Epigenetic Therapy. Expert Opin Ther Targets (2010) 14:1213–23. doi: 10.1517/14728222.2010.525353
66. Thomas DA, Massague J. TGF-Beta Directly Targets Cytotoxic T Cell Functions During Tumor Evasion of Immune Surveillance. Cancer Cell (2005) 8:369–80. doi: 10.1016/j.ccr.2005.10.012
67. Wu WS. The Signaling Mechanism of ROS in Tumor Progression. Cancer Metastasis Rev (2006) 25:695–705. doi: 10.1007/s10555-006-9037-8
68. Colak S, Ten Dijke P. Targeting TGF-beta Signaling in Cancer. Trends Cancer (2017) 3:56–71. doi: 10.1016/j.trecan.2016.11.008
69. Garcia-Rendueles AR, Rodrigues JS, Garcia-Rendueles ME, Suarez-Farina M, Perez-Romero S, Barreiro F, et al. Rewiring of the Apoptotic TGF-beta-SMAD/NFkappaB Pathway Through an Oncogenic Function of p27 in Human Papillary Thyroid Cancer. Oncogene (2017) 36:652–66. doi: 10.1038/onc.2016.233
Keywords: papillary thyroid carcinoma, pyruvate carboxylase, biopsy, fine-needle, lymphatic metastasis
Citation: Liu C, Zhang L, Liu Y, Zhao Q, Pan Y and Zhang Y (2021) Value of Pyruvate Carboxylase in Thyroid Fine-Needle Aspiration Wash-Out Fluid for Predicting Papillary Thyroid Cancer Lymph Node Metastasis. Front. Oncol. 11:643416. doi: 10.3389/fonc.2021.643416
Received: 18 December 2020; Accepted: 19 April 2021;
Published: 17 May 2021.
Edited by:
Shiv K. Gupta, Mayo Clinic, United StatesReviewed by:
Quan-Yong Luo, Shanghai Jiao Tong University, ChinaJinhang Gao, Sichuan University, China
Copyright © 2021 Liu, Zhang, Liu, Zhao, Pan and Zhang. This is an open-access article distributed under the terms of the Creative Commons Attribution License (CC BY). The use, distribution or reproduction in other forums is permitted, provided the original author(s) and the copyright owner(s) are credited and that the original publication in this journal is cited, in accordance with accepted academic practice. No use, distribution or reproduction is permitted which does not comply with these terms.
*Correspondence: Yifan Zhang, zyf11300@rjh.com.cn; Yu Pan, py12176@rjh.com.cn
†These authors have contributed equally to this work