- 1Division of Hematology, Oncology and Palliative Care, Department of Internal Medicine, Virginia Commonwealth University, Richmond, VA, United States
- 2Division of Gynecologic Oncology, Department of Obstetrics and Gynecology, Virginia Commonwealth University, Richmond, VA, United States
- 3School of Medicine, Virginia Commonwealth University, Richmond, VA, United States
- 4Department of Pathology, Virginia Commonwealth University, Richmond, VA, United States
- 5Massey Cancer Center, Virginia Commonwealth University, Richmond, VA, United States
- 6Department of Biostatistics, Virginia Commonwealth University, Richmond, VA, United States
- 7Department of Pathology, Virginia Commonwealth University, Richmond, VA, United States
Cell cycle control drives cancer progression and treatment response in high grade serous ovarian carcinoma (HGSOC). MYBL2 (encoding B-Myb), an oncogene with prognostic significance in several cancers, is highly expressed in most HGSOC cases; however, the clinical significance of B-Myb in this disease has not been well-characterized. B-Myb is associated with cell proliferation through formation of the MMB (Myb and MuvB core) protein complex required for transcription of mitotic genes. High B-Myb expression disrupts the formation of another transcriptional cell cycle regulatory complex involving the MuvB core, DREAM (DP, RB-like, E2F, and MuvB), in human cell lines. DREAM coordinates cell cycle dependent gene expression by repressing over 800 cell cycle genes in G0/G1. Here, we take a bioinformatics approach to further evaluate the effect of B-Myb expression on DREAM target genes in HGSOC and validate our cellular model with clinical specimens. We show that MYBL2 is highly expressed in HGSOC and correlates with expression of DREAM and MMB target genes in both The Cancer Genome Atlas (TCGA) as well as independent analyses of HGSOC primary tumors (N = 52). High B-Myb expression was also associated with poor overall survival in the TCGA cohort and analysis by a DREAM target gene expression signature yielded a negative impact on survival. Together, our data support the conclusion that high expression of MYBL2 is associated with deregulation of DREAM/MMB-mediated cell cycle gene expression programs in HGSOC and may serve as a prognostic factor independent of its cell cycle role. This provides rationale for further, larger scale studies aimed to determine the clinical predictive value of the B-Myb gene expression signature for treatment response as well as patient outcomes.
Introduction
High grade serous ovarian cancer (HGSOC) is the most common subtype of ovarian cancer (1). Scientific understanding of this disease is a priority as ovarian cancer remains the most lethal of the gynecologic malignancies (2). Better understanding of the factors that contribute to the pathogenesis and progression of HGSOC is required for improving the diagnostics and treatment of this disease. B-Myb (encoded by MYBL2) is a transcription factor oncoprotein that contributes to cell proliferation and poor clinical outcomes in cancer (3). B-Myb is recognized as a prognostic indicator in breast cancer and is included within validated scoring systems commonly used to assess the risk of disease recurrence (4, 5). Interestingly, MYBL2 gene copy-number gain is present in 55% of HGSOC cases in both The Cancer Genome Atlas (TCGA) as well as data set; however, the prognostic importance of B-Myb in this disease has not been well-characterized (6). Previous in vitro studies of cancer cell models found that high B-Myb expression not only deregulates the cell cycle through MMB formation and subsequent expression of genes required for mitosis, but leads to disruption of the repressor complex DREAM (DP, RB-like, E2F, and MuvB), a master regulator of the cell cycle dependent gene expression (7).
DREAM assembles when RB-like protein p130 binds to MuvB protein complex containing LIN52, LIN9, LIN37, LIN54, and RBBP4, and mediates global repression of both early and late cell cycle genes in G0 and G1 (8). Upon cell cycle re-entry, DREAM dissociates in a cyclin D-CDK4/6-dependent manner, resulting in transcription of genes required for coordinated cell cycle progression, including B-Myb (9). MuvB then binds to B-Myb in the S phase to initiate the expression of late cell cycle genes, which peaks in the G2/M phases upon recruitment of FoxM1 transcription factor to their promoters in B-Myb and MuvB-dependent manner (10). Therefore, by forming 3 distinct transcriptional regulatory protein complexes, MuvB ensures proper expression of cell cycle genes throughout all phases of the cycle (11).
We previously determined that 49 of the 50 most differentially expressed genes in the HGSOC TCGA dataset with high B-Myb expression were validated DREAM target genes. Furthermore, genes encoding the MuvB subunits were altered in the majority of HGSOC cases, both by gene copy number losses (LIN52, LIN54) and gains (LIN9, LIN37). Together, this suggests that DREAM functional status may carry prognostic implications. Indeed, DREAM maintains cellular dormancy and has been implicated in HGSOC spheroid formation as well as treatment resistance in human cancer cells derived from the ascitic fluid (12). The DREAM complex may also have secondary effects, aside from its predominate cell cycle role, through involvement in the DNA damage response and by regulating the expression of genes involved in homologous recombination, such as BRCA1/2 and RAD51 (13).
To further investigate the roles and relationships between B-Myb, DREAM, and MMB in HGSOC, we sought to characterize the expression and prognostication of B-Myb in HGSOC. We additionally aimed to corroborate the molecular model of B-Myb-mediated DREAM complex disruption through biostatistical analyses of previously validated data sets and gene expression studies of patient-derived HGSOC tumor samples. Finally, we provide the rationale for evaluation of DREAM functional status in HGSOC and how B-Myb expression may serve as a potential surrogate marker for DREAM assembly. Our ultimate goal is to contribute to the ongoing development of predictive transcriptional signatures for treatment response and disease progression in HGSOC.
Materials and Methods
Quantitative PCR
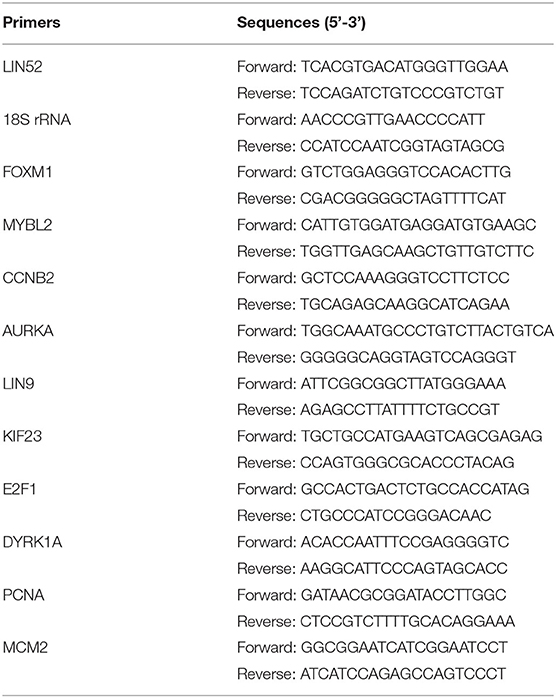
RNA was isolated using MagMAXTM kit (ThermoFisher) and used to synthesize cDNA using SensiFASTTM kit (Bioline). qPCR with Maxima SYBR Green/ROX master mix (ThermoFisher) and gene specific primers was performed using Applied Biosystems 7900HT. Fold changes in mRNA expression relative to controls were calculated using the 2ΔΔCt methodology.
Biostatistics
To calculate the statistical significance of MYBL2 differential gene expression, RT-qPCR data from at least 3 biological replicates was analyzed using two-sided Student's t-test JMP Pro 15 software. To investigate the effect of MYBL2 expression on survival, the Ovarian Cancer RNA-seq data from TCGA (the “OV” cancer abbreviation) was analyzed. Gene expression data summarized as RSEM values were obtained using the TCGA2STAT R package v.1.2. The data were log2-transformed and analyzed using Kaplan–Meier curves and Cox proportional hazard model (Figure 1B). The modified approach from (14) was used to estimate the best gene expression cutoff that separates high/low expression subgroups with the most significantly differential survival. Only subgroups with >40 patients were considered, and the survival time was capped at 5 years. Scripts for performing TCGA survival analysis are available at https://github.com/mdozmorov/TCGAsurvival. Subtype-specific analysis (Figure 2) was performed on the TCGA-defined and annotated ovarian cancer transcriptional subtypes as previously described. Specifically, the proliferative subtype is defined by low MUC1 and MUC16 expression as well as high expression of MCM2, PCNA, HMGA2, and SOX11 (6). Pearson correlation of MYBL2 with DREAM target genes (Figure 4) was performed using the rcorr function from the Hmisc v.4.4-1 R package. To investigate the effect of DREAM signature on survival (Figure 6B), we performed a single-sample GSEA analysis of each TCGA sample (the GSVA v.1.36.3 R package) to quantify the sample-specific enrichment score of DREAM gene expression. Samples were similarly separated into high/low enrichment of DREAM gene expression and analyzed for significant survival differences. The DREAM enrichment score was correlated with the MYBL2 expression (Figure 6A). The curatedOvarianData R package v.1.26.0 (15) was used to evaluate MYBL2 expression between different conditions, and two-sided t-test was used to assess significance (Figures 1C–E, Supplementary Figures 1A–D). Analyses were performed in R v.4.0.2 and visualized using the ggplot2 v.3.3.2 R package.
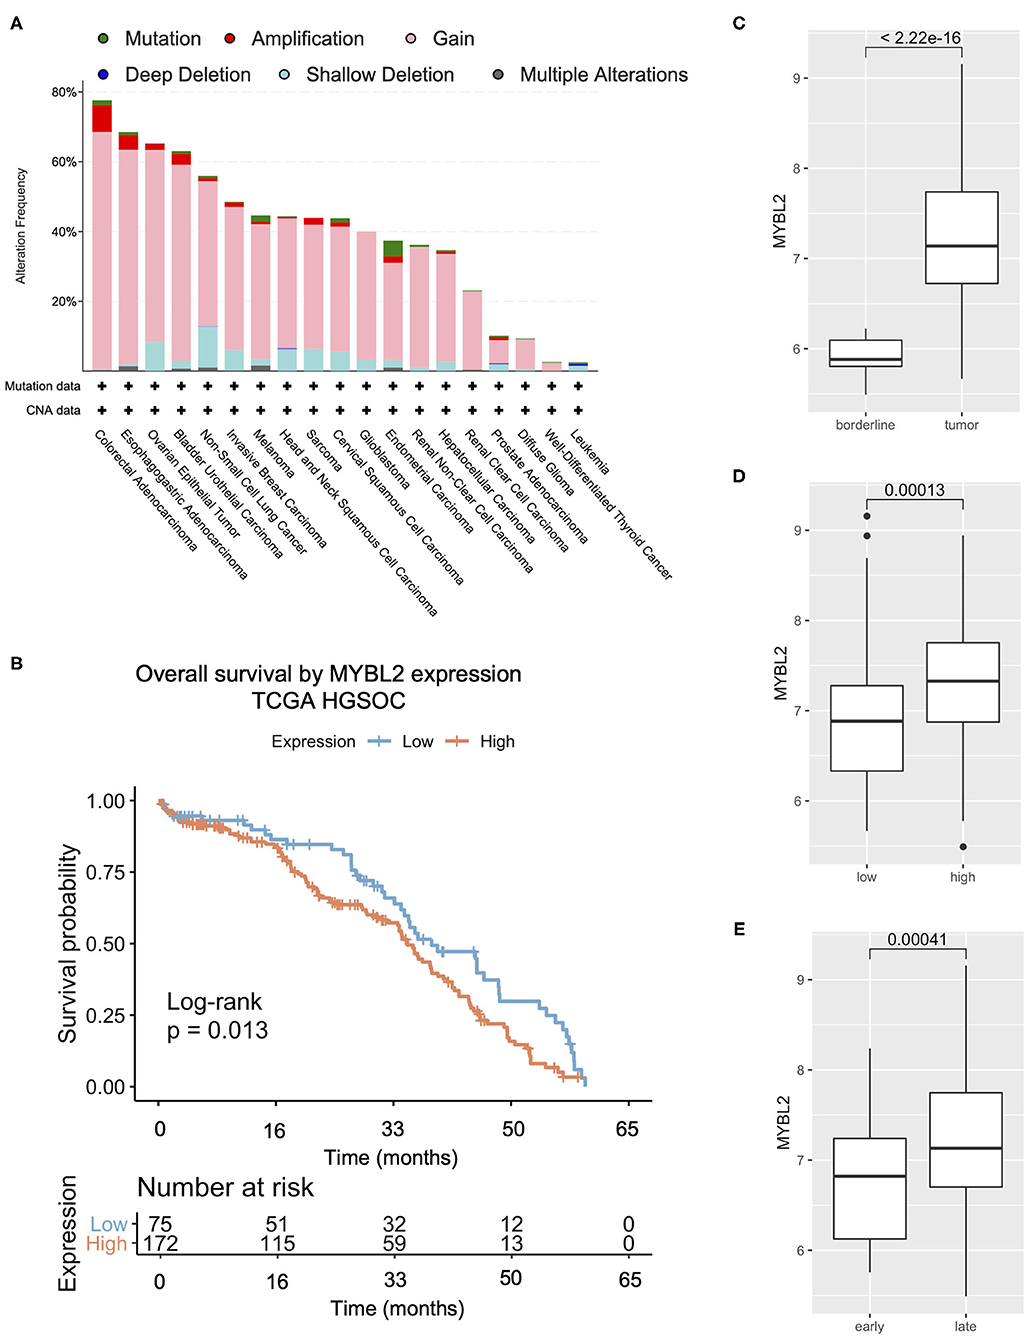
Figure 1. MYBL2 expression is altered and associated with poor overall survival in HGSOC. (A) TCGA summary showing frequent (65%) alterations in MYBL2 in HGSOC (N = 584), mostly gains (55%, N = 321 of 584 cases). (B) Kaplan–Meier survival analysis of TCGA HGSOC data of all tumor stages. (C) Published gene expression dataset GSE9891 was analyzed for expression of MYBL2 in primary untreated ovarian carcinoma (N = 267) as compared with borderline ovarian surface epithelial-stromal tumor (N = 18) (16). Using data from the same study, expression of MYBL2 was compared between high (N = 163) and low (N = 116) grade ovarian tumors (D) as well as between early stage (N = 42) and late stage (N = 240) tumor samples (E). Welch 2 Sample t-test, p <0.01 for (C–E).
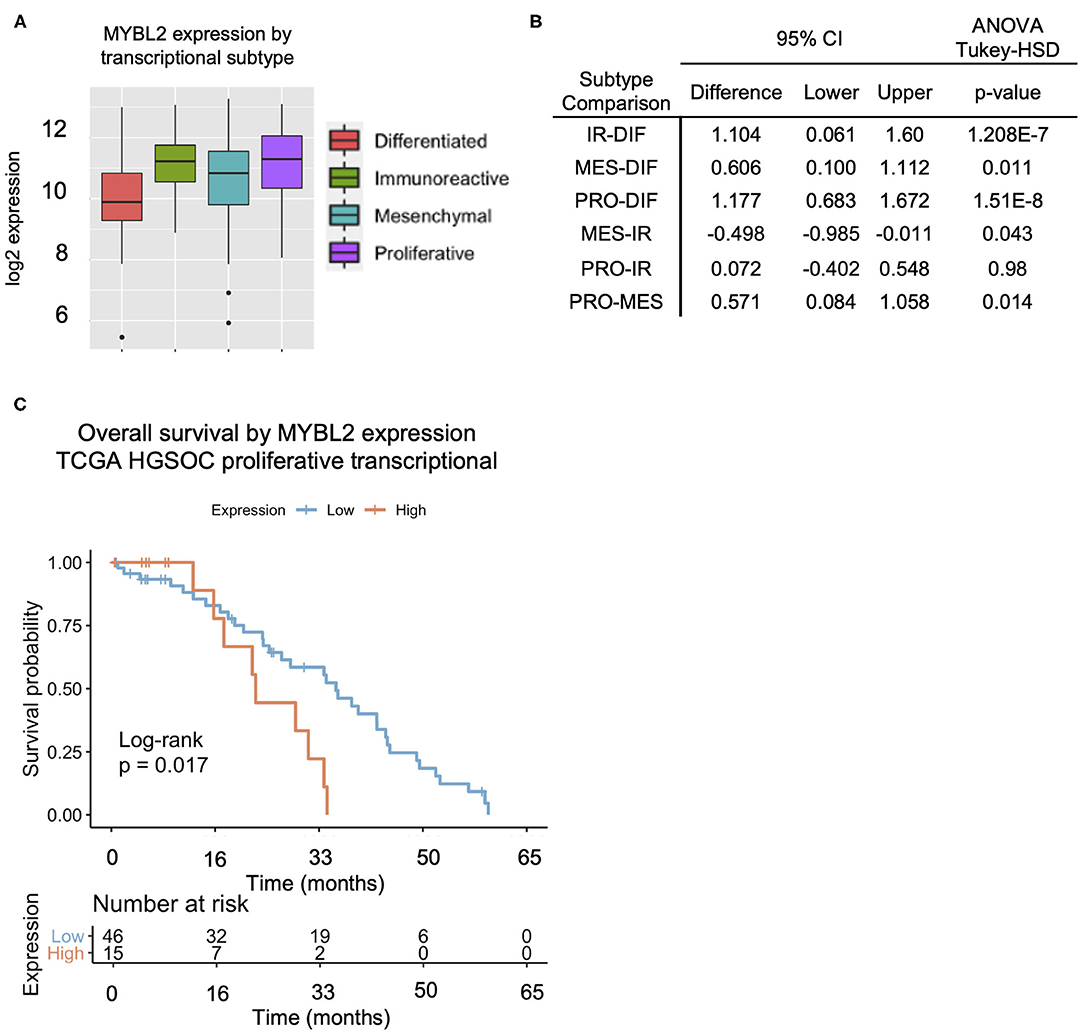
Figure 2. The proliferative subtype HGSOC exhibits the highest MYBL2 expression across transcriptional subtypes. (A,B) Comparison of MYBL2 expression across transcriptional subtypes (ANOVA with Tukey-HSD post-test, p < 0.01) with highest expression in the proliferative subtype. IR, Immunoreactive (N = 78); DIF, Differentiated (N = 67); MES, Mesenchymal (N = 71); PRO, Proliferative (N = 78). (C) High MYBL2 expression is associated with a significantly worse prognosis in HGSOC (Figure 1) with a similar trend shown here in the proliferative subtype from TCGA data analysis. Data show Kaplan–Meier curves and Cox proportional hazard model.
Clinical Tumor Samples
The present study was carried forth under the provisions of the Declaration of Helsinki with approval by the Institutional Review Board of Virginia Commonwealth University (protocol code HM20009880 approved 04/28/2017 with associated protocol HM2471, further described as follows).
The Tissue and Data Analysis and Acquisition Core Laboratory (TDAAC) serves as a biorepository by acquiring and banking human cancers and adjacent normal tissues, as well as hematological samples for use in research. This is done through the aegis of the VCU IRB-approved “Tissue Acquisition System to Support Cancer Research” (TASSCR) protocol (protocol code HM2471), which can supply specimens to a biorepository supporting cancer research through acquisition of residual tumor and normal tissue samples along with informed consent from patients. Samples can thus be provided under an anonymous honest broker system. In addition, TDAAC collects tissue, hematopoietic, and other researcher-specific samples that support investigator-initiated, IRB-approved research projects or clinical trials. All frozen tissue specimens banked in TDAAC have a corresponding formalin-fixed, paraffin-embedded counterpart in the Department of Pathology archives. Patients who sign the TDAAC informed consent documentation agree to have their residual tissues and/or blood utilized for any research question, including genomic data and health information for translational research.
In the present study, 49 of the 52 banked frozen tissue specimens had concurrent formalin-fixed, paraffin-embedded surgical oophorectomy specimens available. Histologic sub classification of HGSOC according to the protocol outlined by Murakami et al. (17) was reviewed by two board-certified anatomic pathologists with expertise in gynecologic pathology. H&E stained slides were independently reviewed and categorized as mesenchymal transition (MT) if there was a complex, labyrinthine pattern with >10% desmoplastic reaction, immunoreactive pattern (IR) when the tumor had rounded contours and associated tumor–infiltrative lymphocytes, papilloglandular (PG) when there was papillary growth pattern or solid and proliferative (SP) when there was solid architecture without significant desmoplastic reaction (17). Both pathologists were blinded to the clinical data and the research question and categorization were finalized when a consensus was reached.
To evaluate p53 expression in these samples a tissue microarray was created from representative formalin-fixed paraffin embedded tissue blocks of the tumor. Immunohistochemical staining was performed with p53 (Dako Omnis p53 protein clone DO-7) and interpreted by 3 gynecologic pathologists for the presence of aberrant vs. wild-type expression. Aberrant expression was characterized as a complete absence of staining (Null) or diffuse staining (Positive). Normal or non-aberrant expression was characterized by heterogeneous staining (wild-type).
Results
MYBL2 Is Highly Expressed in the Majority of HGSOC Cases and Is Associated With Poor Overall Survival
We first sought to characterize MYBL2 expression in HGSOC. Compared with other disease sites in the available PanCan TCGA studies, HGSOC had the third highest alteration frequency, surpassing that of invasive breast carcinoma, for which MYBL2 (encoding B-Myb) carries a clinically significant predictive value (Figure 1A) (4, 5). Our previous work demonstrated that MYBL2 copy number alterations are correlated with mRNA expression (7). Similar to invasive breast carcinoma, high expression of MYBL2 was significantly associated with poorer overall survival in TCGA cases (Figure 1B) (16).
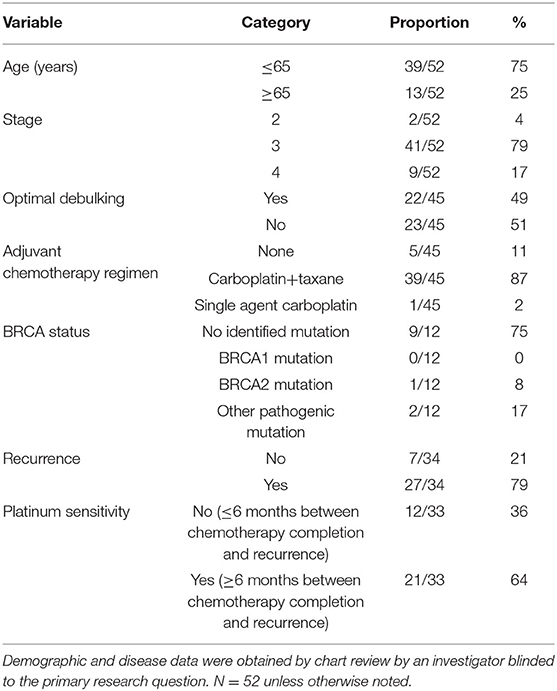
MYBL2 was expressed at significantly higher levels in primary untreated ovarian carcinoma as compared with borderline ovarian surface epithelial-stromal tumor (Figure 1C) and ranked as the fourth most differentially upregulated gene among an independent data set (t-test 18.076, p = 5.99E-31, fold change 2.555, data not shown) (6, 16, 18). Similarly, MYBL2 exhibited higher expression in HGSOC tumor samples than healthy ovarian surface epithelium controls (Supplementary Figures 1A,B) (19, 20). MYBL2 was more highly expressed in high grade (Figure 1D, Supplementary Figure 1C) and late stage tumors (Figure 1E, Supplementary Figure 1D) (16). To validate these findings, we performed RT-qPCR analysis of MYBL2 expression on our independently collected set of clinical HGSOC tumor samples. This retrospective investigation utilized tissue banked surgical pathology and cytology samples that were taken from 57 HGSOC lesions collected between November 2000, and April 2017. Demographic and disease data were obtained by chart review by an investigator blinded to the primary research question. Clinical data were available for 52 of the 57 analyzed tumor tissue samples. The clinical characteristics of these patients are described in Table 1. A panel of housekeeping control genes (18S, actin, GAPDH) were directly compared across 3 samples to determine which yields the most consistent results across tumor samples (data not shown) (21, 22). This led us to proceed with 18S ribosomal RNA as our housekeeping control.
TCGA analysis showed genetic alterations resulting in aberrantly high expression of MYBL2 in ~55% of HGSOC cases. In our study population, 51% of samples had MYBL2 expression levels greater than that of two adjacent normal-like tissue samples (Supplementary Figure 1E). MYBL2 expression did not impact overall survival in our patient cohort which may, in part, be attributable to the modest sample size (Supplementary Figure 1F). Since multiple independent sets of cDNA were prepared, MYBL2 expression was also used compared across batches of RNA to validate reproducibility (Supplementary Figure 2).
We observed variable expression across the HGSOC cases (Supplementary Figure 1E). We compared MYBL2 expression across transcriptional subtypes with TCGA and found the highest expression in the proliferative subtype (Figure 2A). MYBL2 was significantly highly expressed in the proliferative subtype as compared with the differentiated subtype (p = 1.51E-8), which had the lowest expression. The immunoreactive subtype, with the second highest MYBL2 expression, also exhibited significantly higher MYBL2 expression as compared with the differentiated subtype (p = 1.208E-7) but did not differ from that in the proliferative subtype (p = 0.98; Figure 2B). Interestingly, high MYBL2 expression was associated with poor overall survival in the proliferative subtype (log-rank p = 0.017; Figure 2C), similar to the effect observed in HGSOC collectively (Figure 1B).
To further understand MYBL2 expression by subtype, we applied histological classification of tumor samples. Tissue classified as solid and proliferative subtype exhibited significantly higher MYBL2 expression as compared with the papilloglandular subtype (Figures 3A–C). The solid and proliferative subtype was previously not found to have a significant overlap in gene expression signature with the TCGA transcriptional subtypes and had no impact on overall survival (17, 23). MYBL2 was highly expressed in the proliferative transcriptional subtype (Figures 2A,B) as well as tumors with morphological features consistent with cell proliferation (solid and proliferative histological subtype) (Figures 3B,C). Of note, there were no cases of the immune reactive histological subtype among our 52 clinical HGSOC tumor samples (Figure 3D). P53 expression by immunohistochemical staining confirmed aberrant expression in 40 of 49 samples. Of the 9 tumors showing wild-type expression, two had morphologic features consistent with high-grade endometrioid and clear cell carcinoma.
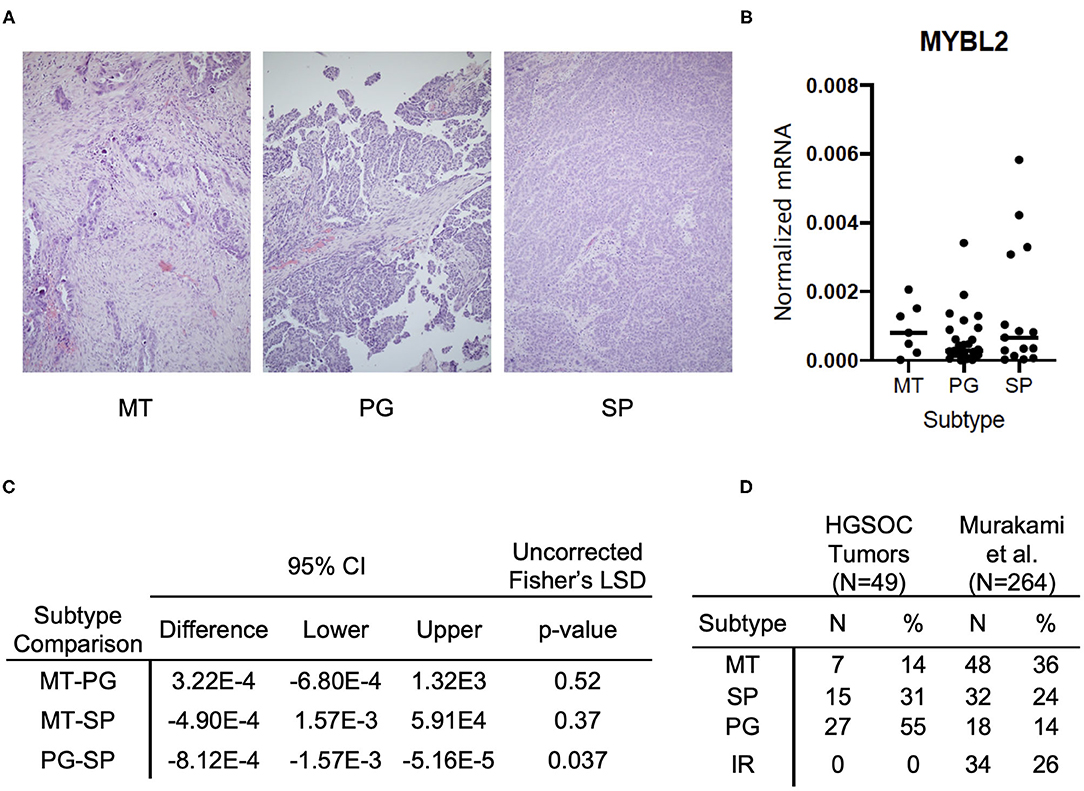
Figure 3. MYBL2 expression varies by histological subtype and is associated with morphological evidence of cell proliferation. (A) Representative H&E sections of respective histological subtypes at 4× magnification. (MT) Mesenchymal Transition subtype characterized by prominent desmoplastic reaction (N = 7). (PG) Papilloglandular subtype with predominance of papillary architecture (N = 27). (SP) Solid and Proliferative subtype characterized by solid tumor nests with rounded contours (N = 15). The immune reactive (IR) subtype, defined by rounded contours and infiltrative lymphocytes, was absent in our samples. (B) Graph shows comparison of MYBL2 expression across HGSOC primary tumor samples (N = 49) grouped by histological subtype (C) Analysis of differential MYBL2 expression across histological subtypes. Uncorrected Fisher's least significant difference, p < 0.05. (D) Table showing distribution of samples across subtypes alongside those in the original study by Murakami et al.
Overall, we have shown that MYBL2 is highly expressed in HGSOC as would be predicted by its genetic alterations and have validated this finding in 3 independent data sets. We determined that MYBL2 is most highly expressed in the proliferative transcriptional subtype of TCGA HGSOC as well as the solid and proliferative histological subtype. Furthermore, high MYBL2 expression is associated with poor overall survival in HGSOC cases collectively as well as in the proliferative transcriptional subtype. MYBL2's high expression in both the proliferative transcriptional and solid and proliferative histological subtypes is consistent with B-Myb's known role in MMB complex formation and cell cycle progression. Given these findings, we next sought to further evaluate the mechanism by which B-Myb alters cell cycle regulation in HGSOC.
High B-Myb Expression Is Associated With the Expression of DREAM Target Genes
High B-Myb expression disrupts repressive DREAM complex formation in human cell lines. Our previous analysis of TCGA data supported our cellular model by showing that MYBL2 undergoes gene copy number gain in the majority of HGSOC tumor samples and, in turn, is associated with increased expression of DREAM and MMB target genes (7). We sought to validate these findings with clinical specimens and further characterize DREAM as well as MMB functional status in HGSOC tumors. To this end, we assessed the expression of DREAM and MMB controlled genes as a functional readout for the status of these complexes (Figure 4A).
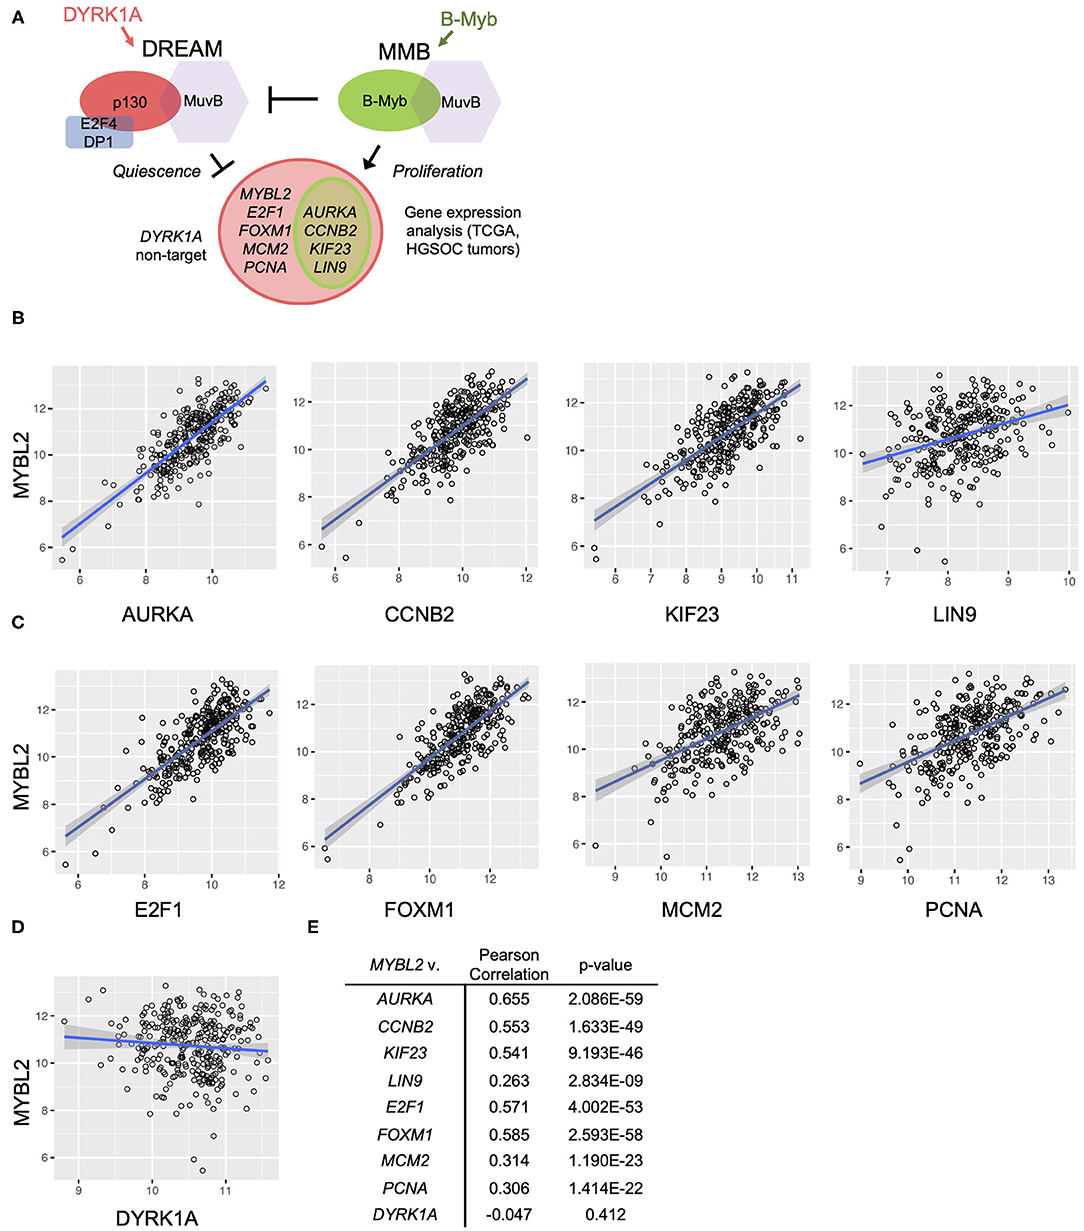
Figure 4. MYBL2 expression correlates with DREAM target gene expression in the TCGA data set. (A) Model for B-Myb-mediated DREAM disruption. High B-Myb levels promote DREAM disassembly and, in turn, expression of genes normally repressed by intact DREAM. Genes of interest are shown along with control non-DREAM target gene, DYRK1A. Expression of DREAM target genes serves as a functional readout for DREAM formation. (B,C) HGSOC TCGA gene expression data relating MYBL2 expression to DREAM (B) and DREAM/MMB (C) target genes as well as non-DREAM/MMB target control DYRK1A (D) (N = 303). (E) Results of TCGA Pearson correlations analyses and associated p-values.
The DREAM and MMB target genes for validation of our model were selected based on criteria of high differential gene expression in our previous analysis, established cell cycle role, and clinical interest. Using existing databases for DREAM and MMB target genes, we verified that our selections were indeed annotated targets (24). These steps collectively yielded the following genes of interest: MYBL2, PCNA, MCM2, AURKA (25), KIF23 (26), CCNB2 (27), LIN9 (28), E2F1 (29), and FOXM1 (30–35). Relevance of these genes in HGSOC pathogenesis, prognosis and treatment response provides the rationale for the studies described below.
FOXM1 was included in our study due to previously reported robust upregulation and potential prognostic role in HGSOC (6, 30, 35, 36). Aurora kinase A (AURKA) was also included since it was recently shown to modulate epithelial ovarian cancer cell adhesion and migration, in turn, promoting cancer cell dissemination. KIF23, a mitotic kinesin, was previously characterized as an MMB target gene important for tumorigenesis in an oncogenic K-RAS-driven mouse model of lung adenocarcinoma. Cyclin B2 (CCNB2) was further investigated since it appeared near the top of the list of differentially expressed genes in the presence of high B-Myb level, and transgenic mice expressing high levels of Cyclin B2 level are prone to tumor development (7). Another gene of interest, LIN9, is highly expressed in triple negative breast cancer and is associated with poor outcomes in this disease (28). Finally, E2F1 was included given its well-known role as a mediator of cell growth and its contribution to transcription of the matrix metalloproteases MMP2 and MMP9 that promote migration and invasion (29). We also included the DYRK1A gene because of the key role its product plays in the DREAM assembly. DYRK1A kinase phosphorylates MuvB component LIN52, a required step for DREAM complex assembly and factor in the mechanism of B-Myb-mediated DREAM disruption (7, 9). Although DYRK1A is a key component of the DREAM regulatory pathway, it is not subject to transcriptional regulation by MuvB-containing complexes making it a suitable experimental control (9). However, similarly to high B-Myb expression, the DYRK1A gene copy number loss, observed in 38% of HGSOC cases, could be another mechanism leading to decreased DREAM assembly.
To test the hypothesis that high expression of B-Myb is associated with decreased DREAM complex formation and a correspondent upregulation of DREAM targets, we compared the expression of MYBL2 and a panel of DREAM target genes described above, using the TCGA HGSOC data set (6). We simultaneously tested the impact of high MYBL2 expression on DREAM formation in our own set of patient-derived tumor samples. Additionally, as noted in Figure 4A, we included a number of genes that are regulated by both DREAM and MMB (AURKA, CCNB2, KIF23, LIN9) for which we anticipated similar findings as genes targeted only by DREAM.
In support of B-Myb-mediated DREAM disruption, Pearson correlation analysis revealed positive and significant correlations between expression of MYBL2 and each of the representative DREAM target genes in the TCGA data set (Figure 4B). The same analysis produced similar findings in the DREAM/MMB target genes (Figure 4C, normalized expression values for individual genes in Supplementary Figure 3). The expression of non-DREAM target DYRK1A did not significantly correlate with MYBL2 expression (r = −0.047, p = 0.41; Figures 4D,E). RT-qPCR analysis of DREAM target genes from our patient-derived HGSOC tumor samples produced positive and significant correlations between MYBL2 and all of the selected DREAM and DREAM/MMB target genes, with the exception of LIN9: LIN9 (ρ = 0.259, p = 0.055), AURKA (ρ = 0.411, p < 0.01), KIF23 (ρ = 0.495, p < 0.001), CCNB2 (ρ = 0.328, p < 0.05), E2F1 (ρ = 0.392, p < 0.01), and FOXM1 (ρ = 0.503, p < 0.001; Figures 5A,B). Whereas, LIN9 and MYBL2 expression were not correlative in our patient samples, LIN9 did significantly correlate with MYBL2 expression in the TCGA data (r = 0.263, p = 2.834E-09), albeit weakly relative to the rest of the genes (Figures 4B, 5A). Similar to our previous analysis (Figure 4D), DYRK1A expression did not significantly correlate with that of MYBL2 (p = 0.043, p = 0.75; Figures 5C,D). Collectively, these data support our model, as evidenced by the expression of DREAM and DREAM/MMB target genes positively correlating with MYBL2 expression. These data suggest a possible MYBL2 amplification gene expression signature characterized by de-repression of DREAM target promoters.
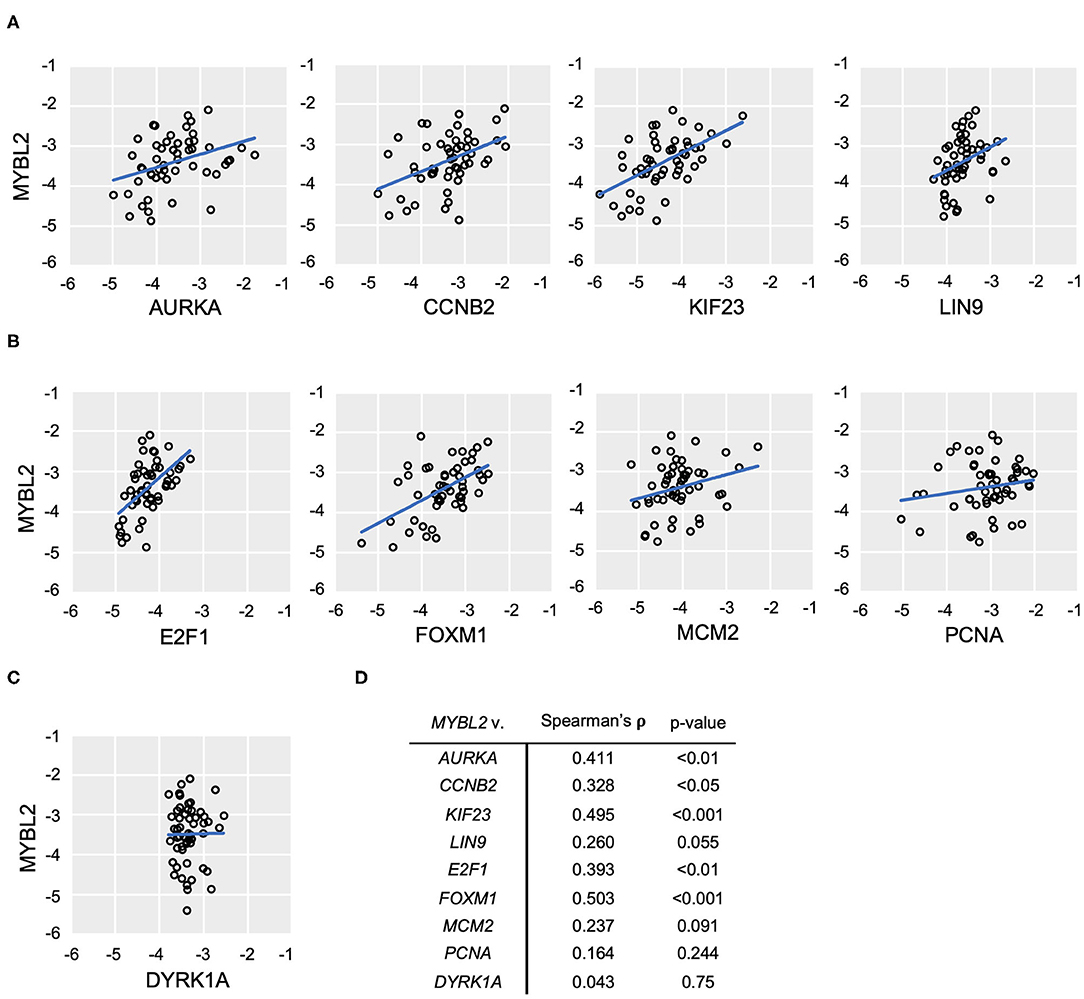
Figure 5. MYBL2 expression correlates with DREAM target gene expression. (A–C) RT-qPCR analysis of human ovarian tumor surgical sections (N = 52). As in Figure 4, expression of DREAM (A) and DREAM/MMB (B) target genes is shown relative to that of MYBL2 as well as non-DREAM/MMB target, DYRK1A. Plots show log10 mRNA expression relative to 18S ribosomal RNA housekeeping control. (C) Non-parametric Spearman Rank Correlations were used for analysis. (D) Results of non-parametric Spearman's rho and associated p-values.
Since B-Myb expression correlated with a subset of clinically relevant DREAM target genes, we then investigated whether this relationship holds true across all DREAM target genes. Using a recently updated list of annotated DREAM target genes, we performed Pearson correlation analysis of the sample-specific enrichment scores in DREAM target genes (single-cell GSEA, see Methods) with MYBL2 expression in TCGA data (24). Consistent with our single gene analyses, MYBL2 expression was positively and significantly correlated with the collective DREAM expression signature (N = 303, r = 0.6, p < 0.01), suggesting that B-Myb expression may serve as a surrogate marker for DREAM status in HGSOC (Figure 6A). Expression of the DREAM signature was also associated with decreased overall survival (log-rank p = 0.013; Figure 6B). Taken together, these findings argue that there is a mechanistic relationship between B-Myb and DREAM. Each may serve as prognostic markers in HGSOC and B-Myb may have prognostic significance independent of its cell cycle effects.
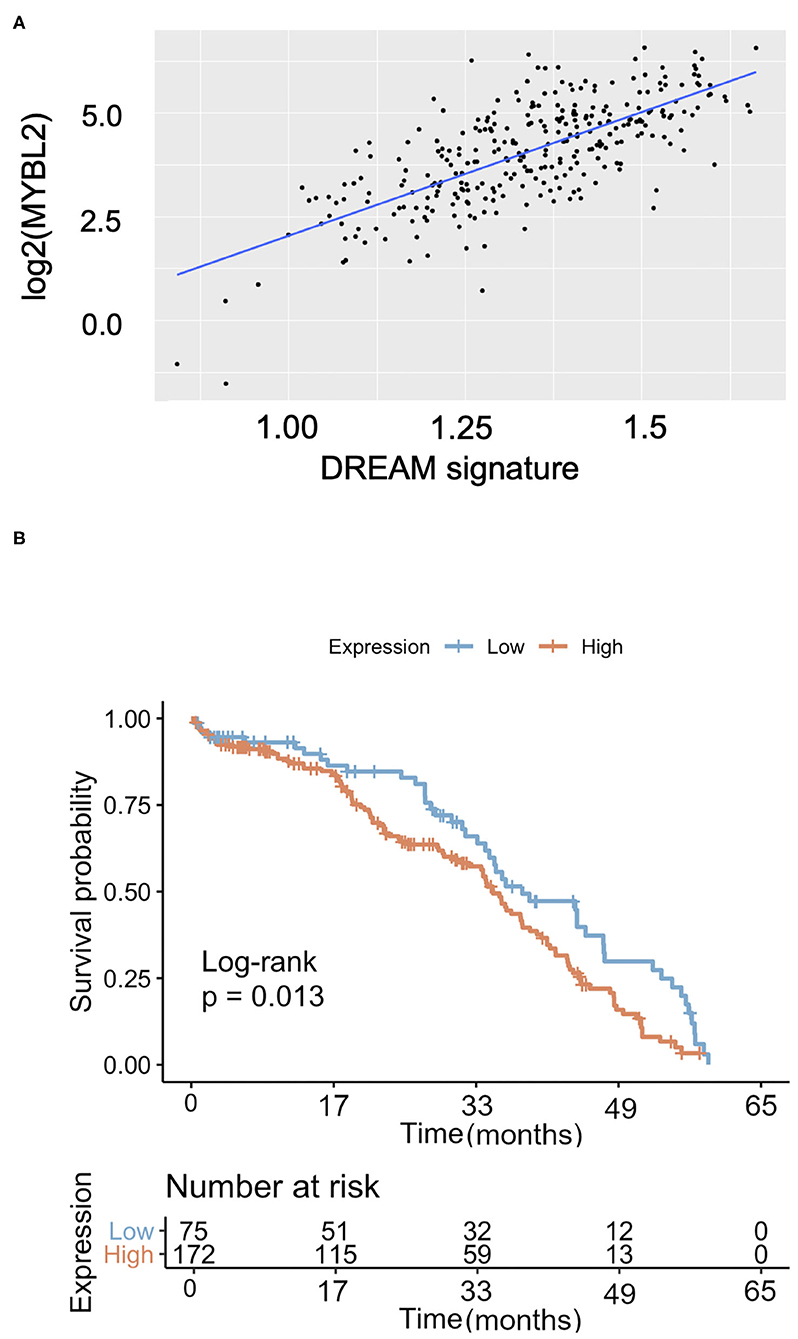
Figure 6. The DREAM transcriptional signature in HGSOC. (A) MYBL2 expression is positively and significantly correlated with global expression of annotated DREAM target genes [as described in Fischer et al. (24) NAR 2016] in TCGA HGSOC samples (N = 303, Pearson correlation = 0.6, p < 0.0001). (B) Kaplan Meier survival curve according to DREAM transcriptional signature expression (N = 303).
Discussion
We demonstrated that increased expression of selected cell cycle genes correlates with expression of DREAM and MMB-regulated genes in HGSOC tissue. High expression of MYBL2 is associated with deregulated cell cycle gene expression programs in HGSOC, suggesting that it may play an important role in the pathogenesis and clinical outcomes of patients. Though the mechanism for which B-Myb confers a poor prognosis is not fully understood, high B-Myb expression contributes to DREAM disruption (7). This mechanism, in turn, suggests that the status of DREAM assembly and expression of DREAM-regulated genes might play a prognostic role in HGSOC as well. Interesting, both high B-Myb expression and expression of DREAM target genes were positively correlated and associated with poor overall survival (Figures 1B, 6B). These findings are counter to the role of the DREAM complex in maintaining cellular dormancy and, in turn, chemoresistance (12). B-Myb and DREAM status may have independent prognostic implications despite their mechanistic relationship at the cellular level. However, a positive correlation between MYBL2 and DREAM target gene expression despite variable degrees of MYBL2 expression was noted. A limitation to this study is the direct comparison between DREAM target gene expression and survival in our independent patient cohort. Larger studies would clarify the clinical prognostic value of the DREAM-regulated gene expression. This study is also operating on the premise that gene expression likely results in translation of functional protein, but does not validate this rationale with protein level studies. Additionally, it would be valuable to compare gene expression between HGSOC tumors and healthy control fallopian tube epithelial cells. This would allow improved definitions of “cutoff” points for “high” gene expression (21). Further correlation with p53 mutational status is also needed to explain the presence of wild-type expression seen in seven remaining tumors of our tumor samples. The presence of a truncating mutation, over interpretation of cytoplasmic staining, the presence of a mixed carcinoma, and tumor heterogeneity are possible explanations for a normal expression pattern.
We found that MYBL2 is upregulated in the proliferative subtype and in tumor tissue with histologic evidence of proliferation (Figures 2, 3). The lack of immune reactive histological subtype samples among our data set suggest potential demographic differences across patient populations or may be a result of limited number of available tissue samples. The proliferative subtype is genetically defined by high expression of proliferation markers, MCM2 and PCNA (6). Both of these markers are DREAM target genes and significantly correlate with MYBL2 expression (Figures 4C, 5B) (24). Their high expression, and co-expression with other DREAM targets, is consistent with a phenotype of DREAM disruption. Our findings may alternatively reflect a greater proportion of dividing cells in these samples compared with other subtypes. In this case, dividing cells will physiologically have less DREAM formation, leading to de-repression of MYBL2 (which is itself a DREAM target gene) and, in turn, more DREAM disruption. A positive feedback loop might be another factor driving the HGSOC proliferation alongside other mechanisms that increase B-Myb expression (such as genomic amplification) and supported by our subtype analysis (Figure 2) (7).
The status of DREAM assembly is of interest in relation to the FoxM1 transcription factor network, which is activated in >84% of HGSOC cases (6). Previous studies support FoxM1 upregulation through genomic amplification of FOXM1, inhibition of p53 and pRb, and E2F1 activation. These previous studies, however, did not assess DREAM status (35). Our results support the model of DREAM disruption by high MYBL2 expression as another potential mechanism driving FoxM1 activity. MYBL2 and FOXM1 expression are upregulated in many p53 mutant cancers such as HGSOC (37, 38). Although the role of B-Myb and FoxM1 upregulation in cancer progression is not fully understood, high expression of these factors can contribute to abnormal mitosis and chromosomal instability (39). Furthermore, FOXM1 is also part of chromosomal instability transcriptional signatures (CIN70 and CIN25), characteristic of aneuploid tumors (40). Decreased B-Myb level results in lower expression of G2/M phase-expressed genes and mitotic arrest. Similarly, FoxM1 depletion results in delayed mitotic entry as well as defective mitosis and cytokinesis (41). The importance of FoxM1-MuvB to lung and breast cancer pathogenesis has been described, but further studies in HGSOC are needed to define the molecular mechanisms by which these transcription factors exert their unfavorable effects and assess the routes of potential therapeutic development (26, 42). This is particularly relevant in the context of response to chemotherapy as FoxM1 upregulates the expression of genes involved in DNA damage and repair pathways, contributing to treatment resistance (31–33).
Along with FOXM1, DREAM status also influences the expression of several other clinically relevant genes: AURKA (Aurora kinase A), CCNB2 (Cyclin B2), KIF23, and LIN9. The therapeutic potential of Aurora kinase A inhibitor-taxane combination treatment is being explored through orthotopic xenograft models (25). This approach might indirectly influence the actions of Cyclin B2. One proposed mechanism for Cyclin B2's tumorigenic properties is by promoting aneuploidy through stimulating Polo-like kinase 1 activation in an Aurora kinase A-dependent manner (27). Depletion of KIF23 is also suggested as another potential cancer therapeutic approach for lung adenocarcinoma (26). Finally, may provide the opportunity for more targeted treatment since the function of an experimental class of mitotically-active drugs, bromodomain and extraterminal protein inhibitors (BETi), is linked with LIN9 expression, suggesting that patients with high LIN9 expression may be more responsive to this treatment (28).
Our findings collectively suggest potential therapeutic angles for restoring cell cycle control in HGSOC. Though DREAM is implicated in harboring disease recurrence (12), inhibition of B-Myb and, in turn, restoration of DREAM assembly by CDK inhibition may of therapeutic value for the proliferative subtype of HGSOC as well as in cases of FOXM1 (12% of cases) or MYBL2 (55% of cases) gains (35). Increased DREAM formation may curb the pathogenic mechanisms enacted by FoxM1 (6, 35). This strategy might have secondary effects of repressing DNA damage repair genes, sensitizing cells to PARP inhibitors, (33) and enhancing responses to paclitaxel and platinum agents in chemotherapy-resistant disease (34).
In conclusion, we propose a mechanism by which high MYBL2 expression is associated with poor prognosis through DREAM disruption in HGSOC patients. Targeting and inhibiting B-Myb may be a viable treatment option for selected patients. Furthermore, given that B-Myb expression levels are often increased in HGSOC, and its prominent cell cycle effects, it is worthwhile to investigate B-Myb's potential as a predictive or functional biomarker in HGSOC transcriptional subtypes.
Data Availability Statement
Publicly available datasets were analyzed in this study. This data can be found at: https://www.cancer.gov/about-nci/organization/ccg/research/structural-genomics/tcga.
Ethics Statement
The studies involving human participants were reviewed and approved by Virginia Commonwealth University IRB. The patients/participants provided their written informed consent to participate in this study.
Author Contributions
AI, ST, and LL designed the study. AI and LL wrote the manuscript. AI performed experiments and analyzed data. AI, LR, JC, SM, and MD analyzed gene expression and survival data. AI, SM, MD, and LL prepared figures. SS and RP reviewed histological samples. ST, MD, SS, and RP edited the manuscript. All authors contributed to the article and approved the submitted version.
Funding
This project was supported in part by R01CA188571 (LL), The C. Kenneth and Dianne Wright Fellowship for Translational Research and F30CA221004 (AI). Human tissues, patient consents, and clinical data were provided by the VCU Tissue and Data Acquisition and Analysis Core (TDAAC) Facility, supported, in part, with the funding from NIH-NCI Cancer Center Core Support Grant P30 CA016059, as well as through the Department of Pathology, School of Medicine, and Massey Cancer Center of Virginia Commonwealth University.
Conflict of Interest
The authors declare that the research was conducted in the absence of any commercial or financial relationships that could be construed as a potential conflict of interest.
Acknowledgments
We acknowledge Cora Uram-Tuculescu and Pamela J. Grizzard for help with preparation of tissue samples, and Sophia Gruszecki for technical assistance.
Supplementary Material
The Supplementary Material for this article can be found online at: https://www.frontiersin.org/articles/10.3389/fonc.2021.637193/full#supplementary-material
References
1. Kurman RJ, Shih IM. The origin and pathogenesis of epithelial ovarian cancer-a proposed unifying theory. Am J Surg Pathol. (2010) 34:433–43. doi: 10.1097/PAS.0b013e3181cf3d79
2. Jemal A, Siegel R, Xu J, Ward E. Cancer statistics 2010. CA Cancer J Clin. (2010) 60:277–300. doi: 10.3322/caac.20073
3. Musa J, Aynaud MM, Mirabeau O, Delattre O, Grunewald TG. MYBL2 (B-Myb): a central regulator of cell proliferation, cell survival and differentiation involved in tumorigenesis. Cell Death Dis. (2017) 8:e2895. doi: 10.1038/cddis.2017.244
4. Allegra CJ, Aberle DR, Ganschow P, Hahn SM, Lee CN, Millon-Underwood S, et al. National institutes of health state-of-the-science conference statement: diagnosis and management of ductal carcinoma in situ september 22-24, 2009. J Natl Cancer Inst. (2010) 102:161–9. doi: 10.1093/jnci/djp485
5. Solin LJ, Gray R, Baehner FL, Butler SM, Hughes LL, Yoshizawa C, et al. A multigene expression assay to predict local recurrence risk for ductal carcinoma in situ of the breast. J Natl Cancer Inst. (2013) 105:701–10. doi: 10.1093/jnci/djt067
6. Cancer Genome Atlas Research Network. Integrated genomic analyses of ovarian carcinoma. Nature. (2011) 474:609–15. doi: 10.1038/nature10166
7. Iness AN, Felthousen J, Ananthapadmanabhan V, Sesay F, Saini S, Guiley KZ, et al. The cell cycle regulatory DREAM complex is disrupted by high expression of oncogenic B-Myb. Oncogene. (2019) 38:1080–92. doi: 10.1038/s41388-018-0490-y
8. Litovchick L, Sadasivam S, Florens L, Zhu X, Swanson SK, Velmurugan S, et al. Evolutionarily conserved multisubunit RBL2/p130 and E2F4 protein complex represses human cell cycle-dependent genes in quiescence. Mol Cell. (2007) 26:539–51. doi: 10.1016/j.molcel.2007.04.015
9. Litovchick L, Florens L, Swanson SK, Washburn MP, DeCaprio JA. DYRK1A protein kinase promotes quiescence and senescence through DREAM complex assembly. Genes Dev. (2011) 25:801–13. doi: 10.1101/gad.2034211
10. Sadasivam S, Duan S, DeCaprio JA. The MuvB complex sequentially recruits B-Myb and FoxM1 to promote mitotic gene expression. Genes Dev. (2012) 26:474–89. doi: 10.1101/gad.181933.111
11. Iness AN, Litovchick L. MuvB: a key to cell cycle control in ovarian cancer. Front Oncol. (2018) 8:223. doi: 10.3389/fonc.2018.00223
12. MacDonald J, Ramos-Valdes Y, Perampalam P, Litovchick L, DiMattia GE, Dick FA. A systematic analysis of negative growth control implicates the dream complex in cancer cell dormancy. Mol Cancer Res. (2017) 15:371–81. doi: 10.1158/1541-7786.MCR-16-0323-T
13. Schade AE, Fischer M, DeCaprio JA. RB, p130 and p107 differentially repress G1/S and G2/M genes after p53 activation. Nucleic Acids Res. (2019) 47:11197–208. doi: 10.1093/nar/gkz961
14. Mihály Z, Kormos M, Lánczky A, Dank M, Budczies J, Szász MA, et al. A meta-analysis of gene expression-based biomarkers predicting outcome after tamoxifen treatment in breast cancer. Breast Cancer Res Treat. (2013) 140:219–32. doi: 10.1007/s10549-013-2622-y
15. Ganzfried BF, Riester M, Haibe-Kains B, Risch T, Tyekucheva S, Jazic I, et al. curatedOvarianData: clinically annotated data for the ovarian cancer transcriptome. Database. (2013) 2013:bat013. doi: 10.1093/database/bat013
16. Tothill RW, Tinker AV, George J, Brown R, Fox SB, Lade S, et al. Novel molecular subtypes of serous and endometrioid ovarian cancer linked to clinical outcome. Clin Cancer Res. (2008) 14:5198. doi: 10.1158/1078-0432.CCR-08-0196
17. Murakami R, Matsumura N, Mandai M, Yoshihara K, Tanabe H, Nakai H, et al. Establishment of a novel histopathological classification of high-grade serous ovarian carcinoma correlated with prognostically distinct gene expression subtypes. Am J Pathol. (2016) 186:1103–13. doi: 10.1016/j.ajpath.2015.12.029
18. Rhodes DR, Yu J, Shanker K, Deshpande N, Varambally R, Ghosh D, et al. ONCOMINE: a cancer microarray database and integrated data-mining platform. Neoplasia. (2004) 6:1–6. doi: 10.1016/S1476-5586(04)80047-2
19. Bonome T, Levine DA, Shih J, Randonovich M, Pise-Masison CA, Bogomolniy F, et al. A gene signature predicting for survival in suboptimally debulked patients with ovarian cancer. Cancer Res. (2008) 68:5478–86. doi: 10.1158/0008-5472.CAN-07-6595
20. Mok SC, Bonome T, Vathipadiekal V, Bell A, Johnson ME, Park D-C, et al. A gene signature predictive for outcome in advanced ovarian cancer identifies a survival factor: microfibril-associated glycoprotein 2. Cancer Cell. (2009) 16:521–32. doi: 10.1016/j.ccr.2009.10.018
21. Li YL, Ye F, Hu Y, Lu WG, Xie X. Identification of suitable reference genes for gene expression studies of human serous ovarian cancer by real-time polymerase chain reaction. Anal Biochem. (2009) 394:110–6. doi: 10.1016/j.ab.2009.07.022
22. Berchuck A, Iversen ES, Lancaster JM, Pittman J, Luo J, Lee P, et al. Patterns of gene expression that characterize long-term survival in advanced stage serous ovarian cancers. Clin Cancer Res. (2005) 11:3686–96. doi: 10.1158/1078-0432.CCR-04-2398
23. Murakami R, Matsumura N, Michimae H, Tanabe H, Yunokawa M, Iwase H, et al. The mesenchymal transition subtype more responsive to dose dense taxane chemotherapy combined with carboplatin than to conventional taxane and carboplatin chemotherapy in high grade serous ovarian carcinoma: a survey of Japanese gynecologic oncology group study (JGOG3016A1). Gynecol Oncol. (2019) 153:312–9. doi: 10.1016/j.ygyno.2019.02.010
24. Fischer M, Grossmann P, Padi M, DeCaprio JA. Integration of TP53, DREAM, MMB-FOXM1 and RB-E2F target gene analyses identifies cell cycle gene regulatory networks. Nucleic Acids Res. (2016) 44:6070–86. doi: 10.1093/nar/gkw523
25. Madalinska JB, Hollenstein J, Bleiker E, Beurden Mv, Valdimarsdottir HB, Massuger LF, et al. Quality-of-life effects of prophylactic salpingo-oophorectomy versus gynecologic screening among women at increased risk of hereditary ovarian cancer. J Clin Oncol. (2005) 23:6890–8. doi: 10.1200/JCO.2005.02.626
26. Iltzsche F, Simon K, Stopp S, Pattschull G, Francke S, Wolter P, et al. An important role for Myb-MuvB and its target gene KIF23 in a mouse model of lung adenocarcinoma. Oncogene. (2017) 36:110–21. doi: 10.1038/onc.2016.181
27. Nam HJ, Van Deursen JM. Cyclin B2 and p53 control proper timing of centrosome separation. Nature Cell Biol. (2014) 16:535–46. doi: 10.1038/ncb2952
28. Sahni JM, Gayle SS, Webb BM, Weber-Bonk KL, Seachrist DD, Singh S, et al. Mitotic vulnerability in triple-negative breast cancer associated with LIN9 is targetable with BET inhibitors. Cancer Res. (2017) 77:5395–408. doi: 10.1158/0008-5472.CAN-17-1571
29. Farra R, Dapas B, Grassi M, Benedetti F, Grassi G. E2F1 as a molecular drug target in ovarian cancer. Exp Opin Therap Targets. (2019) 23:161–4. doi: 10.1080/14728222.2019.1579797
30. Chen X, Muller GA, Quaas M, Fischer M, Han N, Stutchbury B, et al. The forkhead transcription factor FOXM1 controls cell cycle-dependent gene expression through an atypical chromatin binding mechanism. Mol Cell Biol. (2013) 33:227–36. doi: 10.1128/MCB.00881-12
31. Zona S, Bella L, Burton MJ, de Moraes GN, Lam EWF. FOXM1: an emerging master regulator of DNA damage response and genotoxic agent resistance. Biochim Biophys Acta. (2014) 1839:1316–22. doi: 10.1016/j.bbagrm.2014.09.016
32. Halasi M, Gartel AL. Suppression of FOXM1 sensitizes human cancer cells to cell death induced by DNA-damage. PLoS ONE. (2012) 7:e31761. doi: 10.1371/journal.pone.0031761
33. Fang P, Madden JA, Neums L, Moulder RK, Forrest ML, Chien J. Olaparib-induced adaptive response is disrupted by FOXM1 targeting that enhances sensitivity to PARP inhibition. Mol Cancer Res. (2018) 16:961–73. doi: 10.1158/1541-7786.MCR-17-0607
34. Westhoff GL, Chen Y, Teng NN. Targeting Foxm1 improves cytotoxicity of paclitaxel and cisplatinum in platinum-resistant ovarian cancer. Int J Gynecol Cancer. (2017) 27:1602–9. doi: 10.1097/IGC.0000000000001063
35. Barger CJ, Zhang W, Hillman J, Stablewski AB, Higgins MJ, Vanderhyden BC, et al. Genetic determinants of FOXM1 overexpression in epithelial ovarian cancer and functional contribution to cell cycle progression. Oncotarget. (2015) 6:27613. doi: 10.18632/oncotarget.4546
36. Jin C, Liu Z, Li Y, Bu H, Wang Y, Xu Y, et al. PCNA-associated factor P15PAF, targeted by FOXM1, predicts poor prognosis in high-grade serous ovarian cancer patients. Int J Cancer. (2018) 143:2973–84. doi: 10.1002/ijc.31800
37. Mannefeld M, Klassen E, Gaubatz S. B-MYB is required for recovery from the DNA damage-induced G2 checkpoint in p53 mutant cells. Cancer Res. (2009) 69:4073–80. doi: 10.1158/0008-5472.CAN-08-4156
38. Parikh N, Hilsenbeck S, Creighton CJ, Dayaram T, Shuck R, Shinbrot E, et al. Effects of TP53 mutational status on gene expression patterns across 10 human cancer types. J Pathol. (2014) 232:522–33. doi: 10.1002/path.4321
39. Pfister K, Pipka JL, Chiang C, Liu Y, Clark RA, Keller R, et al. Identification of drivers of aneuploidy in breast tumors. Cell Rep. (2018) 23:2758–69. doi: 10.1016/j.celrep.2018.04.102
40. Carter SL, Eklund AC, Kohane IS, Harris LN, Szallasi Z. A signature of chromosomal instability inferred from gene expression profiles predicts clinical outcome in multiple human cancers. Nat Genet. (2006) 38:1043–8. doi: 10.1038/ng1861
41. Sadasivam S, DeCaprio JA. The DREAM complex: master coordinator of cell cycle-dependent gene expression. Nat Rev Cancer. (2013) 13:585–95. doi: 10.1038/nrc3556
Keywords: MYBL2, DYRK1A, cancer genome atlas, protein complex, transcription, FoxM1, LIN9
Citation: Iness AN, Rubinsak L, Meas SJ, Chaoul J, Sayeed S, Pillappa R, Temkin SM, Dozmorov MG and Litovchick L (2021) Oncogenic B-Myb Is Associated With Deregulation of the DREAM-Mediated Cell Cycle Gene Expression Program in High Grade Serous Ovarian Carcinoma Clinical Tumor Samples. Front. Oncol. 11:637193. doi: 10.3389/fonc.2021.637193
Received: 02 December 2020; Accepted: 08 February 2021;
Published: 04 March 2021.
Edited by:
Seema Singh, Mitchell Cancer Institute, United StatesReviewed by:
Elena Gershtein, Russian Cancer Research Center NN Blokhin, RussiaYu Yu, Curtin University, Australia
Copyright © 2021 Iness, Rubinsak, Meas, Chaoul, Sayeed, Pillappa, Temkin, Dozmorov and Litovchick. This is an open-access article distributed under the terms of the Creative Commons Attribution License (CC BY). The use, distribution or reproduction in other forums is permitted, provided the original author(s) and the copyright owner(s) are credited and that the original publication in this journal is cited, in accordance with accepted academic practice. No use, distribution or reproduction is permitted which does not comply with these terms.
*Correspondence: Larisa Litovchick, bGFyaXNhLmxpdG92Y2hpY2tAdmN1aGVhbHRoLm9yZw==
†Present address: Jessica Chaoul, Department of Obstetrics and Gynecology, Icahn School of Medicine at Mount Sinai, New York City, NY, United States
 Audra N. Iness
 Lisa Rubinsak
 Steven J. Meas
 Jessica Chaoul
 Sadia Sayeed4,5
 Raghavendra Pillappa
 Sarah M. Temkin
 Mikhail G. Dozmorov
 Larisa Litovchick