
94% of researchers rate our articles as excellent or good
Learn more about the work of our research integrity team to safeguard the quality of each article we publish.
Find out more
ORIGINAL RESEARCH article
Front. Oncol. , 11 June 2021
Sec. Gastrointestinal Cancers
Volume 11 - 2021 | https://doi.org/10.3389/fonc.2021.635324
This article is part of the Research Topic Molecular Biomarkers for Gastric Cancer View all 36 articles
Background: Tumor-associated macrophages (TAMs) play a critical role in the progression of malignant tumors, but the detailed mechanism of TAMs in gastric cancer (GC) is still not fully explored.
Methods: We identified differentially expressed immune-related genes (DEIRGs) between GC samples with high and low macrophage infiltration in The Cancer Genome Atlas datasets. A risk score was constructed based on univariate Cox analysis and Lasso penalized Cox regression analysis in the TCGA cohort (n=341). The optimal cutoff determined by the 5-year time-dependent receiver operating characteristic (ROC) curve was considered to classify patients into groups with high and low risk. We conducted external validation of the prognostic signature in four independent cohorts (GSE84437, n=431; GSE62254, n=300; GSE15459, n=191; and GSE26901, n=109) from the Gene Expression Omnibus (GEO) database.
Results: The signature consisting of 7 genes (FGF1, GRP, AVPR1A, APOD, PDGFRL, CXCR4, and CSF1R) showed good performance in predicting overall survival (OS) in the 5 independent cohorts. The risk score presented an obviously positive correlation with macrophage abundance (cor=0.7, p<0.001). A significant difference was found between the high- and low-risk groups regarding the overall survival of GC patients. The high-risk group exhibited a higher infiltration level of M2 macrophages estimated by the CIBERSORT algorithm. In the five independent cohorts, the risk score was highly positively correlated with the stromal cell score, suggesting that we can also evaluate the infiltration of stromal cells in the tumor microenvironment according to the risk score.
Conclusion: Our study developed and validated a general applicable prognostic model for GC from the perspective of TAMs, which may help to improve the precise treatment strategy of GC.
Gastric cancer (GC), as one the most common malignant tumors, is the third leading cause of cancer death in the world (1). In recent years, with the progress and development of treatment methods, such as perioperative treatment and the application of targeted drugs, the survival time of patients with gastric cancer has been improved to some extent, but the overall prognosis is still unsatisfactory (2). In view of this, how to improve the overall survival of patients with gastric cancer is still a hot topic in the current research field.
The tumor microenvironment (TME) plays a critical role in tumorigenesis and development (3). Tumor-associated macrophages (TAMs), as an important component of the TME of malignant tumors (4), have been shown to have significant functions in the progression of malignant tumors, such as regulating the proliferation, invasion and metastasis of tumor cells (5–7). The degree of TAM infiltration is also directly related to the depth of tumor invasion, lymph node status and clinical stage of gastric cancer (8–10) and has become a new therapeutic target and prognostic indicator in the individualized treatment of gastric cancer. At present, the detailed mechanism of TAMs in gastric cancer is still not fully explored.
Effective prognosis evaluation is an important guarantee for the precise treatment of gastric cancer patients; however, the prognostic biomarkers that can be used in clinical practice are still limited to date. Considering the great potential of TAMs in prognosis assessment and precise targeting for gastric cancer treatment, the identification of specific markers of TAMs through high-throughput sequencing data may provide a valuable reference for new clinical diagnosis and treatment strategies of gastric cancer.
In this work, we explored the association between the infiltration abundance of macrophages and immune-related gene expression. Importantly, we constructed a prognostic model of gastric cancer based on seven immune genes related to macrophage infiltration and confirmed its prognostic value in different cohorts, which will help to formulate an individualized treatment plan for gastric cancer patients.
We first obtained the immune infiltration data of The Cancer Genome Atlas (TCGA) from Tumor IMmune Estimation Resource Web Server (TIMER, https://cistrome.shinyapps.io/timer/) (11, 12). Then, we downloaded the gene expression profiles and corresponding clinical information from The Cancer Genome Atlas (TCGA, https://portal.gdc.cancer.gov/). A total of 341 GC patients with complete data were included in this study. The immune-related gene list was acquired from the ImmPort database (https://immport.niaid.nih.gov). Next, we acquired the gene expression profiles and the clinical data of four independent cohorts (GSE84437, n=431; GSE62254, n=300; GSE15459, n=191; and GSE26901, n=109) from the Gene Expression Omnibus (GEO) database (https://www.ncbi.nlm.nih.gov/geo/). The batch effects in different datasets were removed by the “ComBat” function of the R package “sva” (13). We complied with the access rules of the corresponding database during the process of data acquisition. Approval from the local ethics committee was not needed in this work because the above data were acquired from public databases. The workflow of this study and the clinical information of the above 5 independent cohorts are shown in Figure 1 and Table 1, respectively.
A total of 341 GC patients were assigned to the high and low macrophage infiltration groups given the optimal cutoff value determined by X-title software (14), where the overall survival of the two groups was compared by Kaplan–Meier survival analysis. Statistical significance was set as a p value of the log rank test less than 0.05.
We extracted immune-related genes from the TCGA dataset and identified the differentially expressed immune-related genes (DEIRGs) between the high and low macrophage infiltration groups by the “limma” R package. A false discovery rate (FDR) of <.05 and log FC >1 were considered to be significant.
We carried out Gene Ontology (GO) functional annotation of the DEIRGs between the high and low macrophage infiltration groups by the R package “clusterProfile”, including cellular component (CC), molecular function (MF), and biological process (BP).
Univariate Cox regression analysis and Kaplan–Meier survival analysis were initially combined for the preliminary screening of prognosis-related immune genes (PRIGs). P<0.05 was considered to be significant. Afterwards, the least absolute shrinkage and selection operator (LASSO) algorithm was applied to reduce the scope of PRIGs. While the LASSO penalized Cox analysis was implemented, we subsampled the dataset 1000 times and selected the PRIGs over 900 repeated times. A subselection of PRIGs was detected as a result of a penalty proportional to their size to shrink the regression coefficient (15, 16). Genes with zero regression coefficients were excluded. After that, regression coefficients were applied to establish a prognostic risk score, which was derived from LASSO Cox regression analysis of each PRIG multiplied by the expression level of each PRIG. The GC patients were classified into low-risk and high-risk groups considering the optimal cutoff corresponding to the maximum AUC value of the 5-year time-dependent receiver operating characteristic (ROC) curve (17). The LASSO regression analysis was performed with the “glmnet” R package. Time-dependent ROC curves and Kaplan–Meier survival curves were generated with the R packages “survivalROC” and “survminer”. To test the independent prognostic value of the risk score, univariate and multivariate Cox regression analyses were carried out. The four independent cohorts (GSE84437, n=431; GSE62254, n=300; GSE15459, n=191; and GSE26901, n=109) were used for the external validation of the prognostic model’s performance.
The abundances of six immune infiltrates (B cells, CD4+ T cells, CD8+ T cells, neutrophils, macrophages, and dendritic cells) in samples in TCGA datasets were estimated by the TIMER algorithm. The relative proportions of 22 infiltrated immune cell types were quantified by the CIBERSORT algorithm for each sample (18, 19). P < 0.05 was used as the standard to filter the sample.
We calculated the StromalScore (which captures the presence of stroma in tumor tissue), ImmuneScore (which represents the infiltration of immune cells in tumor tissue), and ESTIMATEScore (which infers tumor purity) of the sample contained in the five independent cohorts based on the ESTIMATE (Estimation of STromal and Immune cells in MAlignant Tumor tissues using Expression data) algorithm using the R package “estimate”. We calculated the normalized enrichment score (NES) to quantify immune cell infiltration and immune function by single sample gene set enrichment analysis (ssGSEA) using the “GSVA” R package. Independent-samples t tests were used to compare the differences between the high- and low-risk groups, and p < 0.05 was suggested to indicate statistical significance.
We assessed the potential prognostic significance of immune cell infiltration for GC using the TIMER algorithm, and higher infiltration of macrophages was found to be associated with poor prognosis (Figure 2A). This provided an important basis for us to carry out subsequent research.
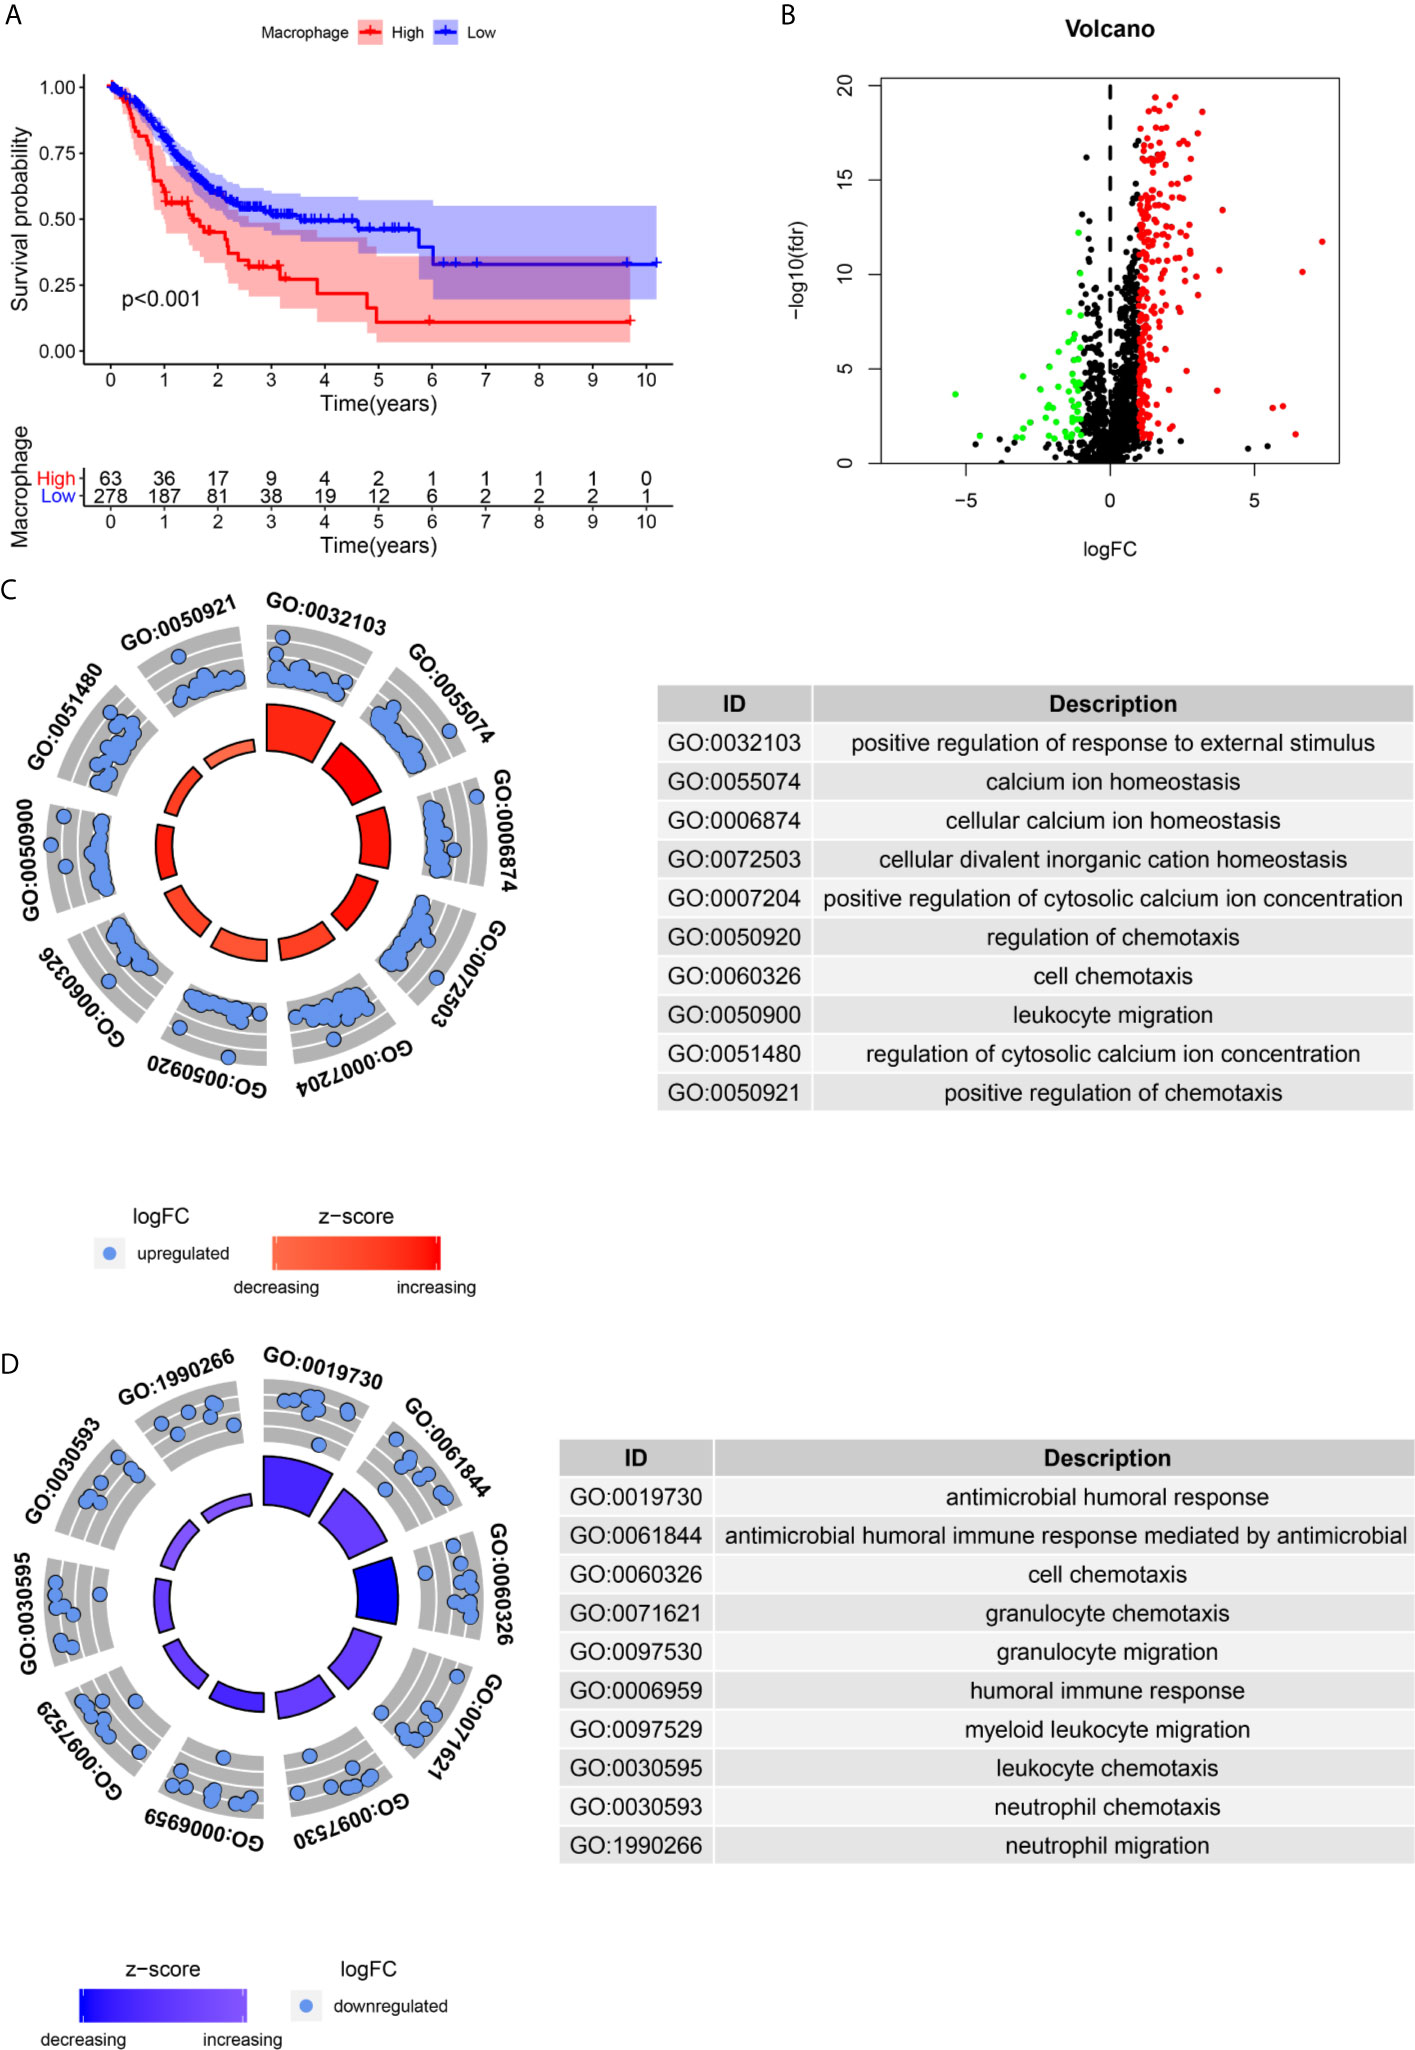
Figure 2 Identification of differential expressed immune-related genes(DEIRGs) associated with macrophage infiltration. (A) The high infiltration by Macrophages is unfavorable for the OS of GC. (B). The vol plot DEIRGs. (C) The circle plot of GO terms up-regulated in the high macrophage infiltration group. (D) The circle plot of GO terms up-regulated in the low macrophage infiltration group.
A total of 283 DEIRGs were identified by the Wilcox test in the “limma” R package (Figure 2B). A total of 234 genes were upregulated in the high macrophage infiltration group (log FC>1), and 49 genes were upregulated in the low macrophage infiltration group (log FC<-1) (Figure 2B).
The immune-related genes upregulated in the high macrophage infiltration group were mainly enriched in calcium ion homeostasis, cellular divalent inorganic cation homeostasis, receptor ligand activity, leukocyte migration, etc. (Figure 2C). The immune-related genes upregulated in the low macrophage infiltration group were mainly enriched in receptor ligand activity, cell chemotaxis, cytokine receptor binding, and antimicrobial humoral response (Figure 2D).
A total of 16 genes were selected as prognosis-related genes by univariate Cox regression analysis and Kaplan–Meier survival analysis (Figures 3A, B). LASSO Cox regression analysis was then applied to exclude genes that may be highly correlated with other genes (Figure 3C). We ultimately identified a 7-gene signature. The risk score = FGF1*0.1606 + GRP*0.0835 + AVPR1A*0.0316 + APOD*0.0024 + PDGFRL*0.0482 + CXCR4*0.0019 + CSF1R*0.0108. Patients were assigned into low-risk and high-risk groups according to the optimal cutoff of 1.784 determined by the 5-year ROC curve (Figures 3D, G). The results showed that the overall survival rate (OS) of the high-risk group was significantly lower than that of the low-risk group (Figure 3E). The area under the curve (AUC) values for the model predicting OS at 1, 3 and 5 years were 0.642, 0.645 and 0.672, respectively (Figure 3F). It is worth mentioning that the expression levels of 7 genes in the signature were positively correlated with macrophage abundance, as verified by Spearman correlation analysis (Figure 4), indicating that we could estimate the degree of macrophage infiltration in GC tissue according to the risk score. The risk of death of GC patients increased with the increasing risk score (Figures 5A, B). Then, we included the risk score and other clinical factors in univariate and multivariate Cox regression analyses, and the results showed that the risk score was an independent prognostic indicator (Figures 5C, D). The prognostic signature was applicable for GC patients in early and advanced stages (Figures 5E, F).
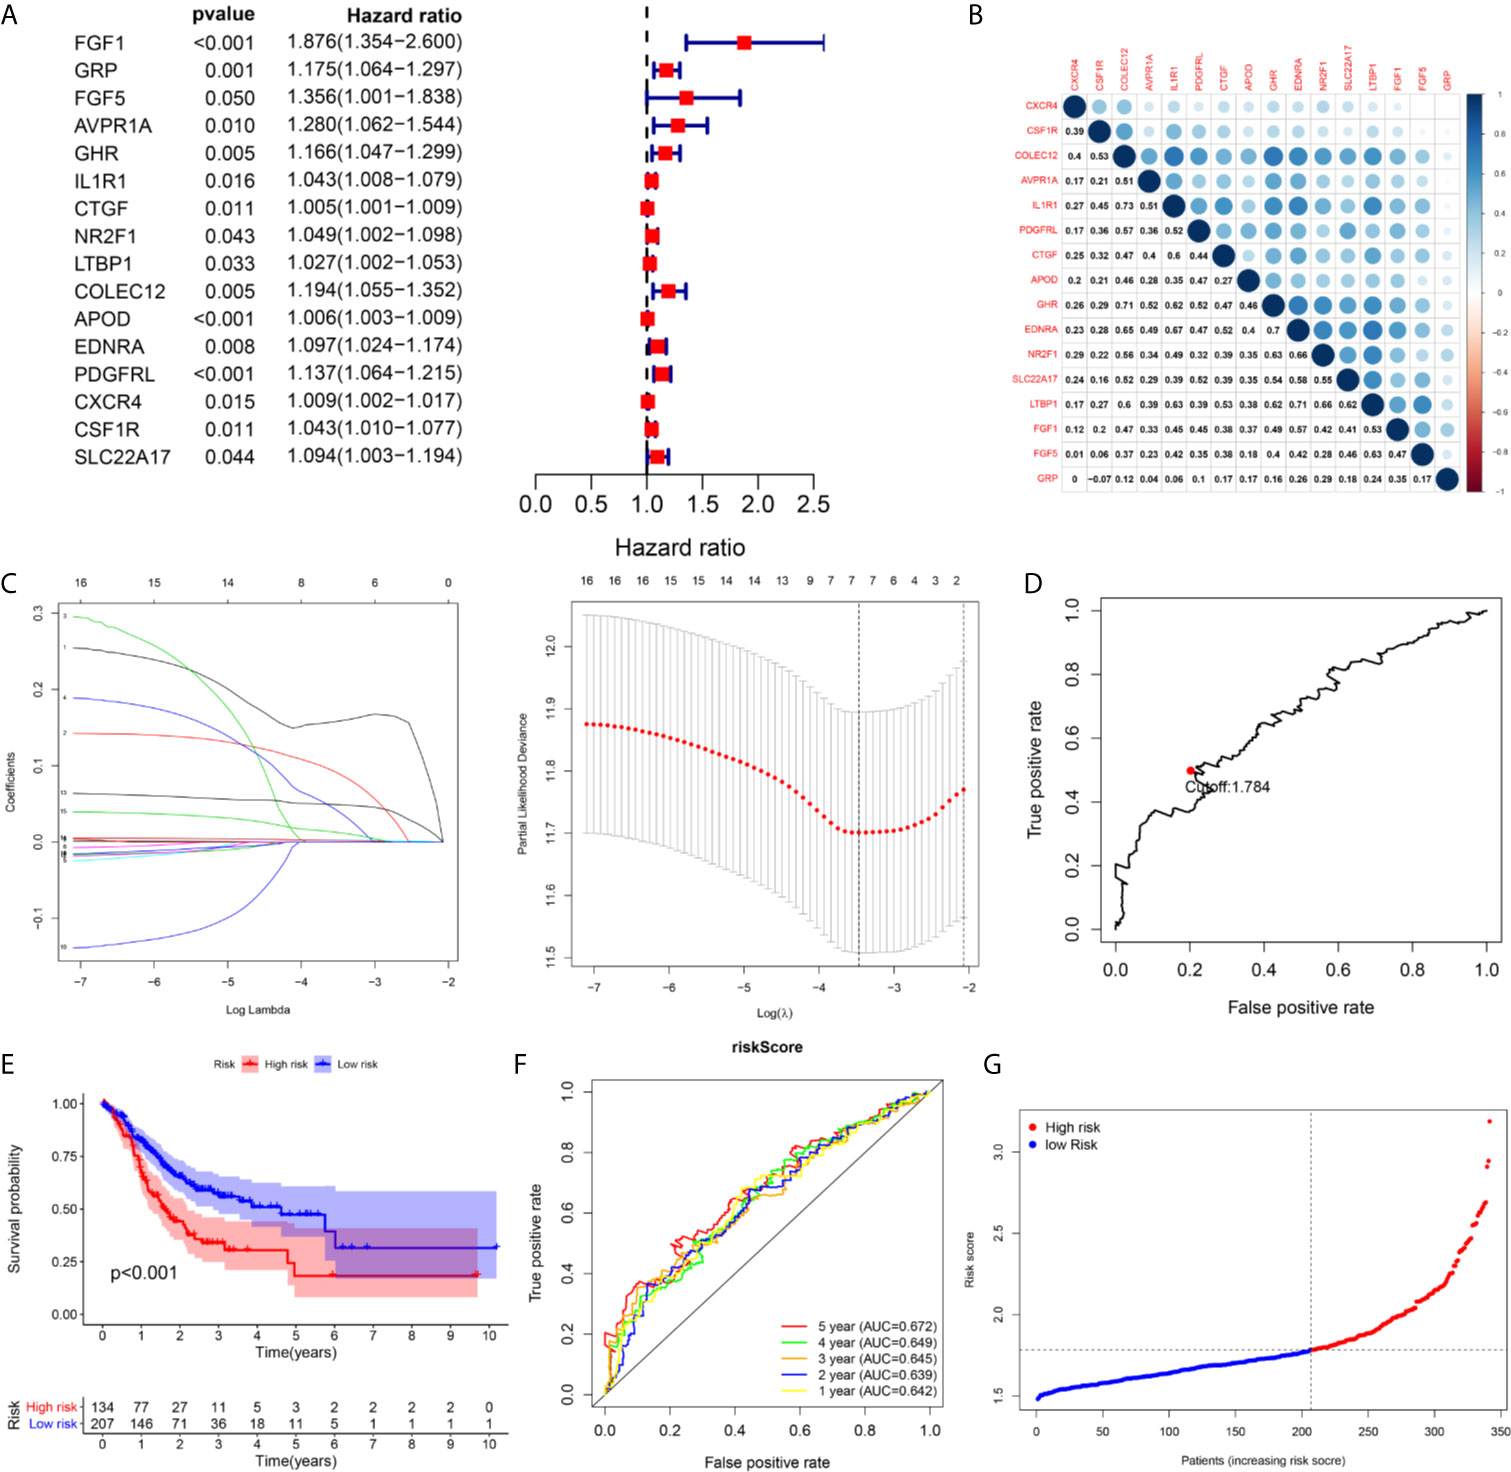
Figure 3 The building process of the seven immune gene prognostic signature in the TCGA cohort. (A) The forrest plot of the univariate Cox analysis. (B) The corrplot of the prognostic related genes. (C) Lasso penalized COX regression analysis. (D) The optimal cutoff determined by 5-year time-depend ROC curve. (E, F) The Kaplan–Meier survival analysis and time‑dependent ROC analysis of the signature for predicting the OS of patients in the TCGA cohort. (G) The risk score distribution of patients in in the TCGA cohort.
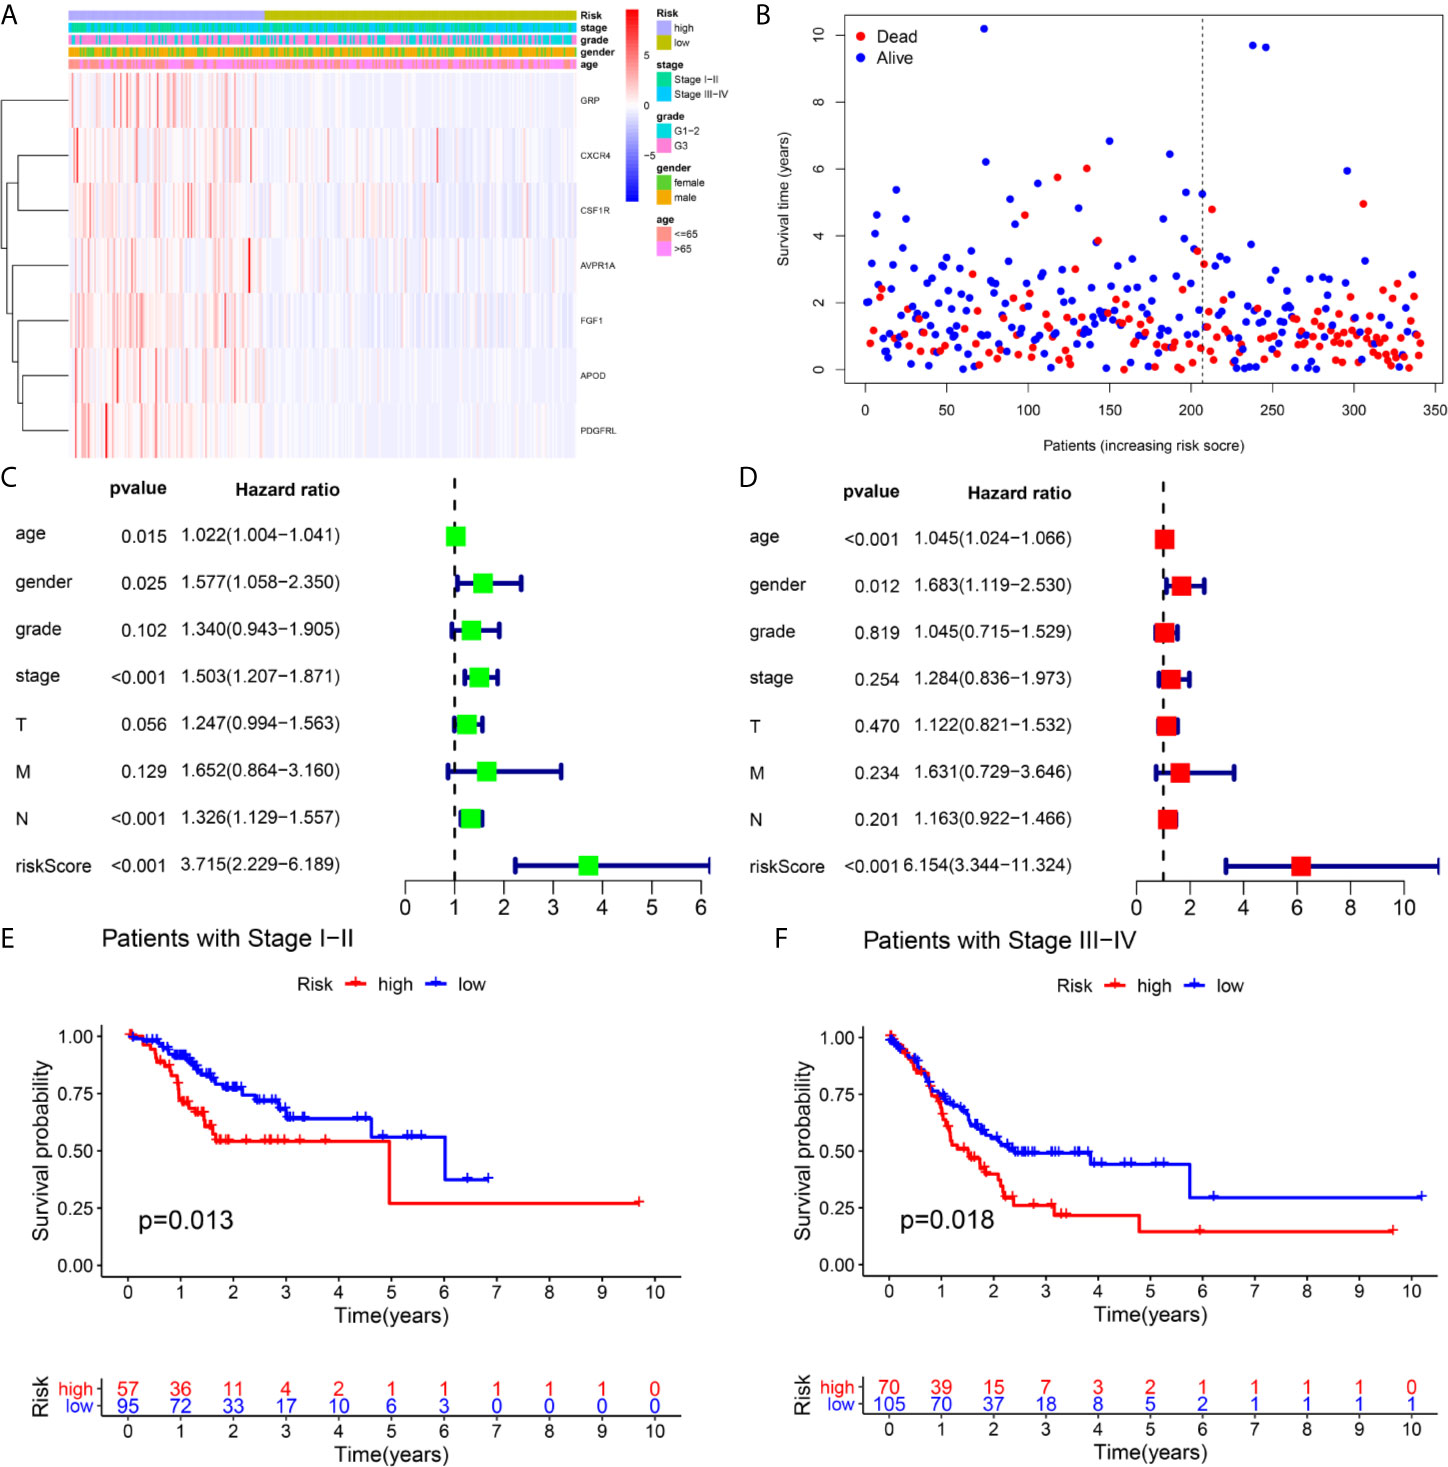
Figure 5 Independence validation of the risk score in the TCGA cohort. (A, B) The heatmap, and the survival status of patients in in the TCGA cohort. (C) The forrest plot of the univariate Cox analysis. (D) The forrest plot of the multivariate Cox analysis. (E, F) Subgroup validation based on the clinical stage.
We calculated the risk score of each sample in the four independent cohorts using the calculation formula derived from TCGA and assigned them into groups with a high risk or low risk based on the unified cutoff consistent with the TCGA cohort. The results of survival analysis revealed that the OS of patients in the high-risk group was significantly shorter than that in the low-risk group in each independent cohort (Figures 6A, D, G, J). In the GSE84437 cohort, the AUC values for the risk score predicting OS at 1, 3 and 5 years were 0.559, 0.598 and 0.601, respectively (Figure 6B). In the GSE62254 cohort, the AUC values for the risk score predicting OS at 1, 3 and 5 years were 0.616, 0.607 and 0.612, respectively (Figure 6E). In the GSE15459 cohort, the AUC values for the risk score predicting OS at 1, 3 and 5 years were 0.559, 0.613 and 0.640, respectively (Figure 6H). In the GSE26901 cohort, the AUC values for the risk score predicting OS at 1, 3 and 5 years were 0.688, 0.715 and 0.696, respectively (Figure 6K). The patients’s risk death was positively correlated with the risk score (Figures 6C, F, I, L). The results of univariate and multivariate Cox regression analysis confirmed that the risk score was an independent prognostic indicator in each independent cohort (Figures 7A–D). These results demonstrated the robustness of this prognostic model.
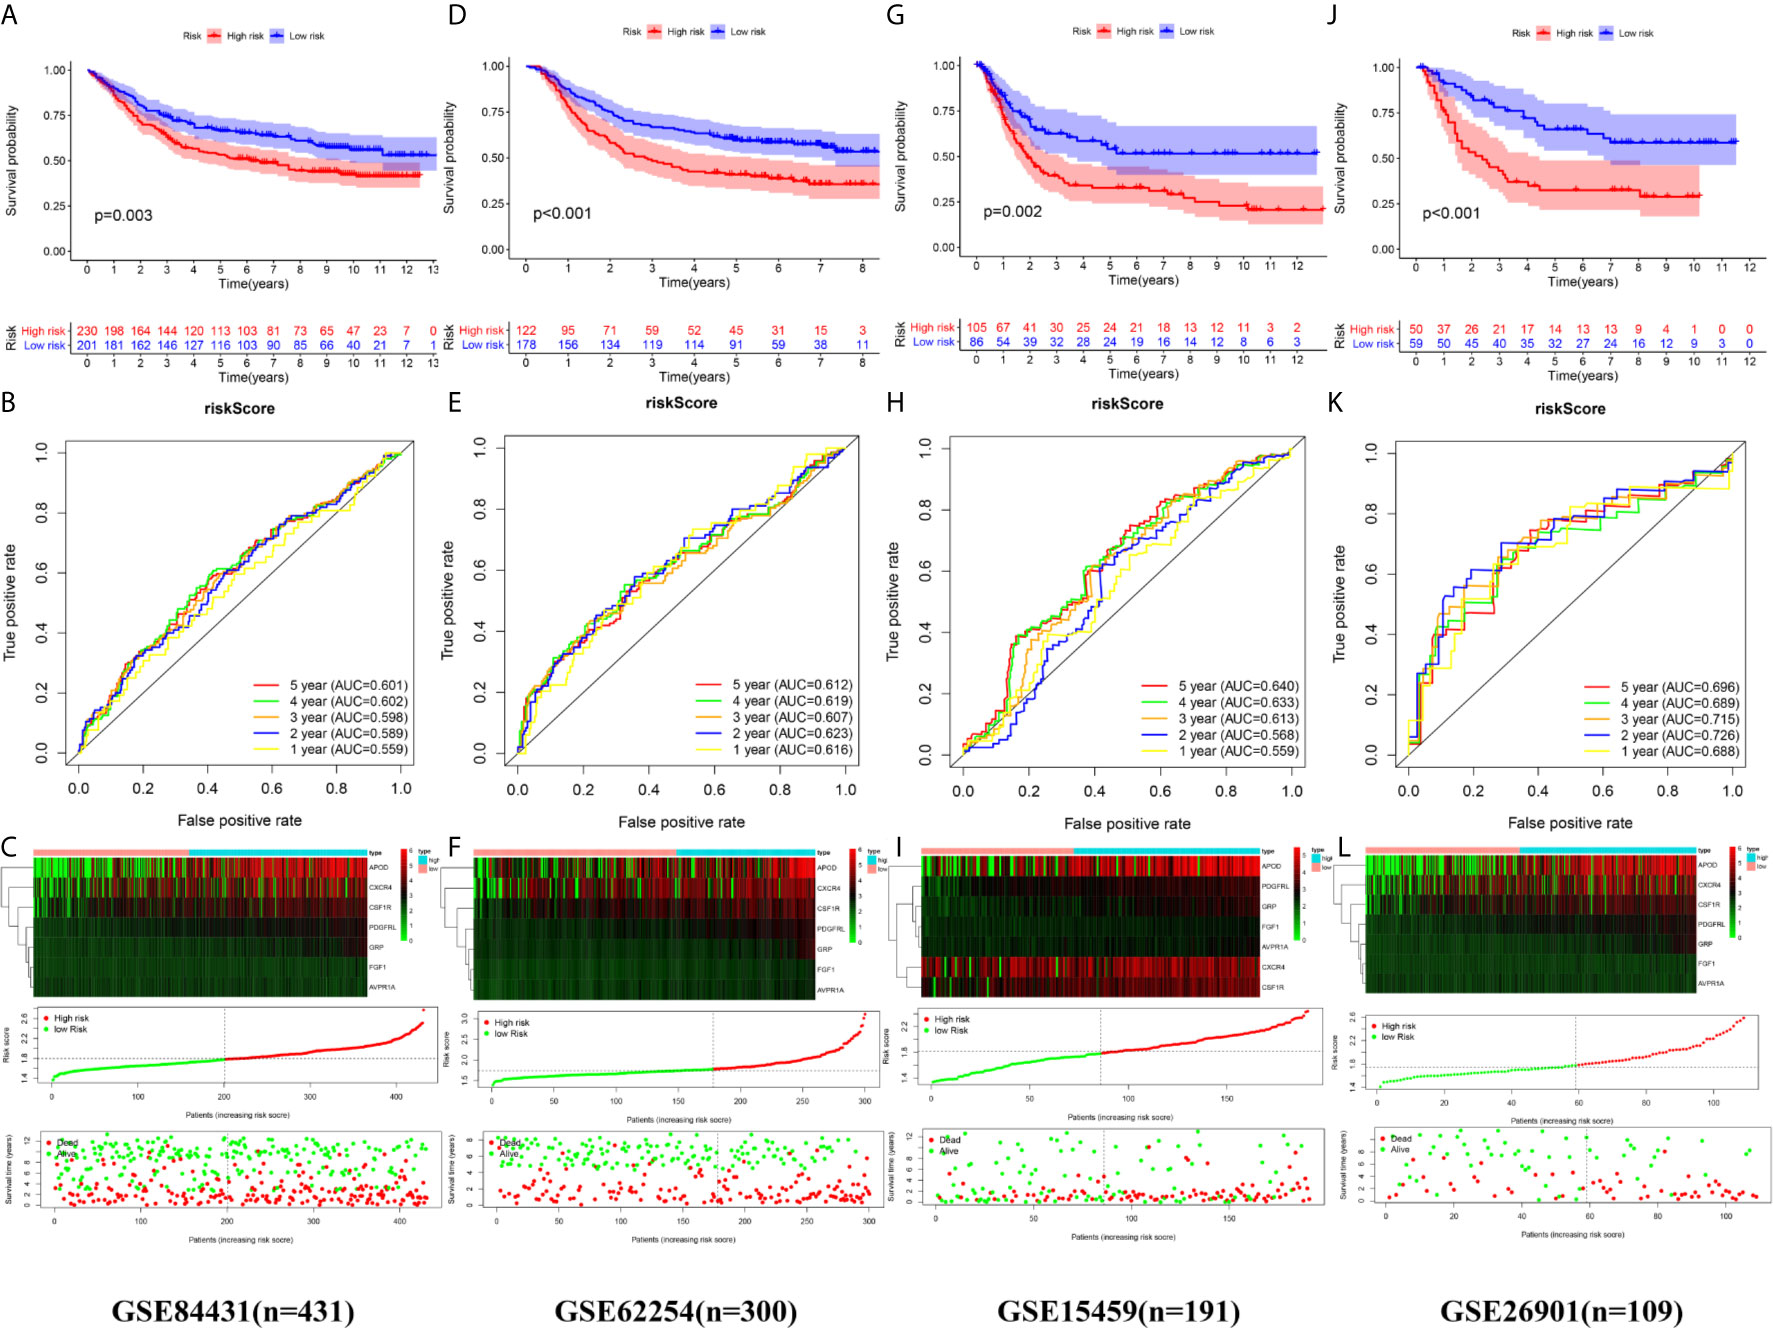
Figure 6 External validation of the prognostic model. (A, B) The Kaplan–Meier survival analysis and the time‑dependent ROC analysis of the signature for predicting the OS of patients in the GSE84437 cohort. (C) The heatmap, distribution of risk score, and the survival status of patients in in the GSE84437 cohort. (D, E) The Kaplan–Meier survival analysis and the time‑dependent ROC analysis of the signature for predicting the OS of patients in the GSE62254 cohort. (F) The heatmap, distribution of risk score, and the survival status of patients in in the GSE62254 cohort. (G, H) The Kaplan–Meier survival analysis and the time‑dependent ROC analysis of the signature for predicting the OS of patients in the GSE15459 cohort. (C) The heatmap, distribution of risk score, and the survival status of patients in in the GSE15459 cohort. (J, K) The Kaplan–Meier survival analysis and the time‑dependent ROC analysis of the signature for predicting the OS of patients in the GSE26901 cohort. (L) The heatmap, distribution of risk score, and the survival status of patients in in the GSE26901 cohort.
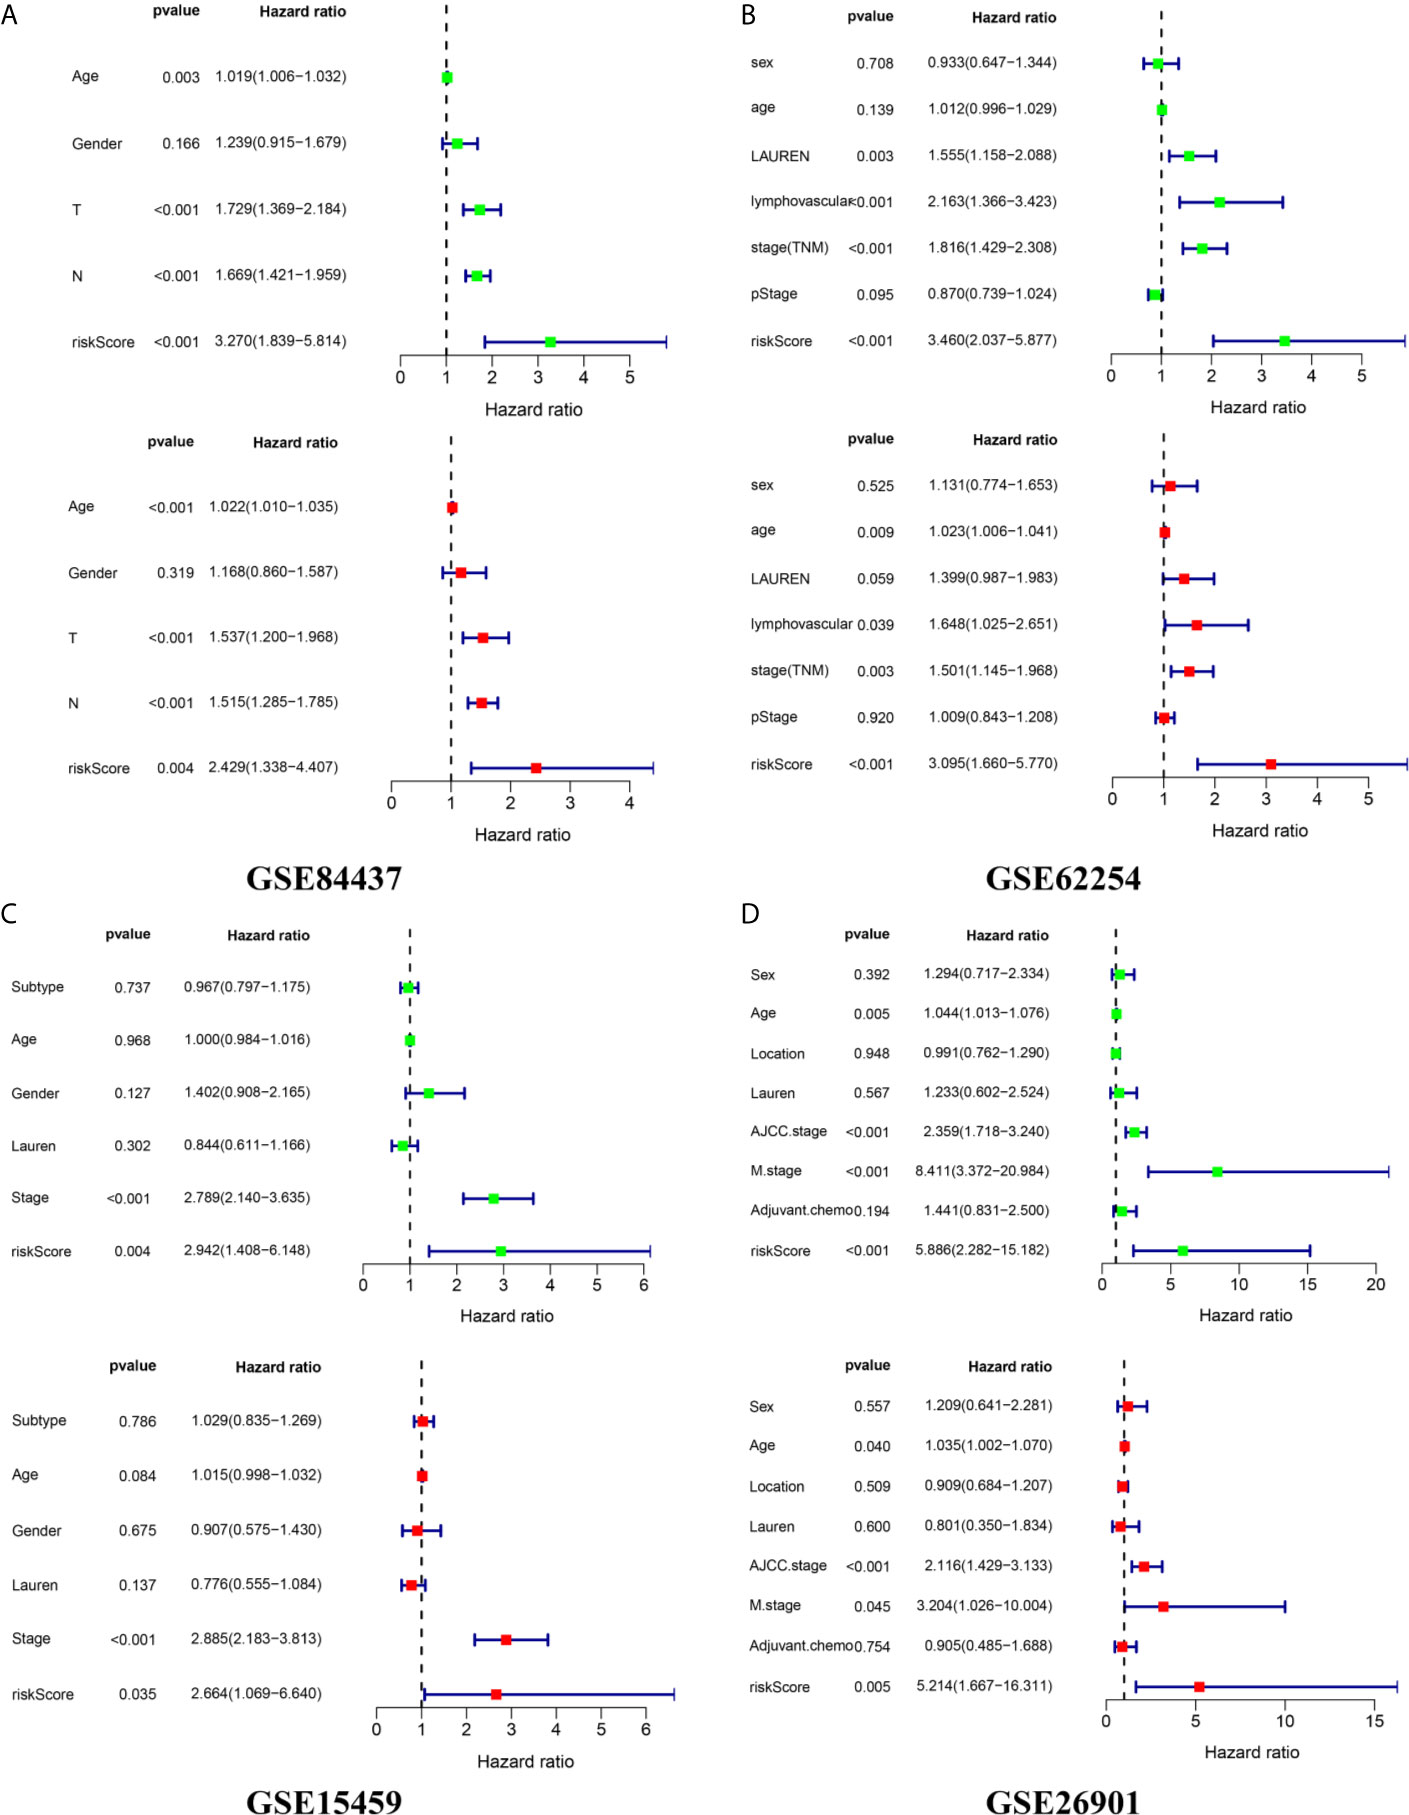
Figure 7 External independence validation of the prognostic model in the (A) GSE84437 cohort (B) GSE62254 cohort (C) GSE15459 cohort (D) GSE26901 cohort. *green represents the univariate Cox analysis, red represents the multivariate Cox analysis.
The infiltration levels of CD4+ T cells, CD8+ T cells, neutrophils, macrophages, and dendritic cells in the high-risk group were all higher than those in the low-risk group estimated by the TIMER algorithm (Figures 8A, B). The infiltration levels of resting memory CD4+ T cells, resting mast cells, and M2 macrophages in the high-risk group were higher than those in the low-risk group estimated by the CIBERSORT algorithm. The infiltration levels of plasma cells, activated memory CD4+ T cells, follicular helper T cells, and M0 macrophages in the low-risk group were higher than those in the high-risk group estimated by the CIBERSORT algorithm (Figures 8C–E).
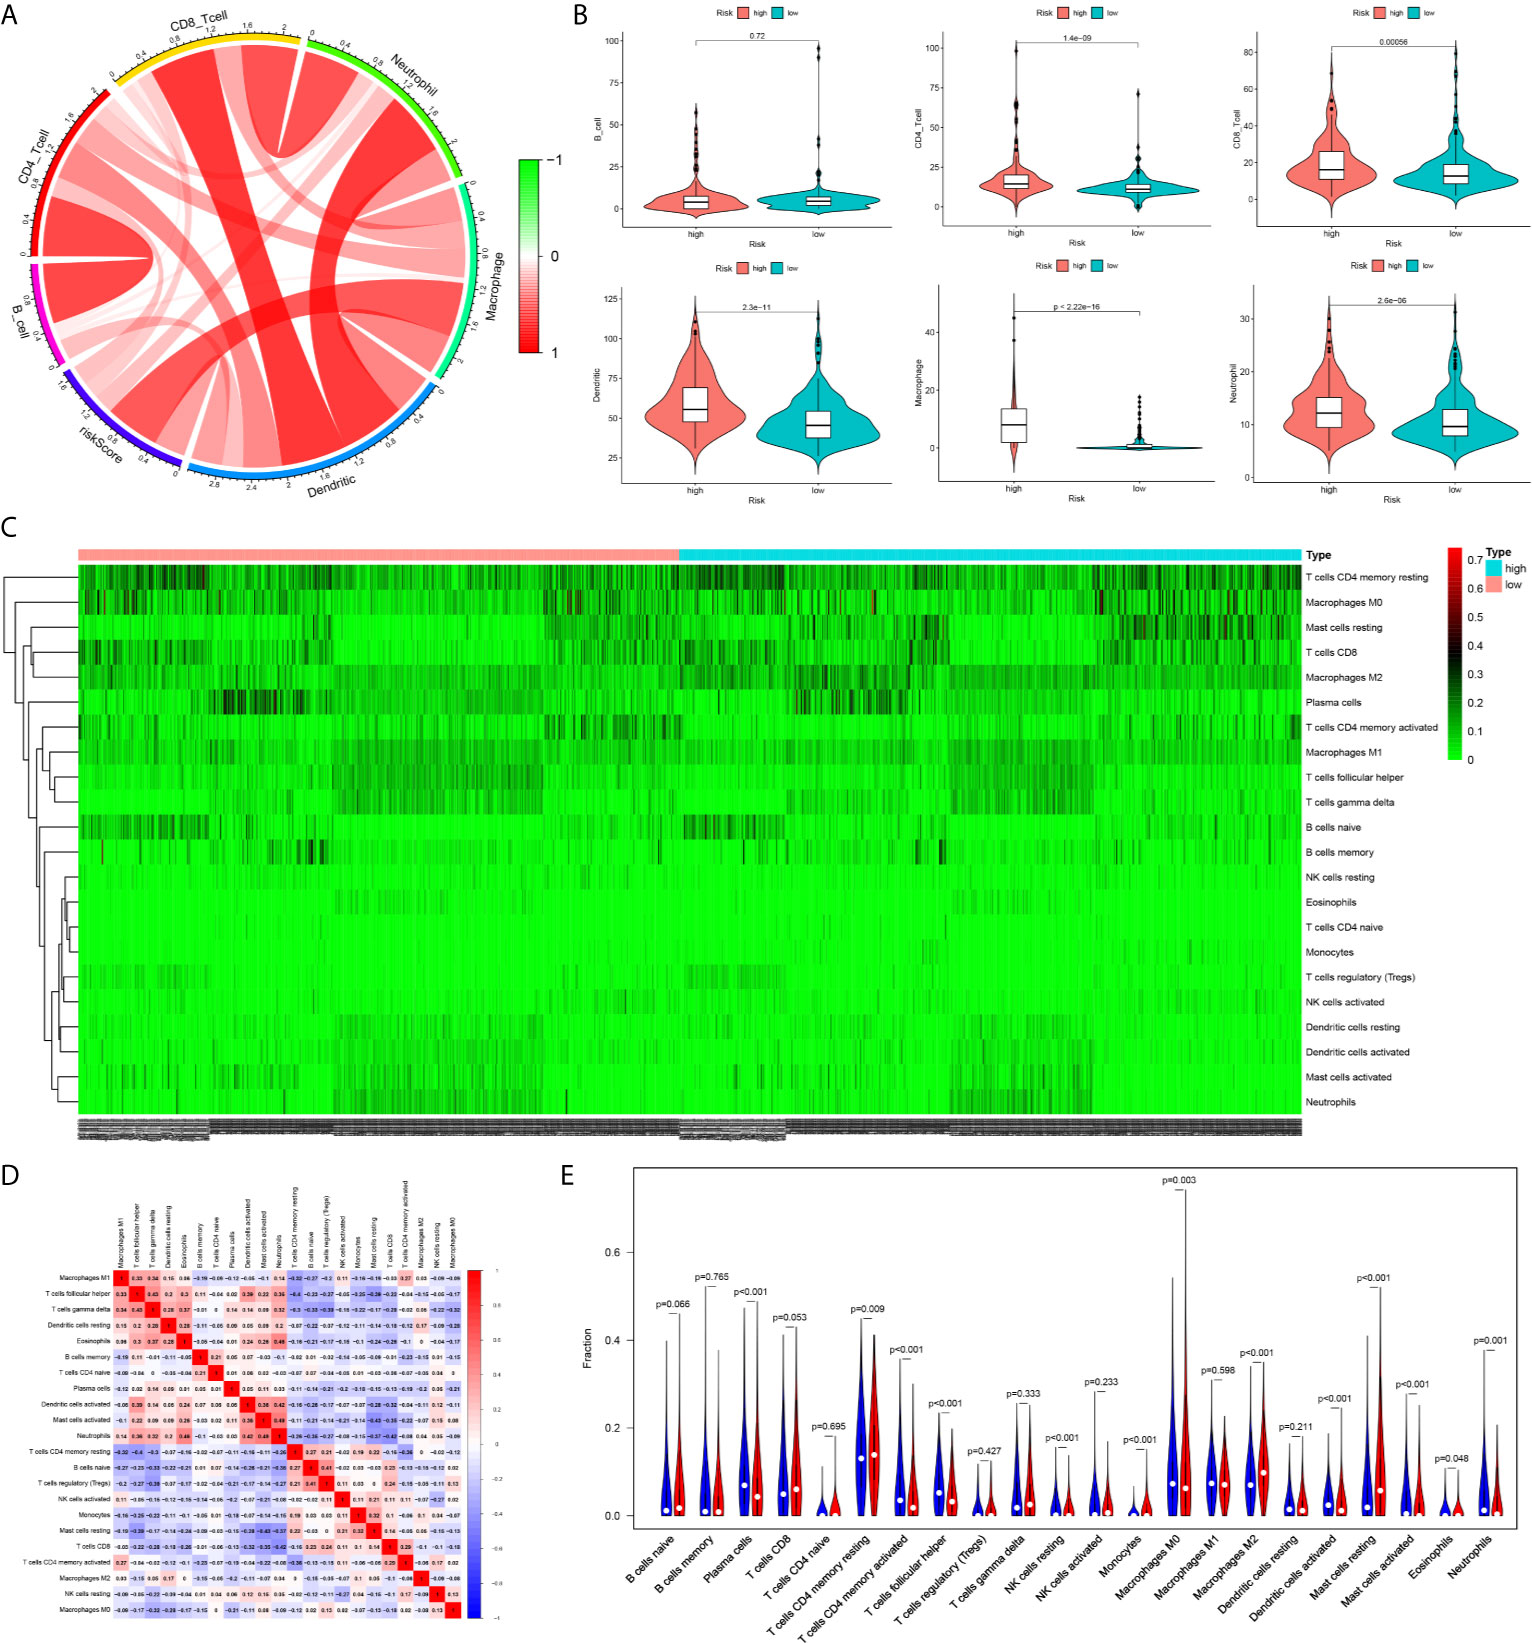
Figure 8 The difference of immune cell infiltration between high- and low-risk groups. (A) The circos plot of risk score and the infiltration of six types of immune cells. (B) The vioplot showed the difference of the abundances of six immune infiltrates (TIMER algorithm) between high- and low risk groups in the TCGA cohort. (C) The heatmap of 22 kinds of immune cells infiltration. (D) The corHeatmap of 22 kinds of immune cells infiltration. (E) The vioplot showed the difference of the abundances of 22 types of immune cells infiltrates between high- and low risk groups[CIBERSORT algorithm, red represent high risk(n=527), blue represent low risk(n=509)].
There were common differences between the high- and low-risk groups in the 5 independent cohorts. For example, the abundances of macrophages, mast cells, and neutrophils in the high-risk group were all higher than those in the low-risk group (Figures 9A–E). The upregulation of CXCR4 and CSF1R expression is related to the enhancement of multiple immune functions, such as T cell costimulation and coinhibition, checkpoints, and CCR, while the upregulation of FGF1, GRP, AVPR1A, APOD, and PDGFRL was associated with the weakening of T cell APC coinhibition and MHC class I (Figure 10). Another important finding was that a higher StromalScore was found to be associated with an unfavorable prognosis of GC (Figures 11A–E). Interestingly, the risk score was highly positively correlated with the StromalScore in the five independent cohorts (Figures 11A–E), which may help us to explain the causes leading to different clinical outcomes in different risk groups.
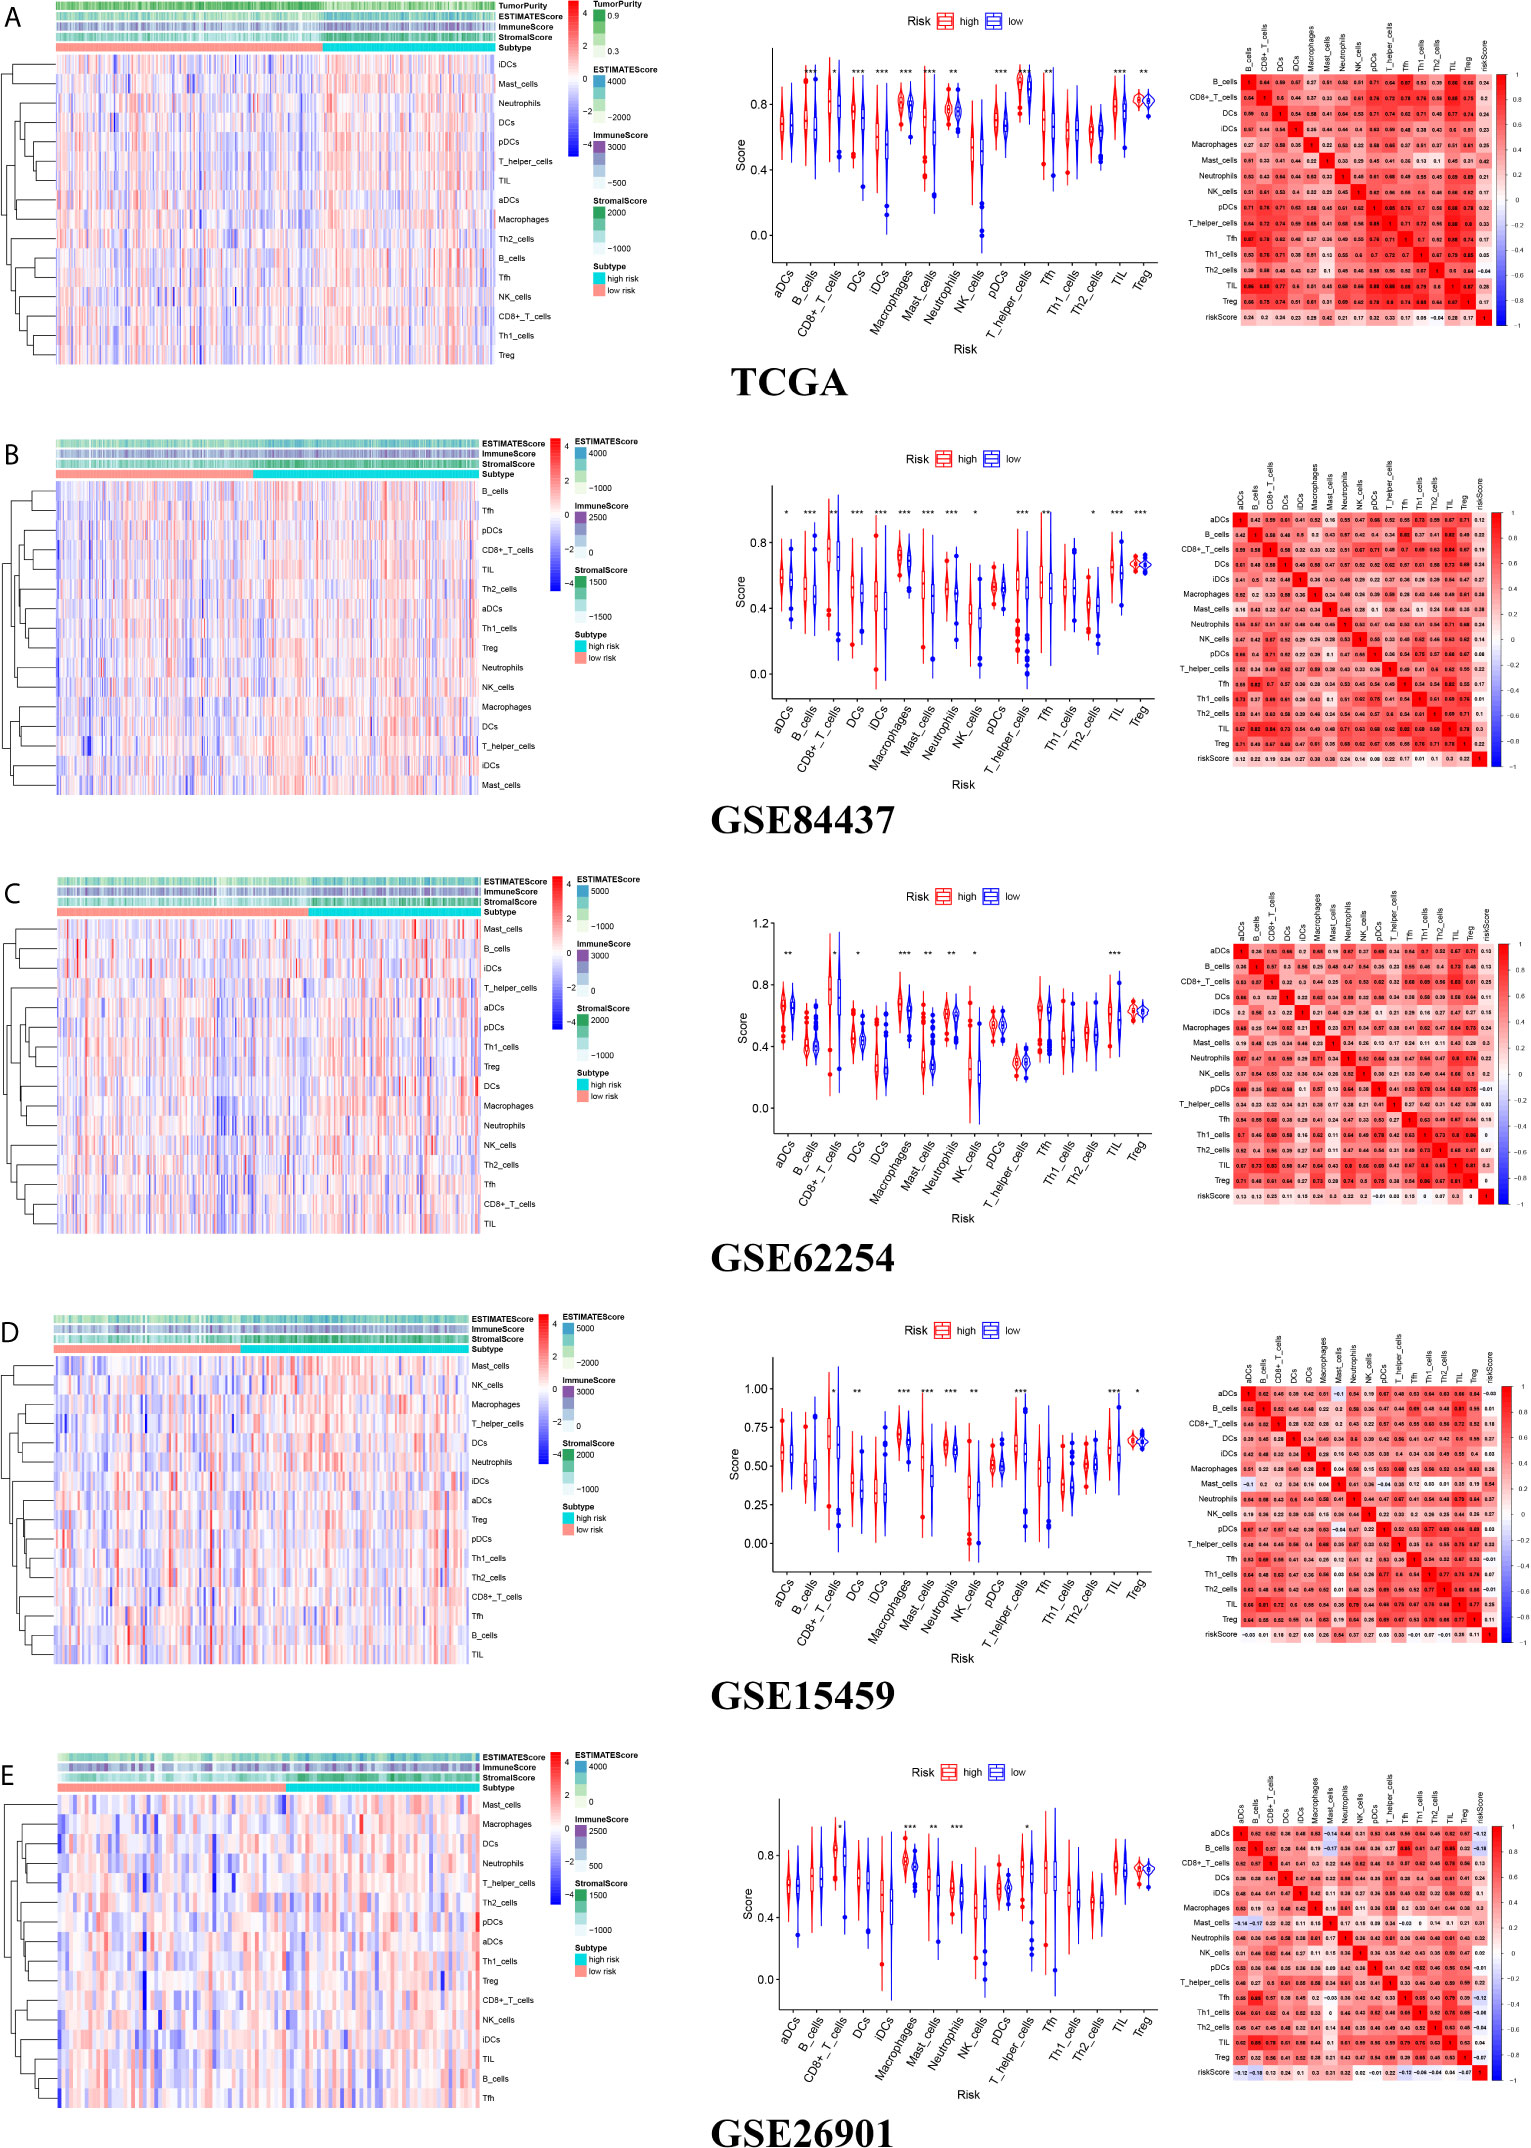
Figure 9 The landscape of tumor microenvironment for difference of immune cell infiltration between high- and low-risk groups (A) TCGA cohort (B) GSE84437 cohort (C) GSE62254 cohort (D) GSE15459 cohort (E) GSE26901 cohort.
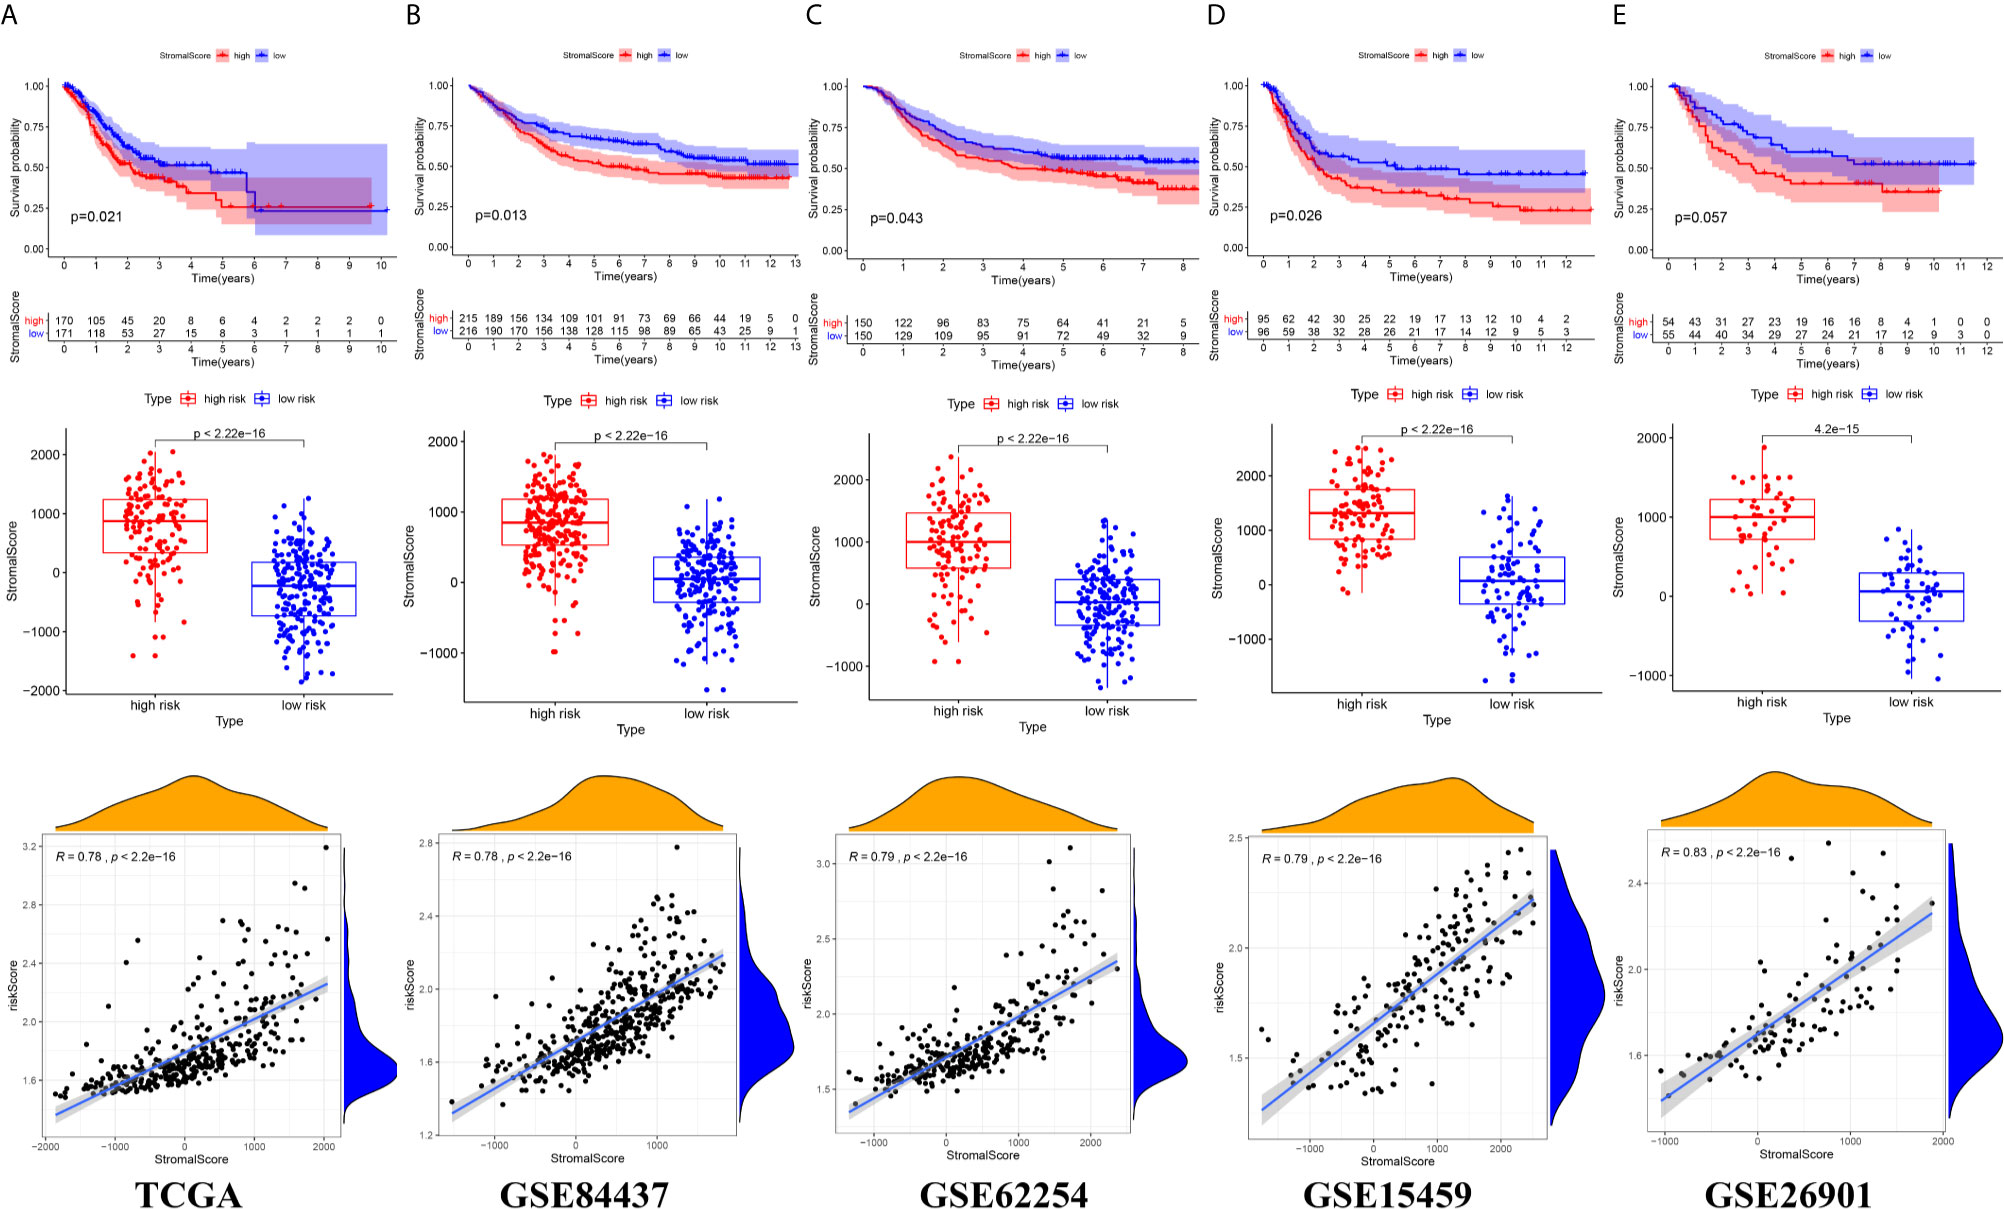
Figure 11 The correlation between risk score and Stromal score (A) TCGA cohort (B) GSE84437 cohort (C) GSE62254 cohort (D) GSE15459 cohort (E) GSE26901 cohort.
Gastric cancer (GC) is a digestive tract malignant tumor with a high incidence rate and mortality (20). Surgery combined with radiotherapy and chemotherapy is the main method for the treatment of GC. However, because of the occult early symptoms of GC, most patients are initially diagnosed in the middle and advanced stages, with a 5-year survival rate of less than 20% (21). The traditional TNM staging system seems to have difficulty accurately assessing the overall prognosis of GC patients (22). For example, in clinical work, we will find that some GC patients with early pathological stages may not have a high overall survival rate. In recent years, with the development of research on the pathogenesis of GC, an increasing number of surgeons have realized that the factors that determine the survival time of GC patients after surgery are not only the complete resection of the tumor but also the gene expression of the tumor (23, 24).
As an important component of the tumor microenvironment (TME), tumor-associated macrophages (TAMs) play a critical role in the tumorigenesis and development of GC (25–27) and have become a new therapeutic target and prognostic indicator in GC. Recent studies have shown that TAMs can promote tumor progression by participating in the immune regulation of GC (28–30). The exploration of immune genes associated with TAMs may provide new biomarkers for the prognostic assessment of GC.
Considering that research on TAMs and immune gene expression is still lacking in the field of GC, we conducted this study. We confirmed the prognostic value of TAMs for GC, and GC patients with higher macrophage infiltration were found to have a poor prognosis. Then, we found that there were significant differences in the expression of immune-related genes between the high and low macrophage infiltration groups, and the functions of the immune genes that were upregulated in the two groups were also different, indicating that macrophage abundance did have a certain impact on the immunophenotype of GC. Whether this is the direct cause of the difference in prognosis between the two groups is still unknown. However, such a finding provides an important hypothesis; that is, TAMs may lead to different clinical outcomes of GC indirectly by influencing the immunophenotype of GC. Next, we screened seven genes from these differentially expressed genes to form the risk score. Interestingly, an obviously positive correlation was observed between the risk score and macrophage abundance, implying that we can speculate what the level of macrophage infiltration is in GC based on the risk score. At present, TAMs have been considered a new target for the treatment of GC (31), and this discovery will undoubtedly provide important clues for treatment strategies focusing on TAMs. In addition, the abundance of macrophages in GC tissues was estimated by targeted sequencing of seven specific genes, which will also maximize cost-effectiveness.
We conducted external validation in four independent cohorts to test the reliability of the prognostic model. The results showed that we could accurately identify GC patients with good and poor prognoses depending on the model, which means that clinicians can provide individualized treatment for GC patients based on the risk score. For example, for patients with high risk scores, clinicians should closely follow up and make corresponding postoperative review plans, while for patients with low risk scores, excessive treatment should be avoided, which is of great significance for reasonable allocation of medical resources. Current studies have shown that the TAM cell population is in a state of continuous transformation between M1 and M2 macrophages, and M2 macrophages have immunosuppressive and tumor-promoting effects (32). We found that the macrophage M2 infiltration level in the high-risk group was significantly higher than that in the low-risk group, which may be an important factor for the poor prognosis of the high-risk group. Meanwhile, it also suggested that the risk score may play a critical role in the process of TAM phenotype polarization to the M2 type. Apart from macrophages, the high-risk group also exhibited a higher abundance of mast cells and neutrophils. According to related reports, mast cells in the TME can release VEGF to support tumor angiogenesis and degrade extracellular matrix by releasing matrix metalloproteinase-9 (MMP9) to promote metastasis, which is conducive to tumor progression (33). Transforming growth factor-β (TGF-β) in the TME could promote neutrophil polarization to the N2 type, which could stimulate immunosuppression, tumor angiogenesis, proliferation, and metastasis (34–36).
Stromal cells in the TME can be divided into angiogenic vascular cells (AVCs), cancer-associated fibroblasts (CAFs), cancer-associated adipocytes (CAAs), and mesenchymal stromal cells (MSCs) (37). AVCs provide nutrition and oxygen for tumor cells, remove metabolic waste, and provide an entry point for metastatic tumor cells to enter the circulatory system (38). In the TME, CAFs promote the formation of an oxygen-rich, immunosuppressive and proinflammatory microenvironment and indirectly support tumor occurrence (39). CAAs provide energy for the growth of tumor cells by producing metabolites and lipid factors that promote tumor growth, promote the invasion characteristics of tumor cells in the primary tumor site and distant metastasis, and protect tumor cells from the influence of various treatments (40, 41). MSCs promote tumor angiogenesis by secreting angiogenic factors and promoting perivascular tissue differentiation into pericytes and promote tumor cell movement and metastasis to distant organs by producing CCL5 (42). Therefore, targeted therapy of stromal cells in the TME will have a positive impact on the prognosis of cancer patients. Considering the close correlation between the risk score and stromal cells, the seven genes in the signature may be a new target for the treatment of stromal cells.
Overexpression of fibroblast growth factor 1 (FGF1) is observed in various cancers and is correlated with poor survival (43). Depletion of AVPR1A in castration-resistant prostate cancer cells resulted in decreased cell proliferation and reduced cyclin A (44). Apolipoprotein D (APOD) has been determined to be a predictor of breast cancer recurrence among tamoxifen-treated patients with estrogen receptor positivity (ER+) (45). The modulation of platelet-derived growth factors (PDGFs) and their receptors (PDGFRs) through overexpression and silencing is widely used in cancers and is attractive as an oncologic target with diverse therapeutic possibilities, leading to a role as a clinical variable and in the nodal metastasis of GC (46). CXC type 4 chemokine receptor (CXCR4), synonymous with fusion protein (Fusin) or CD184, plays a role in promoting migration and mediating cell death regulated by autophagy in the peritoneal diffusion of gastric cancer cells (47). Zhu (48) demonstrated in vivo that interrupting signaling by the myeloid growth factor receptor CSF1R in a mouse model of pancreatic ductal adenocarcinoma (PDAC) can effectively reprogram macrophage reactions, causing enhanced antigen presentation and antitumor T cell responses.
Our study is the first to clarify the prognosis and application value of immune-related genes in gastric cancer from the perspective of TAMs. The establishment and validation of the prognostic model were based on 5 independent cohorts, with a total of 1372 patients, which is the largest prognostic model discovery project for GC so far. Our work has produced some convincing results, but there are still some deficiencies that need to be improved or supplemented in the future. For example, the specific mechanism of the seven genes contained in the signature in GC is still unclear and needs further exploration.
Our study developed and validated a general applicable prognostic model for GC from the perspective of TAMs, which may help to improve the precise treatment strategy of GC.
Publicly available datasets were analyzed in this study. This data can be found here: The datasets analyzed for this study were obtained from The Cancer Genome Atlas (TCGA, https://portal.gdc.cancer.gov/), Tumor IMmune Estimation Resource Web Server (TIMER, https://cistrome.shinyapps.io/timer/), and Gene Expression Omnibus (GEO, https://www.ncbi.nlm.nih.gov/geo/).
JH and LW designed this study. JH analyzed the data in this study and interpreted the findings and drafted the manuscript. JH, LW, and YZ carried out data management and revised the manuscript. All authors contributed to the article and approved the submitted version.
The authors declare that the research was conducted in the absence of any commercial or financial relationships that could be construed as a potential conflict of interest.
GC, gastric cancer; TCGA, The Cancer Genome Atlas; TIMER, Tumor IMmune Estimation Resource; GEO, Gene Expression Ominibus; TME; Tumor microenvironment; TAMs, Tumor associated macrophages; DEIRGs: differential expressed immune-related genes; GO, Gene ontology; CC, cellular component; MF, Molecular Function; BP, biological process; LASSO, least absolute shrinkage and selection operator; PRIGs: prognostic related immune genes; ROC, receiver operating characteristic; AUC, area under curve; OS, overall survival. ESTIMATE, Estimation of STromal and Immune cells in MAlignant Tumor tissues using Expression data; NES, normalized enrichment score; ssGSEA, single sample gene set enrichment analysis; TME, tumor microenvironment; AVC, giogenic vascular cell; CAF, cancer associated fibroblast; CAA, cancer-associated adipocyte cell; MSC, mesenchymal stromal cell.
1. Bray F, Ferlay J, Soerjomataram I, Siegel RL, Torre LA, Jemal A. Global Cancer Statistics 2018: GLOBOCAN Estimates of Incidence and Mortality Worldwide for 36 Cancers in 185 Countries. CA Cancer J Clin (2018) 68(6):394–424. doi: 10.3322/caac.21492
2. Rawla P, Barsouk A. Epidemiology of Gastric Cancer: Global Trends, Risk Factors and Prevention. Prz Gastroenterol (2019) 14(1):26. doi: 10.5114/pg.2018.80001
3. Roma-Rodrigues C, Mendes R, Baptista PV, Fernandes A. Targeting Tumor Microenvironment for Cancer Therapy. Int J Mol Sci (2019) 20(4):840. doi: 10.3390/ijms20040840
4. Salmaninejad A, Valilou SF, Soltani A, Ahmadi S, Abarghan YJ, Rosengren RJ, et al. Tumor-Associated Macrophages: Role in Cancer Development and Therapeutic Implications. Cell Oncol (Dordr) (2019) 42(5):1–18.
5. Lin Y, Xu J, Lan H. Tumor-associated Macrophages in Tumor Metastasis: Biological Roles and Clinical Therapeutic Applications. Oncology (2019) 12(1):76. doi: 10.1186/s13045-019-0760-3
6. Larionova I, Cherdyntseva N, Liu T, Patysheva M, Rakina M, Kzhyshkowska JJO. Interaction of Tumor-Associated Macrophages and Cancer Chemotherapy. Oncoimmunology (2019) 8(7):e1596004. doi: 10.1080/2162402X.2019.1596004
7. Anfray C, Ummarino A, Andón FT, Allavena PJC. Current Strategies to Target Tumor-Associated-Macrophages to Improve Anti-Tumor Immune Responses. Cells (2020) 9(1):46. doi: 10.3390/cells9010046
8. Wang Z, Yang Y, Cui Y, Wang C, Lai Z, Li Y, et al. Tumor-Associated Macrophages Regulate Gastric Cancer Cell Invasion and Metastasis Through TGFβ2/Nf-κB/Kindlin-2 Axis. Chin J Cancer Res (2020) 32(1):72. doi: 10.21147/j.issn.1000-9604.2020.01.09
9. Xu J, Yu Y, He X, Niu N, Li X, Zhang R, et al. Tumor-Associated Macrophages Induce Invasion and Poor Prognosis in Human Gastric Cancer in a Cyclooxygenase-2/MMP9-Dependent Manner. Am J Transl Res (2019) 11(9):6040.
10. Wang X, Jiang J, Wu CJGMR. Prognostic Significance of Tumor-Associated Macrophage Infiltration in Gastric Cancer: A Meta-Analysis. Genet Mol Res (2016) 15(4):3975–83. doi: 10.4238/gmr15049040
11. Li T, Fan J, Wang B, Traugh N, Chen Q, Liu JS, et al. TIMER: A Web Server for Comprehensive Analysis of Tumor-Infiltrating Immune Cells. Cancer Res (2017) 77(21):e108–e10. doi: 10.1158/0008-5472.CAN-17-0307
12. Li B, Severson E, Pignon J-C, Zhao H, Li T, Novak J, et al. Comprehensive Analyses of Tumor Immunity: Implications for Cancer Immunotherapy. Genome Biol (2016) 17(1):1–16. doi: 10.1186/s13059-016-1028-7
13. Huo J, Wu L, Zang Y, Medicine M. Development and Validation of a CTNNB1-associated Metabolic Prognostic Model for Hepatocellular Carcinoma. J Cell Mol Med (2021) 25(2):1151–65. doi: 10.1111/jcmm.16181
14. Yang L, Chen H, Zhao M, Peng PJO. Prognostic Value of Circulating Vitamin D Binding Protein, Total, Free and Bioavailable 25-Hydroxy Vitamin D in Patients With Colorectal Cancer. Oncotarget (2017) 8(25):40214. doi: 10.18632/oncotarget.16597
15. Huo J, Wu L, Zang Y, Dong H, Liu X, He F, et al. Eight-Gene Metabolic Signature Related With Tumor-Associated Macrophages Predicting Overall Survival for Hepatocellular Carcinoma. BMC Cancer (2021) 21(1):1–15. doi: 10.1186/s12885-020-07734-z
16. Huo J, Wu L, Zang Y. A Prognostic Model of 15 Immune-Related Gene Pairs Associated With Tumor Mutation Burden for Hepatocellular Carcinoma. Front Mol Biosci (2020) 7581354. doi: 10.3389/fmolb.2020.581354
17. Habibzadeh F, Habibzadeh P, Yadollahie M. On Determining the Most Appropriate Test Cut-Off Value: The Case of Tests With Continuous Results. Biochem Med (Zagreb) (2016) 26(3):297–307. doi: 10.11613/BM.2016.034
18. Newman AM, Liu CL, Green MR, Gentles AJ, Feng W, Xu Y, et al. Robust Enumeration of Cell Subsets From Tissue Expression Profiles. Nat Methods (2015) 12(5):453–7. doi: 10.1038/nmeth.3337
19. Huo J, Wu L, Zang Y. Development and Validation of a Novel Immune-Gene Pairs Prognostic Model Associated With CTNNB1 Alteration in Hepatocellular Carcinoma. Med Sci monitor Int Med J Exp Clin Res (2020) 26e925494–e. doi: 10.12659/msm.925494
20. Serra O, Galán M, Ginesta M, Calvo M, Sala N, Salazar R. Comparison and Applicability of Molecular Classifications for Gastric Cancer. Cancer Treat Rev (2019) 7729–34. doi: 10.1016/j.ctrv.2019.05.005
21. Kurokawa Y, Yang H-K, Cho H, Ryu M-H, Masuzawa T, Park SR, et al. Phase II Study of Neoadjuvant Imatinib in Large Gastrointestinal Stromal Tumours of the Stomach. Br J Cancer (2017) 117(1):25–32. doi: 10.1038/bjc.2017.144
22. Sano T, Coit DG, Kim HH, Roviello F, Kassab P, Wittekind C, et al. Proposal of a New Stage Grouping of Gastric Cancer for TNM Classification: International Gastric Cancer Association Staging Project. Gastric Cancer (2017) 20(2):217–25. doi: 10.1007/s10120-016-0601-9
23. Elimova E, Wadhwa R, Shiozaki H, Sudo K, Estrella JS, Badgwell BD, et al. Molecular Biomarkers in Gastric Cancer. J Natl Compr Canc Netw (2015) 13(4):e19–29. doi: 10.6004/jnccn.2015.0064
24. Petrovchich I, Ford JM Genetic Predisposition to Gastric Cancer. Semin Oncol . (2016) 43(5):554–9. doi: 10.1053/j.seminoncol.2016.08.006
25. Ishigami S, Natsugoe S, Tokuda K, Nakajo A, Okumura H, Matsumoto M, et al. Tumor-Associated Macrophage (TAM) Infiltration in Gastric Cancer. Anticancer Res (2003) 23(5A):4079–83.
26. Ma YY, He XJ, Wang HJ, Xia YJ, Wang SL, Ye ZY, et al. Interaction of Coagulation Factors and Tumor-Associated Macrophages Mediates Migration and Invasion of Gastric Cancer. Cancer Sci (2011) 102(2):336–42. doi: 10.1111/j.1349-7006.2010.01795.x
27. Pantano F, Berti P, Guida FM, Perrone G, Vincenzi B, Amato MMC, et al. The Role of Macrophages Polarization in Predicting Prognosis of Radically Resected Gastric Cancer Patients. J Cell Mol Med (2013) 17(11):1415–21. doi: 10.1111/jcmm.12109
28. Gordon SR, Maute RL, Dulken BW, Hutter G, George BM, McCracken MN, et al. PD-1 Expression by Tumour-Associated Macrophages Inhibits Phagocytosis and Tumour Immunity. Nature (2017) 545(7655):495–9. doi: 10.1038/nature22396
29. Wang F, Li B, Wei Y, Zhao Y, Wang L, Zhang P, et al. Tumor-Derived Exosomes Induce PD1+ Macrophage Population in Human Gastric Cancer That Promotes Disease Progression. Oncogenesis (2018) 7(5):1–11. doi: 10.1038/s41389-018-0049-3
30. Pan J-H, Zhou H, Cooper L, Huang J-L, Zhu S-B, Zhao X-X, et al. LAYN is a Prognostic Biomarker and Correlated With Immune Infiltrates in Gastric and Colon Cancers. Front Immunol (2019) 106. doi: 10.3389/fimmu.2019.00006
31. Pathria P, Louis TL, Varner J. Targeting Tumor-Associated Macrophages in Cancer. Trends Immunol (2019) 40(4):310–27. doi: 10.1016/j.it.2019.02.003
32. Sica A, Schioppa T, Mantovani A, Allavena P. Tumour-Associated Macrophages are a Distinct M2 Polarised Population Promoting Tumour Progression: Potential Targets of Anti-Cancer Therapy. Eur J Cancer (2006) 42(6):717–27. doi: 10.1016/j.ejca.2006.01.003
33. Hempel HA, Cuka NS, Kulac I, Barber JR, Cornish TC, Platz EA, et al. Low Intratumoral Mast Cells are Associated With a Higher Risk of Prostate Cancer Recurrence. Prostate (2017) 77(4):412–24. doi: 10.1002/pros.23280
34. Masucci MT, Minopoli M, Carriero M. Tumor Associated Neutrophils. Their Role in Tumorigenesis, Metastasis, Prognosis and Therapy. Front Oncol (2019) 9. doi: 10.3389/fonc.2019.01146
35. Fridlender ZG, Sun J, Kim S, Kapoor V, Cheng G, Ling L, et al. Polarization of Tumor-Associated Neutrophil Phenotype by TGF-β:”N1” Versus “N2” Tan. Cancer Cell (2009) 16(3):183–94. doi: 10.1016/j.ccr.2009.06.017
36. Wu L, Saxena S, Awaji M, Singh RKJC. Tumor-Associated Neutrophils in Cancer: Going Pro. Cancers (Basel) (2019) 11(4):564. doi: 10.3390/cancers11040564
37. Egeblad M, Nakasone ES, Werb Z. Tumors as Organs: Complex Tissues That Interface With the Entire Organism. Dev Cell (2010) 18(6):884–901. doi: 10.1016/j.devcel.2010.05.012
38. Lopes-Bastos BM, Jiang WG, Cai J. Tumour–Endothelial Cell Communications: Important and Indispensable Mediators of Tumour Angiogenesis. Anticancer Res (2016) 36(3):1119–26.
39. Sahai E, Astsaturov I, Cukierman E, DeNardo DG, Egeblad M, Evans RM, et al. A Framework for Advancing Our Understanding of Cancer-Associated Fibroblasts. Nat Rev Cancer (2020) 1-13.
40. Duong MN, Geneste A, Fallone F, Li X, Dumontet C, Muller CJO. The Fat and the Bad: Mature Adipocytes, Key Actors in Tumor Progression and Resistance. Oncotarget (2017) 8(34):57622. doi: 10.18632/oncotarget.18038
41. Pallegar NK, Christian SL. Adipocytes in the Tumour Microenvironment. Adv Exp Med Biol (2020). 1234:1–13. doi: 10.1007/978-3-030-37184-5_1
42. Bergfeld SA, DeClerck YAJC, Reviews M. Bone Marrow-Derived Mesenchymal Stem Cells and the Tumor Microenvironment. Cancer Metastasis Rev (2010) 29(2):249–61. doi: 10.1007/s10555-010-9222-7
43. Manousakidi S, Guillaume A, Pirou C, Bouleau S, Mignotte B, Renaud F, et al. FGF1 Induces Resistance to Chemotherapy in Ovarian Granulosa Tumor Cells Through Regulation of p53 Mitochondrial Localization. Oncogenesis (2018) 7(2):1–13. doi: 10.1038/s41389-018-0033-y
44. Zhao N, Peacock SO, Lo CH, Heidman LM, Rice MA, Fahrenholtz CD, et al. Arginine Vasopressin Receptor 1a is a Therapeutic Target for Castration-Resistant Prostate Cancer. Sci Transl Med (2019) 11(498):eaaw4636. doi: 10.1126/scitranslmed.aaw4636
45. Klebaner D, Hamilton-Dutoit S, Ahern T, Crawford A, Jakobsen T, Cronin-Fenton DP, et al. Apolipoprotein D Expression Does Not Predict Breast Cancer Recurrence Among Tamoxifen-Treated Patients. PLoS One (2017) 12(3):e0171453. doi: 10.1371/journal.pone.0171453
46. Qian H, Appiah-Kubi K, Wang Y, Wu M, Tao Y, Wu Y, et al. The Clinical Significance of Platelet-Derived Growth Factors (PDGFs) and Their Receptors (PDGFRs) in Gastric Cancer: A Systematic Review and Meta-Analysis. Crit Rev Oncol Hematol (2018) 12715–28. doi: 10.1016/j.critrevonc.2018.05.004
47. Hashimoto I, Koizumi K, Tatematsu M, Minami T, Cho S, Takeno N, et al. Blocking on the CXCR4/mTOR Signalling Pathway Induces the Anti-Metastatic Properties and Autophagic Cell Death in Peritoneal Disseminated Gastric Cancer Cells. Eur J Cancer (2008) 44(7):1022–9. doi: 10.1016/j.ejca.2008.02.043
Keywords: gastric cancer, immune, macrophages, prognostic, signature
Citation: Huo J, Wu L and Zang Y (2021) Construction and Validation of a Universal Applicable Prognostic Signature for Gastric Cancer Based on Seven Immune-Related Gene Correlated With Tumor Associated Macrophages. Front. Oncol. 11:635324. doi: 10.3389/fonc.2021.635324
Received: 30 November 2020; Accepted: 17 May 2021;
Published: 11 June 2021.
Edited by:
Fenglin Liu, Fudan University, ChinaReviewed by:
Hong-Wen Tang, Duke-NUS Medical School, SingaporeCopyright © 2021 Huo, Wu and Zang. This is an open-access article distributed under the terms of the Creative Commons Attribution License (CC BY). The use, distribution or reproduction in other forums is permitted, provided the original author(s) and the copyright owner(s) are credited and that the original publication in this journal is cited, in accordance with accepted academic practice. No use, distribution or reproduction is permitted which does not comply with these terms.
*Correspondence: Liqun Wu, d3VscTU4MTBAMTI2LmNvbQ==
Disclaimer: All claims expressed in this article are solely those of the authors and do not necessarily represent those of their affiliated organizations, or those of the publisher, the editors and the reviewers. Any product that may be evaluated in this article or claim that may be made by its manufacturer is not guaranteed or endorsed by the publisher.
Research integrity at Frontiers

Learn more about the work of our research integrity team to safeguard the quality of each article we publish.