- 1Department of Urology, Peking University First Hospital, Beijing, China
- 2Institute of Urology, Peking University, Beijing, China
- 3National Urological Cancer Center, Beijing, China
Purpose: Gleason score (GS) system is one of the most widely used histological grading methods for prostate cancer (PCa) all over the world. GS can be obtained by adding the primary Gleason pattern (GP) and secondary GP. Different proportions of GP 4 and GP 5 in prostate specimens can both lead to GS 9. In this study, we explored whether GP 5 + 4 or GP 4 + 5 was associated with different prognoses among patients with GS 9 PCa.
Materials and methods: A retrospective population-based study was conducted on 10,124 subjects diagnosed with GS 9 PCa between 2004 and 2009 from the Surveillance, Epidemiology, and End Results program. A 1:1 propensity-score matching (PSM) was performed to balance the baseline characteristics between the GP 4 + 5 and 5 + 4 groups and to compare the prognoses between the two groups. Cox regression analysis and Fine-Gray competing risk regression models were adopted to screen the covariates significantly associated with all-cause mortality (ACM) and cancer-specific mortality (CAM).
Results: GP 5 + 4 was associated with higher risks of ACM and CSM before or after PSM than GP 4 + 5. In the original cohort, there were eight independent predictors for ACM, which were age at diagnosis, race, AJCC NM stage, PSA levels, treatments, GP, and marital status, confirmed by the Cox analysis; and nine independent predictors for CSM, which were age at diagnosis, race, AJCC TNM stage, PSA levels, treatments, GP, and marital status, confirmed by the competing-risk model.
Conclusion: GP 5 + 4 was associated with a poorer overall survival and cancer-specific survival compared with GP 4 + 5.
Introduction
Prostate cancer (PCa) was one of the leading genitourinary neoplasms in males all over the world, although the incidence rate of PCa differs slightly with the changes in the area and race (1, 2). The Gleason score (GS) system, first described by Gleason (3), is generally believed to be an important prognostic predictor. GS 9–10 is associated with poorer outcomes than GS 8 (4, 5). The current clinical disease staging methods regarded patients with GS 9–10 PCa as an independent group from patients with other GS and assumed that patients with GS 9–10 PCa undergo similar risks of recurrence, metastasis, and mortality (6). However, different Gleason patterns (GP), GP 4 + 5 and 5 + 4, can both lead to GS 9. It has been reported that an increased proportion of Gleason pattern 5 has a trend to be associated with adverse outcomes (7). Several previous studies have proved differences in the prognoses between patients with GP 4 + 5 and 5 + 4 PCa (8–10). Here, we perform a study with a larger survey sample in the individual level to investigate the differences in the overall survival (OS) and cancer-specific survival (CSS) between the two GPs.
Deaths from non-cancer causes act as competing events of cancer-specific mortality (CSM) (11). Therefore, rather than the Kaplan-Meier method, Fine-Gray competing-risk regression models were adopted in this study to analyze the CSS in the presence of competing events.
Surveillance, Epidemiology, and End Results (SEER) database is an authoritative source of population-based data in the U.S., which records cancer stage at the time of diagnosis and patient survival information (12). In this study, the follow-up information on GS 9 PCa was extracted from the SEER database.
Materials and Methods
Study Population
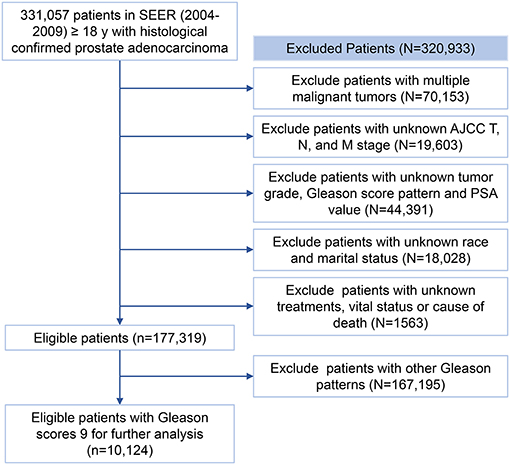
The diagnosis in the SEER registry (https://seer.cancer.gov/data/) was coded by the International Classification of Disease for Oncology-3 (ICD-O-3). Patients diagnosed with PCa (topography codes: C61.9; histological code:8140: 3) between 2004 and 2009 were retrieved from the SEER registry. Subjects with one of the following conditions will be excluded: (1) with more than one primary malignant tumors; (2) AJCC TNM stage was unknown; (3) tumor grades, prostate-specific antigen (PSA) levels, and GPs were unknown; (4) with unknown marital status and ethnicity; (5) with unknown treatments or follow-up information. The screening process for the patients recorded in the SEER registry was shown in Figure 1. The entire cohort obtained after the screening was later randomly divided into a training group and a validation group in a 2:1 ratio for the establishment and validation of the prognostic models.
Propensity Score-Matching
The multivariate logistic regression analysis was used to get the propensity scores for each subject based on the age at diagnosis, AJCC stage, AJCC TNM stage, treatments, and marital status. GP 4 + 5 and 5 + 4 groups were matched in a 1:1 ratio through a caliper width of 0.05 for the propensity score and the nearest neighbor matching.
Study Variables
Age at diagnosis was divided into three groups, <72, 72–78, >78, using the X-tile software (version 3.6.1, Robert L Camp, Yale University). The race was categorized as black, white, and others (American Indian/Alaska Native, Asian, or Pacific Islander). The marital status was classified as married or unmarried (separated, divorced, single, or widowed, etc.). The professional quality evaluation and validation of PSA in the SEER registries confirmed precise PSA values for further analyses (13). PSA levels were divided into <10, ≥20, and ≥10& <20 ng/ml. AJCC T status was categorized as T1/2 and T3/4. According to the SEER database, the treatments to the patients were classified into four types as follows: neither surgery nor radiation, only surgery, only radiation, and both surgery and radiation.
Statistical Analysis
Continuous variables were depicted using medians and interquartile ranges, while categorical variables were reported by proportions. The chi-square tests were used to compare the baseline categorical variables between the GP 4 + 5 and 5 + 4 groups and the Mann-Whitney U tests were used for continuous variables, such as age at diagnosis. ACM and CSM were the primary outcomes of this study according to the record of the SEER database. The Kaplan-Meier method as well as log-rank tests were used to compare the OS between groups. Univariate and multivariate Cox regression analysis models were adopted to detect factors influencing OS. Fine-Gray competing-risk regression models were used to assess the predictive factors of CSS. The forward stepwise method was used to confirm the predictive factors included in the final multivariate models.
X-tile version 3.6.1(Robert L Camp, Yale University, https://x-tile.net/) was adopted to classify the continuous variables (age at diagnosis) (14). Kaplan–Meier methods and Cox analysis were performed using the IBM SPSS Statistics version 23.0 (SPSS Inc., Chicago, IL, USA). Fine-Gray competing-risk regression and the PSM process were conducted using the Stata/SE version 15.1 (StataCorp, College Station, Texas). All statistical tests were two-sided with a P < 0.05 considered to be indicative of statistical significance.
Results
Study Population
Three hundred thirty-one thousand fifty-seven (331,057) patients diagnosed with PCa between 2004 and 2009 were collected from the SEER database. Finally, 10,124 eligible patients with PCa of GS 9 were included for further analysis as shown in Figure 1. Three thousand one hundred eighty-nine (3,189) failure events and 2,003 competition events were observed in the overall cohort.
Baseline characteristics of patients between the GP 4 + 5 and the GP 5 + 4 groups before and after PSM were shown in Table 1. In the entire cohort, 7,759 (74.7%) patients were diagnosed with GP 4 + 5 PCa and 2,565 (25.3%) with GP 5 + 4 PCa. Patients in the GP 5 + 4 group were associated with an increasing age at diagnosis (p = 0.002) and a higher AJCC N (p = 0.002) and M (p < 0.001) stage compared with those in the GP 4 + 5 group. After PSM, a cohort of 5,130 patients was generated, 2,565 patients in each group. The baseline characteristics were well-balanced between the two groups in the after-PSM cohort (Table 1, Figures 2A,B). One thousand eight hundred fifty-six (1,856) failure events and 1,029 competition events were recorded in the post-PSM cohort. The median follow-up period was 90 months before PSM and 86 months after PSM.
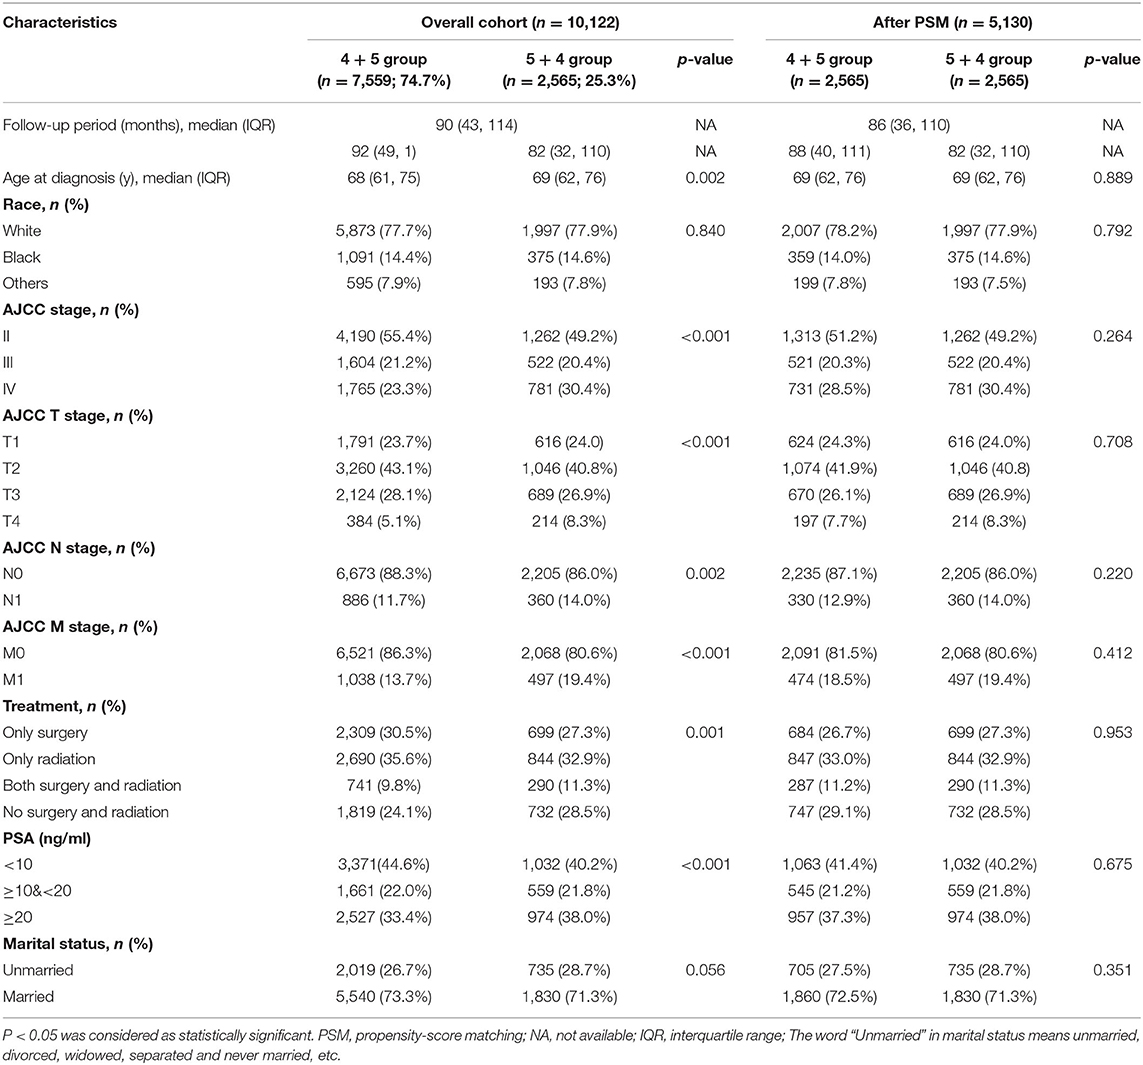
Table 1. Baseline characteristics of patients between the GP 4 + 5 and 5 + 4 groups before (n = 10,124) and after PSM (n = 5,130).
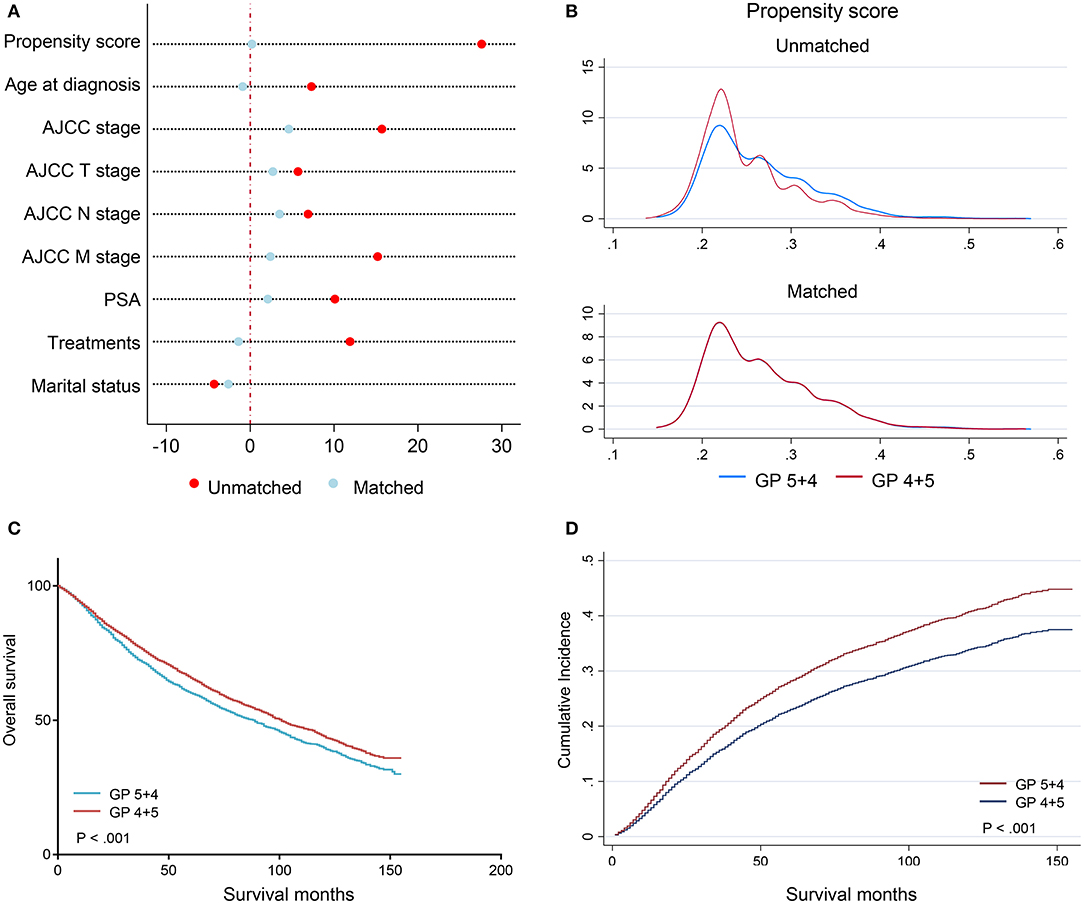
Figure 2. Plots after PSM in a 1:1 ratio. (A) the love-plot (dot chart) of the standardized percentage bias for each covariate before and after PSM; (B) the kernel density plot of propensity score before and after PSM; (C) the Kaplan–Meier curves stratified by Gleason patterns after PSM; (D) the CIF curves stratified by Gleason patterns. PSM, propensity score-matching.
Effects of GP on Prognosis in the After-PSM Cohort
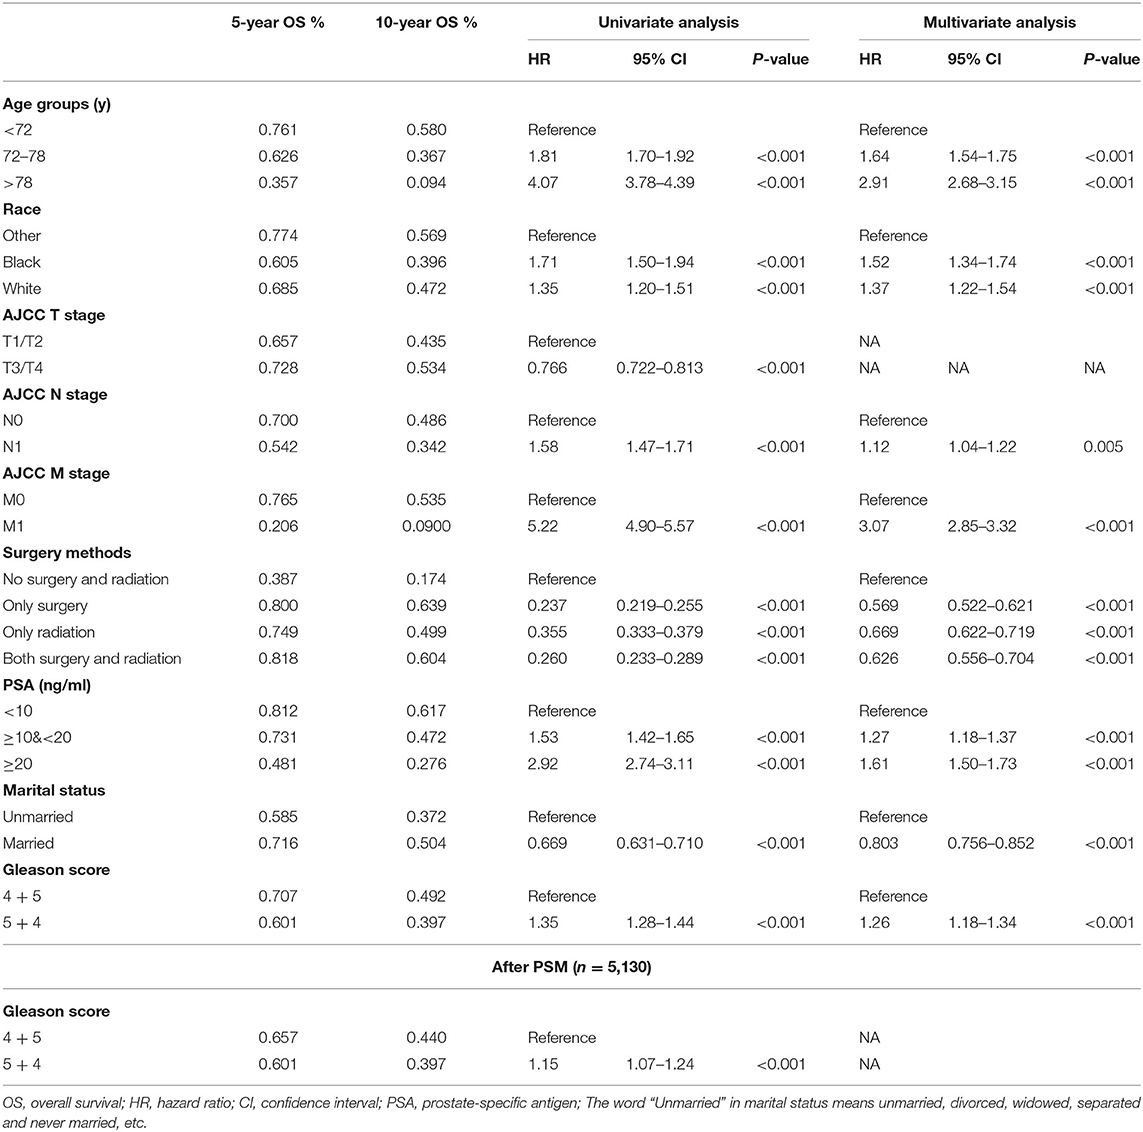
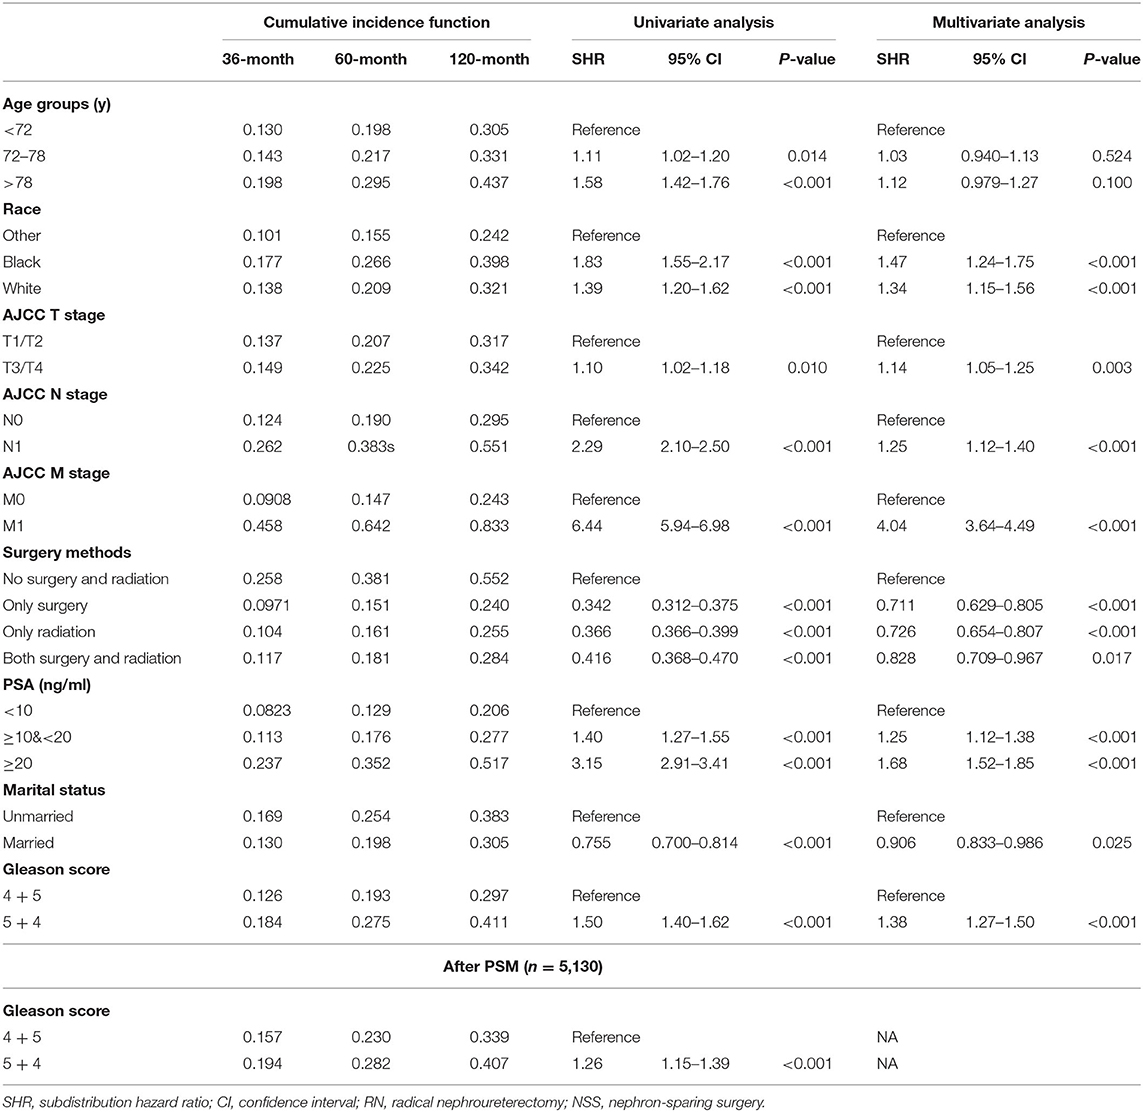
To compare the prognosis between the GP 4 + 5 and the GP 5 + 4 groups in the absence of effects from other covariates, a 1:1 ratio of the PSM process was performed to generate a cohort of 5,130 patients. The baseline characteristics were well-balanced (Table 1). In the matched groups, the GP 5 + 4 group had a poorer OS than the GP 4 + 5 group (5-year OS: 0.601 vs. 0.657, HR = 1.15, 95% CI: 1.07–1.24, p < 0.001; Table 2; Figure 2C). The GP 5 + 4 group was also associated with a higher cumulative incidence of CSM compared with the GP 4 + 5 group (5-year CIF: 0.282 vs. 0.230; SHR = 1.26, 95% CI: 1.15–1.39, p < 0.001; Table 3; Figure 2D).
Independent Predictors on OS
The Kaplan-Meier curves stratified by covariates, which were age at diagnosis, race, AJCC stage, AJCC TNM stage, PSA levels, GP, marital status, and treatments, were shown in Figure 3. GP 4 + 5 was associated with a better OS than GP 5 + 4 (5-year OS: 0.707 vs. 0.601, p < 0.001; Figure 3G). The AJCC stage could be confirmed based on the AJCC TNM stage, GS, and PSA levels. Therefore, the AJCC stage was not included in the further analyses as a covariate. All the nine factors were associated with OS significantly in the univariate Cox analysis (Table 2), among which, GP 4 + 5 was still a protective factor of OS (HR = 1.35, 95% CI 1.28–1.44, p < 0.001). A forward stepwise multivariate Cox analysis confirmed that the eight variables, except the AJCC T stage, were independent predictors of OS (Table 2). After adjusting other covariates, GP 5 + 4 was still associated with a poorer OS than GP 4 + 5 (HR = 1.26, 95% CI 1.18–1.34, p < 0.001).
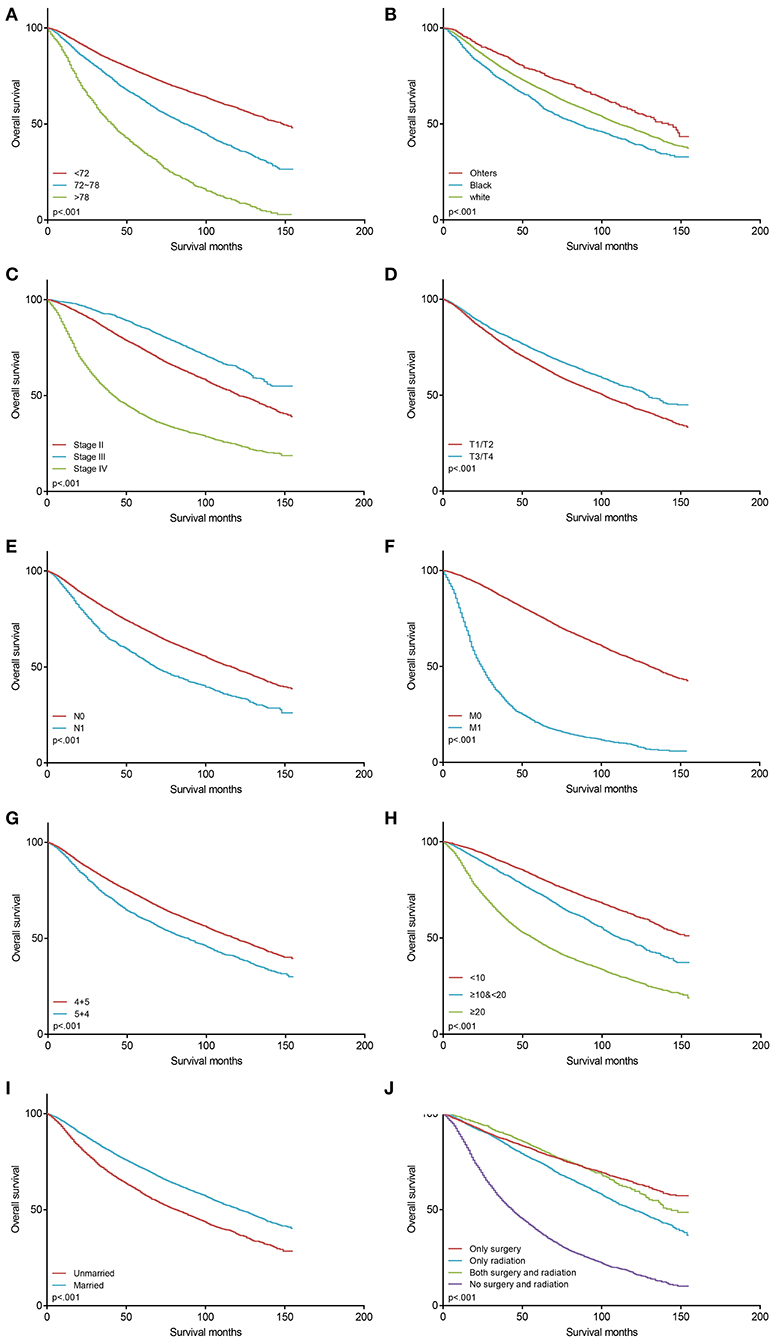
Figure 3. The Kaplan–Meier survival curves of OS before PSM (n = 10,124). (A) survival curves for age at diagnosis; (B) survival curves for race; (C) survival curves for AJCC stage; (D) survival curves for AJCC T stage; (E) survival curves for AJCC N stage; (F) survival curves for AJCC M stage; (G) survival curves for Gleason patterns; (H) survival curves for PSA levels; (I) survival curves for marital status; (J) survival curves for treatments. OS, overall survival; PSM, propensity score-matching; PSA, prostate-specific antigen.
Independent Predictors on CSS
Deaths from non-PCa causes were regarded as competing events of cancer-specific mortality. Fine-Gray competing-risk regression models revealed that race, AJCC TNM stage, PSA levels, marital status, treatments, and GP were independent predictors for CSS in the univariate and multivariate analyses (Table 3, Figure 4). Specifically, GP 5 + 4 was associated with a poorer CSS compared with GP 4 + 5. The GP 4 + 5 group had a lower 3, 5, and 10-year CIF (0.126 vs. 0.184, 0.193 vs. 0.275, 0.297 vs. 0.411) than the GP 5 + 4 group. In the multivariate analysis, the GP 5 + 4 group had a higher risk of CSM than the GP 4 + 5 group (SHR = 1.38, 95% CI 1.27–1.50, p < 0.001). Although the AJCC T stage was not proven to be an independent predictor for OS in the multivariate Cox analyses, the higher T stage indicated higher risks of CSM in the multivariate competing-risk regression (SHR = 1.14, 95% CI 1.05–1.25, p = 0.003). Age at diagnosis was not proven to be significantly associated with CSS. Given that age at diagnosis was a powerful predictor for OS, we included it into the final multivariate competing-risk model.
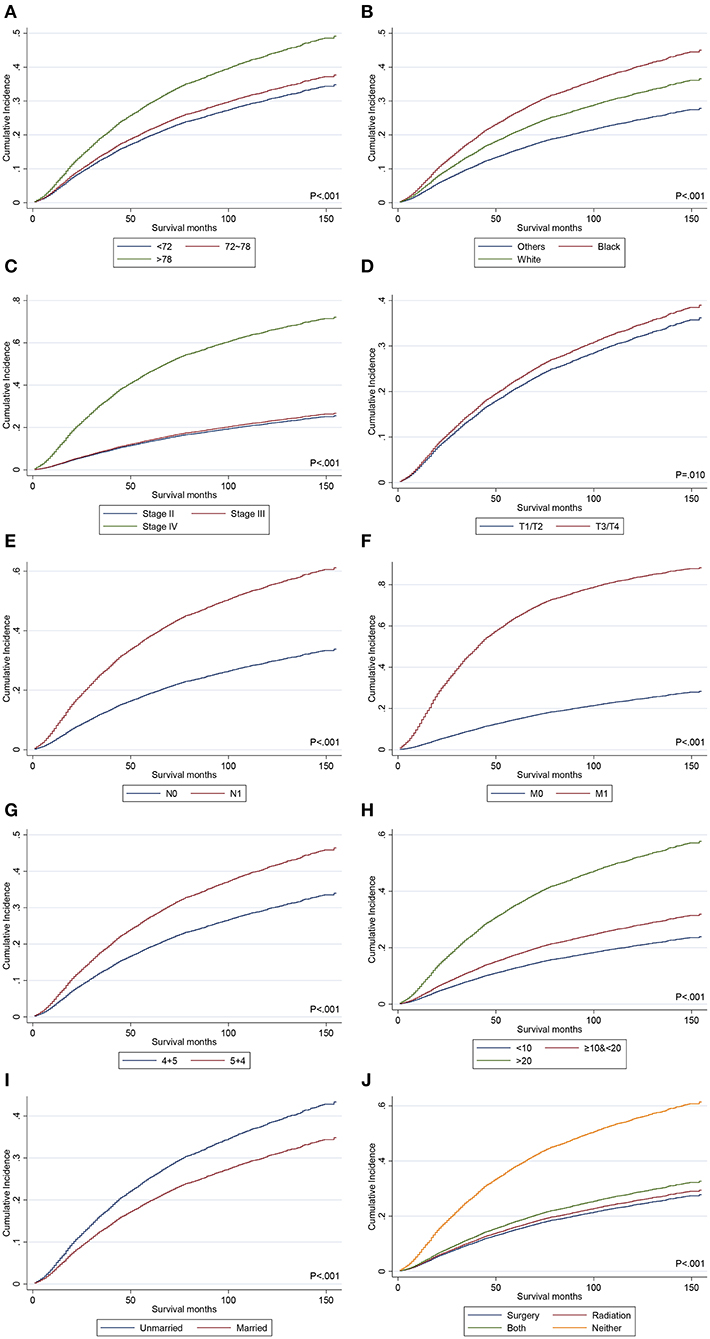
Figure 4. The CIF curves of CSM before PSM. (A) CIF curves for age at diagnosis; (B) CIF curves for race; (C) CIF curves for AJCC stage; (D) CIF curves for AJCC T stage; (E) CIF curves for AJCC N stage; (F) CIF curves for AJCC M stage; (G) CIF curves for Gleason patterns; (H) CIF curves for PSA levels; (I) CIF curves for marital status; (J) CIF curves for treatments. CIF, cumulative incidence function; CSM, cancer-specific mortality; PSM, propensity score-matching; PSA, prostate-specific antigen.
Discussion
The Gleason grading system was widely used since the 1960s (3) to stratify the risk for patients with prostate cancer, which is based on a five-histologic pattern system. GS, not exceeding 10, can be calculated by the sum of the most prevalent histologic pattern and the second most prevalent histologic pattern of prostate specimen. A higher GS indicates a higher degree of malignancy, acting as a robust predictor of progressions, metastasis, and survival. GS 9–10 was categorized as grade group 5 (6). However, different proportions of GP 5 and GP 4, which are 4 + 5 or 5 + 4, can both lead to GS 9. Previous studies reported that the dominant pattern in GS 7 PCa (4 + 3 vs. 3 + 4) provided a stronger power when predicting the prognosis (6, 15, 16). Similarly, this study aimed at comparing the prognosis between the GP 4 + 5 group and the GP 5 + 4 group.
It was reported that an increased proportion of Gleason pattern 5 had a trend to be associated with adverse outcomes (7, 17). There have been several published studies comparing the prognosis between GP 4 + 5 PCa and GP 5 + 4 PCa. Lim et al. published a study including patients with GP 4 + 5 (N = 58) and GP 5 + 4 (N = 22) tumors (8). GP 4 + 5 PCa was associated with a significantly lower percentage of lymph node involvement and a statistically significantly better biochemical recurrence-free survival compared with the biopsy of GP 5 + 4 tumors. Tilki et al. retrospected the follow-up information of 922 men with PCa, of whom, 295 (32.0%) were diagnosed with GP 5 + 4 PCa on biopsy and 627 (68.0%) were diagnosed with GP 4 + 5 on biopsy (9). They got the conclusion that GP 5 + 4 PCa was associated with a poorer CSS and a higher risk of metastasis compared with GP 4 + 5 PCa. Stroup et al. identified 634 patients with GS 8–10 PCa, of whom, 240 (38%) had tumors with a GP 5 component (i.e., GP 3 + 5, GP 5 + 3, GP 4 + 5, GP 5 + 4, or GP 5 + 5) and 394 (62%) had GP 4 + 4 tumors. The two groups showed no significant difference in the risk of biochemical recurrence (BCR). However, they discovered that PCa with GP 5 was associated with greater risks of metastasis, CSM, and ACM (18). Nanda et al. reported that PCa with GS 7 as well as tertiary grade 5 had a similar risk of BCR compared with PCa with GS 9–10. Meanwhile, GS 8 PCa was associated with a lower risk of BCR than GS 9–10 PCa (10). The results suggested that the highest or dominant GP of PCa determined the prognosis more powerfully. Meanwhile, it is worth noting that these mentioned studies were all limited by the sample size. The SEER database recorded follow-up information of millions of patients with cancer across America. There are enough subjects recorded in the SEER database to analyze.
PCa is more common in elderly men, who were under a variety of life-threatening risks other than tumors. Deaths from other causes act as competing events to CSM, whose appearances prevent the events of interest from happening (19). On this occasion, Kaplan–Meier methods and Cox analysis are not suitable for the analysis of CSS. Therefore, in this study, Kaplan–Meier methods and Cox analyses were used to confirm the variables affecting OS and Fine-Gray competing-risk models were used to confirm the variables affecting CSS. In the entire cohort (N = 10,124), PCa of GP 5 + 4 was associated with a poorer OS and CSS compared with PCa of GP 4 + 5. After balancing the baseline clinical variables by a 1:1 ratio of the PSM method, the negative effects of GP 5 + 4 on OS and CSS still existed compared with GP 4 + 5. Our results, consistent with previous studies (8–10, 18), revealed that the dominant GP was more prognostic.
We confirmed eight independent predictors for OS (Table 2) and nine for CSS (Table 3). Older age at diagnosis, black and white Americans, N1 stage, M1 stage, not accepting surgery and radiation therapy, higher PSA levels, GP 5 + 4, and unmarried status were associated with a poorer OS in the entire cohort (N = 10,124). Black and white Americans, N1 stage, M1 stage, not accepting surgery and radiation therapy, higher PSA levels, GP 5 + 4, unmarried status, and higher AJCC T stage predicted worse CSS. The covariates in the models were all easy to confirm or consistent with the currently accepted guidelines.
The PSA values were stratified into three levels, <10, ≥10& <20, and ≥20 ng/ml, consistent with the AJCC Cancer Staging Manual, Eighth Edition (2017) (6). The grouping of age at diagnosis was accomplished by X-tile (14). It is understandable that an older age at diagnosis was associated with a poorer OS in the multivariate Cox analyses. Unexpectedly, age at diagnosis was not an independent predictor for CSS in the multivariate competing-risk model. Considering the fact that age at diagnosis was a powerful independent covariate in the model for OS and previous studies (15, 20, 21), it was finally taken into the model for CSS. AJCC T stage was not included in the model for OS, but it was an independent covariate for CSS. The negative effects of marital status on the prognosis of patients with PCa were confirmed in some published studies (22). As a social exterior factor, an unmarried status was associated with a poorer prognosis in this study, which may be explained that unmarried people were short of social support in general (23). It has been reported that African Americans had a higher incidence and mortality of PCa (1, 24). In this study, ethnicity did work as an independent predictor in the models.
To our knowledge, this study is the first population-based investigation about the prognosis of patients with GS 9 PCa using data from the SEER registries. The results confirmed the negative effects of GP 5 + 4 on the prognoses compared with GP 4 + 5.
There are still some limitations to this study. Firstly, the follow-up information in this study was limited by the records from the SEER database. Some variables about the treatments and disease progression were not recorded detailedly by the SEER registries, such as the PSA values over time, endocrinotherapy, metastatic sites, evidence of local recurrence, and so on. Therefore, it was difficult to determine the BCR and progression-free survival of each patient. In addition, treatments were roughly categorized into four types. Other basic information about the patients, such as hemoglobin levels, body mass index, and smoking history, was hard to confirm. Secondly, there was a lack of external data to validate the negative effects of GP 5 + 4 on the prognoses. We, coauthors, call on urologists to confirm the results in this study with the follow-up data of their own clinical centers. Thirdly, this is a retrospective study. Potential bias still existed even after the PSM or multivariate analysis.
Conclusion
This population-based study reported the negative effects of GP 5 + 4 on the OS and CSS compared with GP 4 + 5, after eliminating the effects from other variables.
Data Availability Statement
Publicly available datasets were analyzed in this study. This data can be found at: https://seer.cancer.gov/data/.
Ethics Statement
Ethical review and approval was not required for the study on human participants in accordance with the local legislation and institutional requirements. Written informed consent for participation was not required for this study in accordance with the national legislation and the institutional requirements.
Author Contributions
JQ and JZ: conceptualization. JQ and DC: data curation and original draft writing. JQ, DC, and ZW: formal analysis. KG: funding acquisition. KG, YG, and LC: methodology, draft review, and revision. KG and LC: project administration and supervision. All authors contributed to the article and approved the submitted version.
Funding
This work was supported by the National Natural Science Foundation of China (Grant No. 81872081) and the Fundamental Research Funds for the Central Universities (Grant No. BMU2018JI002).
Conflict of Interest
The authors declare that the research was conducted in the absence of any commercial or financial relationships that could be construed as a potential conflict of interest.
Acknowledgments
We would like to give our sincere appreciation to all the staff working for the SEER registry and their families for their support and cooperation.
References
1. Rebbeck TR. Prostate cancer genetics: variation by race, ethnicity, and geography. Semin Radiat Oncol. (2017) 27:3–10. doi: 10.1016/j.semradonc.2016.08.002
2. Siegel RL, Miller KD, Jemal A. Cancer statistics, 2020. CA Cancer J Clin. (2020) 70:7–30. doi: 10.3322/caac.21590
4. Tsao C-K, Gray KP, Nakabayashi M, Evan C, Kantoff PW, Huang J, et al. Patients with Biopsy gleason 9 and 10 prostate cancer have significantly worse outcomes compared to patients with gleason 8 disease. J Urol. (2015) 194:91–7. doi: 10.1016/j.juro.2015.01.078
5. Epstein JI. An update of the gleason grading system. J Urol. (2010) 183:433–40. doi: 10.1016/j.juro.2009.10.046
6. Buyyounouski MK, Choyke PL, McKenney JK, Sartor O, Sandler HM, Amin MB, et al. Prostate cancer - major changes in the American joint committee on cancer eighth edition cancer staging manual. CA Cancer J Clin. (2017) 67:245–53. doi: 10.3322/caac.21391
7. Wang C, Kishan AU, Kamrava M, Steinberg ML, King CR. External beam radiation therapy with a brachytherapy boost versus radical prostatectomy in gleason pattern 5 prostate cancer: a population-based cohort study. Int J Radiat Oncol Biol Phys. (2017) 98:1045–52. doi: 10.1016/j.ijrobp.2017.03.040
8. Lim SK, Kim KH, Shin T-Y, Chung BH, Hong SJ, Choi YD, et al. Gleason 5+4 has worse oncological and pathological outcomes compared with gleason 4+5: significance of gleason 5 pattern. Ann Surg Oncol. (2013) 20:3127–32. doi: 10.1245/s10434-013-2996-4
9. Tilki D, Würnschimmel C, Preisser F, Graefen M, Huland H, Mandel P, et al. The significance of primary biopsy gleason 5 in patients with grade group 5 prostate cancer. Eur Urol Focus. (2020) 6:255–8. doi: 10.1016/j.euf.2020.01.008
10. Nanda A, Chen M-H, Renshaw AA, D'Amico AV. Gleason pattern 5 prostate cancer: further stratification of patients with high-risk disease and implications for future randomized trials. Int J Radiat Oncol Biol Phys. (2009) 74:1419–23. doi: 10.1016/j.ijrobp.2008.10.027
11. Austin PC, Lee DS, Fine JP. Introduction to the Analysis of survival data in the presence of competing risks. Circulation. (2016) 133:601–9. doi: 10.1161/CIRCULATIONAHA.115.017719
12. Boffa DJ, Rosen JE, Mallin K, Loomis A, Gay G, Palis B, et al. Using the national cancer database for outcomes research: a review. JAMA Oncol. (2017) 3:1722–8. doi: 10.1001/jamaoncol.2016.6905
13. National Cancer Institute Surveillance Epidemiology End Results Prostate-Specific Antigen Working Group, Adamo MP, Boten JA, Coyle LM. Validation of prostate-specific antigen laboratory values recorded in Surveillance, Epidemiology, and End Results registries. Cancer. (2017) 123:697–703. doi: 10.1002/cncr.30401
14. Camp RL, Dolled-Filhart M, Rimm DL. X-tile: a new bio-informatics tool for biomarker assessment and outcome-based cut-point optimization. Clin Cancer Res. (2004) 10:7252–9. doi: 10.1158/1078-0432.CCR-04-0713
15. Zhu X, Gou X, Zhou M. Nomograms Predict survival advantages of gleason score 3+4 over 4+3 for prostate cancer: a SEER-based study. Front Oncol. (2019) 9:646. doi: 10.3389/fonc.2019.00646
16. Pierorazio PM, Walsh PC, Partin AW, Epstein JI. Prognostic Gleason grade grouping: data based on the modified Gleason scoring system. BJU Int. (2013) 111:753–60. doi: 10.1111/j.1464-410X.2012.11611.x
17. Egevad L, Granfors T, Karlberg L, Bergh A, Stattin P. Percent gleason grade 4/5 as prognostic factor in prostate cancer diagnosed at transurethral resection. J Urol. (2002) 168:509–13. doi: 10.1097/00005392-200208000-00023
18. Stroup SP, Moreira DM, Chen Z, Howard L, Berger JH, Terris MK, et al. Biopsy detected gleason pattern 5 is associated with recurrence, metastasis and mortality in a cohort of men with high risk prostate cancer. J Urol. (2017) 198:1309–15. doi: 10.1016/j.juro.2017.07.009
19. Dignam JJ, Kocherginsky MN. Choice and interpretation of statistical tests used when competing risks are present. J Clin Oncol. (2008) 26:4027–34. doi: 10.1200/JCO.2007.12.9866
20. Gakis G, Boorjian SA, Briganti A, Joniau S, Karazanashvili G, Karnes RJ, et al. The role of radical prostatectomy and lymph node dissection in lymph node-positive prostate cancer: a systematic review of the literature. Eur Urol. (2014) 66:191–9. doi: 10.1016/j.eururo.2013.05.033
21. Hou G, Zheng Y, Wei D, Li X, Wang F, Tian J, et al. Development and validation of a SEER-based prognostic nomogram for patients with bone metastatic prostate cancer. Medicine. (2019) 98:e17197. doi: 10.1097/MD.0000000000017197
22. Huang TB, Zhou GC, Dong CP, Wang LP, Luan Y, Ye JT, et al. Marital status independently predicts prostate cancer survival in men who underwent radical prostatectomy: an analysis of 95,846 individuals. Oncol Lett. (2018) 15:4737–44. doi: 10.3892/ol.2018.7964
23. Aizer AA, Chen M-H, McCarthy EP, Mendu ML, Koo S, Wilhite TJ, et al. Marital status and survival in patients with cancer. J Clin Oncol. (2013) 31:3869–76. doi: 10.1200/JCO.2013.49.6489
Keywords: Gleason score, prostate cancer, all cause mortality, cancer specific mortality, Gleason pattern
Citation: Qiu J, Cai D, Wang Z, Zhou J, Gong Y, Cai L and Gong K (2021) Prognostic Models for Patients With Gleason Score 9 Prostate Cancer: A Population-Based Study. Front. Oncol. 11:633312. doi: 10.3389/fonc.2021.633312
Received: 25 November 2020; Accepted: 15 February 2021;
Published: 26 April 2021.
Edited by:
Jonathan Evan Shoag, University Hospitals of Cleveland, United StatesReviewed by:
Jianbo Li, Case Western Reserve University, United StatesAmar U. Kishan, University of California, Los Angeles, United States
Copyright © 2021 Qiu, Cai, Wang, Zhou, Gong, Cai and Gong. This is an open-access article distributed under the terms of the Creative Commons Attribution License (CC BY). The use, distribution or reproduction in other forums is permitted, provided the original author(s) and the copyright owner(s) are credited and that the original publication in this journal is cited, in accordance with accepted academic practice. No use, distribution or reproduction is permitted which does not comply with these terms.
*Correspondence: Kan Gong, Z29uZ2thbl9wa3VAMTI2LmNvbQ==
 Jianhui Qiu
 Desheng Cai1,2,3
 Jingcheng Zhou
 Yanqing Gong
 Kan Gong